Article

Biofuels for Maritime Transportation: A Spatial, Techno-Economic, and Logistic Analysis in Brazil, Europe, South Africa, and the USA

by
Francielle Carvalho
1,*,
Joana Portugal-Pereira
1,
Martin Junginger
2 and
Alexandre Szklo
1
1
Centro de Tecnologia, Energy Planning Program, Graduate School of Engineering, Federal University of Rio de Janeiro, Rio de Janeiro 21941-594, Brazil
2
Copernicus Institute of Sustainable Development, Utrecht University, 3584 CS Utrecht, The Netherlands
*
Author to whom correspondence should be addressed.
Energies 2021, 14(16), 4980; https://doi.org/10.3390/en14164980
Submission received: 29 June 2021 / Revised: 5 August 2021 / Accepted: 9 August 2021 / Published: 13 August 2021

Abstract

:
Low or zero carbon fuels are crucial for maritime transportation decarbonization goals. This paper assesses potential localities for maritime biofuels (biobunkers) production in Brazil, Europe, South Africa, and United States considering geographical, logistic, and economic aspects. This assessment combines georeferenced and techno-economic analyses to identify suitable fuel production hotspots based on not only plant performance and costs but also on logistic integration and biomass seasonality. Five technology pathways were considered: Straight vegetable Oils (SVO), Hydrotreated Vegetable Oils (HVO), Fischer–Tropsch Biomass-to-liquids (FT-BTL), Alcohol oligomerization to middle distillates (ATD), and Hydrotreated Pyrolysis Oil (HDPO). Findings reveal that biomass concentration in Brazil makes it the region with highest biobunker potential, which are mostly close to coastal areas and surpasses regional demand. Although other regions registered more limited potentials, hotspots proximity to ports would enable fossil fuel replacements in these areas. For all cases, biobunker costs (USD 21–104/GJ) are higher than conventional marine fuels prices (USD 11–17/GJ). Only 15% of the hotspots’ carbon prices that would allow its competitiveness are lower than USD 100/tCO2. Alternatives to incentivize biobunker production would be, first, to establish mandatory fuel blends and second, to join forces with other sectors that would be benefited from the co-production of advanced biofuels.

1. Introduction

The ocean-going ships consume a large amount of petroleum derived fuels, and the maritime sector is responsible for over 3% of anthropogenic GHG emissions [1]. In 2018, the International Maritime Organization (IMO) pledged to reduce by at least 50% annual GHG emissions from international shipping by 2050 compared to 2008 levels. Together with optimized operations and energy efficiency, alternative low or zero carbon fuels are crucial for maritime transportation [2,3,4].
Biofuels represent an important option to simultaneously reduce fossil fuel dependence and GHG and air pollutants emissions. The less strict specifications and higher flexibility in terms of fuel supply (than road and aviation sector, for example), represent an opportunity to produce maritime biofuels (hereafter biobunker) [5]. In addition, in view of the sector’s well established operational structure and long lifespan of ships, drop-in fuels are the most feasible alternatives, at least in the mid-term [4,5,6].
Different biobunkers can be considered to the maritime transport sector. For diesel engines, biodiesel, straight vegetable oils (SVO), hydrotreated vegetable oils (HVO), dimethyl-ether (DME), and FT-diesel (or BTL) are considered the front-runner options (ETIP, 2017). For Otto or dual fuel engines, the options are liquefied biomethane (Bio-LNG), liquefied biogas (LBG), and biomethanol [7,8,9].
Besides their benefits, major concerns regarding biofuels are associated with costs, supply guarantee, and sustainability [10]. The performance of most biofuels in ship engines is not well understood yet and thus, a significant amount of testing and standardization is needed to develop drop-in biofuels appropriately [5]. Additionally, competition for resources with food production and with other sectors (e.g., aviation) increased water demand, and land use changes may compromise their development [11].
Some regions may emerge as potential biobunker producers given their availability of resources, intense port activities, and/or location along major sea routes. Brazil and the United States (US) are among the world’s major agricultural producers and, therefore, have significant biomass residues potential. Together with the European Union (EU), these countries are the major biofuels producers and consumers in the world (OECD-FAO, 2020). The EU and US host the major world ports outside Asia and are one of the biggest trade centres in the world. South Africa has limited bioenergy production given its low primary productivity, constrained by rainfall, and intensified by inter-annual variability [12,13]. Notwithstanding, South Africa’s strategic location along sea routes that connect Asia to Occident may encourage local biobunker production [14]. Thus, the identification of biobunker potential in such regions is useful to prospect major players and design tailored solutions for shipping decarbonization.
Studies already performed in the literature discuss alternative biofuels to reduce the maritime transport sector emissions. Firstly, [15,16,17] performed a technical overview of different alternatives. References [18,19,20,21,22] focused on emissions mitigation potential and [4,23,24,25] explored the potential and barriers of maritime biofuels. Reference [26] developed an integrated screening model to compare the technological, economic, and environmental performance of drop-in marine biofuel supply chains. Furthermore, [10] performed a techno-economic analysis of zero-carbon fuels while [8] developed a decision support analysis to choose sustainable marine fuels. Finally, [9] provided an Integrated Assessment Model perspective of the production and distribution of alternative marine fuels in Brazilian ports.
While relevant, previous studies have focused on identifying the potentials, benefits, and constraints for alternative marine fuels, overlooking important logistic constrains for their development. To develop novel fuels, it is necessary to assess the logistic integration of their production chains, which links feedstock availability and seasonal variability with fuel consumption sites. To fill this gap, this study performs a georeferenced analysis to identify potential localities for biobunker fuels production, logistic supply, and costs in Brazil, Europe, South Africa, and United States. Five technology pathways were considered: Straight vegetable Oils (SVO), Hydrotreated Vegetable Oils (HVO), Fischer–Tropsch Biomass-to-liquids (FT-BTL), Alcohol oligomerization to middle distillates (ATD), and Hydrotreated Pyrolysis Oil (HDPO). This study is the first attempt to compare marine biofuel production in different regions of the world regarding their potential, techno-economic, and logistic performance. Results obtained are relevant to identify the regional capabilities that could make some regions potential biobunker fuel suppliers.
This paper is structured as follows: Section 2 presents the methodology of the study that details biomass potential, the georeferenced analysis, and feedstock and fuel production costs estimates. Then, Section 3 details the results of each analysis and Section 4 discusses the main findings. Finally, Section 5 summarizes this paper’s conclusions, limitations, and suggestions for future work.

2. Methodology

The methodology applied was divided into two steps (Figure 1). The first one aims to identify bioenergy hotspots for the implementation of biobunker refineries by the quantification of bioenergy technical potential and a georeferenced analysis. The georeferenced analysis enables the spatial identification of biomass hotspots and is useful to evaluate their proximity to ports, fuel handling infrastructure, and transportation networks in these areas. The second step aims to determine the total biobunker fuel costs, composed by feedstock costs, levelized cost of fuel (LCOF), and fuel transport cost. Together, these assessments aim to identify the regional capabilities, economic implications, and barriers to produce biobunker fuels in each region.

2.1. Feedstock Availability

2.1.1. Brazil

The first step of this study evaluates the technical potential of residual biomass and straight vegetable oils (SVO). The technical potential represents the fraction of theoretical potential available given technological possibilities, logistical restrictions, and competition for non-energy uses. The methodology adopted was based on the indirect quantification of the residues and SVO through a bottom-up analysis (Equations (1) and (2)) and followed the methodology described in [27,28]. Data for agricultural area, crop productivity, and production were obtained for each Brazilian municipality [29,30]. Table 1 summarizes the crops and parameters considered to estimate residues and SVO production potential.
R P j = A i · P i ·   R P R j , i · E S R j · A R j
In which:
  • RPj: Residues technical potential (TJ/year)
  • Ai: Agricultural area (ha)
  • Pi: Crop productivity (kg/ha)
  • RPRj,i: Residue-to-product ratio of residue j produced by crop i (Dimensionless. Mass basis.)
  • ESRj: Environmentally sustainable removal rate of residue j (%)
  • ARj: Availability rate of residue j (%)
O P j = P i · O S R j , i · E E j · L H V j · A O j
In which:
  • OPj: Vegetable oil potential (TJ/year)
  • Pi: Oil crop i production (t/year)
  • OSRj,i: Oil j content in oil crop i (Dimensionless. Mass basis)
  • EEj: Oil j extraction efficiency (%)
  • LHVj: Low heating value of oil j (MJ/kg)
  • AOj: Oil j availability factor (%)

2.1.2. Europe

Europe region in this study includes EU28, Western Balkans, Moldova, Turkey and Ukraine. Biomass residues potentials estimate was based in the S2Biom project [40]. Biomass residues potentials were calculated for each region according to NUTS-3 classification. The nomenclature of territorial units for statistics (NUTS) is a geographical system that divides European Union into hierarchical levels: NUTS-1, NUTS-2, and NUTS-3. In S2Biom project, 3 classes of potential for biomass were considered (Consult Supplementary Material). For the agricultural residues, the ‘User potential’ was selected, while for forest residues, only the primary residues from forestry activities were considered and ‘User defined potential 5’ chosen. Table 2 presents the parameters considered for biomass residues potential estimate in Europe.

2.1.3. South Africa

Estimates for biomass residues potential in South Africa was based on the South Africa Bioenergy Atlas that brings together information about the factors of biomass production, potentials, and yields for a variety of biomass resources for each country province [13]. The Bioenergy Atlas provides information of a variety of biomass residues production. However, a substantial part of agricultural production results from subsistence farming with typically very low yields (<2 tonnes/ha) and residues from some agricultural and forestry activities are already used for low-efficiency energy generation. Then, feedstocks produced by low yield crops or already used in other applications were not considered. Table 3 summarizes the assumptions made for biomass potential estimates in South Africa.

2.1.4. United States (US)

Biomass residues estimates for the United States were obtained in the U.S. BioAtlas from the National Renewable Energy Laboratory (NREL) (Colorado, U.S.) [47], which is based in the methodology of [48]. Potentials were determined for agricultural and forest residues for each US county. Crop residues availabilities were estimated using crop production, residue to product ratio, moisture content, amount of residue left on the field for soil protection and used for grazing, bedding, and other agricultural activities (Table 4).
Forest residue data by county was derived from the USDA Forest Service’s Timber Product Output database [52]. In this category logging residues and other removals were included. Logging residues represent the unused portions of trees cut or killed by logging and left in the woods. Other removals include trees cut or otherwise obtained by cultural operations or land clearings and forest uses not directly linked with round wood product harvests [48].

2.2. Georeferenced Analysis

The quantified biomass technical potential was allocated to the maps of each region. Thus, it was possible to identify, for each regional division (municipalities, counties, or provinces), the yearly biomass technical potential in energy basis. From these vector datasets containing the biomass potential, kernel density maps (or heat maps) were constructed considering a 100 km distance spread. This value represents an optimistic estimate for the transport of biomass, representing twice the distance recommended by Hoffmann et al. as an economically viable distance to transport biomass for energy purposes [28,53]. These maps show the bioenergy distribution beyond the geographical divisions and enables the identification of hotspots (locations with the greatest potential) for each feedstock.
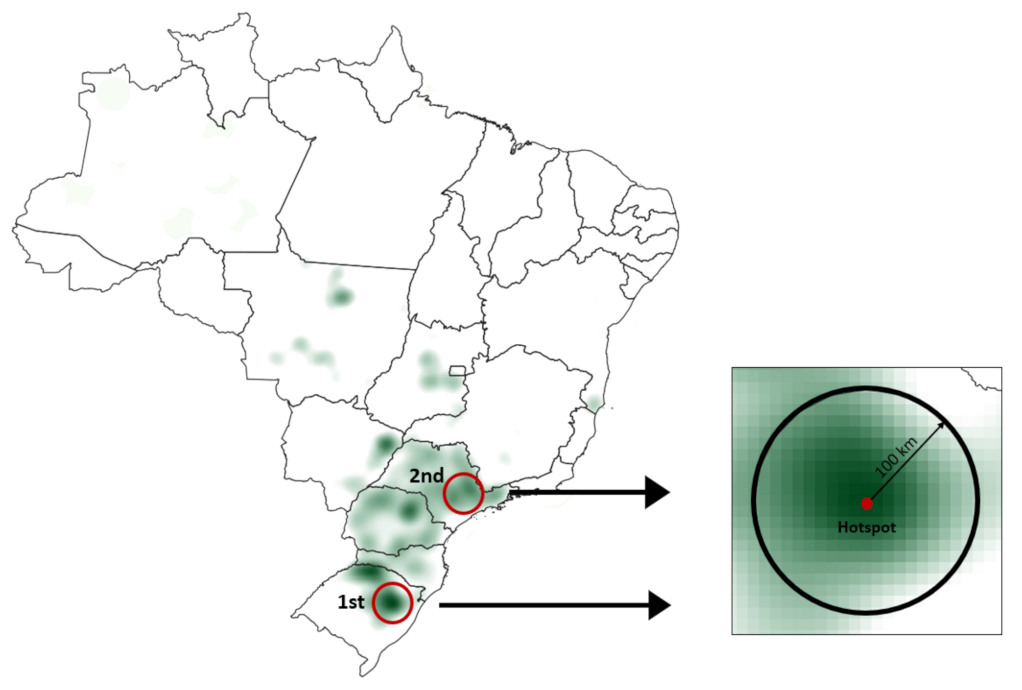
Hotspots’ identification followed a first- and second-best approach according to areas with the highest biomass potential or areas with considerable potential near coastline or ports. Crops with very low potential were discarded. The potential in each hotspot was defined by the sum of potential of the regional divisions contained within a 100 km radius (Figure 2). The distances between each regional division inside the 100 km area and the hotspot were also determined.
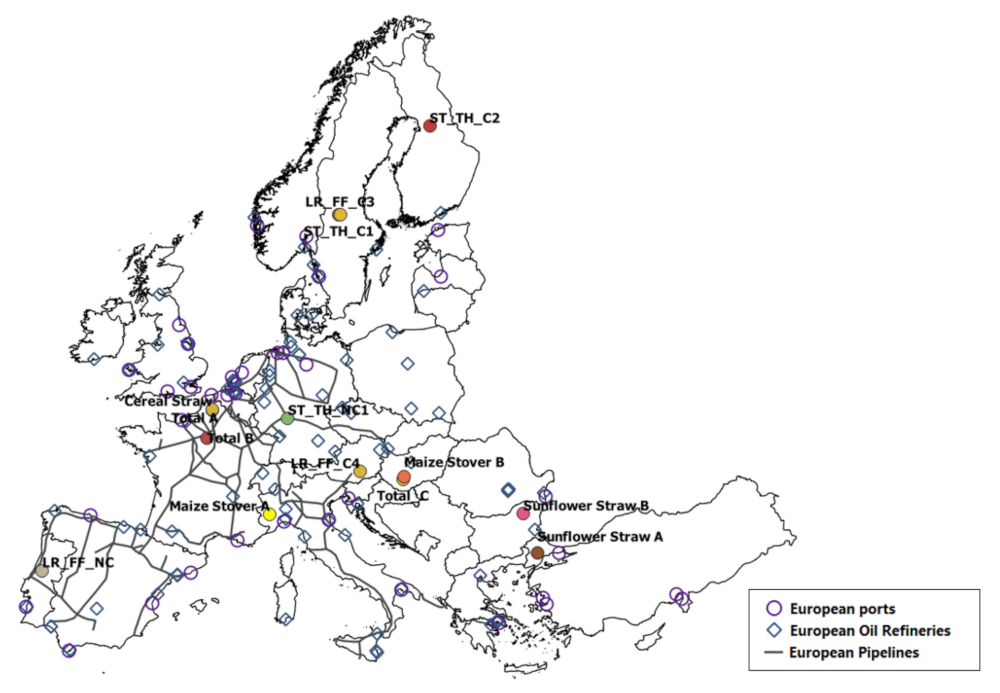
Finally, infrastructure for feedstock and fuel logistics, such as oil and vegetable oil refineries and ports were also identified (Figure 3). Distances among the hotspots and the nearest ports were determined. Maps with biomass potential and hotspots for all regions are detailed in the Supplementary Material (Section 1).

2.3. Feedstock Cost Estimation

Feedstock costs is composed of biomass collection costs and transportation costs (Equation (3)). For the SVO, feedstock cost is composed of current SVO prices plus its transportation costs from the nearest SVO refinery to hotspots. Road transport was considered for feedstock transportation and a tortuosity factor of 1.27 applied [54]. Collection and transport costs considered to estimate feedstock costs for all regions can be consulted in the Supplementary Material.
C f = C c b + C t b · d · t f   o r   C f = P S V O + C t o · d · t f
where:
  • Cf: Feedstock costs (USD/GJ)
  • Ccb: Biomass collection costs (USD/GJ)
  • Ctb: Biomass transport costs (USD/GJ.km)
  • PSVO: Vegetable oil prices (USD/GJ)
  • Cto: Vegetable oil transport costs (USD/GJ.km)
  • d: Distances between each regional division inside the 100 km area and the hotspot (km)
  • tf: tortuosity factor (−)

2.4. Techno-Economic Pathways to Produce Maritime Biofuels

Five technology pathways to produce maritime biofuels were selected: SVO and HVO (only applicable for Brazil), FT-BTL, HDPO, and ATD. SVO are suitable fuel options for diesel engines and are feedstocks for HVO production. These fuels were only considered for Brazil given the country significant production and potential application in maritime sector [9]. Even though the majority of HVO facilities in the world are located in Europe and US, most of them process residual oils. In addition, European REDII banned vegetable oil use for biofuel production [55,56]. South Africa oil crop production reported in South Africa Bioenergy Atlas is directed to subsistence. In this sense, SVO or HVO production were not considered for these regions.
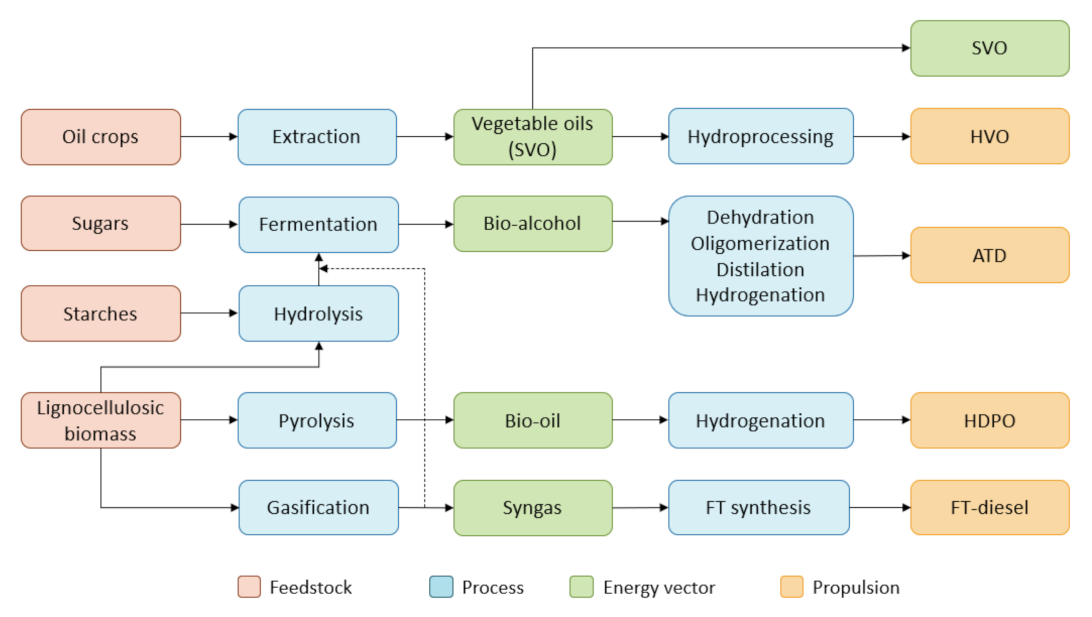
For FT-BTL route, two logistic configurations were considered to evaluate the cost benefits of biomass pre-treatment prior to final conversion to fuel. Process and technologies for each pathway have been extensively discussed in the literature [2,5,39,57,58,59,60,61,62,63,64,65,66,67,68,69,70,71,72,73,74,75]. It is worth mentioning that HVO, ATD, and FT are in theory full drop-in fuels, while SVO and HDPO (depending on the quality of finished fuel) would compose fuel blends [24,69]. Fuel production yields for each technology can be consulted in the Supplementary Material. Figure 4 summarizes the pathways considered in this study.
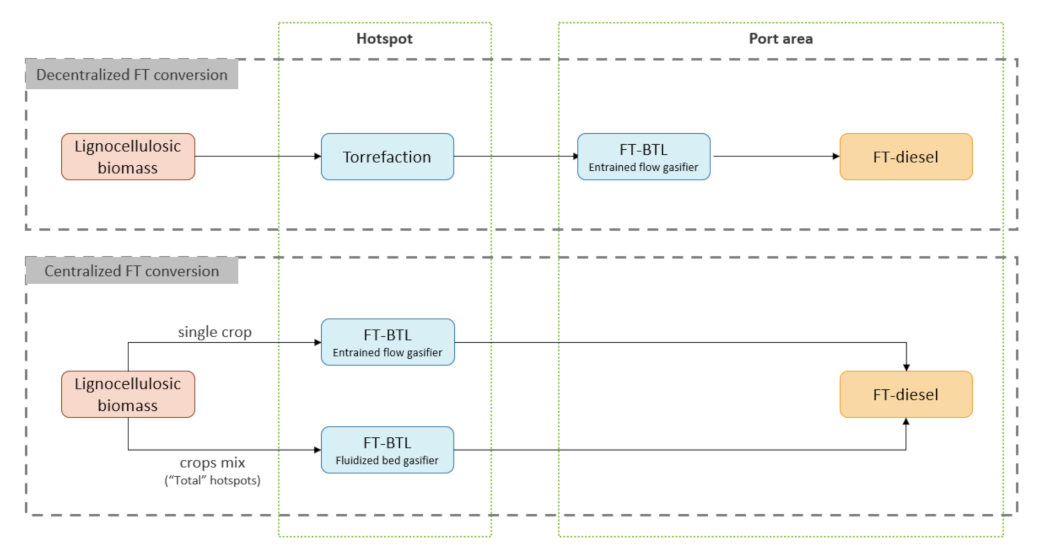
Biobunker production from FT-BTL route was evaluated according to two configurations. In the centralized configuration, biomass is converted into biobunker, without being previously pre-treated, while in the decentralized configuration, biomass is torrefied and transported to nearest port areas, where its conversion to biobunker takes place (Figure 5). Two gasifier types were considered. Fluidized bed gasifiers (FBG) and entrained flow gasifiers (EFG) are pointed as the most promising candidates for biofuels production. In this study, FBG were attributed to the hotspots formed by a mix of residues (‘total hotspots’), given their flexibility in terms of feedstock and suitability for larger scales. EFG were chosen for the decentralized configuration (torrefied biomass feed) and for single crop hotspots in view of their cost-effectiveness for small scales and tighter feed specifications [76].
The techno-economic analysis focused on determining the levelized cost of fuel (LCOF), based on costs and revenues related to each production route. For each route, the costs considered were capital costs (CAPEX) and fixed and variable operational and maintenance costs (FOM and VOM, while revenues represent the sales of co-products (Rcop)). LCOF are compared to conventional marine fuels prices.
Equipment costs informed in the literature refer to different production scales than the hotspots potentials. Thus, the number of feasible plants in each hotspot was determined when their potentials were greater than twice the reference scales. Otherwise, an adjustment was made according to Equation (4).
C h o t s p o t = C r e f · S h o t s p o t S r e f F E
where:
  • Chotspot: Equipment costs in the hotspot scale (USD)
  • Cref: Equipment costs in the reference plant scale (USD)
  • Shotspot: Scale in the hotspot plant
  • Sref: Scale in the reference plant
  • FE: Escalation factor
Reference costs were also adjusted to 2018 dollars using the Chemical Engineering Plant Cost Index (CEPCI) (Equation (5)).
C 2018 = C t · C E P C I 2018 C E P C I t
where:
  • C2018: Costs adjusted to 2018 values (USD)
  • Ct: Costs in the reference year (USD)
  • CEPCI2018: CEPCI value for 2018
  • CEPCIt: CEPCI value the reference year
For each region different costs with inputs were considered and regional labour cost factors were determined. Regarding co-products, international spot prices were considered. Prices and factors considered to estimate inputs costs and co-products revenues can be consulted in the Supplementary Material.
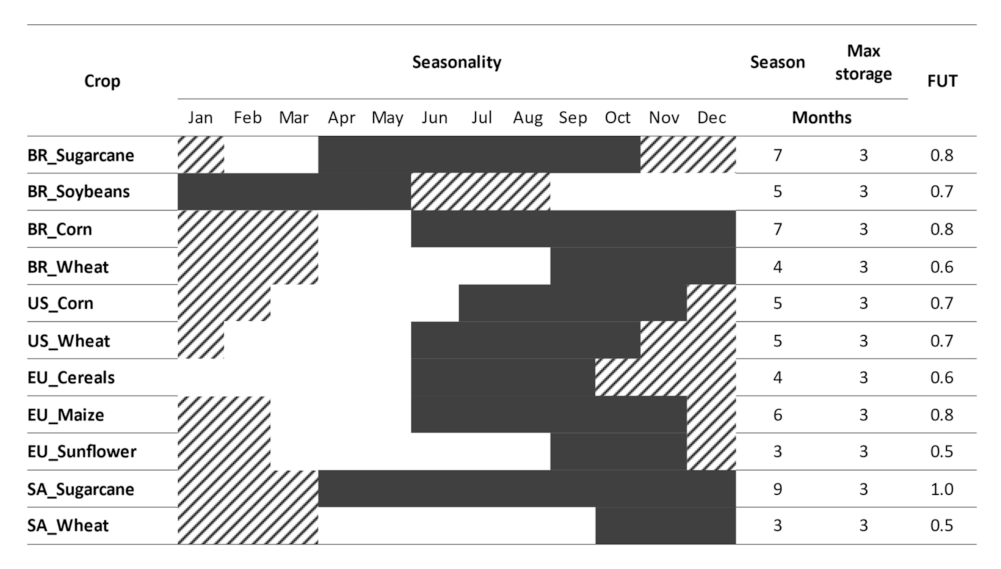
In addition, biomass seasonality reduces its availability throughout the year and, consequently, the plant utilization factor (FUT). Thus, different FUTs were considered according to crops seasonality and considering a short-time residues storage (biomass residues storage in closed warehouses up to 3 months leads to negligible losses (3%) and increases plant utilization factor [77,78,79,80]). Figure 6 shows the seasonality, storage times, and FUT considered for each crop. Forest residues are not seasonal; therefore, a FUT of 0.85 was considered. Hotspots for total residues have feedstock available all over the year, given the biomass seasonal complementarity, and a FUT of 0.9 was considered.
Finally, LCOF is then given by Equation (6). For all technologies, a horizon of 30 years [10] was considered with a discount rate of 7% [81].
L C O F = i = 0 n C A P E X i + V O M i + F O M i R c o p i i = 1 n P b i o b u n k e r 1 + r i  
where:
  • n: Plant lifetime (30 years)
  • Pbiobunker: Biobunker production (GJ)
  • r: Discount rate (%)

2.5. Total Biobunker Costs

The final step of the methodology aimed to estimate the total biobunker costs, composed by the feedstock (Section 2.3), LCOF (Section 2.4), and transportation costs. Transportation costs represent the fuel or biochar transport from the hotspots to the nearest port. On short distances, truck transport is the cheapest and most flexible option, benefitting from low capital costs [82,83]. Thus, for distances smaller than 80 km, road transport is the preferable mode. Otherwise, the choice of transport mode was based on the existing road, rail, inland waterway, or pipeline infrastructure evaluated in the georeferenced analysis (Section 2.2). Tortuosity factors were considered for each mode [54,84,85]. Transport cost considered for each mode can be consulted in the Supplementary Material.

3. Results

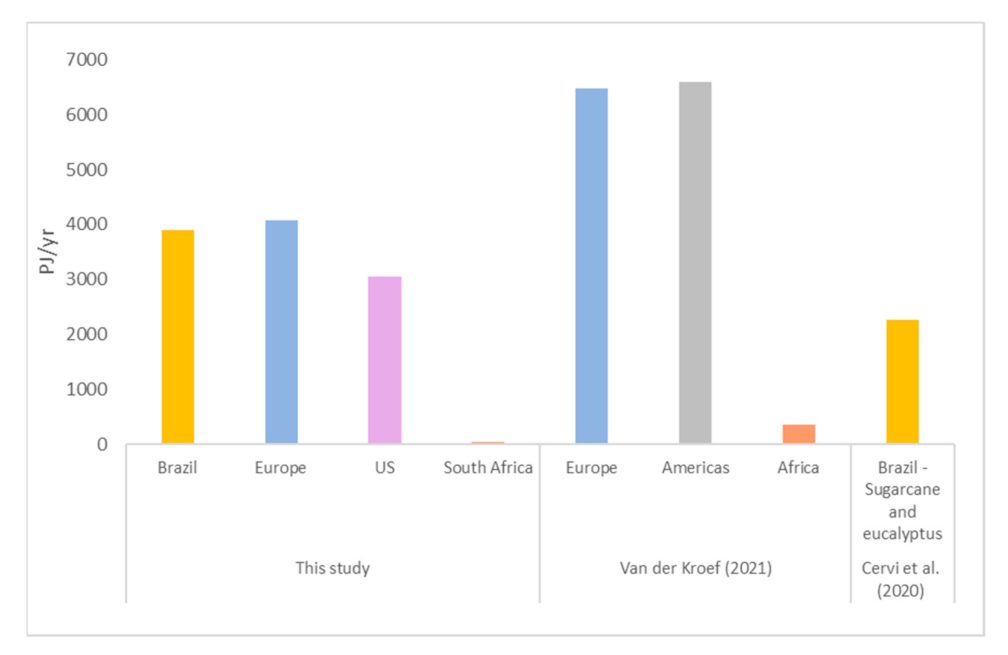
The estimated technical potential of biomass residues totalled 45 PJ/year in South Africa, 3050 PJ/year in the US, 3903 PJ/year in Brazil, and 4083 PJ/year in Europe. Results were compared with literature (Figure 7).
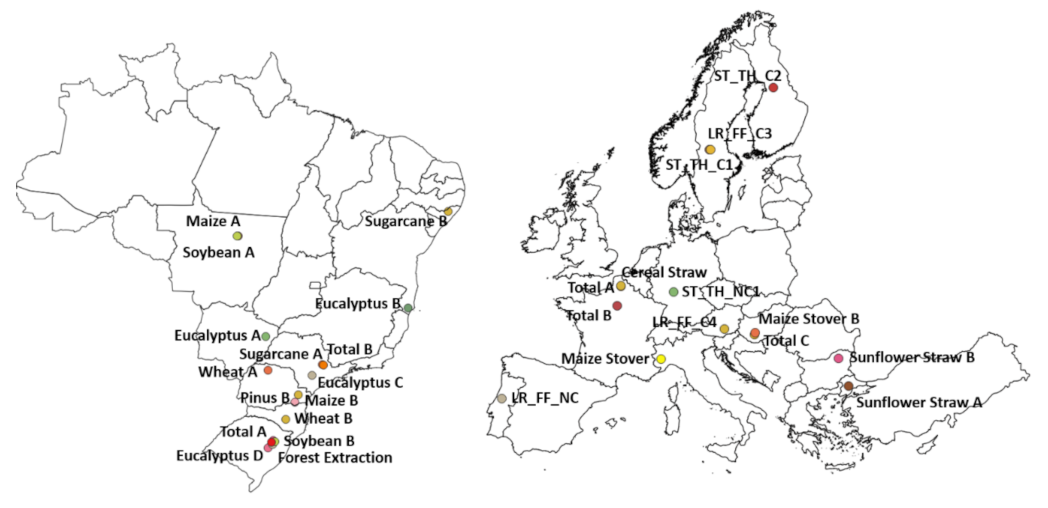
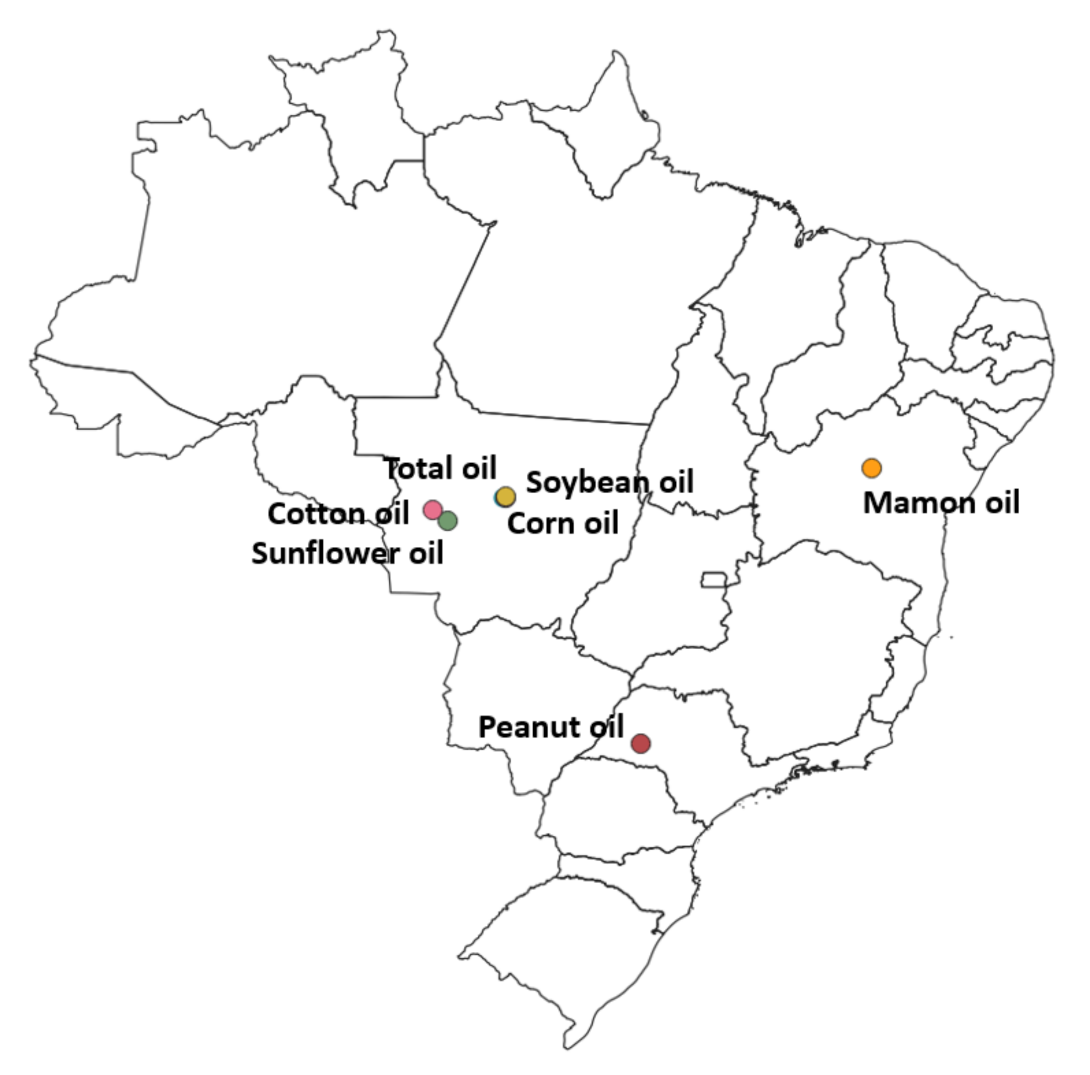
In addition, SVO total technical potential in Brazil totalized approximately 1000 PJ/year. Maps with biomass potential in each regional division were constructed (see Supplementary Material) and kernel maps enabled the evaluation of bioenergy dispersion and the identification of hotspots in each region (Figure 8, Figure 9 and Figure 10).
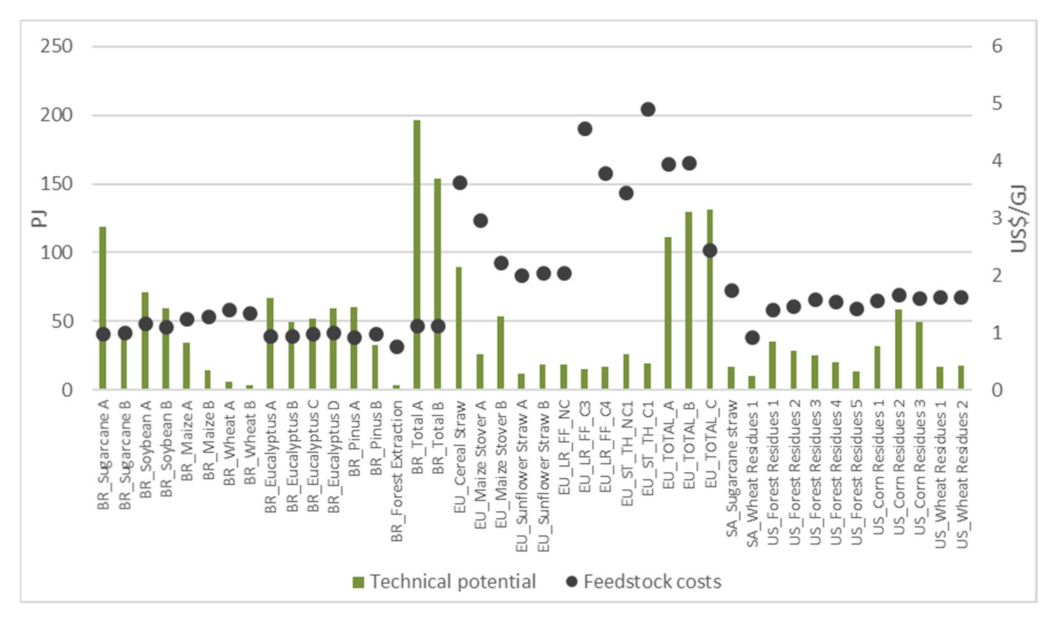
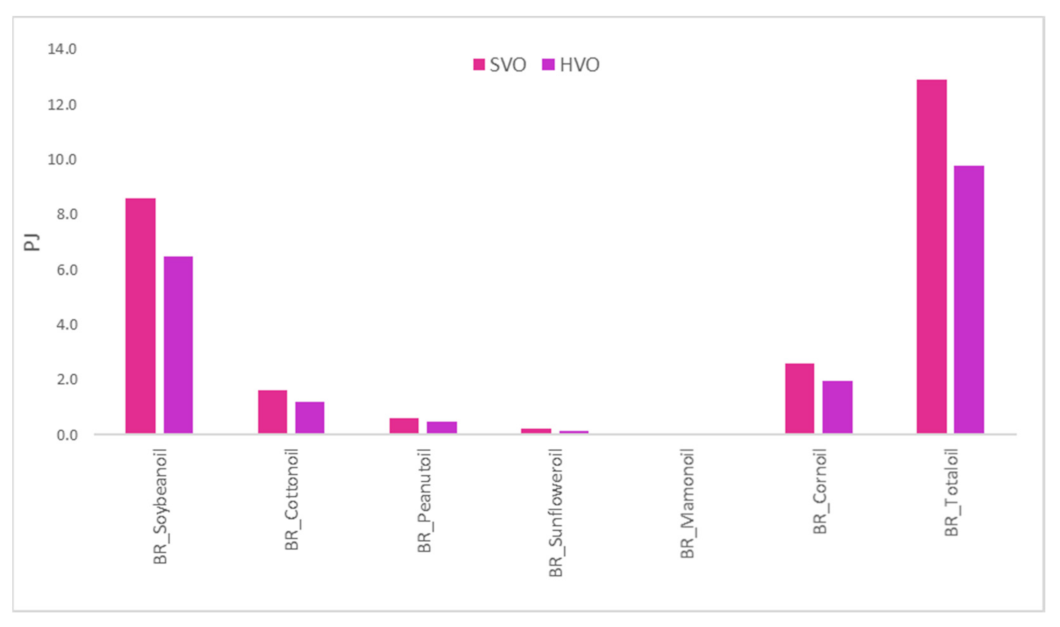
Figure 11 compares the potentials and average feedstock costs for biomass residues hotspots and Figure 12 presents SVO hotspots potentials and costs. In Brazil, sugarcane, soybeans, and eucalyptus registered the highest potential. ‘BR_Total A’ hotspot includes residues from all crops and presents the highest potential among all regions (almost 200 PJ/year), followed by ‘BR_Total B’ (nearly 150 PJ/year) that considers residues from soybeans and maize. In Europe, cereal straw and maize stover residues registered the highest potentials (89.9 PJ/year and 53.2 PJ/year, respectively). In the US, corn residues registered the highest potentials (around 50 PJ/year), while South African hotspots potentials are among the lowest ones (inferior to 20 PJ/year). SVO potentials are well below crop residues, even when considering the total SVO hotspot (13 PJ/year). Soybean oil hotspot registered the highest potential (8.6 PJ/year) and mamon and sunflower oil potentials are almost inexpressive. Regarding feedstock costs, Brazil and US are the regions with lower estimates (from USD 0.8/GJ to USD 1.7/GJ), while values for Europe are far higher (from USD 2.0/GJ to USD 5.0/GJ). Feedstock costs for SVO represent its market prices ranging from USD 20/GJ to USD 45/GJ, much higher than residues costs.
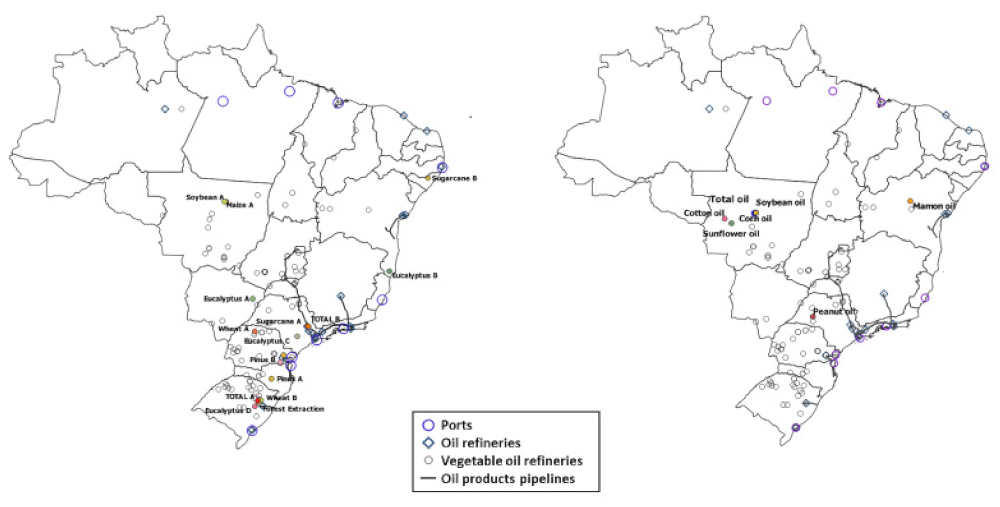
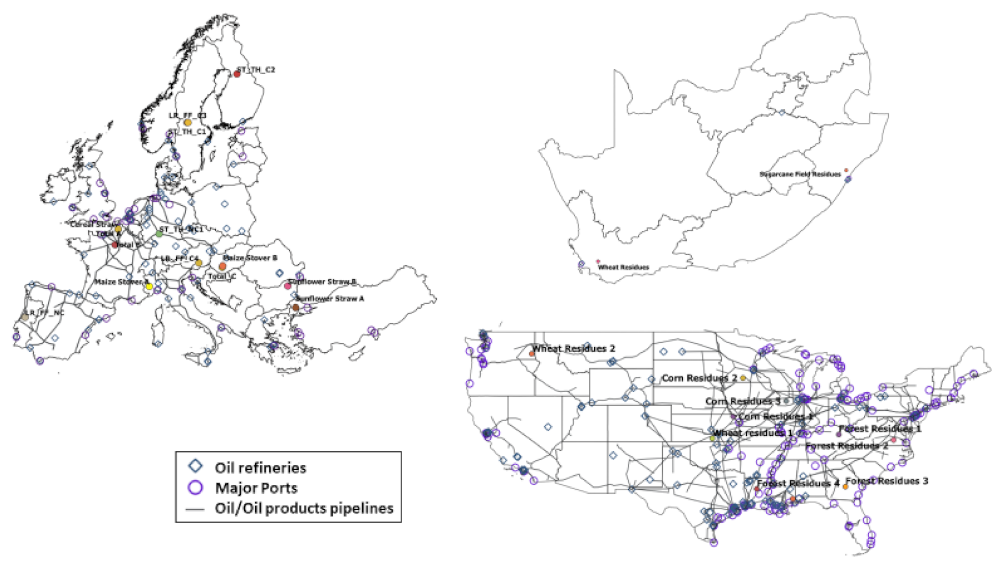
Maps were developed including the hotspots for all regions with associated infrastructure (Figure 13 and Figure 14) (for a better visualization of the maps, consult the Supplementary Material). In Brazil, most hotspots are located near oil refineries and ports. However, for Soybean A, Maize A, and almost all SVO, hotspots are in countryside areas and therefore, far away from ports. The same is observed in Europe and the US, except for hotspots ‘EU_ST_TH_C2’ and ‘US_W2’. Finally, in South Africa, the hotspots are localized very close to ports and oil refineries. The distances between the hotspots and the nearest port were determined and can be consulted in the Supplementary Material.

3.1. Levelized Costs of Fuel

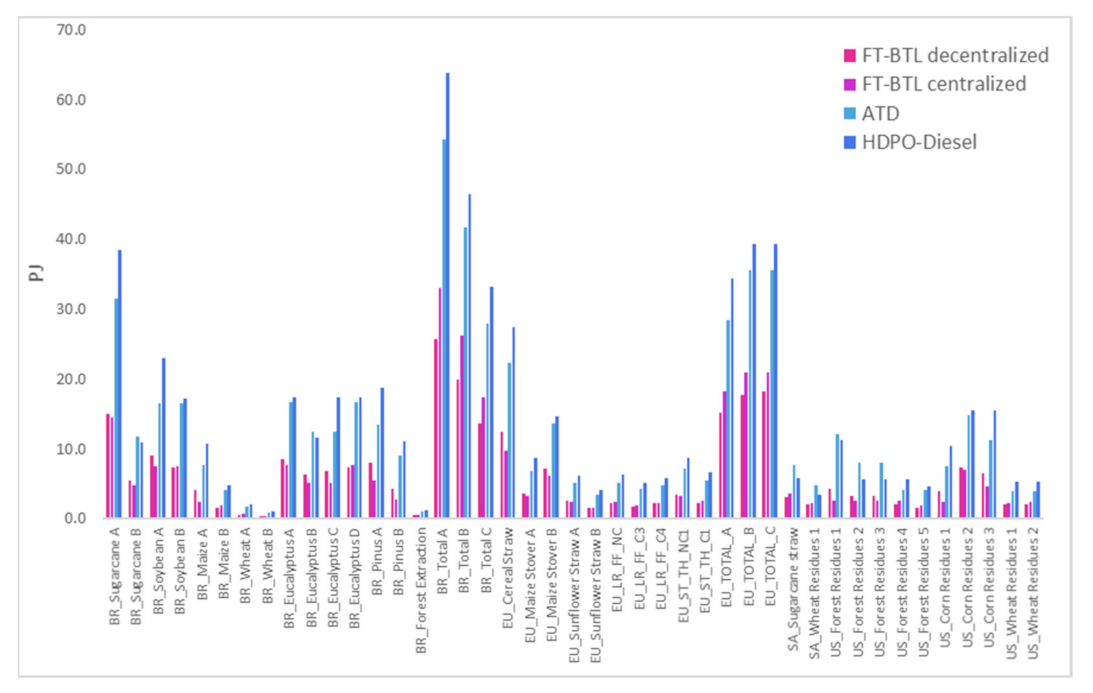
The number of plants in each hotspot was determined according to the reference capacities (see Section 2.4). This number for each hotspot can be consulted in the Supplementary Material. Figure 15 and Figure 16 show the fuel production in the hotspots.
Adding up the fuel production in the ‘single-crop’ hotspots, the regional biobunker supply was identified (Figure 17). Brazil is the major producer, followed by Europe and the United States (up to 240, 93.5 and 84.4 PJ fuel/year, respectively). SVO and HVO production levels are much lower (up to 13.0 and 10 PJ/year, respectively). Fuel production levels were compared to regional marine fuels demand (Figure 17). See the Supplementary Material to consult fuel production potentials and regional demands.
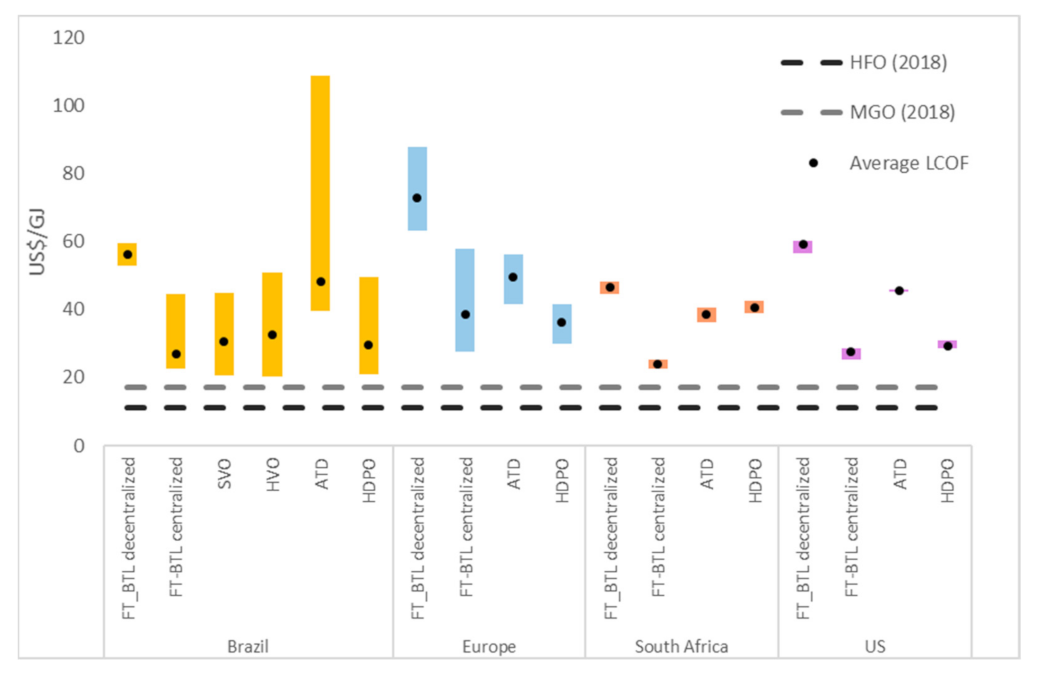
The LCOF vary widely depending on the region and fuel production technology (Figure 18 and Figure 19). For all hotspots, the LCOF was higher than HFO and MGO prices in 2018. In Brazil, a wide cost range is observed for all technologies, especially ATD (up to USD 104/GJ). Highest ATD LCOFs were observed to hotspots with lower potentials (forest extraction—3.4 PJ/year and wheat B—3.1 PJ/year). FT-BTL-centralized, HVO, and HDPO stands as the lowest cost options. In Europe, a wide cost range is also observed, and all pathways are in a range of USD 30–58/GJ, except for FT-BTL-decentralized (above USD 60/GJ). In South Africa, FT-BTL-centralized is the lowest cost technology (USD 23–25/GJ). Finally, in the US, little variation in LCOF is observed for each pathway. FT-BTL-centralized and HDPO are the least cost alternatives (USD 25–31/GJ), while FT-BTL-decentralized is the highest (around USD 60/GJ). Notable difference is observed comparing FT-decentralized and FT-centralized LCOFs. It is explained by the lower base capacity considered for FT-decentralized plants. Thus, down scale is required for gasification and FT processes, which increase fuel costs.
LCOF breakdown for each technology and region is shown in Figure 20. LCOF for residue-based technologies are mostly influenced by CAPEX (from 30% to 40%) and benefit from co-products revenues. For FT-BTL-decentralized, VOM costs are mostly associated with power purchase for torrefaction. In the FT-BTL-centralized with EF gasification, biomass has a significant contribution to LCOF. However, with FB gasification, FOM is more expressive. In ATD, FOM costs are related to expenses with consumables (e.g., catalysts) and maintenance. For HDPO, FOM costs are associated with catalysts and maintenance expenses, while VOM is dominated by natural gas purchase for hydrogen production. For HVO pathway, results totally differ. HVO costs are highly influenced by vegetable oils prices (USD 18.9/GJ to USD 44.6/GJ) which are internationally traded commodities whose prices are higher than MGO’s (USD 21.2/GJ). Biomass contribution to LCOF is more significant in FT-centralized (EF) among all technologies and in Europe and the US.
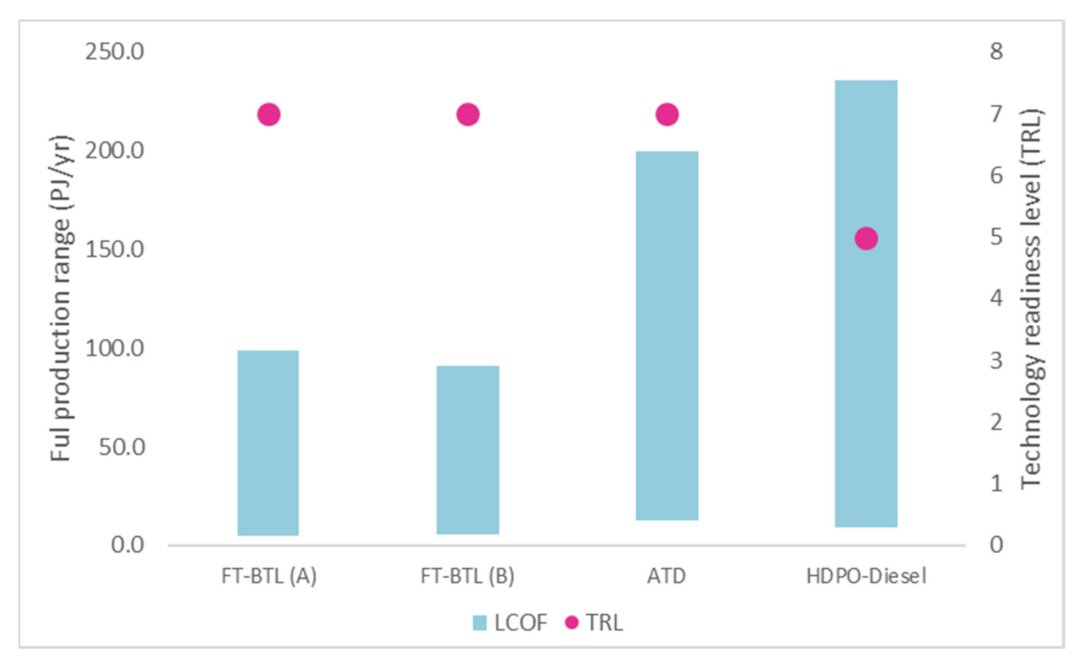
Besides the different fuel potentials observed for each technology, it is important to consider the technology readiness of each one. Some biofuel production routes considered in this study have already achieved the commercialization stage (SVO and HVO), while others are in the validation stage. Figure 21 compares the fuel production levels with the technology maturity of each pathway.

3.2. Total Biobunker Costs

Total biobunker cost is composed by the LCOF and fuel or biochar transportation costs. Transportation cost depends on transport mode suitable for each hotspot (see Supplementary Material). Figure 22 shows the total biobunker cost ranges for each technology and region, divided into LCOF and transport costs. Results show that the final transport from biofuel production plant to port represents a small fraction of total costs. However, in the US, transport costs may represent a considerable increase to LCOF (up to USD 5/GJ) mainly due to long transportation distances from some hotspots to the nearest port (>350 km).

4. Discussion

The total technical potential of biomass residues varies from 45 to 4085 PJ/year. Europe registered the highest potential, followed by Brazil, U.S., and South Africa and results were compared with the literature (Figure 7). However, in the defined hotspots, Brazil stands out as the region with the highest potentials (see Figure 11). Highest feedstock costs were observed in Europe (up to USD 4.9/GJ), mostly given the high biomass collection costs, while Brazil and U.S registered the lowest values (up to USD 1.4/GJ and USD 1.7/GJ, respectively). Feedstock costs for SVO were far higher (from USD 20.6–45.0/GJ), as they are commodities whose prices are higher than marine fuels (USD 11.0–18.0/GJ).
Considering the regional biobunker supply, Brazil is the major producer, followed by Europe and the United States (up to 240, 93.5 and 84.4 PJ fuel/year, respectively). In Brazil, HDPO production in hotspots surpasses current HFO demand, while FT-BTL and ATD represents 45% and 92%, respectively (Figure 17). In Europe, biofuel production is substantially lower (less than 6%) than European HFO demand (1526 PJ) but represents up to 24% of Rotterdam Port demand (385 PJ/year) (Figure 17). A similar trend is observed for South Africa and the United States (Figure 17). Fuel production in these regions represents less than 4% and 9% of regional marine fuel demands, respectively.
Fuel production levels were compared with the literature. Reference [86] estimated a marine biofuel supply (discounting biomass use for other transport sectors—road and aviation) in Europe of about 300 PJ/year from 2025 to 2030 mainly from Pyrolysis-based fuels and HVO, using agricultural residues and imported used and vegetable oils as feedstocks. Reference [87] estimate a biojet fuel production of 450 PJ/year from sugarcane and eucalyptus residues in Brazil, while [28] estimates totalizes 120 PJ/year. Results obtained are lower than literature findings, but the estimated potentials in this study are constrained to the 100 km collection area from the hotspots and considered seasonality impacts in plant operation.
In all regions, the highest biofuel production volumes were observed for HDPO. Notwithstanding, HDPO has not achieved commercial stage and is less mature than other biofuel technologies (Figure 21) [88,89,90,91,92,93]. Thus, investing in technologies that are closer to the commercialization stage in the near- to mid-term, may accelerate the uptake of maritime biofuels, despite their lower yields.
Techno-economic analysis showed a significant gap between biobunkers LCOFs and marine fuel prices (Figure 19). Among all technologies, HDPO registered the lowest LCOFs. Even though biomass torrefaction improves the feedstock logistics and gasification performance, the additional capital expenses made FT-diesel in decentralized configuration the costliest technology in most regions, except for ATD in Brazilian hotspot with lowest potential. However, technological learning may increase efficiency and drive down production costs, but this would require a large number of FT plants and may take decades [71].
Capital costs represent the major component of fuel total costs, except for HVO. FOM and VOM share varies among technologies and regions, given the differences in feedstock and inputs prices and labour costs. Transport costs were only expressive in regions with lowest LCOFs and higher transportation distances (Figure 22). Thus, in such cases, biofuels would be more competitive for other applications (such as road or air transportation), given that fuel consumption hubs would be closes to hostpots.
Therefore, biofuel competitiveness in the near-term could be achieved by carbon taxes application (Table 5). However, carbon prices required for the biobunkers to reach price parity with MGO were estimated and vary from USD 68/tCO2 (FT-centralized in South Africa) to USD 516/tCO2 (FT-decentralized in Europe). For only 15% of the hotspots, CO2 prices would be lower than USD 100/tCO2. In addition, the lower prices of conventional marine fuels compared to other sectors (such as road and aviation) increases the cost gap between bio and fossil fuel alternatives. Assessing biobunker competitiveness by the application of carbon taxes and having jet fuel prices of 2018 (USD 20/GJ) [94] as base for comparison led to CO2 prices from USD 40/tCO2 to USD 488/tCO2. In this sense, fuel mandates seem more realistic in the near term as they would lead to pioneer plants development and lower fuel costs.
To sum up, biobunker fuel production may play a role in maritime decarbonization in all regions. Nevertheless, this study selected only specific crops to identify and evaluate biobunker hotspots and actual technical potentials might be significantly higher in all regions. On the other hand, no sustainability constraints were considered in this study, which in turn may again lower potentials. Even though potentials were not significant compared to fuel demand in some regions, hotspots proximity to ports would enable fossil fuel replacements in these areas. In addition, SVO or Pyrolysis oil co-processing in oil refineries would benefit from the existing infrastructure and may represent a cost-effective solution to kick off the production of cleaner maritime fuels [106,107,108]. Furthermore, this study presents a sectoral-based analysis and potentials were determined without considering biomass demand for other sectors, such as aviation and power. Yet, as some technologies can co-produce jet- and diesel-range biofuels, coupled strategies for biofuels’ development may favour both sectors. In addition, the stablished decarbonization goals and variabilities regarding oil prices may offer an opportunity to improve biobunkers’ competitiveness.

5. Conclusions

The present study sought to identify potential areas for biobunker fuels production from agricultural and forestry residues in Brazil, Europe, South Africa, and the United States considering geographical, logistic, and economic aspects. The combination of the georeferenced analysis, with logistic integration, seasonality and, techno-economic analysis represents an innovative methodology to assess regional capabilities that could make some regions potential biobunker fuel suppliers.
The feedstock availability analysis revealed that total biomass residues potential was greater in Europe (4083 PJ/year), followed by Brazil, US, and South Africa (3903, 3050, 45 PJ/year, respectively). SVO potentials were only considered for Brazil and estimates are far below that of residues. The georeferenced analysis enabled the identification of suitable localities for biobunker refineries’ development. Considering the available potential in such areas (hotspots), Brazil is the region with the greatest potential among all regions (196.5 PJ/year). In addition, together with the US, Brazil is the region with lowest feedstock costs (ranging from USD 1.4/GJ to USD 0.8/GJ).
The techno-economic analysis results revealed fuel production levels in each region. Specific feedstock and inputs prices, labour costs, biomass seasonality, and fuel transport modes were considered to capture the impact of regional differences on biobunker total costs. However, same discount rates, plant construction time, and yields were assumed, which make the economic results comparable.
In general, HDPO stands out as the technology with higher yields and lowest costs in all regions. It is also the least developed technology, which may compromise its high potential. Thus, investing in readiest biofuel technologies, while pursuing efforts to accelerate the development of more advanced pathways, will be crucial.
Total fuel costs varied from USD 20.4 to 104.2/GJ. For all hotspots, values were higher than fossil marine fuels prices. Costs are mostly driven by capital expenses, except for HVO, and transportation costs’ shares were not substantial for most regions. In the near-term, fuel blending mandates might be the best alternative to guarantee the utilization of biobunker fuels, given that required carbon prices are high and may be not realistic. Nevertheless, uncertainties regarding oil prices and the expected commitment of maritime industry towards decarbonization may offer an opportunity for biofuels’ development.
In the end, biobunker fuel production may play a role in maritime decarbonization in all regions and support IMO mitigation strategies. Even though the estimated supply is lower than current demand in most regions, the proximity between potential fuel production areas and ports would incentivize their production. In addition, maritime decarbonization will require a mix of solutions, and other fuel options and technologies that are being extensively discussed, such as hydrogen and ammonia, will also play a role [4,10,15,109]. Thus, diverse strategies to incentivize biobunker production should be considered.
The application of fuel blending mandates would allow the competitiveness of readiest pathways in the near term, while technology learning would enable advanced technologies development. In addition, speeding up maritime decarbonization could be achieved by joining forces with other sectors that would be also benefited from advanced biofuels’ development.
Finally, this study presents some limitations that should be addressed in future works, such as:
  • Feedstock availability assessment has not considered biomass use in other hard-to-decarbonize sectors, such as aviation and industry;
  • Economic analysis was based in Nth plants. This tends to underestimate capital costs, construction, and commissioning times and overestimate fuel production yields compared to pioneer plants [71,110,111];
  • Fuel transport mode choice was based on proximity to infrastructure and not to main transport stations, which could increase fuel transportation costs;
  • Perform an integrated assessment to capture in greater detail the impacts in energy and land use of replacing conventional maritime fuels for biofuels.

Supplementary Materials

The following are available online at https://www.mdpi.com/article/10.3390/en14164980/s1.

Author Contributions

Conceptualization, F.C., J.P.-P., M.J. and A.S.; methodology, F.C., J.P.-P., M.J., A.S.; validation, F.C., J.P.-P., M.J. and A.S.; investigation, F.C.; data curation, F.C.; writing—original draft preparation, F.C.; writing—review and editing, JF.C., J.P.-P., M.J. and A.S.; supervision, J.P.-P., M.J. and A.S.; All authors have read and agreed to the published version of the manuscript.

Funding

This research received no external funding.

Acknowledgments

The authors would like to thank the Brazilian Coordination of Superior Level Staff Improvement (CAPES) and CNPq for financial support, Utrecht University collaboration in the Doctoral Exchange Program and the researchers Rick Hoefnagels, Bothwell Batidzirai, and Lotte Visser for the cooperation during the development of this work. This work also received support from the NAVIGATE project of the European Union’s Horizon 2020 research and innovation program under grant agreement no 821124.

Conflicts of Interest

The authors declare no conflict of interest.

References

  1. IMO. Fourth IMO GHG Study 2020; IMO: London, UK, 2020. [Google Scholar]
  2. ECOFYS. Potential of Biofuels for Shipping; ECOFYS: Utrecht, The Netherlands, 2012; pp. 1–114. [Google Scholar]
  3. IEA International Shipping. Tracking Clean Energy Progess. Available online: https://www.iea.org/tcep/transport/shipping/ (accessed on 1 October 2018).
  4. Prussi, M.; Scarlat, N.; Acciaro, M.; Kosmas, V. Potential and limiting factors in the use of alternative fuels in the European maritime sector. J. Clean. Prod. 2021, 291, 125849. [Google Scholar] [CrossRef] [PubMed]
  5. IEA. Bioenergy Biofuels for the Marine Shipping Sector; IEA: Copenhagen, Denmark, 2017; pp. 1–86. [Google Scholar]
  6. EC European Maritime Sector. Technical Report; European Commission: Brussels, Belgium, 2019. [Google Scholar]
  7. ETIP. Use of Biofuels in Shipping; ETIP: Brussels, Belgium, 2017; pp. 2015–2018. [Google Scholar]
  8. Andersson, K.; Brynolf, S.; Hansson, J.; Grahn, M. Criteria and decision support for a sustainable choice of alternative marine fuels. Sustainability 2020, 12, 3623. [Google Scholar] [CrossRef]
  9. Müller-Casseres, E.; Carvalho, F.; Nogueira, T.; Fonte, C.; Império, M.; Poggio, M.; Wei, H.K.; Portugal-Pereira, J.; Rochedo, P.R.R.; Szklo, A.; et al. Production of alternative marine fuels in Brazil: An integrated assessment perspective. Energy 2021, 219, 119444. [Google Scholar] [CrossRef]
  10. Lloyd’s Register. UMAS Techno-Economic Assessment of Zero-Carbon Fuels; Lloyds Register: London, UK, 2020. [Google Scholar]
  11. SSI. The Role of Sustainable Biofuels in the Decarbonisation of Shipping; SSI: Madrid, Spain, 2019. [Google Scholar]
  12. Schulze, R.E.; Maharaj, M.; Warburton, M.L.; Gers, C.J.; Horan, M.J.C.; Kunz, R.P.; Clark, D.J. South African Atlas of Climatology and Agrohydrology; Water Research Community: Pretoria, South Africa, 2008. [Google Scholar]
  13. Hugo, W. BioEnergy Atlas for South Africa; SAEON: Pretoria, South Africa, 2016; pp. 1–193. [Google Scholar]
  14. Notteboom, T.; Pallis, A.; Rodrigue, J.-P. Port Economics, Management and Policy; Routledge: New York, NY, USA, 2019. [Google Scholar]
  15. Al-Enazi, A.; Okonkwo, E.C.; Bicer, Y.; Al-Ansari, T. A review of cleaner alternative fuels for maritime transportation. Energy Rep. 2021, 7, 1962–1985. [Google Scholar] [CrossRef]
  16. Ecofys Shipping: A Missing Opportunity? Available online: https://www.ecofys.com/files/files/ecofys-2012-biofuels-in-shipping-biofuels-international-2012-05.pdf (accessed on 10 September 2018).
  17. Moirangthem, K. Alternative Fuels for Marine and Inland Waterways; European Commission: Brussels, Belgium, 2016; ISBN 978-92-79-56957-9. [Google Scholar]
  18. Bouman, E.A.; Lindstad, E.; Rialland, A.I.; Strømman, A.H. State-of-the-art technologies, measures, and potential for reducing GHG emissions from shipping—A review. Transp. Res. Part D Transp. Environ. 2017, 52, 408–421. [Google Scholar] [CrossRef]
  19. Brynolf, S.; Fridell, E.; Andersson, K. Environmental assessment of marine fuels: Liquefied natural gas, liquefied biogas, methanol and bio-methanol. J. Clean. Prod. 2014, 74, 86–95. [Google Scholar] [CrossRef]
  20. Gilbert, P. From reductionism to systems thinking: How the shipping sector can address sulphur regulation and tackle climate change. Mar. Policy 2014, 43, 376–378. [Google Scholar] [CrossRef]
  21. Gilbert, P.; Walsh, C.; Traut, M.; Kesieme, U.; Pazouki, K.; Murphy, A. Assessment of full life-cycle air emissions of alternative shipping fuels. J. Clean. Prod. 2018, 172, 855–866. [Google Scholar] [CrossRef]
  22. Gilbert, P.; Bows-Larkin, A.; Mander, S.; Walsh, C. Technologies for the high seas: Meeting the climate challenge. Carbon Manag. 2014, 5, 447–461. [Google Scholar] [CrossRef]
  23. DNV GL. Comparison of Alternative Marine Fuels; DNV GL: Høvik, Norway, 2019. [Google Scholar]
  24. Kesieme, U.; Pazouki, K.; Murphy, A.; Chrysanthou, A. Biofuel as an alternative shipping fuel: Technological, environmental and economic assessment. Sustain. Energy Fuels 2019, 3, 899–909. [Google Scholar] [CrossRef] [Green Version]
  25. Zhou, Y.; Pavlenko, N.; Rutherford, D.; Osipova, L.; Comer, B. The potential of liquid biofuels in reducing ship emissions. Int. Counc. Clean Transp. 2020, 1, 31. [Google Scholar]
  26. Tanzer, S.E.; Posada, J.; Geraedts, S.; Ramírez, A. Lignocellulosic marine biofuel: Technoeconomic and environmental assessment for production in Brazil and Sweden. J. Clean. Prod. 2019, 239, 117845. [Google Scholar] [CrossRef]
  27. Portugal-Pereira, J.; Soria, R.; Rathmann, R.; Schaeffer, R.; Szklo, A. Agricultural and agro-industrial residues-to-energy: Techno-economic and environmental assessment in Brazil. Biomass Bioenergy 2015, 81, 521–533. [Google Scholar] [CrossRef]
  28. Carvalho, F.; da Silva, F.T.F.; Szklo, A.; Portugal-Pereira, J. Potential for biojet production from different biomass feedstocks and consolidated technological routes: A georeferencing and spatial analysis in Brazil. Biofuels Bioprod. Biorefining 2019, 13, 22. [Google Scholar] [CrossRef]
  29. IBGE. Municipal Agricultural Production: Temporary and Permanent Crops. Available online: https://biblioteca.ibge.gov.br/index.php/biblioteca-catalogo?view=detalhes&id=766 (accessed on 20 August 2018).
  30. IBGE. Vegetal Extraction and Forestry Production. Available online: https://biblioteca.ibge.gov.br/visualizacao/periodicos/74/pevs_2018_v33_informativo.pdf (accessed on 1 August 2018).
  31. IPEA. Diagnóstico dos Resíduos Orgânicos do Setor Agrossilvopastoril e Agroindústrias Associadas; IPEA: Brasília, Brazil, 2012. [Google Scholar]
  32. Dias, J.M.C.D.S.; De Souza, D.T.; Braga, M.; Onoyama, M.M.; Miranda, C.H.B.; Barbosa, P.F.D.; Rocha, J.D. Produção de Briquetes e Péletes a Partir de Resíduos Agrícolas, Agroindustrais e Florestais; Embrapa Agroenergia: Brazilia, Brazil, 2012; p. 132. [Google Scholar]
  33. Macedo, I.C.; Seabra, J.E.A.; Silva, J.E.A.R. Green house gases emissions in the production and use of ethanol from sugarcane in Brazil: The 2005/2006 averages and a prediction for 2020. Biomass Bioenergy 2008, 32, 582–595. [Google Scholar] [CrossRef]
  34. Santos, V.E.N. Proposta Metodológica Para a Criação de Biorrefinaria de Bagaço de Cana Produtora de Bioplataformas Químicas: Um Ensaio Preliminar Como Parte de um Sistema de Simbiose Industrial em Campos dos Goytacazes—RJ. Master’s Thesis, Universidade Federal do Rio de Janeiro, Rio de Janeiro, Brazil, 2013. [Google Scholar]
  35. BiodieselBR Rendimento Sementes Óleo. Available online: https://www.biodieselbr.com/biodiesel/sementes/rendimento-sementes-oleo (accessed on 10 April 2020).
  36. EMBRAPA Tecnologia de Alimentos. Available online: https://www.agencia.cnptia.embrapa.br/gestor/tecnologia_de_alimentos/arvore/CONT000gc8yujq302wx5ok01dx9lcx1g7v3u.html (accessed on 5 February 2020).
  37. Canto, J.L. Do Colheita Mecanizada de Biomassa Florestal Para Energia; Universidade Federal de Viçosa: Viçosa, Brazil, 2009. [Google Scholar]
  38. OECD. OECD-FAO Agricultural Outlook 2019–2028; OECD: Paris, France, 2019; pp. 1–27. [Google Scholar]
  39. Jiménez Espadafor, F.; Torres García, M.; Becerra Villanueva, J.; Moreno Gutiérrez, J. The viability of pure vegetable oil as an alternative fuel for large ships. Transp. Res. Part D Transp. Environ. 2009, 14, 461–469. [Google Scholar] [CrossRef]
  40. Dees, M.; Elbersen, B.; Fitzgerald, J.; Vis, M.W.; Antilla, P.; Forsell, N.; Ramirez-Almeyda, J.; Garcia Galindo, D.; Glavinjic, B.; Staritsky, I.; et al. A Spatial Data Base on Sustainable Biomass Cost—Supply of Lignocellulosic Biomass in Europe—Methods & Data Sources; Project Report. S2BIOM—A Project Funded under the European Union 7th Framework Programme for Research; Grant Agreement no. 608622; European Commission: Brussels, Belgium, 2017. [Google Scholar]
  41. S2biom Annex D2.4—Biomass Properties. Available online: https://www.s2biom.eu/images/Publications/Annex_D2.4_S2BIOM_biomass_properties.pdf (accessed on 15 July 2020).
  42. SAEON South Africa Bioernergy Atlas Portal. Available online: http://bea.dirisa.org/atlas/biomass (accessed on 20 April 2020).
  43. Hugo, W. Biomass from Agricultural Residues—Annual Availability of Biomass and Estimated Energy Value. In BioEnergy Atlas for South Africa; SAEON: Pretoria, South Africa, 2015; pp. 1–7. [Google Scholar]
  44. Hugo, W. SAEON Potential and Yields. Yield Rations and Yield Improvements Possibilities. In BioEnergy Atlas for South Africa; SAEON: Pretoria, South Africa, 2015. [Google Scholar]
  45. Hugo, W. Fact Sheet: Potential, Availability and Realistic Energy Conversion. In BioEnergy Atlas for South Africa; SAEON: Pretoria, South Africa, 2017; p. 33. [Google Scholar]
  46. Sugartech SA Bagasse Calorific Values. Available online: http://www.sugartech.co.za/extraction/bagasseCV/index.php (accessed on 30 April 2020).
  47. U.S. Department of Energy. NREL The Biofuel Atlas. Available online: https://maps.nrel.gov/biomass/?aL=QCty_y%255Bv%255D%3Dt&bL=clight&cE=0&lR=0&mC=40.21244%2C-91.625976&zL=4 (accessed on 5 November 2020).
  48. Milbrandt, A. A Geographic Perspective on the Current Biomass Resource Availability in the United States; NREL Tech. Rep.; NREL: Denver, CO, USA, 2005; pp. 1–50. [Google Scholar]
  49. USDA National Agricultural Statistics Service Census of Agriculture. Available online: https://www.nass.usda.gov/Statistics_by_Subject/index.php?sector=CROPS (accessed on 19 May 2021).
  50. U.S. Department of Energy. U.S. Billion-Ton Update: Biomass Supply for a Bioenergy and Bioproducts Industry; Office of the Biomass Program: Oak Ridge, TN, USA, 2011. [Google Scholar]
  51. ECN Phyllis2—Database for the Physico-Chemical Composition of (Treated) Lignocellulosic Biomass, Micro- and Macroalgae, Various Feedstocks for Biogas Production and Biochar. Available online: https://phyllis.nl/ (accessed on 10 January 2020).
  52. U.S. Forest Inventory Analysis Timber Products Output. Available online: https://www.fia.fs.fed.us/program-features/tpo/ (accessed on 5 November 2020).
  53. Hoffmann, B.S.; Salem, A.; Schaeffer, R.O. Potencial Termelétrico a Carvão no Rio Grande do Sul Diante Restrições de Disponibilidade de Água e Objetivos de Redução de Emissões de CO2, Aplicando a Queima em Leito Fluidizado; Universidade Federal do Rio de Janeiro: Rio de Janeiro, Brazil, 2013. [Google Scholar]
  54. Sultana, A.; Kumar, A. Development of tortuosity factor for assessment of lignocellulosic biomass delivery cost to a biorefinery. Appl. Energy 2014, 119, 288–295. [Google Scholar] [CrossRef]
  55. IFPEN Biofuels Dashboard 2020. Available online: https://www.ifpenergiesnouvelles.com/article/biofuels-dashboard-2020 (accessed on 5 April 2021).
  56. JCR for the European Commission’s Knowledge Centre for Bioeconomy Brief on biomass for energy in the European Union. Publ. Off. Eur. Union 2019, 1, 1–8. [CrossRef]
  57. Geleynse, S.; Brandt, K.; Garcia-Perez, M.; Wolcott, M.; Zhang, X. The Alcohol-to-Jet Conversion Pathway for Drop-In Biofuels: Techno-Economic Evaluation. ChemSusChem 2018, 11, 3728–3741. [Google Scholar] [CrossRef]
  58. Guell, B.M.; Bugge, M.; Kempegowda, R.S.; George, A.; Paap, S.M. Report Benchmark of Conversion and Production Technologies for Synthetic Biofuels for Aviation; Sintef: Trondheim, Norway, 2012. [Google Scholar]
  59. Jones, S.; Meyer, P.; Snowden-Swan, L.; Susanne, K.J.; Pimphan, M.; Snowden-Swan, L.; Asanga, P.; Eric, T.; Abhijit, D.; Jacob, J.; et al. Process design and economics for the conversion of lignocellulosic biomass to hydrocarbon fuels: Fast pyrolysis and hydrotreating bio-oil pathway. Energy 2013, 1, 97. [Google Scholar]
  60. Kenney, K.; Cafferty, K.G.; Jacobson, J.J.; Bonner, I.J.; Gresham, G.L.; Smith, W.A.; Thompson, D.N.; Thompson, V.S.; Tumuluru, J.S.; Yancey, N. Feedstock Supply System Design and Economics for Conversion of Lignocellulosic Biomass to Hydrocarbon Fuels. Conversion Pathway: Biological Conversion of Sugars to Hydrocarbons; US Department of Energy: Washington, DC, USA, 2013; p. 70.
  61. Khan, M.Y. Waste Vegetable Oils (WVO) as Compression Ignition Engine Fuel: A Review. In Proceedings of the 2nd International conference on Science, Technology & Management (ICSTM-2018), Chandigarh, India, 16 September 2018. [Google Scholar]
  62. Klein, B.C.; Chagas, M.F.; Junqueira, T.L.; Rezende, M.C.A.F.; de Fatima Cardoso, T.; Cavalett, O.; Bonomi, A. Techno-economic and environmental assessment of renewable jet fuel production in integrated Brazilian sugarcane biorefineries. Appl. Energy 2018, 209, 290–305. [Google Scholar] [CrossRef]
  63. Meyer, P.A.; Snowden-Swan, L.J.; Jones, S.B.; Rappé, K.G.; Hartley, D.S. The effect of feedstock composition on fast pyrolysis and upgrading to transportation fuels: Techno-economic analysis and greenhouse gas life cycle analysis. Fuel 2020, 259, 116218. [Google Scholar] [CrossRef]
  64. Pearlson, M.N. A Techno-Economic and Environmental Assessment of Hydroprocessed Renewable Distillate Fuels. Master’s Thesis, Massachusetts Institute of Technology, Cambridge, MA, USA, 2011. [Google Scholar]
  65. Priharto, N.; Ronsse, F.; Prins, W.; Hita, I.; Deuss, P.J.; Heeres, H.J. Hydrotreatment of pyrolysis liquids derived from second-generation bioethanol production residues over NiMo and CoMo catalysts. Biomass Bioenergy 2019, 126, 84–93. [Google Scholar] [CrossRef]
  66. Samavati, M.; Santarelli, M.; Martin, A.; Nemanova, V. Production of Synthetic Fischer-Tropsch Diesel from renewables : Thermoeconomic and Environmental Analysis. Energy Fuels 2017, 32, 1744–1753. [Google Scholar] [CrossRef]
  67. Tagomori, I.S.; Rochedo, P.R.R.; Szklo, A. Techno-economic and georeferenced analysis of forestry residues-based Fischer-Tropsch diesel with carbon capture in Brazil. Biomass Bioenergy 2019, 123, 134–148. [Google Scholar] [CrossRef]
  68. Wang, W.-C.; Tao, L. Bio-jet fuel conversion technologies. Renew. Sustain. Energy Rev. 2015, 53, 801–822. [Google Scholar] [CrossRef] [Green Version]
  69. Blin, J.; Brunschwig, C.; Chapuis, A.; Changotade, O.; Sidibe, S.S.; Noumi, E.S.; Girard, P. Characteristics of vegetable oils for use as fuel in stationary diesel engines—Towards specifications for a standard in West Africa. Renew. Sustain. Energy Rev. 2013, 22, 580–597. [Google Scholar] [CrossRef] [Green Version]
  70. Cervi, W.R.; Lamparelli, R.A.C.; Seabra, J.E.A.; Junginger, M.; Jong, S.; Hilst, F. Spatial modeling of techno-economic potential of biojet fuel production in Brazil. GCB Bioenergy 2020, 12, 136–157. [Google Scholar] [CrossRef] [Green Version]
  71. de Jong, S.; Hoefnagels, R.; Faaij, A.; Slade, R.; Mawhood, R.; Junginger, M. The feasibility of short-term production strategies for renewable jet fuels—A comprehensive techno-economic comparison. Biofuels Bioprod. Biorefining 2015, 9, 778–800. [Google Scholar] [CrossRef]
  72. Diederichs, G.W. Techno-Economic Assessment of Processes that Produce Jet Fuel from Plant-Derived Sources. Available online: https://core.ac.uk/download/pdf/37440495.pdf (accessed on 16 December 2015).
  73. Diederichs, G.W.; Ali Mandegari, M.; Farzad, S.; Görgens, J.F. Techno-economic comparison of biojet fuel production from lignocellulose, vegetable oil and sugar cane juice. Bioresour. Technol. 2016, 216, 331–339. [Google Scholar] [CrossRef]
  74. Dimitriou, I.; Goldingay, H.; Bridgwater, A.V. Techno-economic and uncertainty analysis of Biomass to Liquid (BTL) systems for transport fuel production. Renew. Sustain. Energy Rev. 2018, 88, 160–175. [Google Scholar] [CrossRef]
  75. ETIP Bioenergy HVO/HEFA. Available online: http://www.etipbioenergy.eu/value-chains/products-end-use/products/hvo-hefa (accessed on 10 April 2019).
  76. Safarian, S.; Unnþórsson, R.; Richter, C. A review of biomass gasification modelling. Renew. Sustain. Energy Rev. 2019, 110, 378–391. [Google Scholar] [CrossRef]
  77. Ekşioğlu, S.D.; Acharya, A.; Leightley, L.E.; Arora, S. Analyzing the design and management of biomass-to-biorefinery supply chain. Comput. Ind. Eng. 2009, 57, 1342–1352. [Google Scholar] [CrossRef]
  78. He, X.; Lau, A.K.; Sokhansanj, S.; Lim, C.J.; Bi, X.T.; Melin, S. Investigating gas emissions and dry matter loss from stored biomass residues. Fuel 2014, 134, 159–165. [Google Scholar] [CrossRef]
  79. Memişoğlu, G.; Üster, H. Integrated Bioenergy Supply Chain Network Planning Problem. Transp. Sci. 2016, 50, 35–56. [Google Scholar] [CrossRef]
  80. Rentizelas, A.A. Biomass storage. In Biomass Supply Chains for Bioenergy and Biorefining; Elsevier: Amsterdam, The Netherlands, 2016; pp. 127–146. ISBN 9781782423874. [Google Scholar]
  81. Pavlenko, A.N.; Searle, S.; Christensen, A. The Cost of Supporting Alternative Jet Fuels in the European Union; ICCT: Berlin, Germany, 2019; p. 20. [Google Scholar]
  82. Hoefnagels, R.; Searcy, E.; Cafferty, K.; Cornelissen, T.; Junginger, M.; Jacobson, J.; Faaij, A. Lignocellulosic feedstock supply systems with intermodal and overseas transportation. Biofuels Bioprod Biorefining 2014, 8, 794–818. [Google Scholar] [CrossRef]
  83. Visser, L.; Hoefnagels, R.; Junginger, M. Wood pellet supply chain costs—A review and cost optimization analysis. Renew. Sustain. Energy Rev. 2020, 118, 109506. [Google Scholar] [CrossRef]
  84. Kim, S.; Dale, B.E. Comparing alternative cellulosic biomass biorefining systems: Centralized versus distributed processing systems. Biomass Bioenergy 2015, 74, 135–147. [Google Scholar] [CrossRef] [Green Version]
  85. Strogen, B.; Horvath, A.; McKone, T.E. Fuel Miles and the Blend Wall: Costs and Emissions from Ethanol Distribution in the United States. Environ. Sci. Technol. 2012, 46, 5285–5293. [Google Scholar] [CrossRef] [PubMed]
  86. Kroft, D.F.A. Van Der the Potential of Drop-in Biofuels for the Maritime Industry; TU Delft: Delft, The Netherlands, 2020. [Google Scholar]
  87. Cervi, W.R.; Lamparelli, R.A.C.; Gallo, B.C.; de Oliveira Bordonal, R.; Seabra, J.E.A.; Junginger, M.; van der Hilst, F. Mapping the environmental and techno-economic potential of biojet fuel production from biomass residues in Brazil. Biofuels Bioprod. Biorefining 2021, 15, 282–304. [Google Scholar] [CrossRef]
  88. Cerruti, E.; Di Gruttola, F.; Lauro, G.; Valentini, T.D.; Fiaschi, P.; Sorrenti, R.; Borello, D. Assessment of Feedstocks and Technologies for Advanced Biofuel Production. E3S Web Conf. 2020, 197. [Google Scholar] [CrossRef]
  89. IEA. Bioenergy Emerging Gasification Technologies for Waste & Biomass; IEA: Bridgend, UK, 2020; ISBN 9781910154847. [Google Scholar]
  90. Li, W.; Wright, M.M. Negative Emission Energy Production Technologies: A Techno-Economic and Life Cycle Analyses Review. Energy Technol. 2020, 8, 1–10. [Google Scholar] [CrossRef]
  91. Olbrich, W.; Boscagli, C.; Raffelt, K.; Zang, H.; Dahmen, N.; Sauer, J. Catalytic hydrodeoxygenation of pyrolysis oil over nickel-based catalysts under H2/CO2 atmosphere. Sustain. Chem. Process. 2016, 4, 9. [Google Scholar] [CrossRef] [Green Version]
  92. Sorunmu, Y.; Billen, P.; Spatari, S. A review of thermochemical upgrading of pyrolysis bio-oil: Techno-economic analysis, life cycle assessment, and technology readiness. GCB Bioenergy 2020, 12, 4–18. [Google Scholar] [CrossRef] [Green Version]
  93. Yun, Y. (Ed.) Alcohol Fuels—Current Technologies and Future Prospect; IntechOpen: London, UK, 2020; ISBN 978-1-78985-043-7. [Google Scholar]
  94. IndexMundi Jet Fuel Prices. Available online: https://www.indexmundi.com/commodities/?commodity=jet-fuel (accessed on 13 October 2020).
  95. Bengtsson, S.; Fridell, E.; Andersson, K. Environmental assessment of two pathways towards the use of biofuels in shipping. Energy Policy 2012, 44, 451–463. [Google Scholar] [CrossRef]
  96. Kass, M.; Abdullah, Z.; Biddy, M.; Drennan, C.; Hawkins, T.; Jones, S.; Holladay, J.; Longman, D.; Newes, E.; Theiss, T.; et al. Understanding the Opportunities of Biofuels for Marine Shipping; Oak Ridge National Lab: Oak Ridge, TN, USA, 2018; p. 26. [Google Scholar]
  97. Lapola, D.M.; Schaldach, R.; Alcamo, J.; Bondeau, A.; Koch, J.; Koelking, C.; Priess, J.A. Indirect land-use changes can overcome carbon savings from biofuels in Brazil. Proc. Natl. Acad. Sci. USA 2010, 107, 3388–3393. [Google Scholar] [CrossRef] [Green Version]
  98. Plevin, R.J.; Jones, A.D.; Torn, M.S.; Gibbs, H.K. Greenhouse Gas Emissions from Biofuels’ Indirect Land Use Change Are Uncertain but May Be Much Greater than Previously Estimated. Environ. Sci. Technol. 2010, 44, 8015–8021. [Google Scholar] [CrossRef]
  99. Staples, M.D.; Malina, R.; Olcay, H.; Pearlson, M.N.; Hileman, J.I.; Boies, A.; Barrett, S.R.H. Lifecycle greenhouse gas footprint and minimum selling price of renewable diesel and jet fuel from fermentation and advanced fermentation production technologies. Energy Environ. Sci. 2014, 7, 1545–1554. [Google Scholar] [CrossRef]
  100. Iribarren, D.; Peters, J.F.; Dufour, J. Life cycle assessment of transportation fuels from biomass pyrolysis. Fuel 2012, 97, 812–821. [Google Scholar] [CrossRef]
  101. Peters, J.F.; Iribarren, D.; Dufour, J. Simulation and life cycle assessment of biofuel production via fast pyrolysis and hydroupgrading. Fuel 2015, 139, 441–456. [Google Scholar] [CrossRef]
  102. Vienescu, D.N.; Wang, J.; Le Gresley, A.; Nixon, J.D. A life cycle assessment of options for producing synthetic fuel via pyrolysis. Bioresour. Technol. 2018, 249, 626–634. [Google Scholar] [CrossRef] [PubMed] [Green Version]
  103. Carvalho, F.; Portugal-Pereira, J.; Szklo, A.S. Two Capitains will not sink the ship: Evaluation of bio-based bunker fuel production and distribution logistics in Brazil. In Proceedings of the 27th European Biomass Conference and Exhibition, Lisbon, Portugal, 27–30 May 2019; pp. 681–683. [Google Scholar]
  104. Stengel, B.; Vium, J.H. Synthesis, Characterization, and Use of Hydro-Treated Oils and Fats for Engine Operation; Rostock, G.E., Ed.; IEA: Tasstrup, Demark, 2015. [Google Scholar]
  105. Balcombe, P.; Brierley, J.; Lewis, C.; Skatvedt, L.; Speirs, J.; Hawkes, A.; Staffell, I. How to decarbonise international shipping: Options for fuels, technologies and policies. Energy Convers. Manag. 2019, 182, 72–88. [Google Scholar] [CrossRef]
  106. IEA. Bioenergy The Potential and Challenges of “Drop-in” Biofuels—The key role that co-processing will play in production. Task 2019, 1, 156. [Google Scholar]
  107. Pinho, A.D.R.; De Almeida, M.B.B.; Mendes, F.L.; Ximenes, V.L.; Casavechia, L.C. Co-processing raw bio-oil and gasoil in an FCC Unit. Fuel Process. Technol. 2015, 131, 159–166. [Google Scholar] [CrossRef]
  108. van Dyk, S.; Su, J.; Mcmillan, J.D.; Saddler, J. Potential synergies of drop-in biofuel production with further co-processing at oil refineries. Biofuels Bioprod. Biorefining 2019, 13, 760–775. [Google Scholar] [CrossRef] [Green Version]
  109. Lloyds. Zero-Emission Vessels 2030. How Do We Get There? Lloyds Register: London, UK, 2017. [Google Scholar]
  110. Merrow, E.W.; Phillips, K.E.; Myers, C.W. Understanding Cost Growth and Performance Shortfalls in Pioneer Process Plants; Libr. Congr. Cat. Publ. Data; Library of Congress: New York, NY, USA, 1981; pp. 1–102. [Google Scholar]
  111. Morrison, G.M.; Witcover, J.; Parker, N.C.; Fulton, L. Three routes forward for biofuels: Incremental, leapfrog, and transitional. Energy Policy 2016, 88, 64–73. [Google Scholar] [CrossRef]
Figure 1. Methodological framework of this study. Numbers in the figure refer to the text sections below for a more elaborate description.
Energies 14 04980 g001
Figure 2. Hotspot’s potential identification (Brazilian map used as an example).
Energies 14 04980 g002
Figure 3. Hotspots and infrastructure localities for fuel production. (European map used as an example).
Energies 14 04980 g003
Figure 4. Fuel production pathways considered for biobunker production.
Energies 14 04980 g004
Figure 5. FT-BTL configurations.
Energies 14 04980 g005
Figure 6. Crop’s seasonality, storage times, and FUT in each region.
Energies 14 04980 g006
Figure 7. Biomass residues potentials compared to other studies.
Energies 14 04980 g007
Figure 8. Biomass residues hotspots in Brazil (left) and Europe (right). Note: Some hotspots in Europe registered very low potentials and were excluded (LR_FF_C1, LR_FF_C2, LR_TH_C, LR_TH_NC, ST_FF_C, ST_FF_NC).
Energies 14 04980 g008
Figure 9. Biomass residues hotspots in South Africa (right) and US (left).
Energies 14 04980 g009
Figure 10. SVO hotspots in Brazil.
Energies 14 04980 g010
Figure 11. Biomass residues potential and average costs in hotspots.
Energies 14 04980 g011
Figure 12. SVO potential and average cost in hotspots.
Energies 14 04980 g012
Figure 13. Hotspots and infrastructure in Brazil (biomass residues hotspots—left; SVO hotspots—right).
Energies 14 04980 g013
Figure 14. Hotspots and infrastructure in Europe (left), South Africa (top right) and US (bottom right).
Energies 14 04980 g014
Figure 15. Biofuel production levels in each hotspot for FT-BTL, ATD, and HDPO pathways.
Energies 14 04980 g015
Figure 16. Biofuel production levels in each hotspot for SVO and HVO pathways. Note: BR_Mamonoil potential is 0.03.
Energies 14 04980 g016
Figure 17. Regional biobunker supply and bunker fuel demand.
Energies 14 04980 g017
Figure 18. LCOF ranges.
Energies 14 04980 g018
Figure 19. LCOF ranges (minimum and maximum values) for different technologies compared to average bunker fuel prices.
Energies 14 04980 g019
Figure 20. LCOF breakdown for each technology and average LCOF values. Note: SVO is not represented given that its LCOF is its prices.
Energies 14 04980 g020
Figure 21. Fuel production and technology readiness for each biobunker fuel pathway. Note: As SVO and HVO fuel production levels were far below other technologies, they are not represented. However, both are mature technologies.
Energies 14 04980 g021
Figure 22. Total biobunker cost ranges.
Energies 14 04980 g022
Table 1. Parameters considered for potential estimates in Brazil. Notes for agricultural residues: a: Wood cuts represent primary forest residues, i.e., obtained until the basic product production (charcoal, wood chips, and sawdust), including cutting and peeling activities. Forestry residues are timber and other forest products that remain with no defined use due to technological or market limitations [31]; b: For agricultural residues an average factor was considered based on [27]. For forest residues, data from [31,32] were considered; c: Based in [27,31,32]; d: Regarding sugarcane, a coefficient that expresses residues availability for energy purposes was adopted. In this study, it was assumed that 65% of sugarcane straw is available for energy production, taking into consideration the rate of agricultural fields that use mechanical harvesting without open-air burning [27,32,33,34]; e: Dry basis. Notes for straight vegetable oils: a: Obtained from average values from Brazilian institutions [35,36]; b: The same efficiency in oil extraction was considered for all crops; c: Oil availability factors were based on OECD/FAO projections for vegetable oils utilization in food industry (49%) and biofuels production (36%) in the period from 2021 to 2018. Thus, vegetable oil availability to produce maritime biofuels discounts its utilization in its current markets. Same availability factor was considered for all oils, although not all are used for biofuels production.
Crop.Agricultural and Forest Residues aRPR bESR cAR dLHV (MJ/kg) eReference
SugarcaneStraw0.2234%65%18.6[27]
SoybeanStraw2.0130%100%20.1
CornStover1.5325%100%18.7
WheatStraw1.5515%100%19.5
EucalyptusForestry residues0.1050%100%25.2[31,37]
Wood cuts0.45100%100%20.3
PinusForestry residues0.1050%100%25.2
Wood cuts0.45100%100%21.8
Forest extractionForestry residues0.6050%100%25.2
Wood cuts0.18100%100%19.4
CropStraight Vegetable OilsOSR aEE b (%)LHV (MJ/kg)AO c (%)Reference
CottonCotton oil22%95%39.515%[35,36,38,39]
PeanutPeanut oil43%95%39.815%
SunflowerSunflower oil43%95%39.615%
MamonMamon oil46%95%39.515%
SoybeanSoybean oil18%95%39.615%
CornCorn oil4%95%39.515%
Table 2. Parameters considered for agricultural and forest residues potential estimates in Europe. Notes: a: Final fellings and thinnings from coniferous/non-coniferous plantations and semi-natural forests are the small trees from management operations or left over after a final harvest for which there may be no demand (or no suitability) for use as pulp wood. For this reason, stemwood was considered in this study for Europe; b: As received [41]; c: Dry basis [41].
Biomass Residues Potential from S2BiomMoisture Content b (%)LHV c (MJ/kg)
Agricultural ResiduesCereal Straw1517.0
Maize Stover1516.0
Sunflower straw2016.7
Forest residuesLogging residues from final fellings from conifers (LR_FF_C)53.619.2
Logging residues from final fellings from non-conifers trees (LR_FF_NC)53.619.2
Logging residues from thinning from conifers trees (LR_TH_C)53.618.7
Logging residues from thinning from non-conifers trees (LR_TH_NC)53.618.7
Stem wood from final felling from conifers and trees (ST_FF_C) a53.919.3
Stem wood from final felling from non-conifers trees (ST_FF_NC) a53.619.3
Stem wood from thinning from conifers trees (ST_TH_C) a53.619.2
Stem wood from thinning from non-conifers trees (ST_TH_NC) a53.619.2
Table 3. Parameters considered for agricultural residues potential estimates in South Africa. Notes: a: Crop and residue production data were included in BioAtlas files [42]; b: Residue-to-product ratio determined by the ratio between lignocellulosic residue yield and primary crop yield obtained in the Atlas metadata files [43,44]; c: 50% of residues should remain on field for soil conditioning [43]; d: Sugarcane bagasse availability data provided already discounted its use for internal energy demand. Sugarcane field residues are currently not available given the burning practice in sugarcane harvesting. However, this study considered that this practice will be extinguished in the near term in view of its environmental and health impacts. For wheat and maize residues, it was assumed that 35% are used for animal feed and bedding [13,43]; e: Moisture content of sugarcane bagasse was informed in the metadata available at SAEON Bioenergy Atlas website [42]. For other crops, moisture content values were obtained in [45]; f: Dry mass basis refer to air-dried biomass. In South Africa, average temperatures are high, and humidity is low. Then, air-dried lignocellulosic residues register a moisture content between 10% and 20%. Energy density is based on the generic values for agricultural residues [13]. For sugarcane bagasse, LHV was determined using the moisture and ash content and brix percentages [46].
Crop aResidueRPR bESR (%) cAR (%) dMoisture Content e (%)LHV f (MJ/kg)
SugarcaneBagasse0.9100%-50%10.0
Field residues (Straw)0.950%100%42%7.1
MaizeStover2.650%35%42%11.5
WheatStraw1.350%35%42%11.5
Table 4. Parameters considered for corn and wheat residues potential estimates in the US. Notes: a: Crop production obtained in the U.S. National Census of Agriculture [49]; b: [48,50]; c: 30% residue cover is reasonable for soil protection [48]; d: Other uses (OU) are mainly associated to animal feeding. According to [48] animals rarely consume more than 20–25% of the stover in grazing; e: About 10% to 15% of the crop residue is used for other purposes, such as bedding, silage, etc. [48]; f: [51].
Crop aResidueRPR a (%)ESR b (%)AF c (%)OU d (%)Moisture Content e (%)LHV f (MJ/kg)
CornStover1.070%20–25%10–15%15.517.3
WheatStraw1.313.517.8
Table 5. Carbon prices required for biobunkers competitiveness. Notes: a Average literature values for different world regions, b [28,95,96], c [62,97,98,99], d [100,101,102], e [2,103], f [28,96,104], g [10,25,95,105].
Carbon Intensity
gCO2/MJ Fuel
USD/tCO2
BREUSAUSA
FT-decentralized27 a195516288390
FT-centralized27 b12023768103
ATD38 c320336221290
HDPO23 d116175210125
SVO 58 e217---
HVO58 f175---
MGO137 g
Max USD/tCO2516FT-decentralized (EU)
Min USD/tCO268FT-centralized (SA)
Publisher’s Note: MDPI stays neutral with regard to jurisdictional claims in published maps and institutional affiliations.