1. Introduction
Although there is an ongoing diversification in propulsion systems for passenger cars, there is still a need for efficient, clean, and powerful internal combustion engines in the near future [
1,
2,
3]. In the case of SI-engines, the concept of downsizing and downspeeding (increase in mean specific load) is a successful approach to improve fuel efficiency and engine torque while fulfilling emission regulations [
4]. The so-called degree of downsizing (increase of cylinder pressure) is limited by the occurrence of irregular combustion phenomena like knocking and pre-ignition. Especially at high engine loads and low engine speeds (low-end torque), the probability of pre-ignition events increases drastically, as shown in testbed investigations [
5,
6,
7,
8].
A pre-ignition (PI) is an unpredictable irregular combustion phenomenon where the ignition of the mixture occurs before the actual initiation by the spark plug. Typically, the initial pre-ignition can trigger a sequence of follow-up events within several engine cycles [
9,
10]. The undesired early ignition timing leads to high cylinder peak pressures and, as a result, to a high damage potential. Therefore, the downsizing potential is limited to avoid engine breakdown.
The root cause of this stochastic and hardly predictable phenomenon is not yet clarified. So far, the common sense throughout the literature data is that an oil-fuel droplet or solid-like particle triggers the initial pre-ignition. In both cases, it is assumed that the oil-fuel mixture inside the piston crevice can creep up towards piston top land. At this point, two scenarios are possible:
The liquid fluid detaches from the piston crevice region, or
the hydrocarbons remain at the piston and liner surface and partially oxidize due to the ongoing combustion cycles. This leads to an accumulation of solid porous structures on the piston surface and liner crevice area (bore top) until they break loose due to the reciprocating motion of the piston.
Optical engine testbed investigations support both hypotheses [
5,
6,
9,
11,
12]. The authors observed flying, light-emitting objects inside the combustion chamber from which finally a propagating flame is initiated. None of the observations could determine the origin of the objects, nor could the objects be identified as liquid droplets or solid-like particles.
The possibility of droplet detachments out of the piston crevice has been investigated by Kassai [
11] and Tanaka [
13,
14]. Both authors observed droplet detachments under motored (non-fired) conditions. The droplets were released near TDC, and their diameters were in the range of the piston crevice gap width. Additionally, it could be shown that the viscosity grade of the lubricating oil influences the droplet release probability significantly. This observation is confirmed by numerical simulations of the piston crevice volume using a Volume-of-Fluid (VoF)-approach [
15,
16]. Further on, the influence of fuel spray/wall interaction is also reported by testbed investigations [
5,
17,
18,
19,
20]. Additionally, Amann [
20] observed a significant influence of the piston crevice shape on the PI frequency. He concluded that a deep and minor chamfered piston crevice supports fuel accumulation and, therefore, increases the probability of droplet detachments.
Despite the promising correlations on the PI-frequency and droplet detachment probability, the reactivity of such detachable droplets must be considered. Investigations in rapid compression machines were performed by Fei [
21], Long [
22], and Ohtomo [
23]. These experiments showed a significant influence of lubricating oil on the ignition delay time of a fuel-air mixture. However, the reduction in ignition delay time was not enough to effectively trigger pre-ignition timings, like it could be shown in engine testbed investigations. This circumstance could also be confirmed by numerical simulations considering pure hydrocarbon droplets [
9,
17,
23]. Consequently, somewhat more reactive than detached neat lubricant oil leads to premature ignitions.
On the one hand, a semi-stable intermediate species (Ketohydroperoxides) in the lubricating oil is suggested in the literature to explain this phenomenon. Such species may accumulate over several engine cycles due to the elevated fluid temperature levels [
24]. Although, it must be noted that significant exothermal decomposition was only found at gas temperatures above 680 K [
9].
On the other hand, solid detached structures which survive the gas exchange and achieve a sufficiently high surface temperature to ignite the fuel-air mixture are discussed in the literature [
6,
25,
26,
27]. Okada [
6] and Wang [
26] extended their engine testbed setup by a particle injection device. By using such a device, it was possible to inject a variety of defined particles into the intake manifold. Wang [
26] studied the influence of injected activated carbon particles on the PI-characteristic. It could be observed that sufficiently hot and big carbon particles were able to initiate a pre-ignition. Very small particles (<50 µm) were not able to generate irregular combustions in the investigated initial particle temperature range (573 K–723 K). This result is confirmed by the experiments of Okada [
6], who injected soot collected from the exhaust pipe and artificial generated carbon black (20–100 nm). Furthermore, he used extracted deposits out of the combustion chamber to inject them into the intake manifold. This artificial experiment could reproduce the ‘conventional’ pre-ignition behavior in terms of ignition timings. However, it should be mentioned that milled coffee beans led to a similar result. Besides these combustible substances, none of the non-combustible injected substances could initiate a PI. It should be noted that the initial particle temperature was at room temperature. Therefore, it can be assumed that the inert particles are flushed out of the combustion chamber before achieving a sufficient surface temperature.
Gupta [
27] investigated the experimental results of Wang [
26] numerically, using a simplified 0D-model incorporating an Arrhenius-based ignition approach. The results suggest that initial particle temperatures of <723 K could not trigger a PI in the initial cycle. That concludes that even combustible particles may need several consecutive cycles to heat up sufficiently.
Although very comprehensive studies are already performed, detailed numerical analysis on hot particle-induced pre-ignition as well as direct visual information on the actual initiator (liquid droplet or solid structure) is not very extensive. Therefore, the present work investigates the possibility of oil droplet-induced pre-ignitions using a modern downsized engine with minimally invasive endoscopic optical accessibility incorporating in-cylinder lubrication oil detection via light-induced fluorescence. The optical setup enables the differentiation between liquid droplets and solid structures under LSPI-prone engine operating conditions. Via filtered in-cylinder high-speed observations, fluorescent radiation can be separated from the combustion chamber lighting used as excitation light. Unfiltered observations give very detailed information of the in-cylinder processes before a pre-ignition initiation.
Based on these observations, the potential of hot solid particles to initiate an ignition under engine-relevant conditions is analyzed numerically. The particle is generalized as a hot surface transferring heat to the reactive ambient gas phase. A TRF-air mixture represents the gas-phase reactivity. The composition of the surrogate fuel is selected using the modified linear-by-volume model (MLbV) by Morgan [
28]. This method utilizes the RON/MON specification to calibrate the non-linear fuel reactivity. The chemical processes are predicted using a semi-detailed reaction mechanism by Andrae [
29] (137 species, 633 reactions) in a 2D-DNS CFD simulation framework. Based upon a CFD mixture preparation analysis of the testbed engine setup at hand, the thermodynamic parameters—ambient gas temperature, gas pressure, fuel-air ratio, and particle temperature—are varied to establish a 4D ignition delay map. Further on, this map is used to determine the ability of a hot particle to ignite the surrounding mixture under transient conditions using a Livengood-Wu [
30] ignition integral approach.
2. Experimental Setup and Investigation Methodology
The experimental investigations were carried out on a modern downsized turbocharged engine with gasoline direct injection (4-stroke). For withstanding low-speed pre-ignition operation, the engine is equipped with reinforced connecting rods and pistons with cast-in ring carriers resulting in a slight increase in compression ratio compared to the standard engine. The specifications are listed in
Table 1.
The use of a prototyping engine control unit ensures full control over all engine operational parameters (e.g., turned off knock control). Pre-ignition detection and combustion analysis are carried out via three water-cooled piezoelectric pressure sensors of type Kistler 6041B in the cylinder head, a water-cooled piezoelectric pressure sensor of type Kistler 4049A10 in the exhaust manifold, and a piezoelectric pressure sensor of type Kistler 4075A10 in the intake airbox. In pursuance of optical pre-ignition investigations, the engine is equipped with three minimally invasive optical accesses with sapphire windows (2× lighting, 1× observation) in the cylinder head for the first cylinder. Two water-cooled high-power LED (blue) lighting systems (Ø 4 and 8 mm) with light spectrum adaption via a short-pass filter provide combustion chamber illumination as well as fluorescence excitation. The air-cooled observation access holds a Ø 8 mm endoscope which guides the light to the decoupled high-speed camera (Phantom 1612 with 12 bit COMS Bayer-sensor). The image rate for all results shown is 4.8 kHz which correlates to an angular resolution of approx. 2 °CA at 1600 rpm. A long-pass filtered observation enables the separation of excitation light and fluorescence light.
Figure 1 shows the measurement scheme used for the pre-ignition experiments.
The engine was operated with Coryton Advanced Fuels “High LSPI” fuel and Fuchs Titan Supersyn F Eco DT 5W-30 engine oil. This specific combination leads to a generally increased LSPI occurrence, which is necessary for the optical investigations due to the limited observation time because of window fouling at full load operation. The fuel possesses an increased proportion of high-boiling components in comparison to average RON 95 fuel but is within the DIN EN 228 standard [
31]. Tendentially, this can lead to a greater spray/liner interaction and hence an increased LSPI rate [
5,
10]. The engine oil used has an increased amount of additive (especially calcium) compared to the engine standard oil. Calcium is especially known to promote LSPI tendency [
10]. The operating media specifications are shown in
Figure 2.
For the investigations, a steady-state engine operation at a speed of 1600 rpm with a torque level of 200 Nm (BMEP = 25.2 bar) was applied. All engine parameters were kept constant, charge air and cooling water were conditioned to the set temperatures. Valve timing was set to a fixed valve overlap of 53 °CA resulting in high scavenging operation. Considering the engine downsizing concept, this is necessary to reach sufficient BMEP. At first thermodynamic experiments with test periods of up to 50 k cycles with specific engine parameter setups were used to determine a parameter setup with a sufficient LSPI level for the optical investigations (relatively certain LSPI occurrence within 10 k cycles at the optical cylinder). LSPI detection criterion is defined by exceeding a cylinder pressure threshold of 120 bar and/or a 5% mass fraction burned (MFB) earlier than 11 °CA after top dead center (aTDC). The firing angle was constant at −4° before the top dead center. In each case, this corresponds to the average values at the load point ± four Sigma of the standard deviation. Thereafter optical LSPI characterization in steady-state engine operation with fixed engine parameters was carried out.
Figure 3 shows both applied optical setups and their corresponding combustion chamber view fields. The non-filtered observation (left) setup focuses on the detection of solid particles and the general holistic LSPI process. For light-induced fluorescence in-cylinder oil detection, a long-pass filtered observation was applied (right).
For this purpose, engine oil is mixed with an efficient amount of fluorescence dye (256 mg of Lumilux CD345 for 4.2 L of engine oil).
Figure 4 gives an overview of the used spectral LIF setup at the engine. The fluorescence dye-doped engine oil in the combustion chamber is excited by two spectral adopted LED’s and the fluorescence light is separated via a long-pass filtered (525 nm) endoscopic observation. The used filter setup ensures a clear separation of the excitation light from the stokes shifted fluorescence light.
Global in-cylinder LIF oil detection during engine operation under endoscopic high-speed conditions (short camera exposure time) is very challenging, which is due to the general optical limitations of LIF operation on the real engine system (optical accessibility) and the operating conditions under full load (window fouling). Especially weak fluorescence signals from single small droplets might not be detectable.
3. Computational Methods
3.1. 3D-CFD Mixture Preparation Model
The goal of the mixture preparation model is to achieve detailed information on the thermodynamic conditions inside the combustion chamber during the compression stroke. The computed temporal and spatial distribution of the gas temperature, gas pressure, and lambda scalar values are used as input data to set up appropriate boundary conditions in the subsequent solid particle-induced ignition investigations.
The numerical grid representing one cylinder of the investigated engine was generated using the commercial CFD code SIEMENS StarCD/es-ice version 4.30.029. The simulation domain included the combustion chamber, the piston crevice volume, and the intake- and exhaust ports up to the position of the pressure sensors in the testbed configuration. The piston crevice volume was designed as a structured ring-shaped grid to avoid excessive cell deformation during mesh motion. This static mesh segment was generated using AVL FIRE version v2017d and exported to StarCD/es-ice engine model, where it was coupled to the moving piston and liner via an interpolation interface.
To calculate the droplet trajectories and evaporation appropriately, the mesh base size is set to 0.5 mm. Additional mesh refined (0.25 mm) is performed in the area of the injector tip and the spark plug to account for the high-velocity gradients during the injection process. The cell base size is set according to the extensive evaporation analysis reported in [
32]. This led to a maximum model size of approx. 5 × 10
6 cells at BDC.
The turbulent flow field is calculated using a RANS approach combined with a k-ε RNG turbulence model to capture the conditions of a mean engine cycle.
3.1.1. Modeling of the Liquid Phase
The liquid phase in engine simulations is expected to occur as small droplets or thin liquid films. Therefore, the use of simplified modeling approaches is acceptable [
33]. The dispersed droplets of the injected fuel are represented using the well-known DDM-approach (Lagrangian parcels). The droplet impingement and the resulting film formation on the combustion chamber walls were modeled according to the work of Bai-Gosman [
34]. The liquid phase is modeled without actual volume representation in the numerical grid. The particles and films interact with their environment only by model-based source-terms (energy-, mass-, momentum balance). The thermodynamic properties of the liquid phase are represented by mean values (0D-approach). This assumption is valid if the expected biot-numbers are comparatively small. In the case of high-pressure injection, diameters typically fall below 200 µm and therefore are going to lead to minor modeling errors [
32]. The same applies to liquid films concerning the film thickness.
The governing equations are summarized in
Table 2.
3.1.2. Modeling of the Liquid Fuel Composition
To properly model the mixture formation and fuel vapor distribution inside the combustion chamber, the evaporation behavior of the investigated fuel has to be considered. Therefore, a multi-component surrogate approach is chosen to replicate the distillation measurements according to ASTM D86 [
35] and DIN EN ISO 3405 [
36]. The selection of the species composition is based on a developed 0D-distillation model. The validated model is described in [
32] in detail.
In this investigation, a synthetically mixed blend from Coryton advanced fuels Ltd. is used. It fulfills all standards of commercial gasoline, although it should be mentioned that it contains a higher amount of low-volatile components that results in a higher temperature of the final boiling point for the reasons described in
Section 2. By utilizing the mentioned distillation model, 11 species could be found iteratively to suit the distillation curve and the basic chemical composition of the fuel blend.
Figure 5 and
Table 3 show the final result of the surrogate composition and the calculated distillation curve.
3.1.3. Spray Modeling
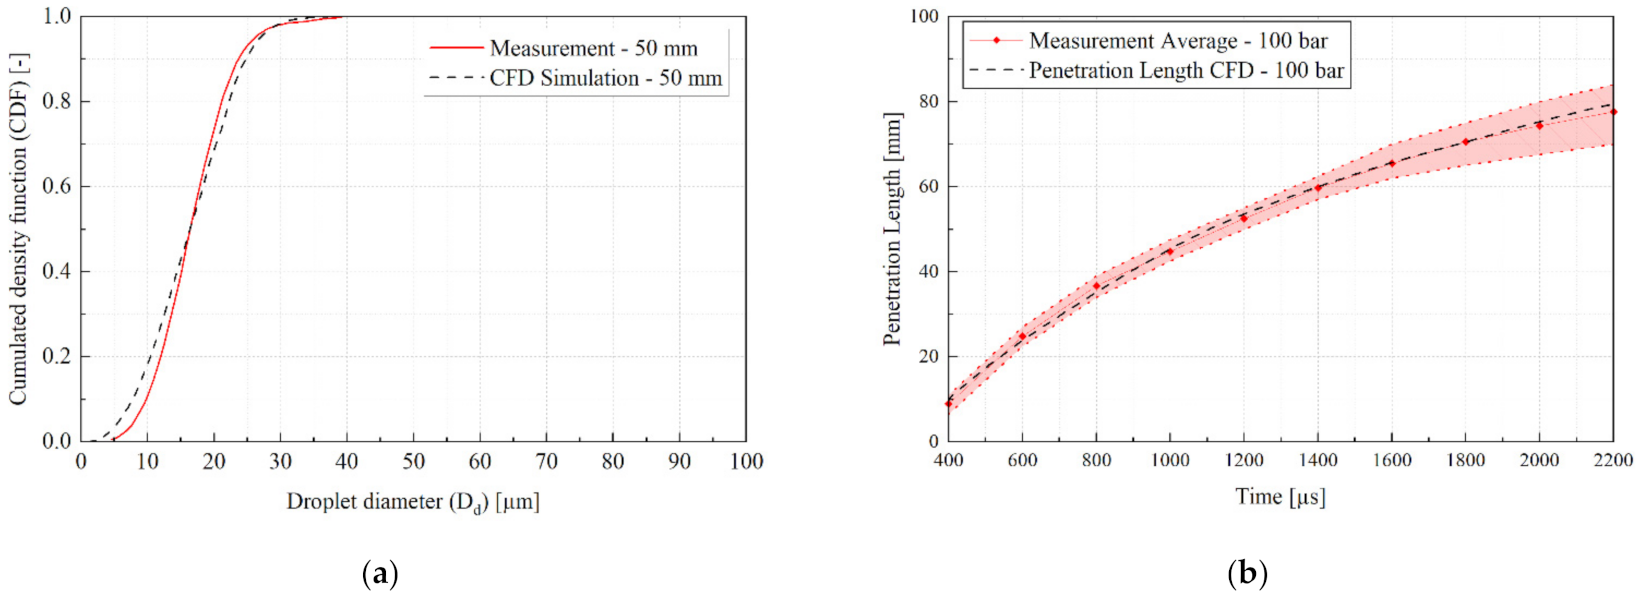
To properly fit the numeric models, spray measurement data were conducted and supplied by the manufacturer.
Table 4 summarizes the available measurement data performed with n-heptane. The spray spectrum was characterized by a PDA analysis at a distance of 50 mm from the spray tip. The penetration length of the spray was measured using high-speed imaging. The orientation of every spray coil was measured using the footprint method. All measurements were performed at a rail pressure of 100 bar and an ambient pressure of 1 bar.
The numerical simulations were performed using a box-shaped grid. The cell base size is set to 0.5 mm and is additionally refined to 0.25 mm around the spray tip area (5 mm radius). These settings are in accordance with the resolution of the engine model grid. The secondary breakup of the Lagrangian parcels due to aerodynamic forces is considered by using the Reitz–Diwakar model [
37]. The choice of the used breakup model is based on a review of the gasoline spray modeling of Duronio [
38] and investigations performed by Paredi [
39]. The latter compared different breakup models on an Engine Combustion Network (ECN) Spray G Injector (Multi-hole injector, p
Inj = 200 bar). He observed that the liquid and vapor penetration lengths are best predicted using the Reitz–Diwakar secondary breakup model.
To maintain the validity of the DDM approach (low liquid volume fraction, discretely distributed parcels), the primary breakup was not modeled explicitly. Instead, the initial droplet spectrum was described by using a Rosin–Rammler distribution, shown in Equation (1).
X and
q represent empirical parameters to calibrate the distribution function. The initial droplet velocity was estimated using Equation (2).
Aeff represents the effective nozzle hole cross-section area. Since the mass flow measurements showed an almost linear relationship between the injection duration and the injected mass, the mass flow rate is set constant for simulation purposes.
As a result, the described spray model offers three optimization parameters (
X,
q,
Aeff) to fit the spray model to measurement data.
Figure 6 shows the results achieved for a parameter set of
X = 2.7 × 10
−5,
q = 1.7, and an effective nozzle hole diameter of 125 µm.
The spray setup needs to be adjusted for the CFD-engine model due to the different liquid densities (fuel vs. n-heptane) and the higher ambient pressure under boosted engine operation conditions. Assuming that the discharge coefficient remains constant in both operating conditions, the mass flow rate can be estimated according to Equation (3).
By performing this calculation under the assumption of an average in-cylinder pressure of 2.5 bar (abs), the mass flow rate increases from 25.70 kg/h to 26.65 kg/h due to the higher fuel density.
3.1.4. Droplet—Wall Interaction
The droplet-wall interaction is modeled according to the adjusted Bai–Gosman impingement map of Heiß and Fischer [
9,
40,
41]. This phenomenological model determines the impingement behavior based on the wall temperature and the incoming Weber number. Regarding the wall temperature, two regime limits are implemented. Below the deposition temperature limit T
S*, the impinging droplets can form a liquid film (Stick-, Spread- and Splash-regimes). Above T
S*, the droplets are entirely rejected, and breakup regimes occur with respect to the droplet Weber number. The second temperature-based limit is the Leidenfrost limit (T
L* > T
S*), suppressing the modeled heat transfer completely. Although the formed vapor cushion isolates the droplet from the wall, there is still a heat transfer. Wruck [
42] argued that the complete isolation assumption is an unphysical representation of the Leidenfrost effect. Therefore, the deposition limit T
S* is set to the actual Leidenfrost temperature of gasoline (=1.47 * T
sat), and T
L* is modified to an arbitrarily high value to eliminate the regime from the simulation.
3.2. Detailed Hot Particle Ignition Model
Besides oil-fuel droplets, detached particles are assumed to be a potential root cause of pre-ignitions. To determine the gas-phase ignition potential caused by a hot particle, a DNS CFD analysis is performed.
Regardless of the unknown history of detached particles inside the combustion chamber as well as their potential exothermal reactivity, hot objects induce an ignition by heat transfer. Therefore, the solid particles are simplified as a spherical hot surface in the simulation model. A minimum cell size of 1 µm accompanied by a radial stretching factor of 1.01 ensures a sufficiently high resolution of the thermal boundary layer [
43,
44]. The instantaneous wall heat flux can be defined according to Equation (4)
In this equation, y represents the wall-normal direction, TG is the gas mixture temperature, and kG is the thermal conductivity of the gaseous phase.
To reduce the overall computational effort, the simulation task is solved on a structured cylindrical 2D 90° sector mesh. The simulation domain is enlarged to 25 times the particle radius to minimize the influence of boundary conditions.
The surrounding gas phase was modeled as a mixture of air (76.8%-m/m N
2, 23.2%-m/m O
2) and fuel. The fuel is represented by a TRF-surrogate. The three components (iso-octane, n-heptane, toluene) are mixed according to the RON and MON specifications to predict the actual fuel reactivity. A mixture composition could be found iteratively by applying the modified linear-by-volume method of Morgan [
28].
Table 5 shows the achieved TRF-surrogate composition.
The chemical reaction kinetics are calculated in the gas phase using the semi-detailed TRF mechanism of Andrae [
29], including 137 species and 633 reactions. To determine the ignition delay time, a consistent ignition criterion is needed. If an established propagating flame front reached a critical radius of 0.5 mm, the flame was assumed to be self-sustaining. Numerically, this criterion is checked by observing the maximum gas temperature trace in all cells at a radius of 0.5 mm. The simulation time at the highest observed gradient is defined as ignition delay time (
. The critical radius was set according to Kalghatgi [
25], who published the critical radius for n-heptane/air mixtures under similar conditions.
4. Results and Discussion
4.1. Experiments
LSPI frequency can be greatly influenced by specific engine operation parameters under a given set of operating media.
Figure 7 shows the results of the thermodynamic steady-state LSPI characterizations. A near-standard engine parameter application (orange) showed an inadequate LSPI level for the optical investigations, with nine LSPI events per 50 k engine cycles. By adapting individual parameters, an engine operating state with 53 LSPI events per 20 k cycles (black) could be achieved. This engine operation state (“LSPI critical”) was mainly used for the following optical investigations. The increased LSPI frequency can be attributed to a decrease in coolant water temperature and an injection strategy with increased spray/liner interaction, resulting mainly from a retarded start of injection (SOI). These dependencies are widely known in several publications [
5,
10,
45,
46]. The thermodynamic conditions of the “LSPI critical” engine conditions provided the setpoints for the numerical investigations.
4.1.1. LIF In-Cylinder Oil Detection during “LSPI Critical” Engine Load Point
During steady-state engine operation with “LSPI critical” parameter setup and fluorescence dye-doped oil, no fluorescence could be captured. Also, LSPI events did not show a history of detectable oil fluorescence. Only in the case of very strong knocking with severe in-cylinder pressures and pressure oscillations caused by glowing object initiated LSPI an oil droplet/mist detachment is visible. This fact was also hypothesized in [
10,
47] and thus, confirmed by these experiments.
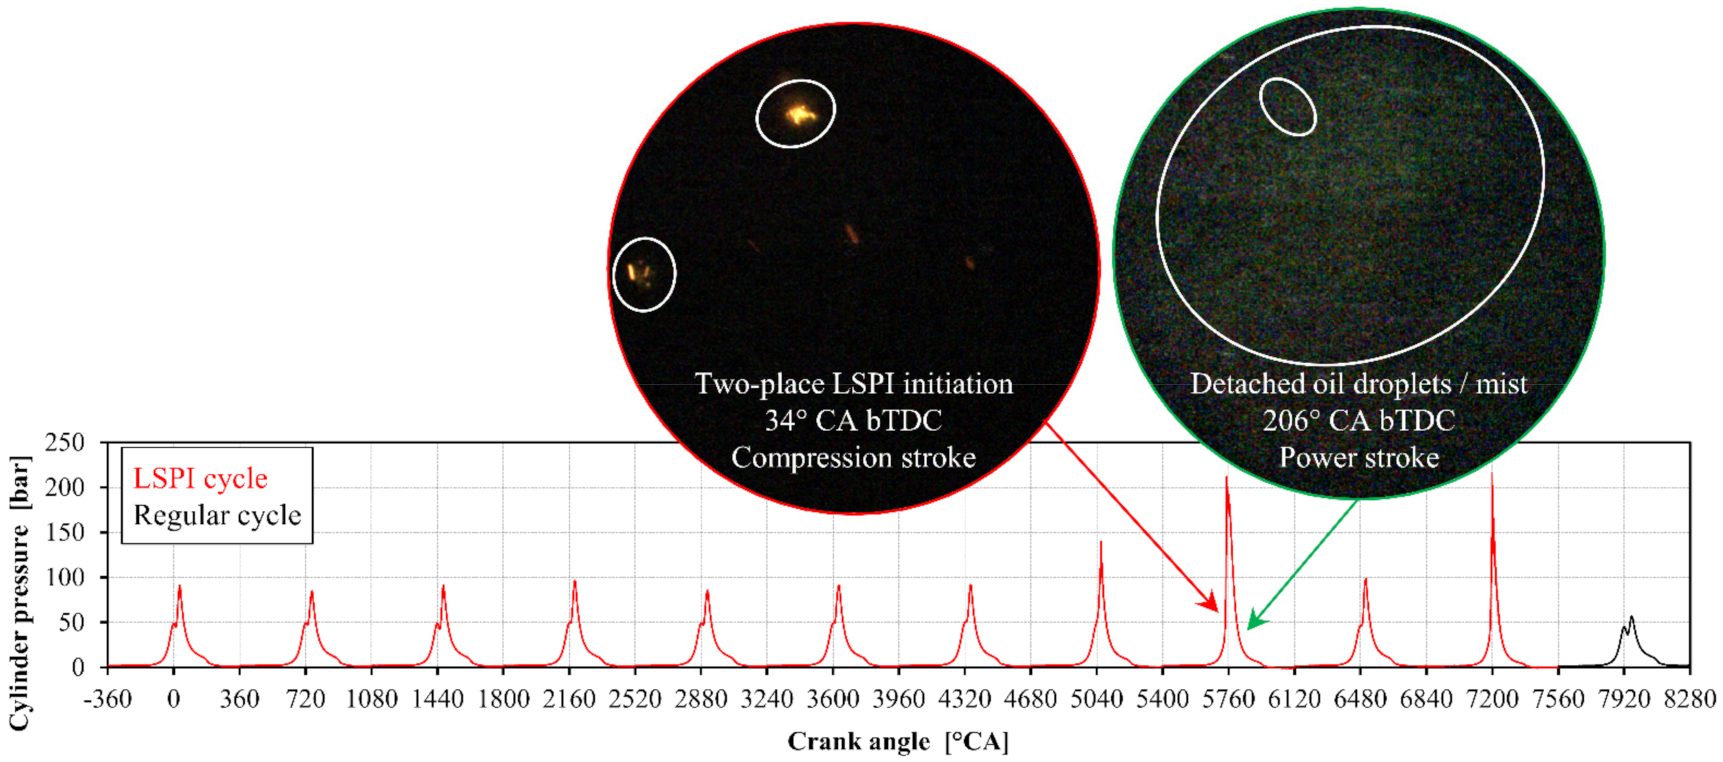
Figure 8 shows a series of very mild pre-ignitions (only optical detectable; not counted in the aforementioned pressure-based detection method), ending with two pre-ignitions leading to strong knocking. The red circle shows the history of LSPI initiation by several glowing objects leading up to a very early combustion start. In the following power stroke (green circle), oil detachment does happen.
In sum, even considering the LIF system limitations, there is no experimental evidence from the LIF investigations that support an oil droplet/fluid-induced LSPI initiation. All captured LSPI events showed a glowing object history with no detectable fluorescence light. In the case of an oil droplet-induced LSPI event, a fluorescence history to an initiation event or LSPI initiation without optical history would be expected.
The following results are derived from non-filtered LSPI observations and give deeper insights into the LSPI processes. First, the typical LSPI combustion pattern is discussed (
Figure 9), thereafter the specific LSPI initiation characteristic within this environment is shown (
Figure 10), and finally, the nature of LSPI initiating objects are being explored (
Figure 11 and
Figure 12).
4.1.2. LSPI Combustion Pattern
Figure 9 shows a typical course of an LSPI event at “LSPI critical” operating point. The cycle before pre-ignition does show a typical combustion pattern with a strong pool-fire presence. Pre-ignition is initiated by a glowing object which initiates flame propagation near the piston head and the spark plug. The glowing object starts to become visible in the compression stroke and bounces off the inlet valve (solid character) on its way following the present tumble flow. The cycle after pre-ignition shows a large amount of burning particles after combustion initiation by the spark plug. By the gas exchange with scavenging due to valve overlap, the particle amount decreases with every following cycle until the combustion pattern returns to a prior pre-ignition state.
4.1.3. LSPI Initiation by Glowing Objects
The occurring LSPI events within the “LSPI critical” operating point show a distinctive initiation characteristic, shown in
Figure 10. All captured pre-ignitions showed a glowing object history. These objects mainly become visible in the compression stroke and are of a similar size. They follow the tumble flow (first and third circle) or dive into the piston crevice area (fourth circle) before initiating flame propagation. In general, no spatial distribution trend of LSPI initiating areas can be identified. Since these objects have been experimentally excluded from being oil droplets, the following results hint further towards solid particle-induced LSPI processes.
4.1.4. The Nature of LSPI Initiation Objects
Figure 11 and
Figure 12 give deeper insight into the matter of these LSPI initiating glowing objects. In
Figure 11 in circles 1–3, a glowing object in the compression stroke can be observed that bounces off the inlet valve while following the tumble flow before initiating LSPI. Thereby it doesn’t change its shape wherefrom a solid character can be derived. These objects are further called (solid) particles. The 4th circle shows a particle in late power stroke in a post LSPI cycle bouncing of the mass electrode of the spark plug. Also, the detached particles from knocking combustion initiated by LSPI show a solid character.
Figure 12 shows glowing particles in cold in-cylinder environments. Circle 1 shows a glowing particle in intake stroke short after injection start. At this state, fresh air at 313 K is still forced into the cylinder resulting in low gas temperatures. Circle 1* represents the inverted green channel of the high-speed camera at this time. In circle 2 a glowing particle in early compression stroke with approximately similar gas temperatures can be observed. Analogous, the inverted green channel of this time is shown in circle 2*.
Since the color and spectral response curve of the Phantom camera used corresponds to a good approximation to the human eye, a conservative temperature appraisal can be made using the Draper-point [
48]. Assuming a black body radiator, the Draper-point at 798 K represents the temperature at which a glowing object starts to become visible to the human eye in a dark environment (dark red). Given the fact that the captured glowing objects are even clearly visible at the green channel, one must assume that the temperatures of these particles are well over the Draper point.
These circumstances hint towards a possible reactive nature of these particles.
4.2. Mixture Preparation
The goal of the simulation is to predict the mixture preparation process inside the combustion chamber. Therefore, the simulation time is limited to one engine cycle. The start of calculation is set to 270 °CA aTDCf to minimize errors resulting from the initialization process. The simulation ends at spark timing. The trapped residuals in the combustion chamber are neglected in the initialization due to the scavenging operation strategy. Nevertheless, to validate this assumption, a passive scalar is introduced to track the remaining residuals. The model is parameterized according to measurement data achieved running the engine at the “LSPI critical” operation point, described in
Section 4.1.
The in-cylinder pressure during the compression motion is used as an indicator to ensure the validity of the CFD model predictions. The pressure trace is described by the pressure at IVC, the compression ratio, and the isentropic exponent, considering idealized isentropic conditions. The latter is a function of the gas temperature and its composition, influenced by the fuel evaporation rate. The comparison between the calculated in-cylinder pressure and the pressure trace measured during the experiments is shown in
Figure 13. Additionally, the uncertainty bandwidth of the measurement data is displayed, represented by min/max values.
The comparison shows a good agreement between the simulation setup and the experimental data. Only a minor deviation from the mean pressure trace can be observed near TDC. Nevertheless, the simulated data just falls within the lower uncertainty band of the measurements.
The evaluation of the residual gas mass inside the combustion chamber after EVC confirmed the initially made assumption. The mass fraction of the residual gas tracking passive scalar is well below 0.01.
The fuel-air ratio and the gas temperature distribution during the compression phase can be extracted using this setup.
Figure 14 shows a scatter plot of the post-processed result near TDC.
The scatter plot’s color bar represents the volume fraction of the cylinder charge where the x- and y-axis values are fulfilled. The data is clipped at a minimum threshold of 0.2%.
The figure displays the situations at 680 °CA, 700 °CA, and TDC. In the shown timespan, the mean lambda value of 0.82 remains almost constant. Due to convective and diffusive transport, the relatively wide lambda distribution gets narrower towards TDC and ranges from 0.5 to 1.25. It can be observed that the fuel-rich zones remain until spark timing. This results from liquid fuel films on the piston and cylinder liner surface accumulated during the injection process. The wall heat transfer controls the fuel evaporation rate and leads to fuel-rich zones near the liquid puddle. Nevertheless, in this particular case, the heat transfer is insufficient to evaporate the film until the end of simulation completely.
The ongoing compression leads to an increase in the mean temperature level. As a result, the temperature difference between the walls and the gas phase increases. Therefore, the gas temperature bandwidth tends to increase towards TDC slightly.
Furthermore, it can be observed that the displayed parameters are not entirely independent. For example, fuel-rich areas appear to be colder than lean regions. This is caused by the cooling effect of evaporating fuel droplets and films.
4.3. Generation of an Ignition Delay Map
To determine the hot particle-induced ignitability under in-cylinder relevant conditions, a set of pre-calculated cases are used to set up a 4D ignition delay look-up table. The thermodynamic conditions of the ambient gas phase (T
G, λ, and p
G) are set based on the results achieved in the mixture preparation analysis, shown in
Figure 13 and
Figure 14. In contrast, the particle temperature is fairly unknown. The optical observation suggests a particle temperature well above 800 K. Therefore, seven different fixed particle temperatures, ranging from 1000 K to 2000 K, are used in the simulations. As a result, 336 CFD simulation cases are conducted and post-processed.
Table 6 shows the investigated parameters in the DoE simulation setup. Additionally,
Figure 15 shows a particle and gas temperature sweep at 10 bar and 50 bar gas pressure and an air-fuel ratio of 0.8. All simulation results are listed in the
Appendix A.
It can be observed that the ignition delay time converges towards 3~10 °CA for particles hotter than 1500 K. At this temperature, the used chemical reaction mechanism predicts an immediate ignition in the numerical cell next to the particle surface. Therefore, the results achieved are primarily reflecting the influence of the thermodynamic conditions on flame propagation.
In the case of particle temperatures below that threshold, the particle heats up the ambient gas phase, and as a result, increases the chemical reaction speed over time. Although the build-up of a radical pool is decelerated due to diffusive transport compared to a homogeneous reactor case, the influence of the particle temperature on the ignition delay time can be described by an exponential law (R
2 > 0.95;
Figure 16a).
The initial gas temperature dictates the overall reaction/auto-ignition speed of the ambient far-field. Considering the extended Arrhenius approach to calculate chemical reaction speeds, it is not surprising that the effect of the initial gas temperature on the ignition delay time follows an exponential law (R
2 > 0.99;
Figure 16b). Furthermore, high gas temperature levels reduce the temperature gradient to the particle surface, and as a result, decelerates the diffusive “loss” of radicals in the hot zone. Therefore, the gas temperature influence reduces gradually with increasing particle temperatures.
High gas pressure levels increase the concentration of reactants per unit volume and therefore accelerating the reaction speed. Typically, the pressure influence in simplified knock/auto-ignition models is considered by a power-law (p
G-B), whereas B is reported to be 1.685 for commercial gasoline fuel [
49,
50]. A power law characteristic can still be found in the investigated cases with reasonable accuracy (R
2 > 0.91;
Figure 16c). However, the reported B is measured under homogeneous conditions and is only valid for the setup mentioned in the literature. In this study, exponent B is continuously dropping with increasing temperature levels. Especially, high
T-cases (=T
p−T
G) showed a significant reduction of the power-law characteristic (B = ~0.4) and finally inverses in cases using particle temperatures above the discussed critical threshold of 1500 K. The change in the found characteristic expresses the transition towards a flame propagation problem. In contrast to the gas-phase ignition delay time, the flame propagation speed decreases with increased pressure levels.
A similar trend can be found when considering the air-fuel ratio. Lowering the lambda-value, the concentration of reactants increases, and inert species’ dilution (N
2) is reduced. As a result, an exponential decrease in the calculated ignition delay times can be observed (R
2 > 0.98;
Figure 16d). The exponential character changes to a 2nd order polynomial character at high particle temperature levels within the investigated range of air-fuel ratios. At such conditions, the minimum ignition delay times are predicted at λ~0.9, where the flame speed reaches its maximum.
4.4. Application to Transient Boundary Conditions
To use the generated 4D ignition delay map under transient boundary conditions, an ignition integral approach is introduced in analogy to the proposed method of Livengood and Wu [
30]. The integral calculates the consumption of ignition delay time under the current thermodynamic conditions, shown in Equation (5).
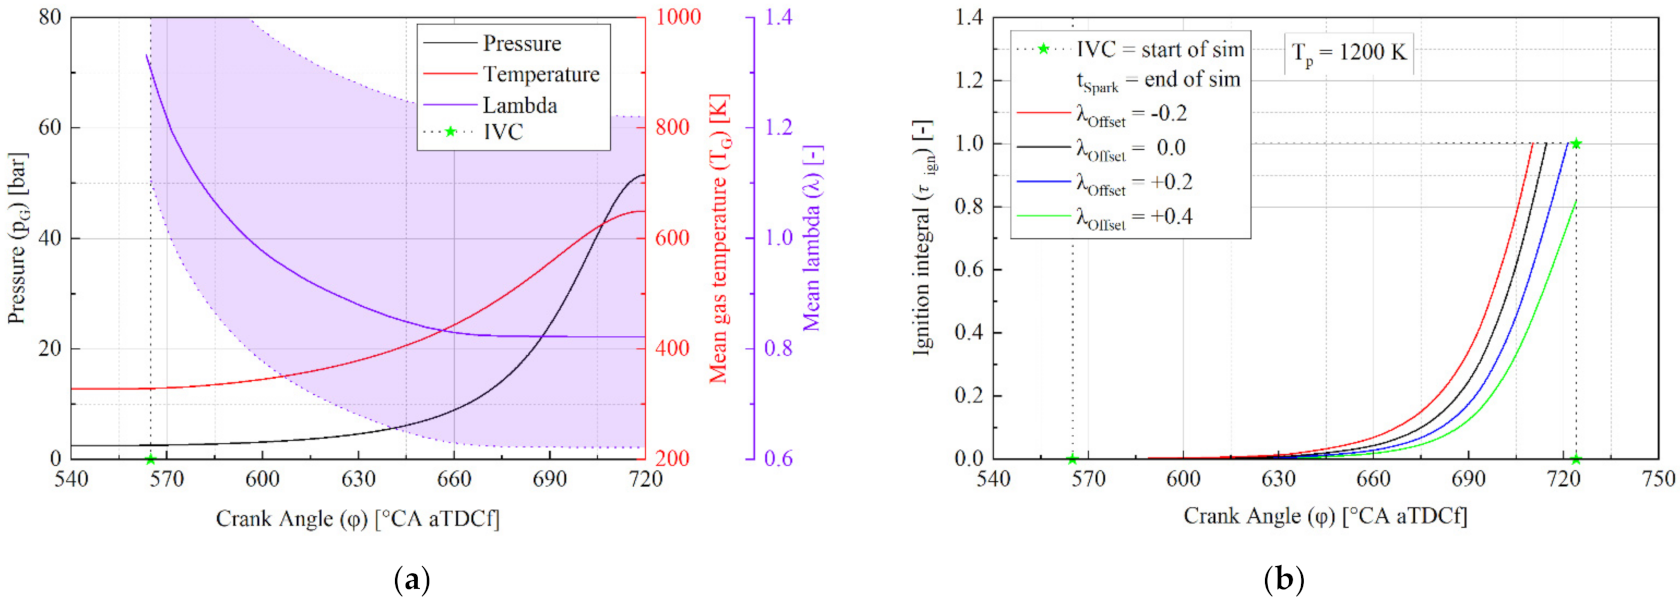
To determine the ignitability of hot particles under engine-relevant conditions, the methodology is applied to mean in-cylinder conditions of the “LSPI critical” operation point. The exported data of the CFD model is shown in
Figure 17a.
The calculation of the ignition integral starts at IVC and ends at spark timing. Considering the data obtained in
Section 4.3, it can be assumed that the thermodynamic condition during the gas exchange is not prone to premature ignitions. Therefore, this time period is neglected in the simulations. The performed testbed investigation also confirms this assumption. The earliest observed PI-events were at −20 °CA aTDCf, and no ignitions were detected during the gas exchange process.
Figure 17b shows the temporal evolution of the results achieved using constant particle temperatures ranging from 800 K to 1400 K.
It can be observed that the ignition integral barely increases before 660 °CA. Prior to this crank angle, the reactivity of the gas phase is low due to the low pressure (<10 bar) and gas temperature (<450 K) levels. Only very hot particles (TP ≥ 1400 K) can consume a significant amount of the ignition delay in the early compression phase. This reflects the decreasing sensitivity of the thermodynamic boundary conditions of hot particles.
By iterating the particle temperature, a minimum critical value of 1167 K can be found. At this temperature, the particle is predicted to induce an ignition at spark timing and therefore represents the absolute minimum temperature under the investigated conditions.
Since the history of a potential ignition-inducing particle is unknown, it may be detached at some point during the compression phase and lead to ignition in the same cycle. Furthermore, reported pre-ignitions are observed well before spark timing. Therefore, the start and end of the simulation were varied to investigate the sensitivity of the particle release and the ignition timing. The results achieved are shown in
Figure 18.
The blue line displays the results achieved by delaying the particle’s release time while maintaining the desired ignition time at the end of the simulation (spark timing). It clearly shows the minor impact of the early compression phase. The critical particle temperature increases by only 2 K when the release timing shifts from IVC to 660 °CA. On the other hand, an earlier ignition requirement increases the necessary particle temperature significantly. The desired ignition timing of 700 °CA aTDCf results in a temperature demand of at least 1289 K. This matches approximately the temperature requirement of the time period from 710 °CA to 724 °CA aTDCf. Considering the highly non-linear influence of the gas pressure and temperature, the simultaneous increase of these parameters results in a sharp gradient in ambient gas reactivity towards TDC.
4.5. Sensitivity of Thermodynamic Parameters
Since the shown data is generated using the mean in-cylinder conditions under a specific load point, the sensitivity of the thermodynamic boundary conditions is addressed in this section. To do so, the air-fuel ratio, the initial air temperature as well as the initial gas pressure are varied individually. In contrast, the particle temperature is set to 1200 K. Considering mean engine conditions, the predicted ignition timing is 714.6 °CA aTDCf. In this analysis, the simulation duration is reset to IVC and spark timing, respectively. The results achieved are shown in
Figure 19,
Figure 20 and
Figure 21.
Considering the variation of the initial gas pressure, the analysis aims to cover the conditions from normally aspirated engines up to highly boosted conditions. Since the compression ratio in normally aspirated engines is typically higher than in boosted ones, a pressure of 30 bar at TDC is considered normally aspirated. The simulation predicts no PI in the normally aspirated case, consistent with reported data in the literature. However, the sensitivity appears to be remarkably low. A reduction of 0.5 bar in boost pressure is necessary to shift the predicted ignition timing to TDC (=5.4 °CA). A similar low sensitivity can be observed in the case of the air-fuel ratio. Simulations were conducted within the range of λ = 1.22 to 0.62, covering both lean and very fuel-rich homogeneous operation conditions. In this analysis, over-stoichiometric conditions are required to reduce the reactivity of the ambient gas sufficiently to suppress a premature ignition.
Higher sensitivity can be found when considering the initial gas temperature (representing the effectiveness of the intercooler setup). A 50 K hotter charge temperature leads to a 7.7 °CA earlier predicted ignition. Nevertheless, a reduction of 47 K (TG,IVC = 278 K) is required to suppress an ignition before spark timing.
The change in the predicted ignition timing for a 10% increase is calculated to establish comparability between the individual parameters. The reference values and the results are summarized in
Table 7.
Overall, particle temperature appears to be by far the most sensitive parameter. Considering experimental observations, high boost pressures and especially lean operation conditions are reported to increase the PI-frequency [
5,
8]. Concerning the ambient gas reactivity, this effect cannot be explained.
Since the particle temperature is set constant in this investigation, the contraindicated lambda sensitivity and the low influence of the gas pressure suggest that these parameters are cross-influencing the apparent particle temperature. This leads to the conclusion that the ignition-inducing particle is reactive in nature.
5. Summary & Conclusions
The experimental investigations showed a great LSPI frequency influence by specific engine operation parameters at steady-state engine operation. Engine operation parameters that tend to increase spray/liner interaction significantly increase LSPI. Subsequent LIF investigations could not capture oil droplets prior to LSPI initiation. Only in the case of super-knock caused by LPSI oil droplet/mist detachment could be observed. However, all recorded LSPI events did show a history of glowing objects initiating combustion at various combustion chamber places. These objects behave like solid structures considering the observed rebounds from the inlet valves. Also, the objects detached by LSPI and subsequent knocking, responsible for the characteristic post-LSPI combustion pattern, showed a solid character by rebounding on the mass electrode of the spark plug at exhaust stroke. The presence of bright glowing particles with temperatures above 800 K at cold combustion chamber conditions hints towards a reactive nature of these particles.
Overall no experimental evidence for oil droplet-induced LSPI could be found. The results indicate a glowing particle-driven LSPI initiation.
Therefore, the potential of a hot particle-induced pre-ignition was investigated numerically. The particle was generalized as a hot surface transferring heat to a reactive ambient gas phase in a DNS CFD simulation framework. The reactivity was modeled according to RON/MON specification using a TRF surrogate. To determine appropriate thermodynamic boundary conditions, the mixture formation process was investigated using an additional CFD model of the engine setup. Based on the post-processed scatter band of the gas temperature, gas pressure, and air-fuel ratio, a set of parameters could be defined to investigate the hot particle ignition potential in a DoE manner. The application to transient boundary conditions was achieved by introducing an ignition integral approach in analogy to the well-known Livengood-Wu knock integral.
By using this method under mean in-cylinder conditions, a minimum critical particle temperature of 1167 K could be found, considering a particle introduction at IVC and an induced ignition at spark timing. Since LSPIs are observed well before spark timing, the influence of the release- and the ignition timing were investigated. An ignition requirement of −20 °CA aTDCf increases the necessary particle temperature by ~120 K, whereas the shift to a later particle introduction time appeared to be insignificant up to 660 °CA aTDCf. Prior to that crank angle, the observed reaction kinetic speed is insignificant due to the low gas temperature (<450 K) and pressure (<10 bar) levels.
Since the discussed investigations were performed considering only one particular engine operation point, a sensitivity analysis of the thermodynamic parameters was performed. The variation of each individual parameter (TP, TG, pG, λ) showed that the most influencing parameter is the particle temperature. In contrast to testbed investigations reported in the literature, the gas pressure and the air-fuel ratio appeared to be the least sensitive parameter in the model at hand. Furthermore, the air-fuel ratio showed a contraindicated behavior in the simulations compared to experimental data.
This leads to the conclusion that these parameters are cross-influencing the results. As the particle temperature is held constant in the numerical simulations, possible exothermal reactions of the particle itself resulting in a feedback loop of the ambient conditions to the particle temperature are omitted. Assuming reactive particles, higher boost pressures, and leaner operation conditions increase the partial pressure of oxygen in the combustion chamber and may result in a higher achievable particle temperature. Therefore, the results of the established model indicate that the ignition-inducing particle is reactive in nature.


