Abstract
For every nine tons of produced biodiesel, there is another ton of glycerol as a byproduct. Therefore, glycerol prices dropped significantly worldwide in recent years; the more significant biodiesel production is, the more glycerol exists as a byproduct. glycerol prices also impact the biodiesel manufacturing business, as it could be sold according to its refinement grade. The primary objective of this work was to evaluate the economic potential of the production of 1,2-propanediol derived from the biodiesel produced in Colombia. A plant to produce 1,2-propanediol via catalytic hydrogenation of glycerol in a trickle-bed reactor was designed. The plant comprised a reaction scheme where non-converted excess hydrogen was recycled, and the heat generated in the reactor was recovered. The reactor effluent was sent to a separation train where 98% m/m purity 1,2-propanediol was attained. Capital and operational costs were estimated from the process simulation. The net present value (NPV) and the modified internal return rate (MIRR) of the plant were used to assess the viability of the process. Their sensitivity to key input variables was evaluated to find the viability limits of the project. The economic potential of the 1,2-propanediol was calculated in USD 1.2/kg; for the base case, the NPV and the MIRR were USD 54.805 million and 22.56%, respectively, showing that, for moderate variations in products and raw material prices, the process is economically viable.
1. Introduction
The current models of production and consumption are affecting the world, producing inequality and environmental damage. Studies show that the increment of biobased products is more effective in the reduction of greenhouse gases (GHG) [1,2]; moreover, using an alternative to fossil resource that fulfills the same technical requirements as its fossil counterpart is defined as adding value [1]. Biodiesel is an attractive added value bioresource. Since it is carbon-neutral and compatible with the petroleum-based fuel supply infrastructure, it can reduce the transport sector’s greenhouse gas (GHG) emission, estimated as 15% of the total GHG emissions [3].
Developing countries such as Colombia implemented laws such as 693 from 2001 and 939 from 2004, which ruled blends between biofuels as well as gasoline and biofuels mixtures for diesel engines; these laws promoted new business opening in bioethanol and biodiesel production enterprises. As of today, Colombia’s biodiesel production capacity is estimated at 591 tons per year. Between 2009 and 2013, Colombia’s biodiesel production grew 197.1%. An increasing biodiesel production trend across the globe was also observed [4], but its negative impact on markets such as glycerol was evident.
Biodiesel production is commonly done via catalyst-based transesterification. In this type of reaction, for every 9 tons of produced biodiesel, there is another ton of glycerol as a byproduct [5]; therefore, glycerol prices dropped significantly worldwide [6]. The larger the biodiesel production is, the more glycerol there is as a byproduct. Lower glycerol prices also impact biodiesel production, as it could be sold depending on its refinement [7,8]. The opportunity to make biodiesel production plants more profitable by generating added value products using glycerol as a raw material source would impact the biofuels market, making it nearly as profitable as Petro fuels [9]. Increasing the availability of carbon-neutral commodity chemicals and contributing to the implementation of circular economy biorefineries [1].
Glycerol can be used to obtain several commodity chemicals, especially but not exclusively by chemo-catalytic methods [10,11,12]. Glycerol can be catalytically oxidized using Pd, Pt, and Au as catalysts to obtain dihydroxyacetone (DHA) [13,14], hydroxypyruic acid (HYPA) [14], and glyceraldehyde (GLYALD) [15,16], which can serve as final products or intermediaries to other commodity chemicals such as formic acid and lactic acid [11]. It can also be dehydrated to obtain acrolein, a chemical intermediate to produce acrylic acid esters and polymers [17]. In the presence of metallic catalysts and hydrogen, the selective hydrogenolysis of glycerol can also be carried on producing 1,2-propanediol [18] or 1,3-propanediol [19,20].
The 1,2-propanediol is one of the most promising platform chemicals, as it is a raw material for polyester unsaturated resins, a solvent, an antifreeze agent, and an additive in food and cosmetics [18,21,22]. As shown in [8], the calculated sales price/total production cost ratio of 1,2-propanediol is 1.57, making it a high added value product compared with acrolein (1.34) and PHB (1.42). Therefore, the production of 1,2-propanediol from glycerol derived from biodiesels production would add value to the biodiesel production chain and become an alternative source of carbon-neutral commodity chemicals for several industries. It would to some degree, reduce the carbon footprint of well-established processes that are already buying petroleum-derived 1,2 propanediol in Colombia.
This work is the technical and the economic analysis of a 1,2-propanediol production plant that uses glycerol, a byproduct of Colombian biodiesel’s production. Technological aspects such as reaction technology selection, separation train design, and non-converted reactants recycle are addressed, while their impact on the process capital and the operational cost is calculated.
2. Materials and Methods
2.1. Raw Materials and Products
2.1.1. Glycerol
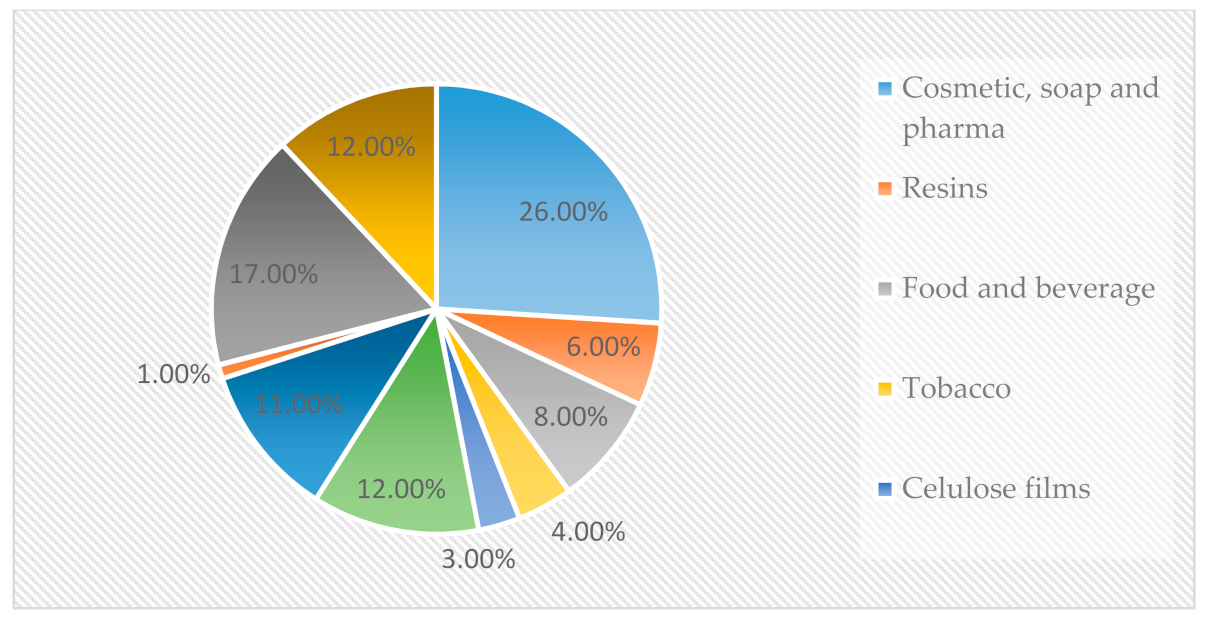
The (1,2,3-propanetriol) can be found as a component of different fatty acids, which are present naturally, forming triglycerides. At least 10% of total fatty acids are glycerol. Glycerol is found on many industrial products, and it is practically on almost every modern day life product. Figure 1 shows the consumption proportion from different industries regarding glycerol as raw material. Therefore, the glycerol market is vast, and it can be purchased at different concentrations or grades. The glycerin obtained from the biodiesel production line is called raw glycerin. It can be refined to reach United States Pharmacopeia (USP) standards or the Food Chemical Codex (FCC) standards for pharmaceutical or food industry products.

Figure 1.
Glycerol consumption distribution (%) [21].
Raw glycerin composition is rich in methanol, water (12% max), soaps, and 80% to 88% glycerol. On technical grade commercially traded items, glycerin is a clear liquid substance with a 98% minimum glycerol content, and no water, methanol, or salts are expected to be present. USP glycerin is a highly refined substance that complies with the USP standards monitored and controlled by the United States Food and Drugs Administration (FDA) (SRS Engineering, 2013).
2.1.2. Hydrogen
Hydrogen worldwide production is as high as 54 million tons. In total, 95% of the total output comes from production facilities that use it as raw material in their production lines. Only 5% is sold but only to nearby facilities [22]. Most of the hydrogen also comes from fossils fuels such as natural gas. However, production processes are already tested to obtain hydrogen from biomass [23].
2.1.3. 1,2-Propanediol
Additionally, known as propylene glycol, it has a market value estimated at 1.58 million tons per year. It is the primary raw material on the polyester unsaturated resin manufacturing business used in construction and transport companies. At least 75% of total polyester unsaturated resins are reinforced with fiberglass and substances to reinforce plastics, making them highly resistant and light-weight [24]. Propylene glycol is also used as a solvent in anti-freezing industry, freezing media in the food industry, and even polyglycol industry responsible for the hydraulic braking systems industry. Recent studies indicated the rising concerns on ethylene glycol and its toxicity; therefore, a rise in the propylene glycol demand as a substitute for ethylene glycol could be expected.
2.2. Glycerol Catalytic Conversion to 1,2-Propanediol
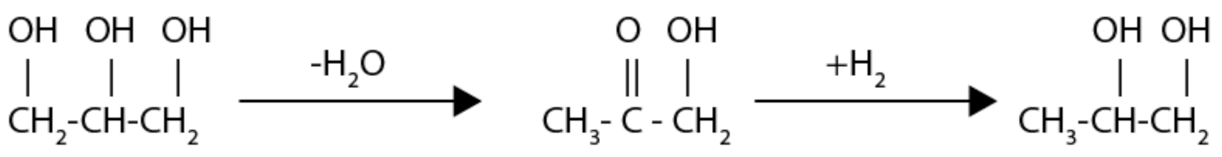
Glycerol is the primary raw material for 1,2-propanediol, ethylene glycol, and other sub-products such as lactic acid, acetol, and prop-2-enal as well as degradation products such as methanol and carbon dioxide, methane, and propanol [25]. The dehydration–hydrogenation reaction seen in Figure 2 was achieved in the presence of Cu-based catalysts [26,27,28]. In [29], two adsorption sites were assumed in the reaction mechanism, and a Langmuir–Hinshelwood kinetics was proposed. Therefore, for the reactor design, the kinetic model expressed by Equations (1) and (2) extracted from [28] was used.
where is the acetol formation rate, is 1,2-propanediol formation rate, is molar concentration, the adsorption constant, is hydrogen pressure, and the sub-indexes , , , and stand for acetol, glycerol, 1,2-propanediol, and hydrogen, respectively. The reaction and the adsorption constants were modeled according to Equations (3) and (4), and the parameters of Table 1 obtained in [28] were used.
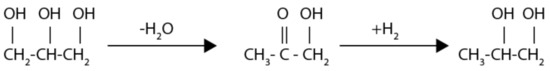
Figure 2.
Two-step mechanism proposed by Dasari et al. [25].

Table 1.
Kinetics parameters from Zhou et al. [28].
Table 1 constants and are based on and , respectively, is on , and the activation energy is on . These constants were experimentally obtained for a Cu-ZnO-Al2O3 catalyst on a 1:1:0.5 molar proportion and a 0.17 particle size by Zhou et al. [28]. The selectivities used in the present for these reaction conditions were 93.4% for 1,2-propanediol, 1.2% for acetol, 2.7% for ethylene glycol, and 2.7% for other compounds such as methanol, ethanol, and propanol [28].
2.3. Reactor Technology Selection and Design
There is a significant industrial background for the trickle bed reactor (TBR) technology for hydrogenolysis, hydrodesulfurization, hydrocracking, and hydro-refinery processes [30,31]. Therefore, this reactor type was selected as the most suitable technology to obtain 1,2-propanediol. The reactor operates using a liquid and gas phase percolation through a fixed catalytic bed on a co-current operation (ideal operation is assumed). Thus, the gaseous phase is the continuous one, while the liquid phase creates a thin film that descends and covers the surface of the catalyst particles. This kind of reactor enables continuous operation, high pressure operating conditions, and a more considerable length to diameter (L/D) ratio.
Conversely, low mass transfer coefficients limit the reaction process as the catalyst gets partially covered with the liquid [31]. The reactor was simulated with the RStoic model in Aspen Plus using the selectivity mentioned above, operating adiabatically at 5 MPa and an outlet temperature of 243.588 °C. The calculations of the mass transfer limitations and the reactor sizing were done using Matlab® with the methodologies developed in [31,32]. For the solution of the model presented in Equations (5) and (6), catalysts deactivation mechanism was assumed (coke formation) as 14 h according to [33].
where , and are the 1,2-propanediol, glycerol mole flows inside the reactor, is the wetting of the catalyst surface calculated as in [31], and is the bed voidage calculated for the HIFUEL W220 [34] from Alfa Aesar, which is the commercially available catalyst more similar to what is described in [28].
2.4. Design and Simulation Methodology and Considerations
The economic analysis for the 1,2-propanediol produced from biodiesel’s glycerol and the conceptual process design were performed using Aspen Plus and Aspen Economic Analyzer software. The thermodynamic model used for liquid phase simulation was non-random two liquids [35], and for the gas phase, the Redlich–Kwong model [36].
The process comprises two stages—the reaction and the heat recovery stages—where the glycerol is converted, the excess hydrogen is recovered, and the purification stage occurs, where the 1,2 propanediol is recovered with 99% purity.
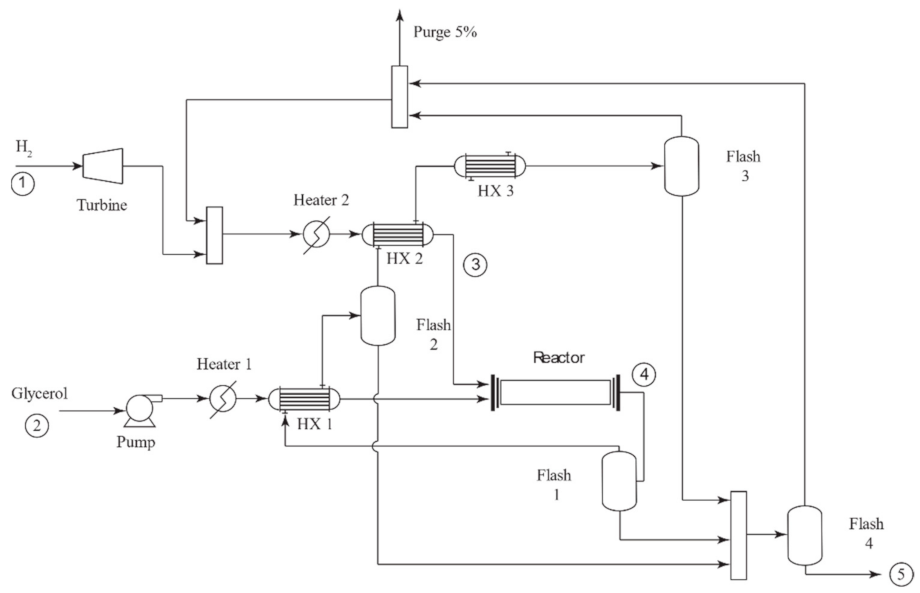
The reaction and heat recovery process diagram is shown in Figure 3. The outlet temperatures on heat exchangers HX1 and HX2 were optimized to reach the maximum energy recovery. Feeding proportion rates between glycerol and hydrogen were set to 5:1 as suggested in the literature to achieve the 1,2-propanediol formation [25] successfully. As the hydrogen proportion is five times larger than glycerol, considering that the stoichiometric ratio is 1:1, the excess of hydrogen must be recycled. Therefore, the reaction process design considered heat exchangers and flash separators to recover a fraction of the heat generated during the reaction step and use it as heating media on the reactor’s inlet stream. A stoichiometric reactor was selected for the simulation, assuming 100% glycerol conversion and the selectivity mentioned earlier.
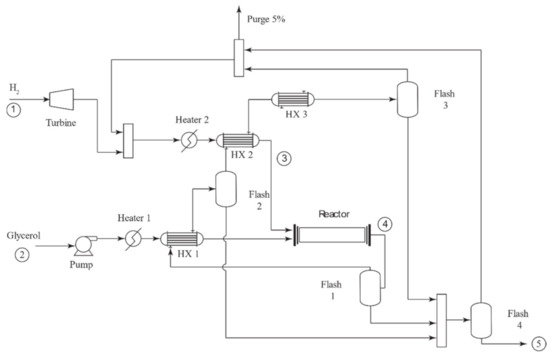
Figure 3.
Reaction process flow diagram.
As the reactor effluent was rich in excess hydrogen, successive cooling and condensate recovery in flashes 1, 2, 3, and 4 allowed the recovery of the excess hydrogen that was recirculated and combined with the fresh feed. The reactor scheme was designed using a hierarchical approach [37,38] combined with optimization of key temperatures [39,40] to achieve an effective recovery of the heat generated in the reactor.
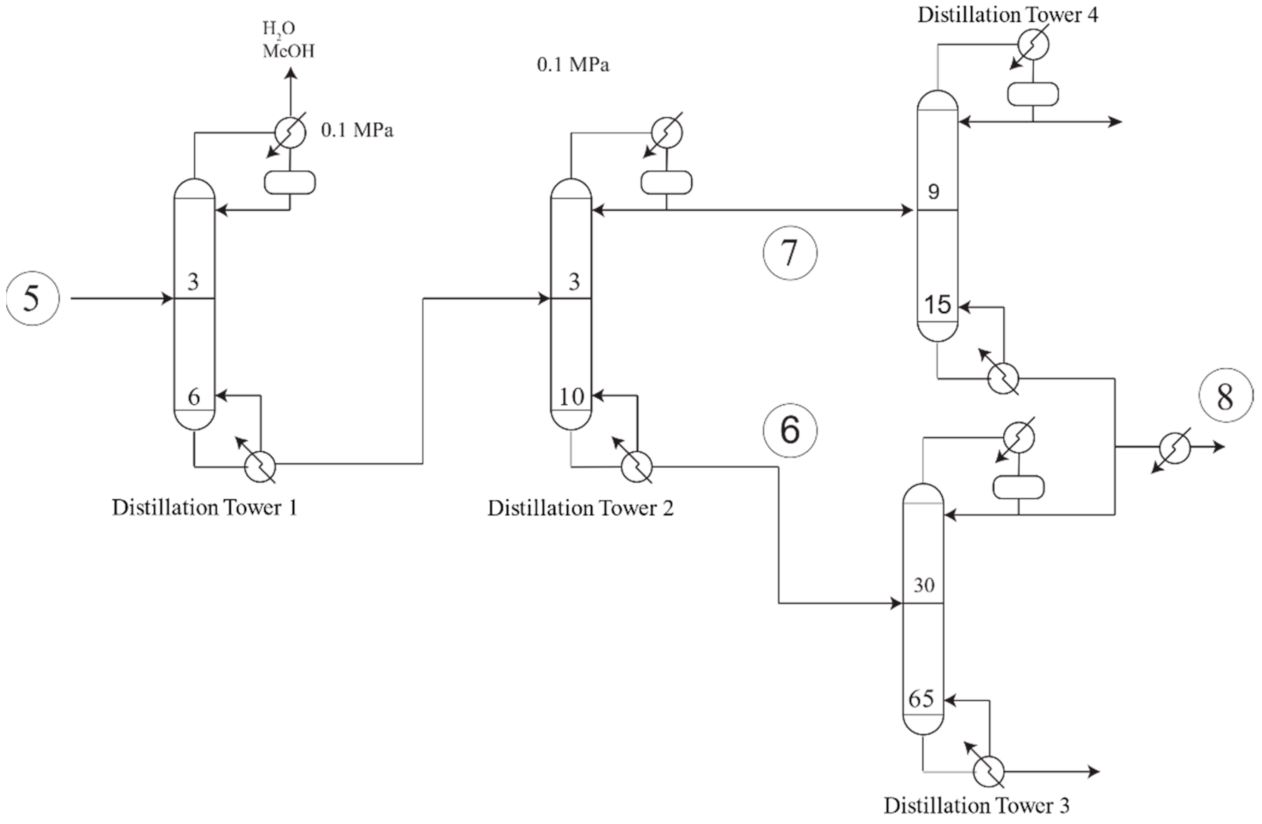
Figure 4 illustrates the distillation process. After the reaction process step was completed, hydrogen traced, and the other two most volatile compounds were removed from reaction products at the first distillation tower. In the next distillation tower, the lightest compounds such as acetol and propanol were separated from ethylene glycol. However, as 1,2-propanediol has a mid-boiling point, thus it could be found at both the top of the distillation tower (stream 7) and the bottom of the distillation tower (stream 6). In order to refine 1,2-propanediol up to 99% purity, it was necessary to take stream 7 to a distillation tower where volatile compounds such as acetol were separated from 1,2-propanediol, which came out of the bottom of the distillation tower. Stream 6 was also taken to a 65 stages distillation tower to isolate ethylene glycol from 1,2-propanediol; in this step, 1,2-propanediol came out of the top of the distillation tower. Both streams were then mixed and then cooled to 25 C in stream 8 to reach 99% purity.

Figure 4.
Separation process.
Distillation was first designed using the Winn-Underwood-Gilliland equations, which are included on the DSTWU unit from Aspen Plus. Once the initial design parameters were estimated, the RadFrac module from Aspen Plus was used, and the parameters were adjusted to fulfill the design specifications more precisely. The distillation train was designed based on non-sharp distillations to separate the ethylene glycol and the 1,2-propanediol which have close boiling points [41,42].
Production Rate Based on the Colombia Case Study
A private association in Colombia in which some of its primary responsibilities include the national alcohol sustainable production supporting, enabling, and designing the regulations required for biofuels production and usage. This federation is called Fedebiocombustibles; according to them, biodiesel production during 2017 was 460.121 tons [43]. As stated earlier, for every 9 kg of produced biodiesel, another kilogram of glycerol is produced. Thus, an average production of 4.260 tons of glycerol every month was estimated. In this paper, it is assumed as a calculation base that 3.924 kg/h of glycerol will enter our reaction process.
Another critical assumption is the glycerol quality, which was selected as raw glycerin. After the preliminary isolation and purification process, salts and other compounds are separated from our inlet stream, leaving 84% glycerol, 1% methanol, and 14% water as total stream composition. Hydrogen comes as a pure gas from an available storage tank at 1.000 psi of pressure, and the hydrogen pressure must be reduced as low as 734.8 psi via turbo expansion [28].
2.5. Economic Analysis Methodology and Considerations
Economic analysis was done based on material and energy balances from process simulation for a plant that processes 3.924 kg/h of glycerol to produce 2514.84 kg/h of 1,2-propanediol. Aspen economic analyzer was selected as the calculation engine. Initial parameters fed to the software were aligned with Colombia’s economic benchmarks using US dollars as reference coin and a 10-year operation period, with 52 weeks/year and 24 h/day. An annual interest rate of 17%, straight-line depreciation, and a 34% tax rate were also considered to model project economics outcomes. Labor costs of USD 2.14/h for the operator’s labor time and USD 4.29/h for supervisors were used. Power cost was estimated at USD 0.03044/kWh, and other utilities such as water (USD 1.252/m3) and low-pressure steam (USD 8.18/ton) were also included [8,44]. A glycerin cost of USD 0.2/kg and a hydrogen cost at 1000 psi of USD 2/kg were selected as the base case for calculations. USD 1.54/kg for the 1,2-propanediol price was assumed considering historical data presented in [45] and information from local importers in private communications.
The economic assessment of the process was performed based upon the concept of money time value under the discounted cash flow (DCF) methodology [1,46]. Based on this methodology, the net present value (NPV) and the modified internal return rate (MIRR) were selected as the plant’s profitability indices. The following models were used to calculate the profitability indices:
where is the net cash flow, is the discount rate, is the future value of the cash flows at the reinvestment rate, is the present value of the negative cash flows at the finance rate, is the period, and is the number of periods of the analysis. The economic analysis was performed based on the variation of the net present value (NPV) and the modified internal return rate (MIRR) with the baseline prices of glycerin, hydrogen, and 1,2-propanediol. The catalyst price was estimated fixed at USD 95/kg, yet the refresh rate of the catalyst and its regeneration remain uncertain, and most of the consulted studies are still in early stages [18,33,47,48] for the specific reaction; therefore, the refresh rate of the catalysts was introduced as an input variable to calculate the viability of the project.
3. Results
As a result of applying the methodology, the plant simulations were followed by an optimization procedure to adjust the system to design specifications. The data obtained from the plant simulation economic analysis revealed the economic potential of the process and its sensitivity to relevant input variables. The lack of information impeded the catalysts’ deactivation simulation; therefore, the catalyst refresh rate was added as an economic input variable, and the plant’s NPV was analyzed.
3.1. Reactor Design
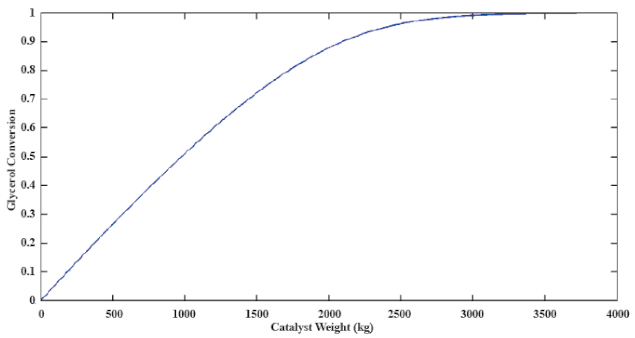
With the same methodology used in [31,32], the total catalyst required to reach a 100% conversion was calculated. Equations (1)–(4) with the parameters reported in Table 1 were used as the trickle bed reactors’ kinetic model described by differential Equations (5) and (6). Figure 5 shows the results from the simulation used to design the reactor, where 3700 kg was calculated as the necessary mass of catalysts to carry on the reaction.

Figure 5.
Catalyst’s mass required to reach 100% glycerol conversion.
3.2. Simulation and Design Results
Table 2 shows process stream compositions and temperatures for the simulated process. It was observed that, even though the distillation system includes four distillation towers, stream 8, which is the final product stream, had a 99% mass fraction for 1,2-propanediol but still had a 1% mass fraction of ethylene glycol.
3.3. Estimated Capital Cost
The total project cost of capital was USD 15,456,582.64, out of which USD 6,757,832 were associated with direct cost and can be seen in Table 3, USD 1,796,000 were related to indirect construction and installation cost, and USD 7,094,051 were administrative and non-field costs. The total cost included process unit procurement and installation costs, instrumentation, pipelines, steel procurement, civil and electrical works, and isolation where required.
Table 3.
Detailed direct costs of the plant in USD.
Table 4 shows the cost of all the process equipment in the plant. As expected, the most expensive fixed costs were the reactor (including catalyst) and the distillation train. Nevertheless, the catalyst was not a fixed cost, as it must be refreshed periodically. The catalyst’s stability was a concern, as it is a key factor for the plant’s operation.
3.4. Estimated Profit and Operational Cost
Operational cost reached USD 10,002,707.23/year; raw materials, operational labor, utilities, and general and administrative costs were also included in the income statement calculation.
As it can be observed in Table 5, raw materials were as high as 85.73% of the total operating cost.
Table 5.
Manufacturing unit operational cost.
Due to the heat recovery proposed early in the design phase, fluid services cost was lower than administrative cost. If the total production was sold, the net income could reach USD 38,490,503.50/year, enough to cover the cost of capital by two. 1,2 Propanediol economic potential was calculated at USD 1.2/kg.
Table 6 shows the cost of heating and cooling in the exchangers of the plant. A factor that allowed us to diminish the heating utility expenses recycled the heat generated in the reactor, which was recovered using HX1 and HX2 with a combined heat duty of 400.1052 kJ/s. The cooling water mass flow was 406,604.837 kg/h, and the steam flow was 5665.7344 kg/h for the heat duties reported in Table 6.
Table 6.
Heating and Cooling duty of the plant.
3.5. Sensitivity Analysis
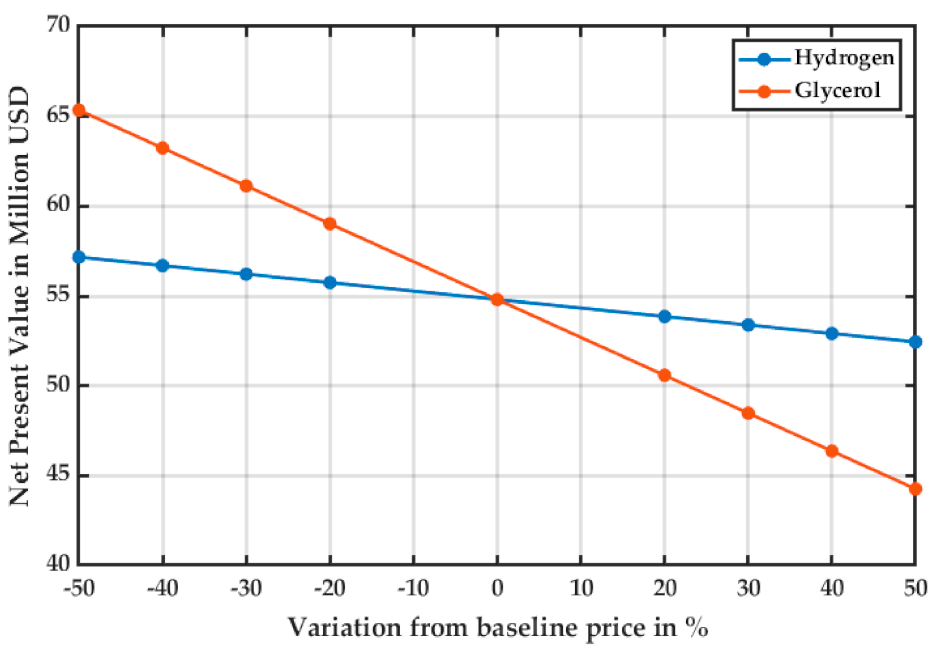
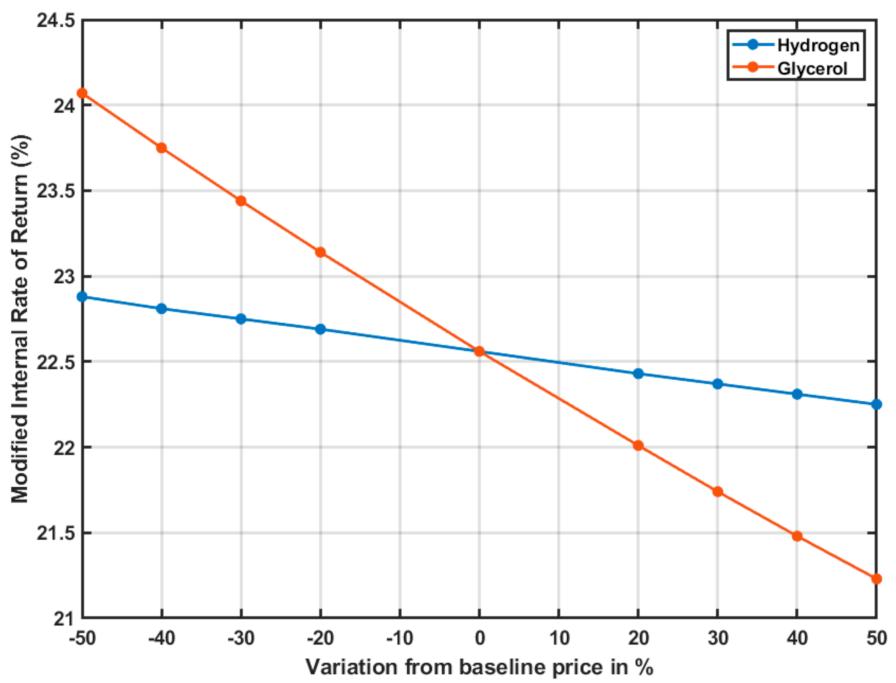
The economic viability of the project is dependent on the cash flow of the plant. The net present value (NPV) of the project is sensitive to economic changes such as the variability of the raw materials cost and the product’s sales price. For the base raw material costs and product price, the NPV of the project for a 10-year period is USD 54,805 million, and the modified internal rate of return (MIRR) was 22.56%.
Figure 6 and Figure 7 show the variations of the NPV and the MIRR as raw materials prices varied from the baseline case established in Section 2.5.
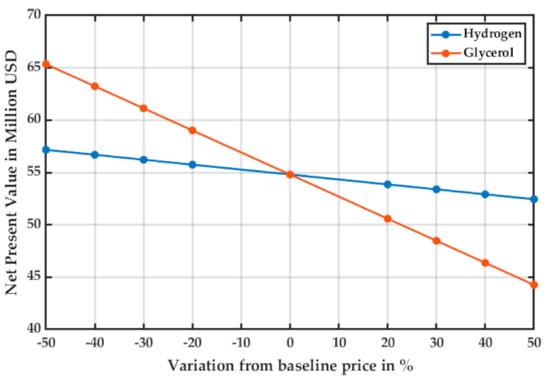
Figure 6.
Sensitivity analysis for the NPV of the project as the raw material cost varies.
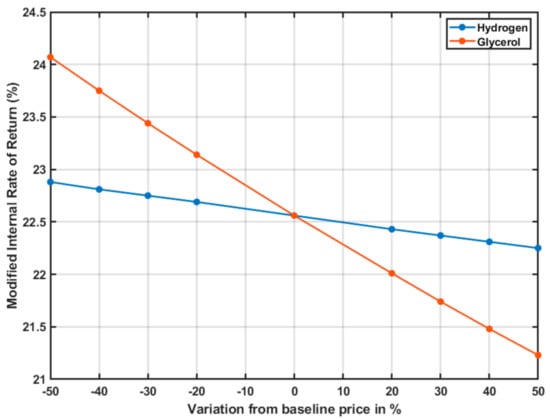
Figure 7.
Sensitivity analysis for the MIRR of the project as the raw material cost varies.
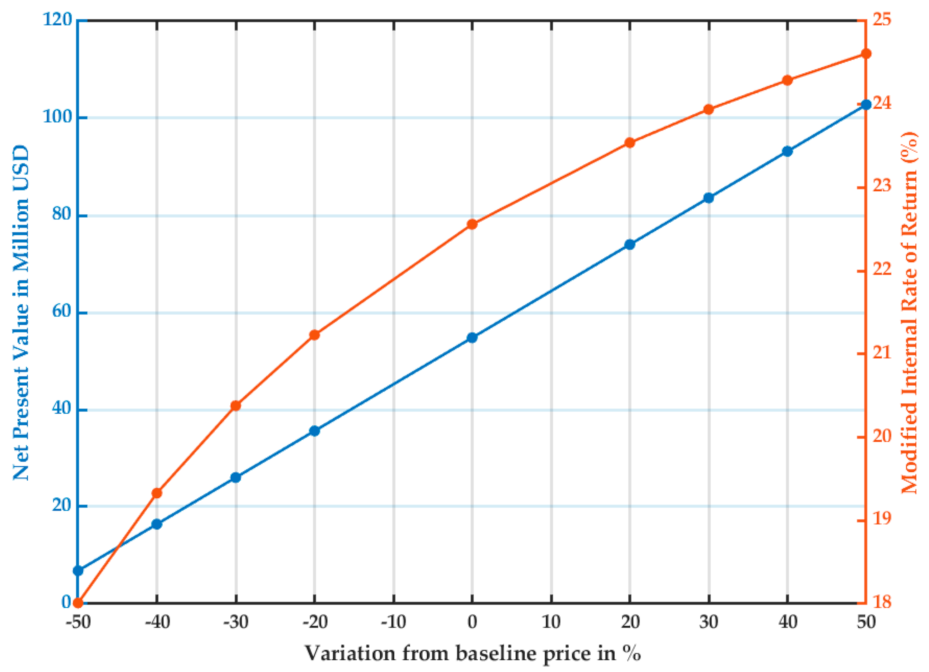
Figure 8 shows the sensitivity of the project to the sales price of the product. The actual price of 1,2-propanediol allowed the project to be profitable, yet the project was most sensitive to the high prices of the product. The MIRR presented a nonlinear variation with the product price, which was not observed with the raw materials.
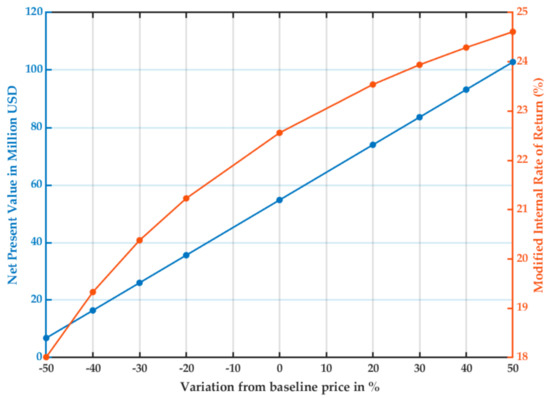
Figure 8.
Sensitivity analysis for NPV and MIRR of the project as the sales price of 1,2-propanediol varies.
Figure 9 shows how the NPV varies as the catalysts must be replaced as it deactivates. The deactivation amount is expressed in spent catalyst per year/reactor’s catalyst capacity.
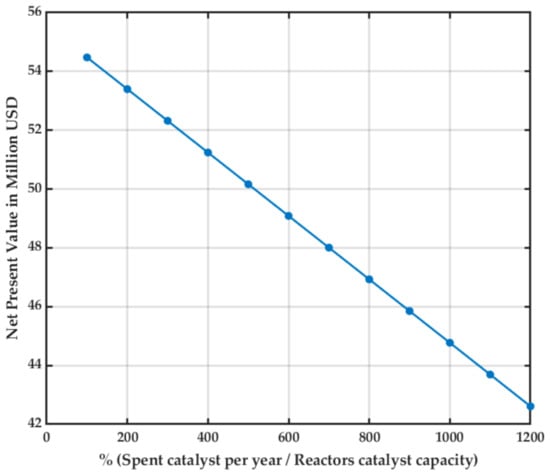
Figure 9.
Sensitivity analysis for the catalysts refresh rate.
4. Discussion
This work explored a promising way to take advantage of the residual glycerol from biodiesel production based on the Colombian industrial context. The conceptual design and the economic analysis of the production of 1,2-propanediol were performed without neglecting the byproduct formation. As a result, a small ethylene glycol fraction was formed. Its higher boiling point altered the distillation column train design strategy for a non-sharp distillation, which resulted in efficient recovery of 1,2-propanediol. Consequently, operational and capital costs would rise; this portrays a more realistic economic analysis of the selected catalytic and the reaction technology in the separation train. With all these considerations, the profit margin remains attractive for investment.
The reactor technology selection led to a three-phase reactor in which a complex mass transfer process took place. Therefore, a much more complicated model was used for the sizing of the reactor, leading to the calculation of a 3700 kg catalyst load, which would allow a high conversion of glycerol, avoiding its presence in the separation train which would raise the utility costs, as glycerol normal boiling point is 290 °C.
The high temperature of the reactor allowed the recovery of 400.1052 kJ/s used for heating the inlet streams; this accounts for a 12% reduction in the heating costs compared to the total heating duty of the plant without the thermal energy recycle. The excess hydrogen required for the reaction to take place was recycled with high purity.
The capital cost estimation led to a USD 5,456,582.64 where the process equipment cost account was 17%, and electrical, instrumentation, and piping costs were 21.8%. This means that the initial investment was significant, and with a process start-up period of 20 weeks, the process reaches the equilibrium point after the second year.
Raw materials accounted for 85.73% of the operational costs, and all the plant’s income was calculated based on the 1,2-propanediol as the only product. Therefore, these were the key input values for economic analysis. The net present value (NPV) measured the economic potential and the risk of commercialization of the current process; the positive NPV meant that the process was profitable. With a base NPV of USD 54.805 million for a 10-year period, the sensitivity analysis showed that the plant profitability depended on the sale price of 1,2-propanediol followed by the glycerol cost, which highly depended on its availability. The modified internal return rate MIRR assumed that any positive cash flow was reinvested at the external rate of return, making this a more accurate way to measure the viability of the project. As with NPV, the tendencies were the same; the plant was highly dependent on the variability of the 1,2-propanediol price followed by the glycerol price.
A non-accounted factor during the design due to the lack of mathematical models was the catalyst’s refresh and regeneration rates. In consequence, the impact of the catalyst’s refresh rate was analyzed. In conclusion, the plant is not viable (NPV < 0) if the catalyst has to be totally replaced every seven days, much less than expected of a commercial catalyst. This factor highly affects the plant’s economy, and further research must be done to establish its deactivation mechanism and exact cost.
5. Conclusions
The conceptual design and the economic analysis of a process are potent tools for possible solutions to existing problems—in this case, the surplus glycerol produced by the biodiesels industry in a country such as Colombia. Nevertheless, many assumptions induce uncertainty to the result in this analysis. In this case, logistics costs analysis was not considered, as there is not enough information to predict the distribution chain of glycerol in the country, especially for a facility as big as the designed one, with the country’s biodiesel production scattered across the territory. The availability of data on the reaction also limits the reach of the predictions; most of the available kinetics were obtained at a laboratory scale under particular conditions. Yet, an effort was made to use the intrinsic kinetics combined with the mass transfer equations to dimension the reactor as accurately as possible. Although the deactivation kinetics of the chosen Cu/Zn/Al2O3 is not available, it was possible to consider its economic effect on the plant. Accurate calculations are possible, especially in the separation where most of the utilities are spent, and, therefore, energetic predictions are considered reliable. The estimates of operational costs, raw material prices, and product prices are also accurate, as they are done based on the literature and well-known analysis methodologies and software.
With the above-mentioned limitations, the potential of the 1,2 Propanediol production as an alternative for re-valuing raw glycerin is high, since the production costs and the revenues exceed capital costs in the long term, even under moderate variations on feedstock costs. In the short term, the project would start being profitable after the second year. Since glycerol production is increasing worldwide, all alternatives should be considered to produce added value processes that make the biodiesel refinery more profitable and promote carbon-neutral alternatives to petroleum-derived products.
Author Contributions
Conceptualization, J.B.R. and A.J.B.; methodology, J.B.R.; investigation, J.B.R. and C.D.P.-A.; writing—original draft preparation, J.B.R.; writing—review and editing, J.B.R., C.D.P.-A. and A.J.B.; supervision, A.J.B.; project administration, C.D.P.-A.; funding acquisition, C.D.P.-A. All authors have read and agreed to the published version of the manuscript.
Funding
This research was funded through the project “Proyectos I+D Para Promover el Desarrollo y la Transferencia Tecnológica De Cadenas Productivas Agroindustriales y la Implementación de Tecnologías de Ultima Generación para el Procesamiento de Biocombustibles en el Departamento del Atlántico” Grant: “Convenio UNINORTE - Gob Atlántico: 0103_2013_000014”, through the general royalties System of Colombia (Sistema General de Regalías). The APC was funded by Universidad del Norte Barranquilla-Colombia.
Acknowledgments
Especial thanks to the Universidad del Atlántico in Barranquilla for the ongoing support and funding of Juan B. Restrepo’s research in biofuels.
Conflicts of Interest
The authors declare no conflict of interest.
References
- D’Adamo, I.; Falcone, P.M.; Huisingh, D.; Morone, P. A circular economy model based on biomethane: What are the opportunities for the municipality of Rome and beyond? Renew. Energy 2021, 163, 1660–1672. [Google Scholar] [CrossRef]
- D’Adamo, I.; Falcone, P.M.; Morone, P. A new socio-economic indicator to measure the performance of bioeconomy sectors in Europe. Ecol. Econ. 2020, 176, 106724. [Google Scholar] [CrossRef]
- Alhindawi, R.; Abu Nahleh, Y.; Kumar, A.; Shiwakoti, N. Projection of Greenhouse Gas Emissions for the Road Transport Sector Based on Multivariate Regression and the Double Exponential Smoothing Model. Sustainability 2020, 12, 9152. [Google Scholar] [CrossRef]
- Raturi, A.K. Renewables 2019 Global Status Report. Available online: https://www.ren21.net/gsr-2019/ (accessed on 17 April 2021).
- Karinen, R.S.; Krause, A.O.I. New biocomponents from glycerol. Appl. Catal. A Gen. 2006, 306, 128–133. [Google Scholar] [CrossRef]
- Quispe, C.A.G.; Coronado, C.J.R.; Carvalho, J.A., Jr. Glycerol: Production, consumption, prices, characterization and new trends in combustion. Renew. Sustain. Energy Rev. 2013, 27, 475–493. [Google Scholar] [CrossRef]
- Chiu, C.-W.; Dasari, M.A.; Sutterlin, W.R.; Suppes, G.J. Removal of residual catalyst from simulated biodiesel’s crude glycerol for glycerol hydrogenolysis to propylene glycol. Ind. Eng. Chem. Res. 2006, 45, 791–795. [Google Scholar] [CrossRef]
- Posada, J.A.; Rincón, L.E.; Cardona, C.A. Design and analysis of biorefineries based on raw glycerol: Addressing the glycerol problem. Bioresour. Technol. 2012, 111, 282–293. [Google Scholar] [CrossRef]
- Lari, G.M.; Pastore, G.; Haus, M.; Ding, Y.; Papadokonstantakis, S.; Mondelli, C.; Pérez-Ramírez, J. Environmental and economical perspectives of a glycerol biorefinery. Energy Environ. Sci. 2018, 11, 1012–1029. [Google Scholar] [CrossRef]
- Zhou, C.-H.C.; Beltramini, J.N.; Fan, Y.-X.; Lu, G.Q.M. Chemoselective catalytic conversion of glycerol as a biorenewable source to valuable commodity chemicals. Chem. Soc. Rev. 2008, 37, 527–549. [Google Scholar] [CrossRef]
- Len, C.; Delbecq, F.; Corpas, C.C.; Ramos, E.R. Continuous flow conversion of glycerol into chemicals: An overview. Synthesis 2018, 50, 723–741. [Google Scholar] [CrossRef]
- Muraza, O. Peculiarities of glycerol conversion to chemicals over zeolite-based catalysts. Front. Chem. 2019, 7, 233. [Google Scholar] [CrossRef] [PubMed]
- Walgode, P.M.; Faria, R.P.V.; Rodrigues, A.E. A review of aerobic glycerol oxidation processes using heterogeneous catalysts: A sustainable pathway for the production of dihydroxyacetone. Catal. Rev. Sci. Eng. 2020, 1–90. [Google Scholar] [CrossRef]
- Yang, L.; Li, X.; Chen, P.; Hou, Z. Selective oxidation of glycerol in a base-free aqueous solution: A short review. Chin. J. Catal. 2019, 40, 1020–1034. [Google Scholar] [CrossRef]
- Dimitratos, N.; Porta, F.; Prati, L. Au, Pd (mono and bimetallic) catalysts supported on graphite using the immobilisation method: Synthesis and catalytic testing for liquid phase oxidation of glycerol. Appl. Catal. A Gen. 2005, 291, 210–214. [Google Scholar] [CrossRef]
- Dimitratos, N.; Porta, F.; Prati, L.; Villa, A. Synergetic effect of platinum or palladium on gold catalyst in the selective oxidation of D-sorbitol. Catal. Lett. 2005, 99, 181–185. [Google Scholar] [CrossRef]
- Katryniok, B.; Paul, S.; Dumeignil, F. Recent developments in the field of catalytic dehydration of glycerol to acrolein. Acs Catal. 2013, 3, 1819–1834. [Google Scholar] [CrossRef]
- Zhao, H.; Zheng, L.; Li, X.; Chen, P.; Hou, Z. Hydrogenolysis of glycerol to 1,2-propanediol over Cu-based catalysts: A short review. Catal. Today 2019, 355, 84–95. [Google Scholar] [CrossRef]
- Nakagawa, Y.; Shinmi, Y.; Koso, S.; Tomishige, K. Direct hydrogenolysis of glycerol into 1,3-propanediol over rhenium-modified iridium catalyst. J. Catal. 2010, 272, 191–194. [Google Scholar] [CrossRef]
- Kurosaka, T.; Maruyama, H.; Naribayashi, I.; Sasaki, Y. Production of 1,3-propanediol by hydrogenolysis of glycerol catalyzed by Pt/WO3/ZrO2. Catal. Commun. 2008, 9, 1360–1363. [Google Scholar] [CrossRef]
- Bondioli, P. Overview from oil seeds to industrial products: Present and future oleochemistry. J. Synth. Lubr. 2005, 21, 331–343. [Google Scholar] [CrossRef]
- Ball, M.; Wietschel, M. The future of hydrogen–opportunities and challenges. Int. J. Hydrogen Energy 2009, 34, 615–627. [Google Scholar] [CrossRef]
- Holladay, J.D.; Hu, J.; King, D.L.; Wang, Y. An overview of hydrogen production technologies. Catal. Today 2009, 139, 244–260. [Google Scholar] [CrossRef]
- Bridgwater, A.V.; Chinthapalli, R.; Smith, P.W. Identification and Market Analysis of Most Promising Added-Value Products to Be Co-Produced with the Fuels; Aston University: Birmingham, UK, 2010. [Google Scholar]
- Dasari, M.A.; Kiatsimkul, P.-P.; Sutterlin, W.R.; Suppes, G.J. Low-pressure hydrogenolysis of glycerol to propylene glycol. Appl. Catal. A Gen. 2005, 281, 225–231. [Google Scholar] [CrossRef]
- Balaraju, M.; Rekha, V.; Prasad, P.S.S.; Prasad, R.B.N.; Lingaiah, N. Selective hydrogenolysis of glycerol to 1,2 propanediol over Cu--ZnO catalysts. Catal. Lett. 2008, 126, 119–124. [Google Scholar] [CrossRef]
- Wang, S.; Liu, H. Selective hydrogenolysis of glycerol to propylene glycol on Cu–ZnO catalysts. Catal. Lett. 2007, 117, 62–67. [Google Scholar] [CrossRef]
- Zhou, Z.; Li, X.; Zeng, T.; Hong, W.; Cheng, Z.; Yuan, W. Kinetics of Hydrogenolysis of Glycerol to Propylene Glycol over Cu-ZnO-Al2O3 Catalysts. Chin. J. Chem. Eng. 2010, 18, 384–390. [Google Scholar] [CrossRef]
- Restrepo, J.B.; Bustillo, J.A.; Bula, A.J.; Paternina, C.D. Selection, Sizing, and Modeling of a Trickle Bed Reactor to Produce 1,2 Propanediol from Biodiesel Glycerol Residue. Processes 2021, 9, 479. [Google Scholar] [CrossRef]
- Mary, G.; Chaouki, J.; Luck, F. Trickle-Bed Laboratory Reactors for Kinetic Studies. Int. J. Chem. React. Eng. 2009, 7. [Google Scholar] [CrossRef]
- Ranade, V.V.; Chaudhari, R.V.; Gunjal, P.R. Trickle Bed Reactors; Elsevier: Amsterdam, The Netherlands, 2011; ISBN 978-0-444-52738-7. [Google Scholar]
- Xi, Y.; Holladay, J.E.; Frye, J.G.; Oberg, A.A.; Jackson, J.E.; Miller, D.J. A kinetic and mass transfer model for glycerol hydrogenolysis in a trickle-bed reactor. Org. Process Res. Dev. 2010, 14, 1304–1312. [Google Scholar] [CrossRef]
- Panyad, S.; Jongpatiwut, S.; Sreethawong, T.; Rirksomboon, T.; Osuwan, S. Catalytic dehydroxylation of glycerol to propylene glycol over Cu–ZnO/Al2O3 catalysts: Effects of catalyst preparation and deactivation. Catal. Today 2011, 174, 59–64. [Google Scholar] [CrossRef]
- HiFUEL® Base Metal Water Gas Shift Catalysts. Available online: https://www.alfa.com/media/HiFUEL_Base_Metal_Water_Gas_Shift_Catalysts.pdf (accessed on 17 April 2021).
- Renon, H.; Prausnitz, J.M. Local compositions in thermodynamic excess functions for liquid mixtures. AIChE J. 1968, 14, 135–144. [Google Scholar] [CrossRef]
- Redlich, O.; Kwong, J.N.S. On the thermodynamics of solutions. V. An equation of state. Fugacities of gaseous solutions. Chem. Rev. 1949, 44, 233–244. [Google Scholar] [CrossRef] [PubMed]
- Turton, R.; Bailie, R.C.; Whiting, W.B.; Shaeiwitz, J.A. Analysis, Synthesis and Design of Chemical Processes; Pearson Education: London, UK, 2008; ISBN 0132459183. [Google Scholar]
- Douglas, J.M. Conceptual Design of Chemical Processes; McGraw-Hill: New York, NY, USA, 1988. [Google Scholar]
- El-Halwagi, M.M. Sustainable Design through Process Integration: Fundamentals and Applications to Industrial Pollution Prevention, Resource Conservation, and Profitability Enhancement; Butterworth-Heinemann: Oxford, UK, 2017; ISBN 0128098244. [Google Scholar]
- Cardona, C.A.; Sanchez, O.J.; Gutierrez, L.F. Process Synthesis for Fuel Ethanol Production; CRC Press: Boca Raton, FL, USA, 2009; ISBN 1439815984. [Google Scholar]
- Petlyuk, F.B. Distillation Theory and Its Application to Optimal Design of Separation Units; Cambridge University Press: Cambridge, UK, 2004; ISBN 113945563X. [Google Scholar]
- Westerberg, A.W. The synthesis of distillation-based separation systems. Comput. Chem. Eng. 1985, 9, 421–429. [Google Scholar] [CrossRef]
- Fedebiocombustibles. Available online: http://www.fedebiocombustibles.com/v3/estadistica-mostrar_info-titulo-Biodiesel.htm (accessed on 17 April 2021).
- Posada, J.A.; Cardona, C.A.; Cetina, D.M. Bioglicerol como materia prima para la obtención de productos de valor agregado. In CARDONA, CA Avances Investigativos en la Producción de Biocombustibles; Artes Graficas Tizán: Manizales, Colombia, 2009; pp. 103–127. [Google Scholar]
- Pandia, R. Markets and Potential for Non-polymer Derivatives of Propylene. In Proceedings of the Olefins Asia 2014, Shanghai, China, 6–7 March 2014. [Google Scholar]
- Cucchiella, F.; D’Adamo, I.; Gastaldi, M.; Miliacca, M. A profitability analysis of small-scale plants for biomethane injection into the gas grid. J. Clean. Prod. 2018, 184, 179–187. [Google Scholar] [CrossRef]
- Hirunsit, P.; Luadthong, C.; Faungnawakij, K. Effect of alumina hydroxylation on glycerol hydrogenolysis to 1,2-propanediol over Cu/Al2O3: Combined experiment and DFT investigation. RSC Adv. 2015, 5, 11188–11197. [Google Scholar] [CrossRef]
- Du, Y.; Wang, C.; Jiang, H.; Chen, C.; Chen, R. Insights into deactivation mechanism of Cu–ZnO catalyst in hydrogenolysis of glycerol to 1,2-propanediol. J. Ind. Eng. Chem. 2016, 35, 262–267. [Google Scholar] [CrossRef]

Publisher’s Note: MDPI stays neutral with regard to jurisdictional claims in published maps and institutional affiliations. |
© 2021 by the authors. Licensee MDPI, Basel, Switzerland. This article is an open access article distributed under the terms and conditions of the Creative Commons Attribution (CC BY) license (https://creativecommons.org/licenses/by/4.0/).