
A Strategic and Smart Environmental Assessment of Rapid Urbanization in Beijing

 ,
,  and
and 
Abstract
:1. Introduction
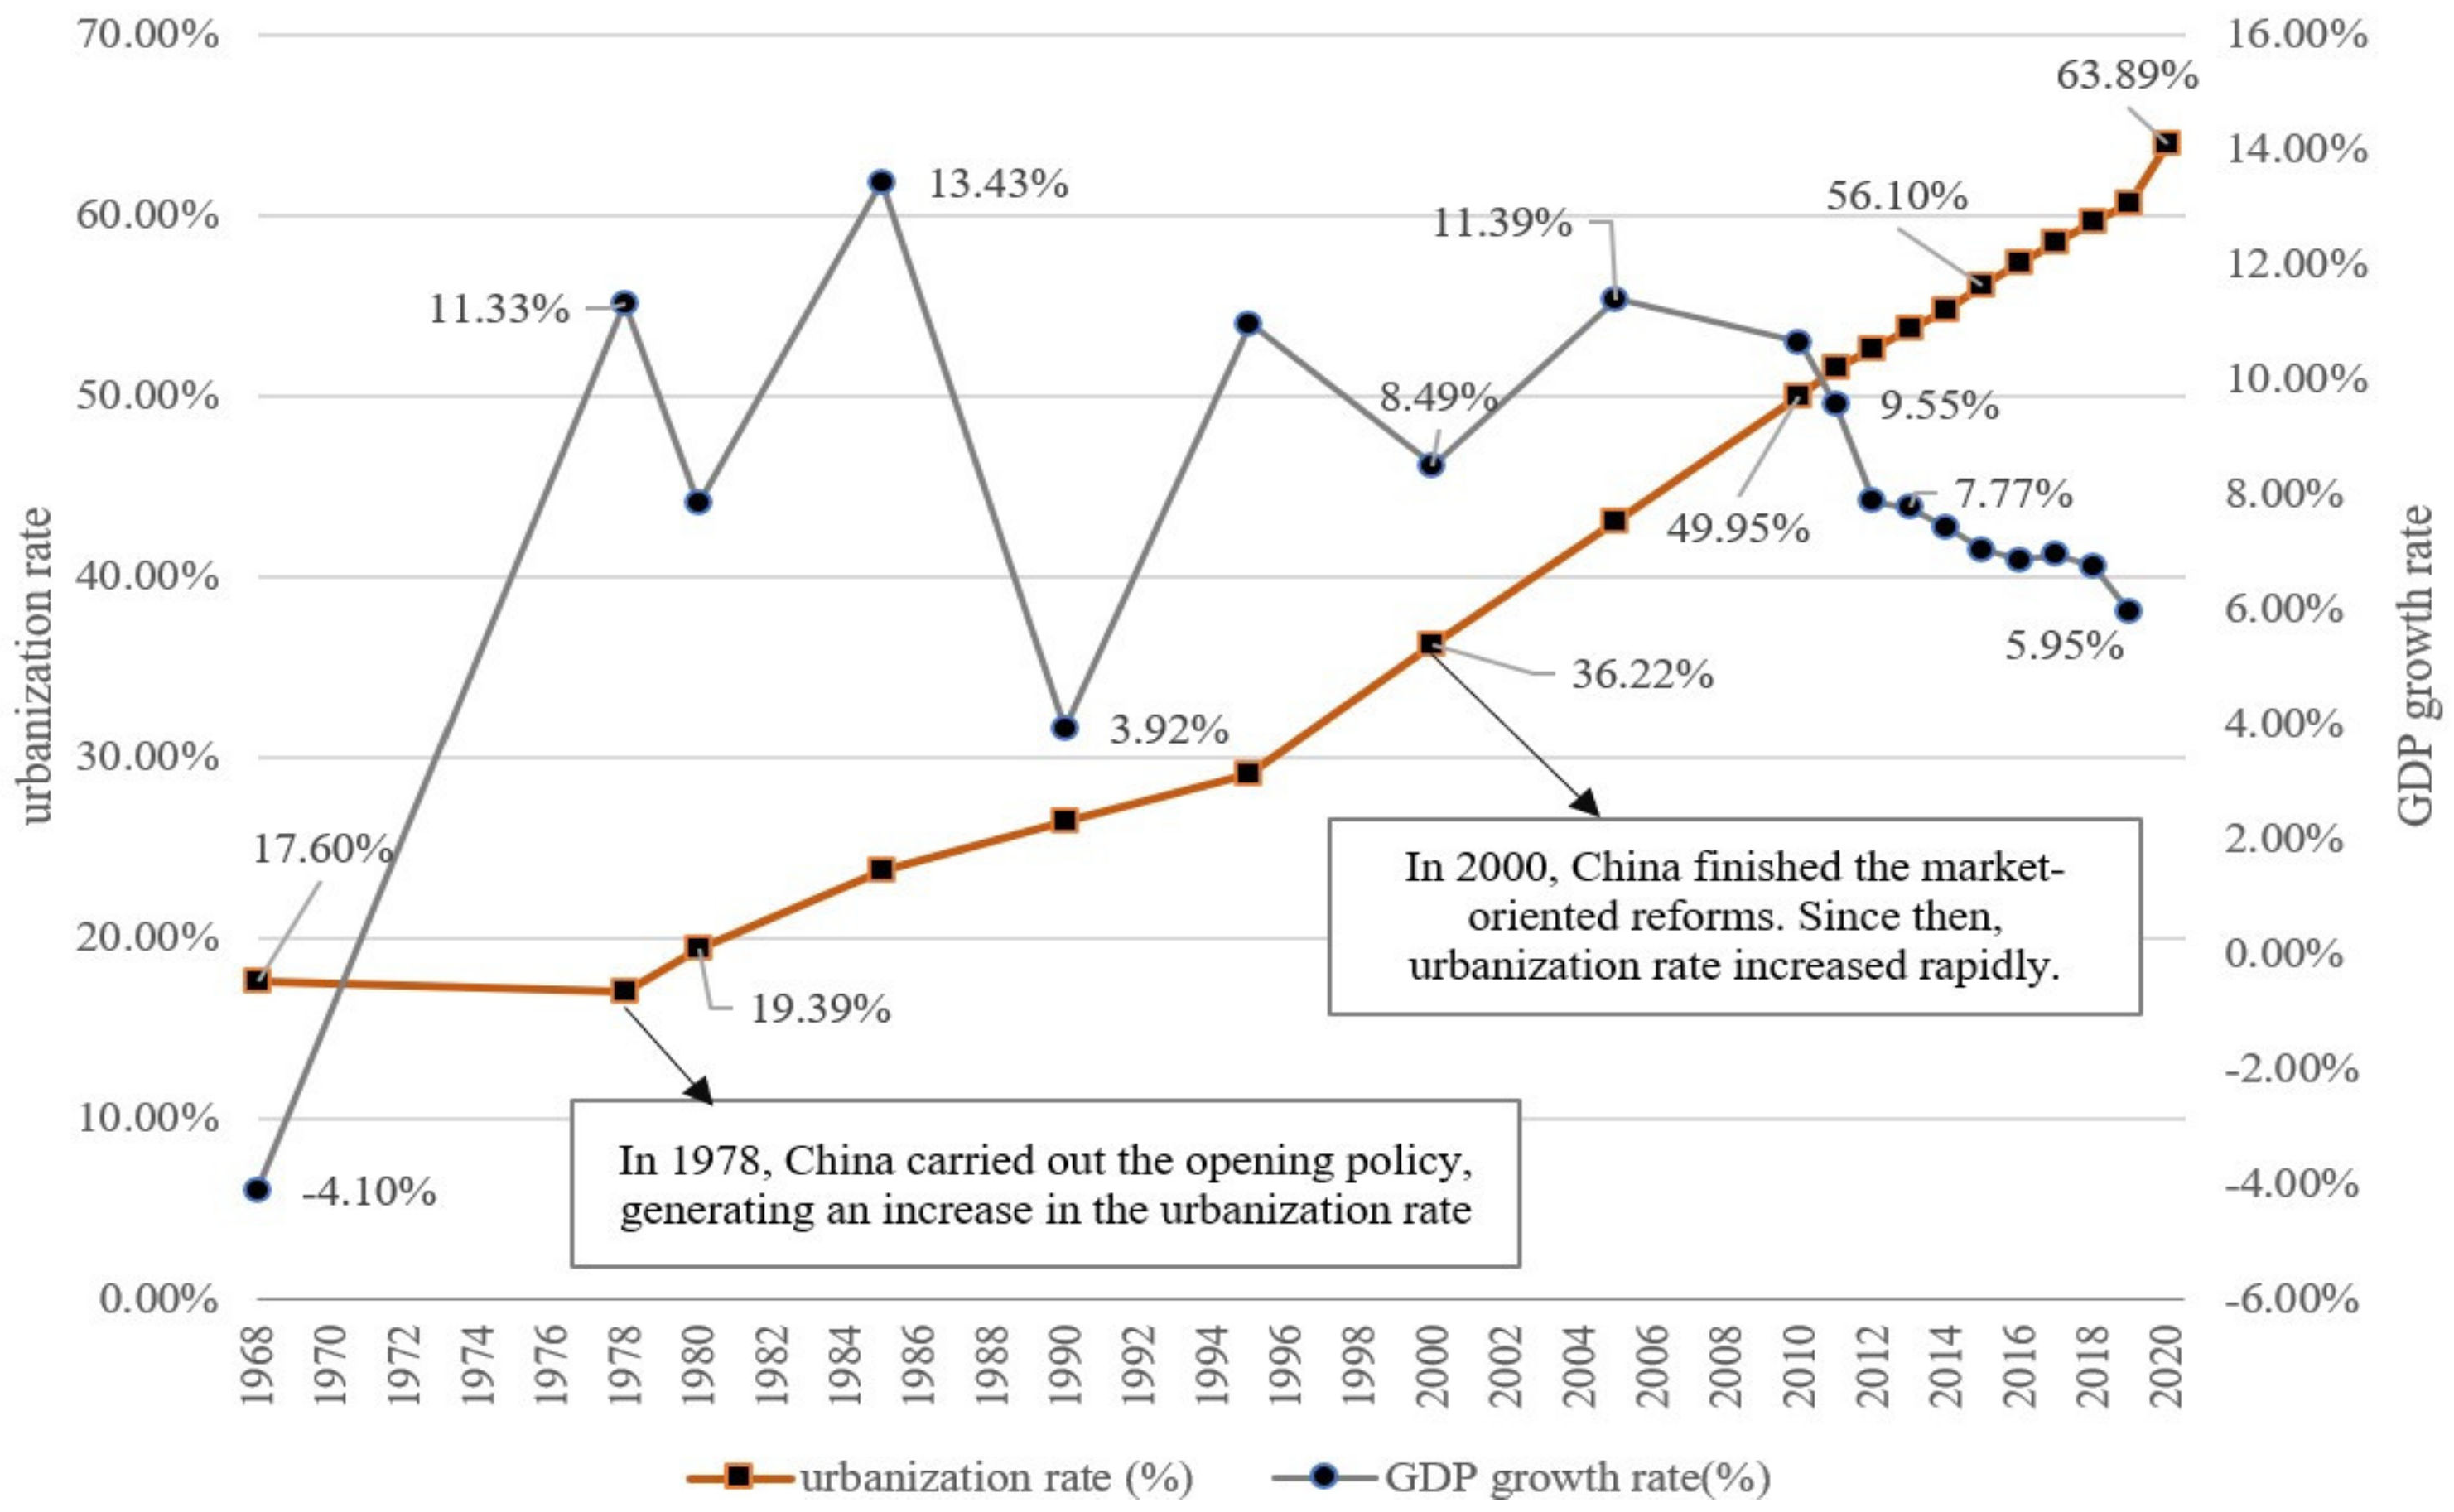
1.1. Rapid Urbanization in China
1.2. Research Questions
- How can Smart city strategies lessen environmental impacts in cases of rapid urbanization?
- How can we leverage digital technology to promote environmental sustainability in developing countries experiencing rapid urbanization?
1.3. Organization of the Work and Structure
2. Materials and Methods
2.1. Environmental and Impact Analysis
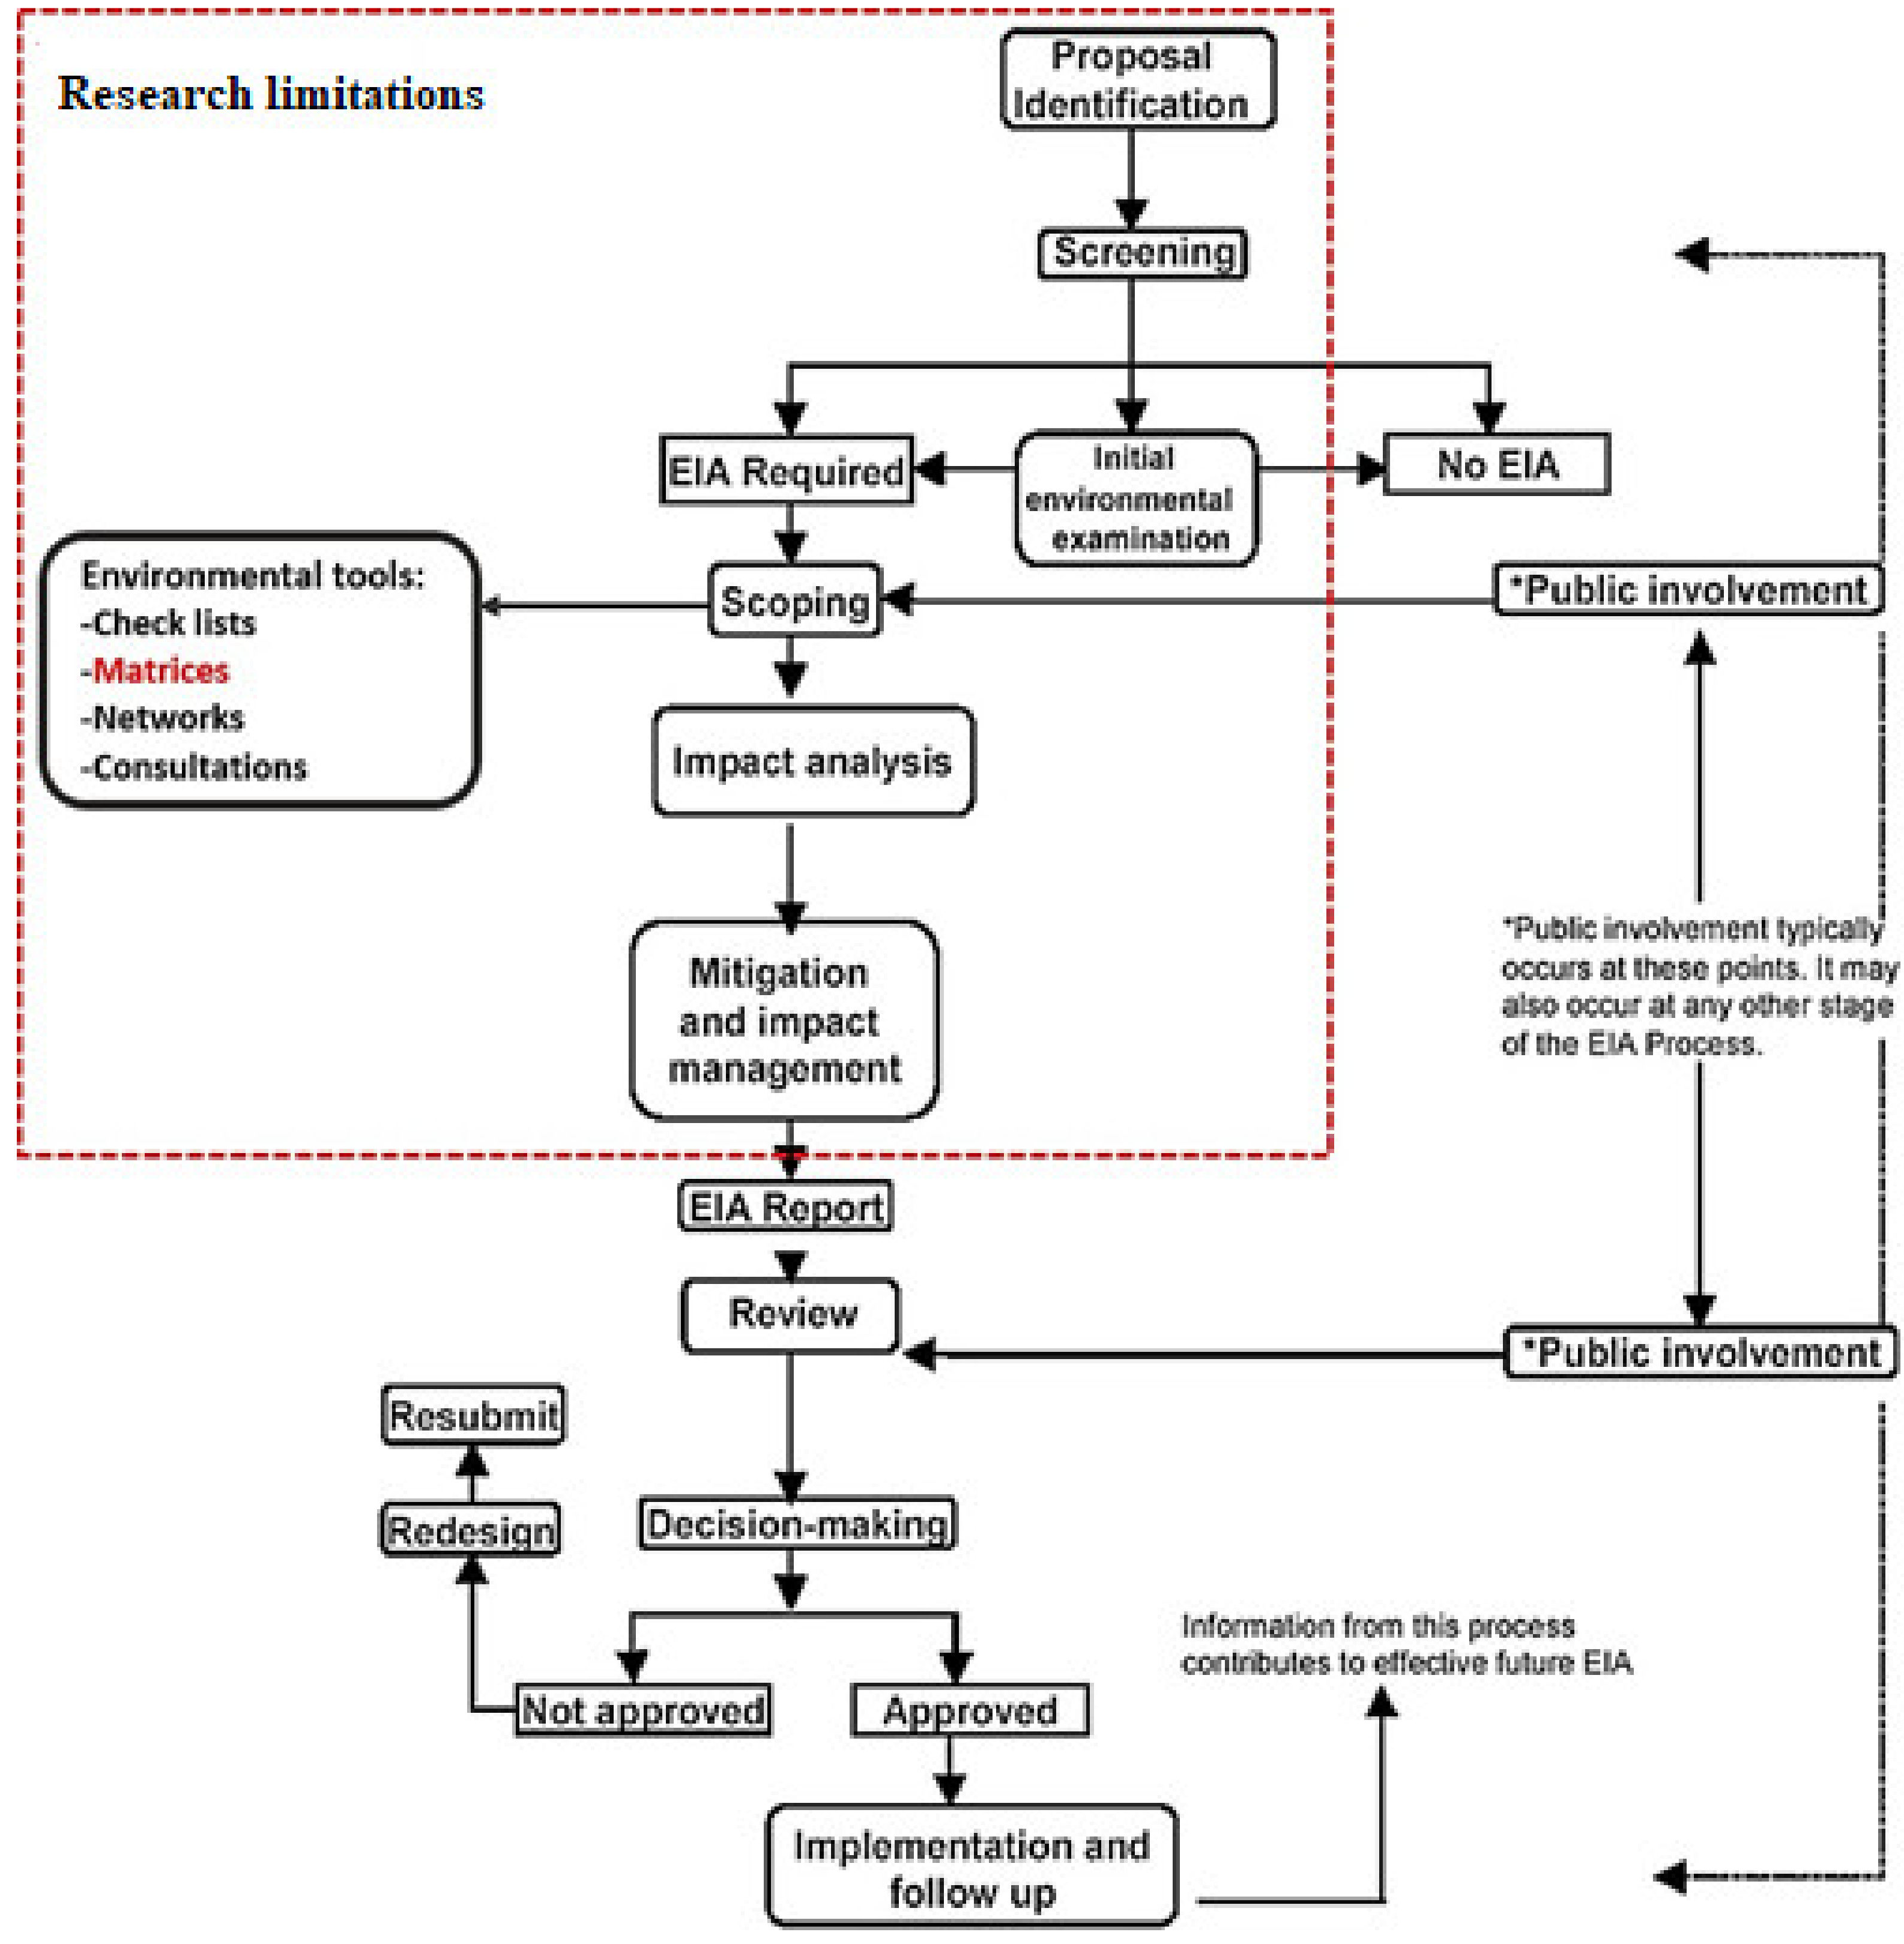
2.2. Tools and Impact Identification
3. RIAM Methodology
- -
- Step 1: create a set of indicators
- -
- Step 2: provide numerical value for the indicators
- -
- Step 3: calculate environmental scores
- -
- Step 4: evaluate the alternatives
- (A)
- criteria which are important for the condition, which individually can change the score obtained
- (B)
- criteria which are useful for the situation, but should not be able to change individually the score obtained
- →
- A1: the conditions (existing)
- →
- A2: in respect to the magnitude of change
- →
- B1: the level of permanence
- →
- B2: the possibility of being reversible
- →
- B3: the level of being cumulative
3.1. Collection and Selection of KPI
3.2. Assessing the Impacts
3.3. Collection and Selection of KPIs
4. Case-Study Application in Beijing, China
4.1. Air Pollution
4.2. Energy Demand
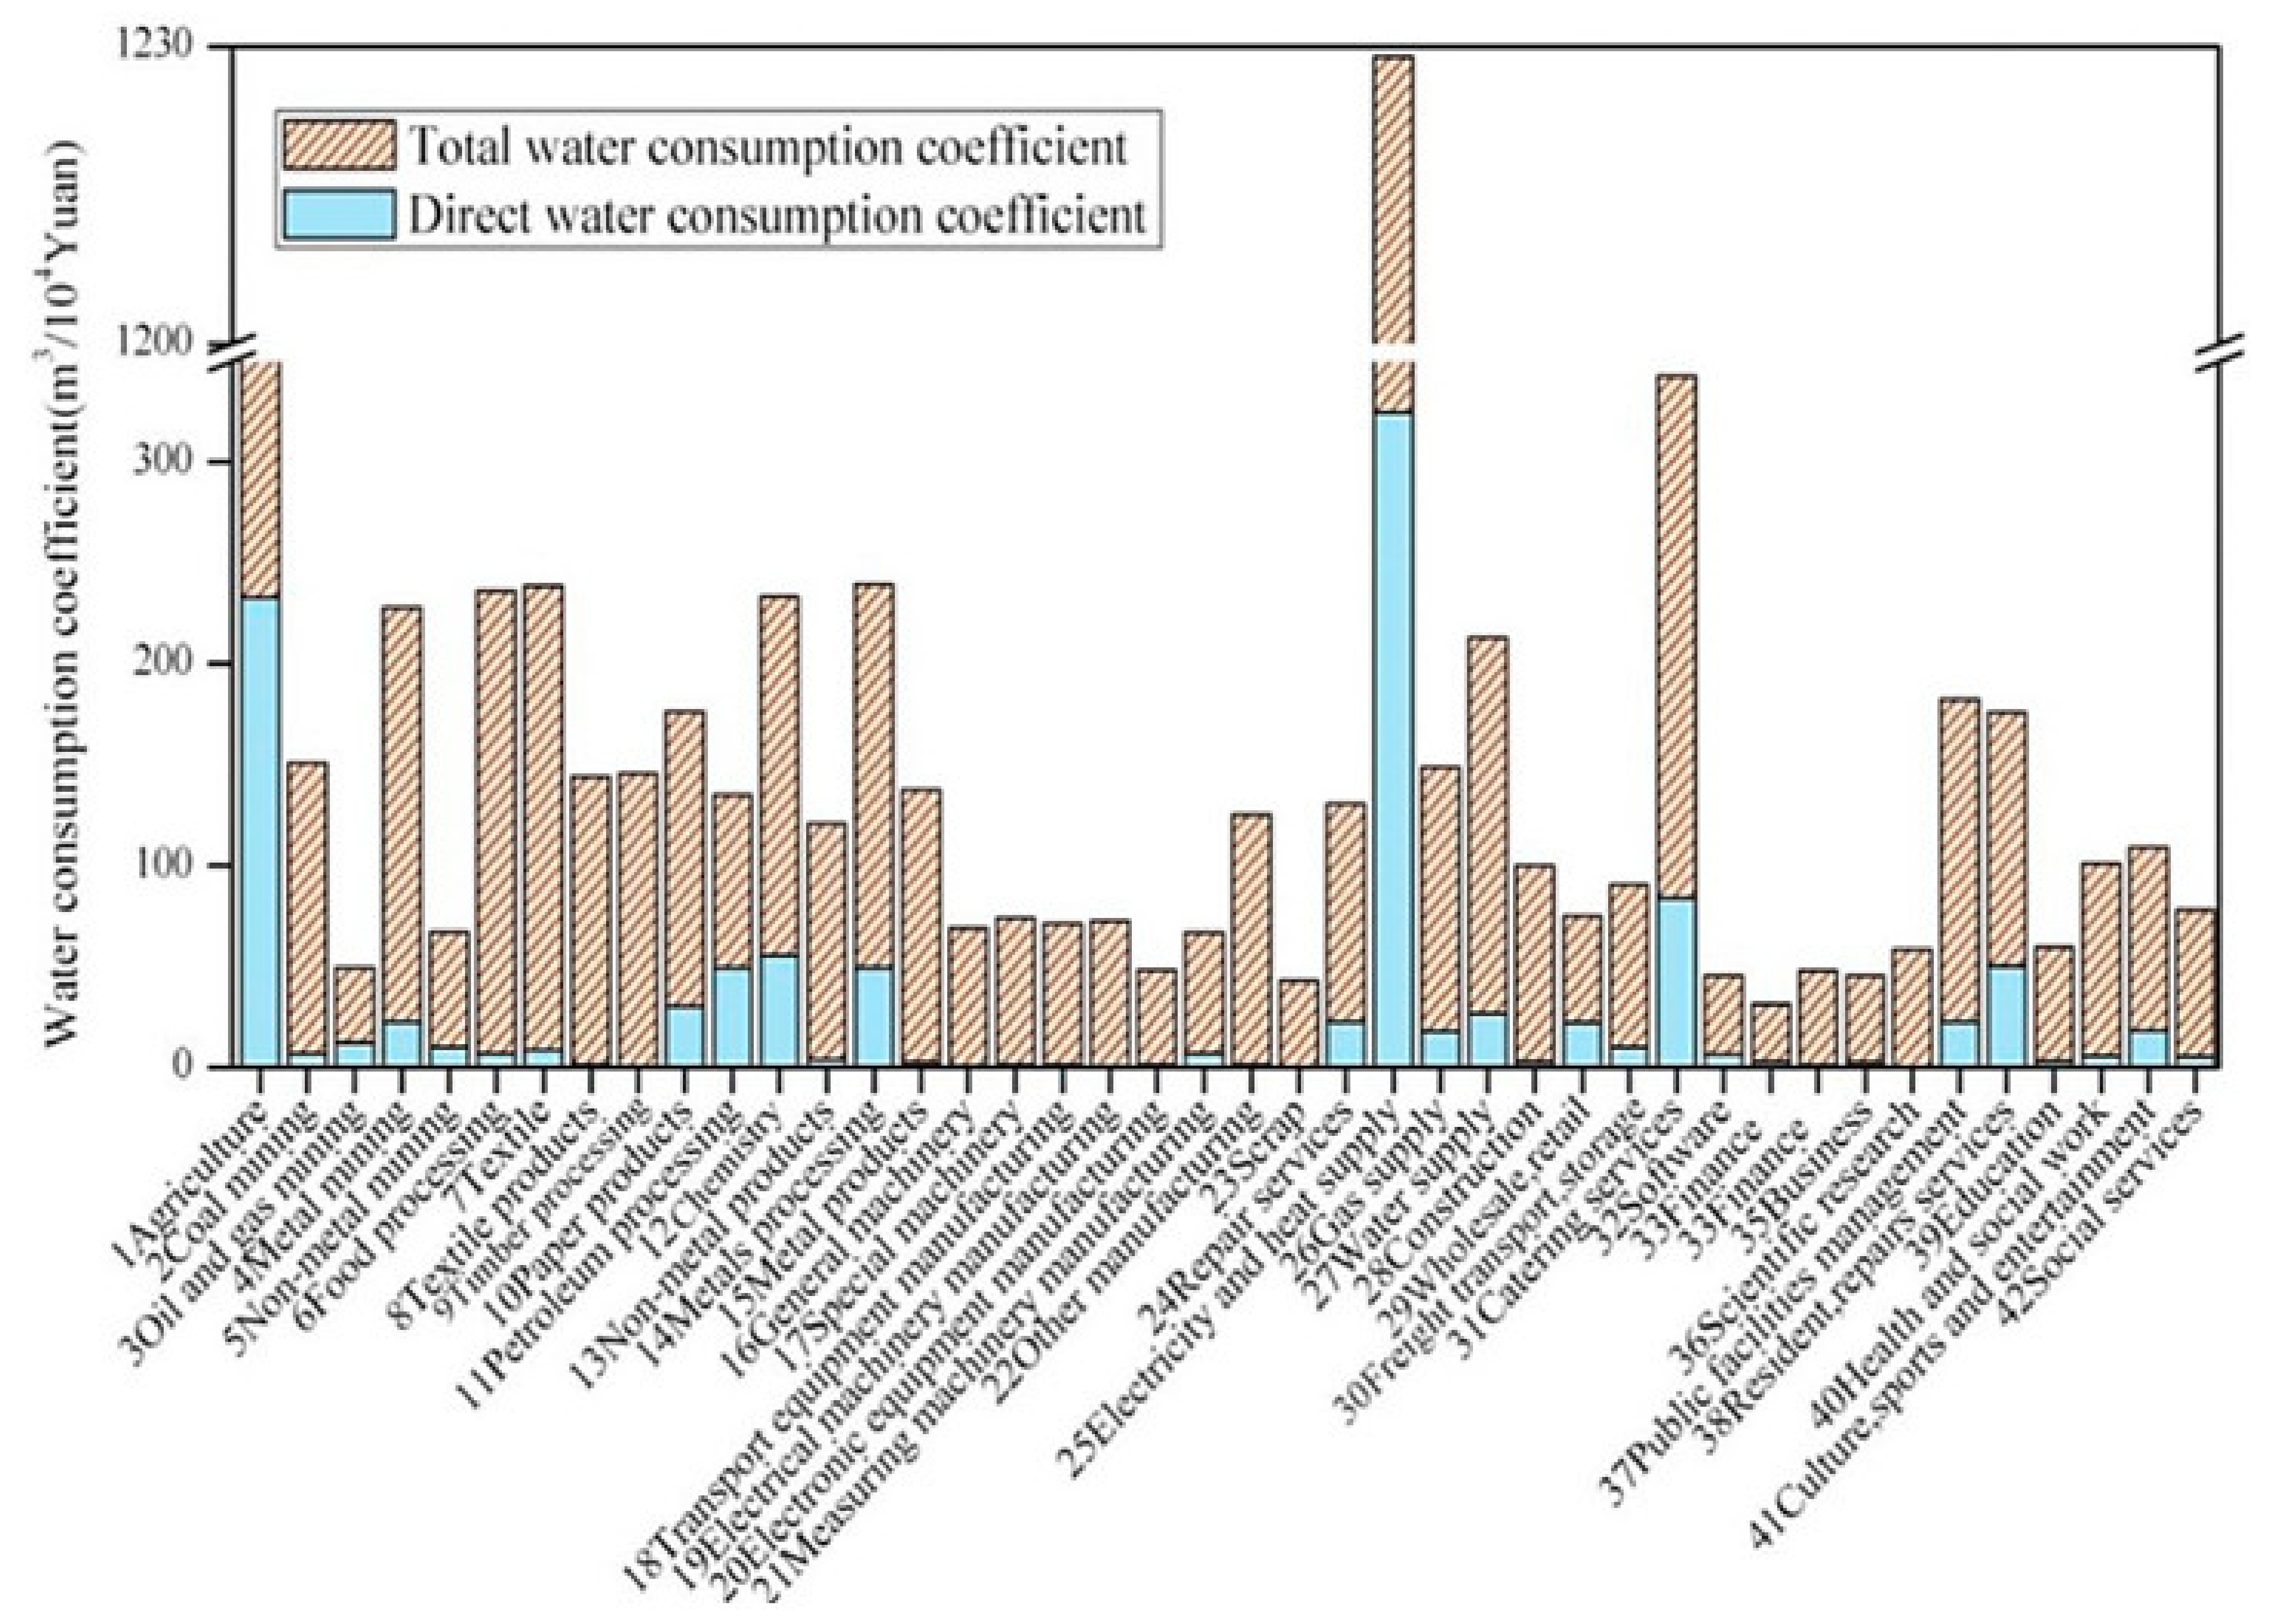
4.3. Water Supply and Consumption
5. Results
6. Discussion
7. Conclusions
Author Contributions
Funding
Acknowledgments
Conflicts of Interest
Nomenclature
| USD | United States Dollar |
| UN | United Nations |
| QoL | Quality of Life |
| GDP | Gross Domestic Product |
| EIA | Environmental Impact Assessment |
| SEA | Strategic Environmental Assessment |
| RIAM | Rapid Impact Assessment Matrix |
| NEPA | National Environmental Policy Act |
| EI | Environmental Impact |
| SD | Sustainable Development |
| KPI | Key Performance Indicator |
| ISO | International Organization for Standardization |
| ITU | International Telecommunication Union |
| UNECE | United Nations Economic Commission for Europe |
| PC | Physical/Chemical |
| BE | Biological/Ecological |
| SC | Social/Cultural |
| EO | Economic/Operational |
| PC | Principal Component |
| PM | Particular Matter |
| NO | Nitrogen Dioxide |
| SO | Sulphur Dioxide |
| WHO | World Health Organization |
| GHG | Greenhouse Gas |
| SE | Smart Environment |
| EU | European Union |
| SC | Smart Cities |
| ICT | Information Communications Technology |
References
- World Population Data Sheet. Population Reference Bureau, 2020 World Population Data Sheet. 2020. Available online: https://interactives.prb.org/2020-wpds/ (accessed on 20 May 2021).
- United Nations. The World’s Cities in 2018 Data Booklet. 2018. Available online: https://www.un.org/development/desa/pd/content/worlds-cities-2018-data-booklet (accessed on 20 May 2021).
- United Nations. Department of Economic and Social Affairs: World Urbanization Prospects. The 2018 Revision. Available online: https://population.un.org/wup/Publications/Files/WUP2018-Report.pdf (accessed on 16 August 2021).
- UNEP. Cities and Climate Change, UN Environmental Programme. 2019. Available online: https://www.unep.org/explore-topics/resource-efficiency/what-we-do/cities/cities-and-climate-change (accessed on 5 March 2021).
- Farrell, K. The rapid urban growth Triad: A new conceptual framework for examining the urban transition in developing countries. Sustainability 2017, 9, 1407. [Google Scholar] [CrossRef] [Green Version]
- Singh, S.P.; Aggarwal, R.K. Rural-urban migration: The role of push and pull factors revisited. Indian J. Labour Econ. 1998, 41, 53–667. [Google Scholar]
- Awasthi, S. Hyper-Urbanisation and migration: A security threat. Cities 2020, 108, 102965. [Google Scholar]
- Team, D. Urbanisation and the Rise of the Megacities; The Economist: London, UK, 2015. [Google Scholar]
- Frick, S.A.; Rodriguez-Pose, A. Change in urban concentration and economic growth. World Dev. 2018, 105, 156–170. [Google Scholar] [CrossRef]
- Yang, X.; Yue, W.; Xu, H.; Wu, J.; He, Y. Environmental consequences of rapid urbanization in Zhejiang province, East China. Int. J. Environ. Res. Public Health 2014, 11, 7045–7059. [Google Scholar] [CrossRef] [PubMed]
- Mu, L.; Fang, L.; Dou, W.; Wang, C.; Qu, X.; Yu, Y. Urbanization-induced spatiotemporal variation of water resources utilization in northwestern China: A spatial panel model based approach. Ecol. Indic. 2021, 125, 107457. [Google Scholar] [CrossRef]
- Palanivel, T. Rapid Urbanisation: Opportunities and Challenges to Improve the Well-Being of Societies. 2017. Available online: http://hdr.undp.org/en/content/rapid-urbanisation-opportunities-and-challenges-improve-well-being-societies (accessed on 15 May 2021).
- United Nations. World Economic Situation and Prospects. J. Chem. Inf. Model. 2019, 9. Available online: https://www.un.org/development/desa/dpad/wp-content/uploads/sites/45/WESP2019_BOOK-web.pdf (accessed on 15 May 2021).
- Farrell, K.; Westlund, H. China’s rapid urban ascent: An examination into the components of urban growth. Asian Geogr. 2018, 35, 85–106. [Google Scholar] [CrossRef] [Green Version]
- Zhao, Z.; Chen, W.; Jin, Y. Recent mortality trends in China. In Contemporary Demographic Transformations in China, India and Indonesia; Springer: Berlin/Heidelberg, Germany, 2016. [Google Scholar]
- Yang, Y.; Liu, Y.; Li, Y.; Du, G. Quantifying spatio-temporal patterns of urban expansion in Beijing during 1985-2013 with rural-urban development transformation. Land Use Policy 2017, 74, 220–230. [Google Scholar] [CrossRef]
- Wu, W.; Zhao, S.; Zhu, C.; Jiang, J. A comparative study of urban expansion in Beijing, Tianjin and Shijiazhuang over the past three decades. Landsc. Urban Plan. 2015, 134, 93–106. [Google Scholar] [CrossRef]
- Fei, W.; Zhao, S. Urban land expansion in China’s six megacities from 1978 to 2015. Sci. Total Environ. 2019, 664, 60–71. [Google Scholar] [CrossRef]
- Griffiths, M.; Schiavone, M. China’s New Urbanisation Plan 2014–2020. SAGE J. 2016, 52, 73–91. [Google Scholar]
- Zhang, Z.; Li, N.; Wang, X.; Liu, F.; Yang, L. A Comparative Study of Urban Expansion in Beijing, Tianjin and Tangshan from the 1970s to 2013. Remote Sens. 2016, 8, 496. [Google Scholar] [CrossRef] [Green Version]
- Wah Chu, Y. China’s new urbanization plan: Progress and structural constraints. Cities 2020, 103, 102736. [Google Scholar]
- Shayan, S.; Kim, K.P.; Ma, T.; Nguyen, T.H.D. The first two decades of smart city research from a risk perspective. Sustainability 2020, 12, 9280. [Google Scholar] [CrossRef]
- University of Navarra, IESE Cities in Motion Index. 2019. Available online: https://media.iese.edu/research/pdfs/ST-0509-E.pdf (accessed on 18 February 2020).
- Ou, J.; Liu, X.; Li, X.; Chen, Y.; Li, Y. Quantifying Spatiotemporal Dynamics of Urban Growth Modes in Metropolitan Cities of China: Beijing, Shanghai, Tianjin, and Guangzhou. J. Urban Plan. Dev. 2017, 143, 04016023. [Google Scholar] [CrossRef]
- World Bank. World Urbanization Prospects: 2018 Revision. 2018. Available online: https://data.worldbank.org/indicator/SP.URB.TOTL.IN.ZS (accessed on 18 February 2020).
- Larsen, S.V. Inclusion of uncertainty in Environmental Impact Assessment in Greenland. Environ. Impact Assess. Rev. 2020, 89, 106583. [Google Scholar] [CrossRef]
- Andersson, K.; Brynolf, S.; Landquist, H.; Svensson, E. Methods and tools for environmental assessment. In Shipping and the Environment; Springer: Berlin/Heidelberg, Germany, 2016. [Google Scholar]
- Hugé, J. Impact Assessment-What, Why, How? 2007. Available online: https://ees.kuleuven.be/klimos/klimos-seminars/20170203-jean-huge-impact-assessment-tool-and-process-for-sustainability.pdf (accessed on 18 February 2020).
- Ness, B.; Urbel-Piirsalu, E.V.; Anderberg, S.; Olsson, L. Categorising tools for sustainability assessment. Ecol. Econ. 2007, 60, 498–508. [Google Scholar] [CrossRef]
- Kumar, P.; Esen, S.E.; Yashiro, M. Linking ecosystem services to Strategic Environmental Assessment in development policies. Environ. Impact Assess. Rev. 2013, 40, 75–81. [Google Scholar] [CrossRef]
- Rodriguez-Luna, D.; Vela, N.; Alcala, F.J.; Encina-Montoya, F. The environmental impact assessment in Chile: Overview, improvements and comparisons. Environ. Impact Assess. Rev. 2021, 86, 106502. [Google Scholar] [CrossRef]
- Therivel, R.; Wilson, E.; Pritchard, D.; Heaney, D.; Thompson, S. Strategic Environmental Assessment; Routledge: Oxfordshire, UK, 2013. [Google Scholar]
- Yang, Y.; Xu, H.; Wang, J.; Liu, T.; Wang, H. Integrating climate change factor into Strategic Environmental Assessment in China. Environ. Impact Assess. Rev. 2021, 89, 106585. [Google Scholar] [CrossRef]
- Youngil, S.; DaeRyong, R.; GiHye, S.; Cheoljin, K.; Grigg, N.S. Strategic environmental assessment for dam planning: A case-study of South Korea’s experience. Water Int. 2010, 35, 397–408. [Google Scholar]
- CSIR. Strategic Environmental Assessment Resource Document: Introduction to the Process, Principles and Application of SEA. Stellenbosch, South Africa. 2007. Available online: http://fred.csir.co.za/project/csir_course_material/Final_ResourceDocument.pdf (accessed on 18 February 2020).
- Ijas, A.; Kuitunen, M.T.; Jalava, K. Developing the RIAM method in the context of impact significance assessment. Environ. Impact Assess. Rev. 2010, 30, 82–89. [Google Scholar] [CrossRef]
- E7 Network. Environmental Impact Assessment. An Electric Utility Overview. 1997. Available online: https://www.globalelectricity.org/content/uploads/e7-EIA-manual.pdf (accessed on 18 February 2020).
- Jones, S. Tools for Environmental Impact Assessment; Elsevier: Amsterdam, The Netherlands, 2007. [Google Scholar]
- Kuitunen, M.; Jalava, K.; Hirvonen, K. Testing the usability of the Rapid Impact Assessment Matrix method for comparison of EIA and SEA results. Environ. Impact Assess. Rev. 2008, 28, 312–320. [Google Scholar] [CrossRef]
- UNDP. A Guide to Stategic Environmental Assessment. 2006. Available online: https://docplayer.net/18304033-A-guide-to-strategic-environmental-assessment.html (accessed on 18 February 2020).
- Li, W.; Xie, Y.; Hao, F. Applying an improved Rapid Impact Assessment matrix method to Strategic Environmental Assessment of Urban Planning in China. Environ. Impact Assess. Rev. 2014, 46, 13–24. [Google Scholar] [CrossRef]
- Pastakia, C.M.; Jensen, A. The Rapid Impact Assessment Matrix for EIA. Environ. Impact Assess. Rev. 1998, 18, 461–482. [Google Scholar] [CrossRef]
- Lang, J.; Zhang, Y.; Zhou, Y.; Cheng, S.; Chen, D.; Guo, X.; Chen, S.; Li, X.; Xing, X.; Wang, H. Trends of PM2.5 and Chemical Composition in Beijing, 2000–2015. Aerosol Air Qual. Res. 2017, 17, 412–425. [Google Scholar] [CrossRef]
- Wu, J.; Zheng, Z.; Zhou, Z. Environmental issues in China: Monitoring, assessment and management. Ecol. Indic. 2015, 51, 1–2. [Google Scholar] [CrossRef]
- UN. A Review of 20 Years’ Air Pollution Control in Beijing. 2019. Available online: https://www.unep.org/resources/report/review-20-years-air-pollution-control-beijing (accessed on 18 February 2020).
- Zhang, W.; Chenjing, W.; Qi, L.; Wen, X.; Li, L.; Xiujuan, L.; Aohan, T.; Jeffrey Lee, C.; Xuejun, L. Winter air quality improvement in Beijing by clean air actions from 2014 to 2018. Atmos. Res. 2021, 259, 105674. [Google Scholar] [CrossRef]
- Yin, P.; Brauer, M.; Cohen, A.; Wang, H.; Li, J.; Burnett, R.; Stanaway, J.; Causey, K.; Larson, S.; Godwin, W.; et al. The effect of air pollution on deaths, disease burden and life expectancy across China and its provinces, 1990–2017: An analyis for the Global Burden of Disease Study. Lancet Planet. Health 2020, 4, e386–e398. [Google Scholar] [CrossRef]
- Yu, D.; Ding, T. Assessment on the flow and vulnerabiliyt of water footprint network of Beijing city, China. J. Clean. Prod. 2021, 293, 126126. [Google Scholar] [CrossRef]
- Tianlong, Q.; Xiangsheng, H.; Rui, C.; Jinmiao, Z.; Jianzhong, S. Evaluating environmental impact of STP effluents on receiving water in Beijing by the joint use of chemical analysis and biomonitoring. Sci. Total Environ. 2021, 752, 141942. [Google Scholar] [CrossRef]
- Johnson, K. Environmental Benefits of Smart City Solutions. 2018. Available online: https://www.climateforesight.eu/cities-coasts/environmental-benefits-of-smart-city-solutions/ (accessed on 10 July 2021).
- European Parliament. Mapping Smart Cities in the EU; Brussels, Belgium. 2014. Available online: https://www.europarl.europa.eu/RegData/etudes/etudes/join/2014/507480/IPOL-ITRE_ET%282014%29507480_EN.pdf (accessed on 15 May 2021).
- Trung, T.T. Smart city and modelling of its unorganized flows using cell machines. Civ. Eng. J. 2020, 6, 954–960. [Google Scholar] [CrossRef]
- Abdulrazzaq, L.R.; Abdulkarreem, M.N.; Mat Yazid, M.; Borhan, M.; Mahdi, M. Traffic congestion: Shift from private car to public transportation. Civ. Eng. J. 2020, 6, 1547–1554. [Google Scholar] [CrossRef]
- Gorbunova, A.D.; Anisimov, I.A. Assessment of the use of renewable energy sources for the charging infrastructure of electric vehicles. Emerg. Sci. J. 2020, 4, 539–550. [Google Scholar] [CrossRef]
- United Nations. Human Development Index (HDI). 2020. Available online: http://hdr.undp.org/en/content/human-development-index-hdi (accessed on 10 July 2021).


| Reference | EIA | SEA |
|---|---|---|
| [34] | Generates more environmentally sensitive decisions | Occurs at the earlier stages of the decision-making cycle |
| [35] | Reactive approach to the development proposal | Pro-active approach to the development proposal |
| [35] | Identifies specific impacts on the environment | Identifies environmental implications of SD |
| [34] | Emphasis on mitigating and minimizing impact | Emphasis on meeting environmental objectives |
| Tool | Characteristics |
|---|---|
| Checklist | Simple to understand and use Good for site selection and priority setting |
| Matrices | Commonly used method Good method for displaying EIA results Visually describe relationships between factors |
| Networks | Link action to impact Useful in simplified form for checking for second-order impacts |
| Overlays | Easy to understand Used for illustrating the geographical extent of impacts |
| computer expert systems | Good for impact identification and analysis Requires huge amount of data |
| Source | Tool | Advantages | Disadvantages |
|---|---|---|---|
| [40] | Simple matrices | Short written descriptions are provided | Not a tractable proposition There is no scaling or quantification of these impacts |
| [39,41] | Scaled matrices | Intersections to indicate the magnitude and the importance The impacts could each be added and compared | Measurements do not necessarily directly correlate |
| [39] | Component interaction matrix | Minimum the existence and length of a linkage between any two components | Structure of these linkages is exposed |
| [41] | Rapid Impact Assessment Matrix | Efficient in terms of handling cases with large quantities of data RIAM allows reanalysis and in-depth analysis of selected components in a rapid and manner | Inability of these assessments to provide a record of the judgments |
| CLASSIFICATION | NAME | CRITERIA | RANGE |
|---|---|---|---|
| Criteria related to importance of the condition | A1 | Importance of condition | from 4 to 0 |
| A2 | Magnitude of change/effect | from 3 to −3 | |
| Criteria that are useful for the situation | B1 | Permanence | from 1 to 3 |
| B2 | Reversibility | from 1 to 3 | |
| B3 | Cumulative | from 1 to 3 |
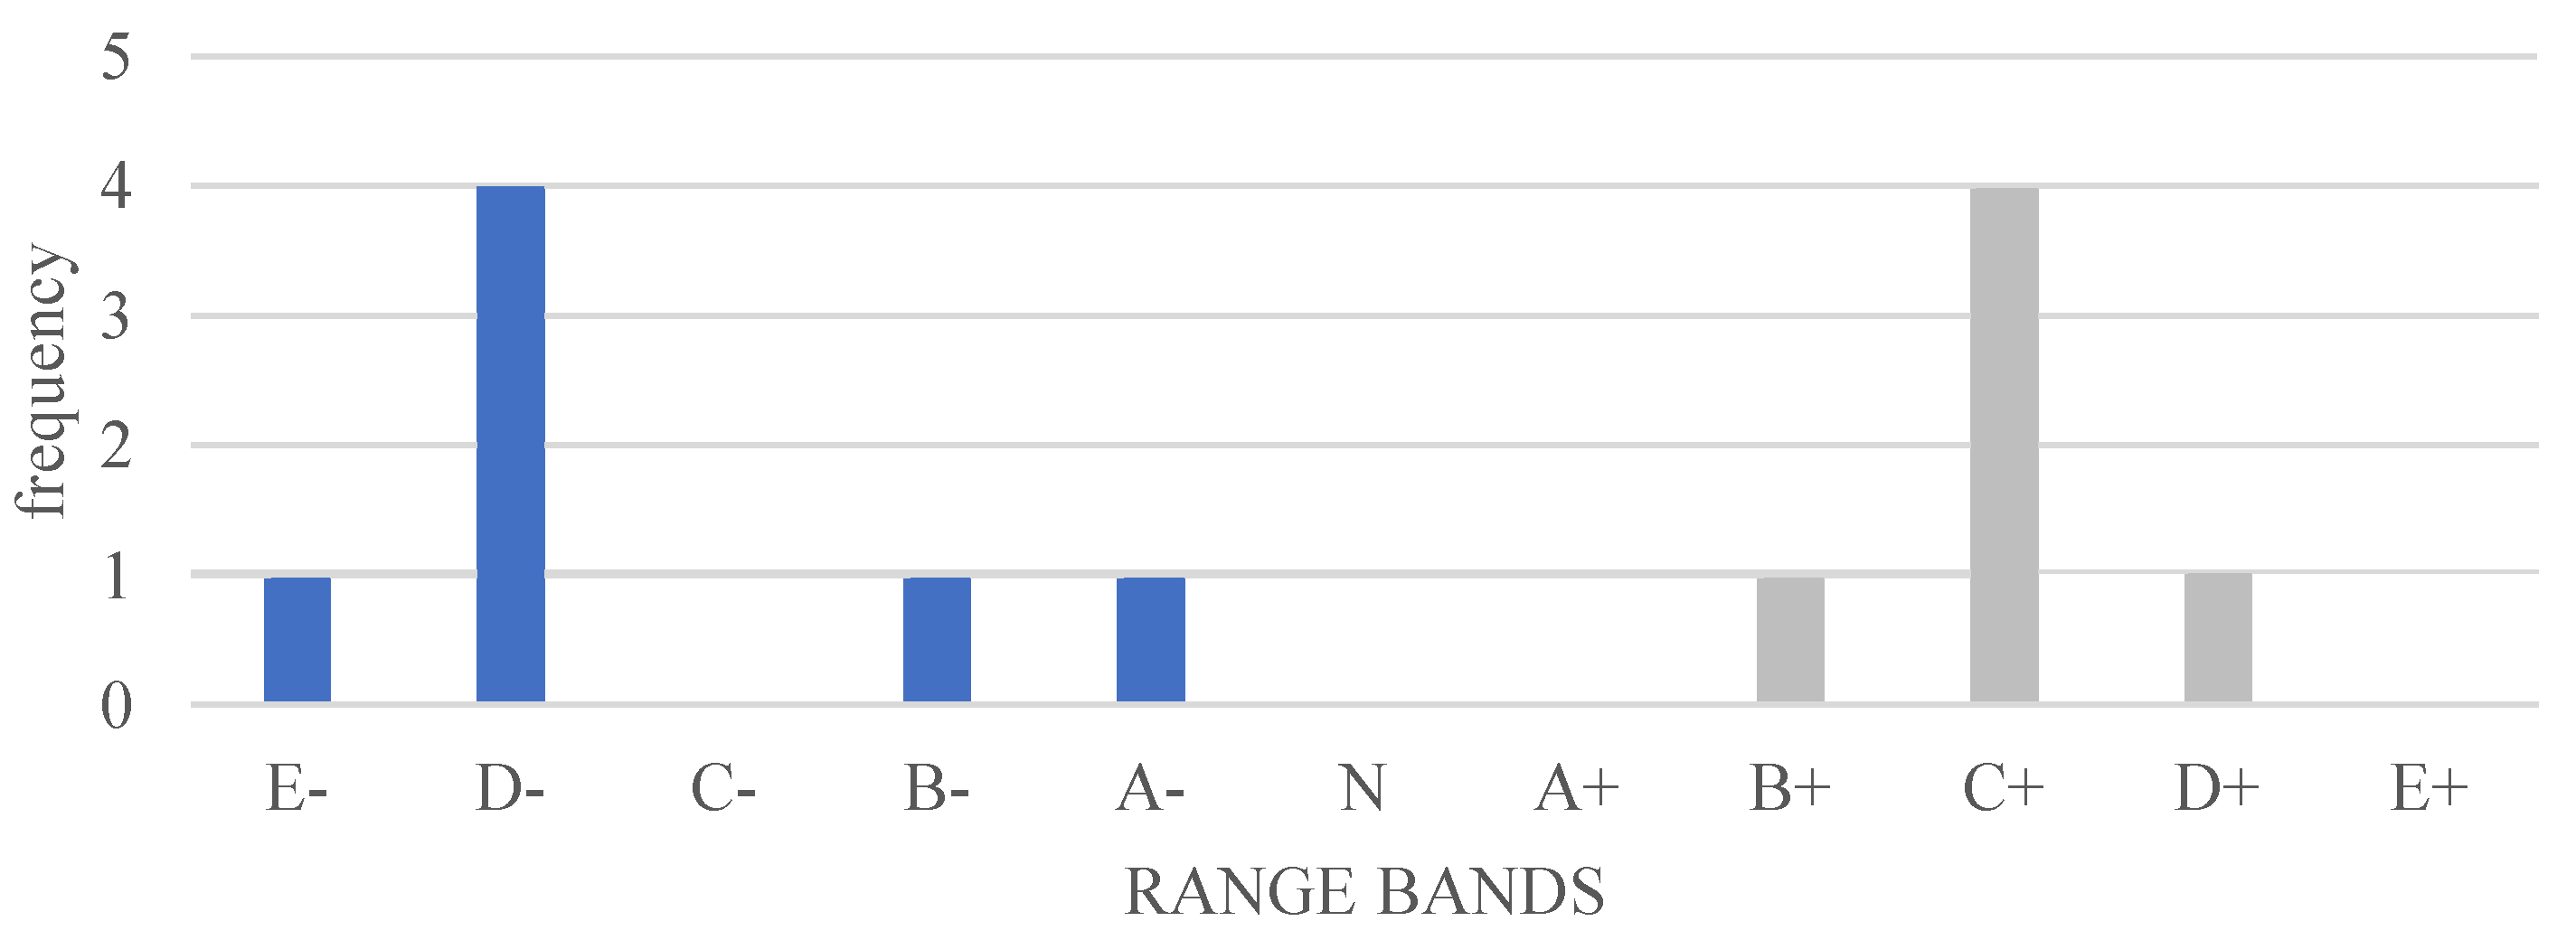
| Environmental Score | Range Bands | Description of Range Bands |
|---|---|---|
| +72 to +180 | +E | Major positive changes |
| +36 to +171 | +D | Important positive changes |
| +19 to +35 | +C | Neutral positive changes |
| +10 to +18 | +B | Accepted positive changes |
| +1 to +9 | +A | Limited positive changes |
| 0 | N | No change or not applicable or no available data for evaluation |
| −1 to −9 | -A | Limited negative changes |
| −10 to −18 | -B | Negative changes |
| −19 to −35 | -C | Neutral negative changes |
| −36 to −171 | -D | Important negative changes |
| −72 to −180 | -E | Major negative changes |
| Geographic Focus | Indicator Standards on Smart Sustainable Cities | Organization |
|---|---|---|
| International | ISO 37122:2019 Sustainable cities and communities (Indicators for smart cities) ITU-T Y.4903/L.1603 (10/2016) | International Organization for Standardization International Telecommunication Union |
| UN- SUSTAINABLE DEVELOPMENT GOAL 11 | United Nations | |
| United for Smart Sustainable Cities (U4SSC) | ITU, UNECE and UN-Habitat) | |
| National (China) | The China Urban Sustainability Index 2013 Urban China Initiative | Columbia University, Tsinghua University, and McKinsey & Company |
| Categories | Indicators | Unit of Measure | Environment Sub-Dimensions |
|---|---|---|---|
| PC | PC1: Fine particle matter (PM2.5) concentration | μg/m3 | Environmental and climate change |
| PC2: Particle matter (PM10) concentration | μg/m3 | ||
| PC3: CO2 emissions measured in tones/ capita | CO2/capita | ||
| PC4: NO2 concentration | Tonnes | ||
| PC5: SO2 concentration | μg/m3 μg /m3 | ||
| PC6: Proportion of the city inhabitants exposed to noise levels above international/national exposure limits | % | ||
| BE | BE1: Percentage of city population with regular solid waste collection (residential) | % | Solid waste |
| BE2: Percentage of the city’s solid waste that is recycled | % | Solid Waste | |
| BE3: Percentage of city population served by wastewater collection | % | Wastewater | |
| BE4: Percentage of city’s wastewater receiving centralized treatment | % | Wastewater | |
| BE5: Percentage of city population with potable water supply service | |||
| BE6: Total water consumption per capita (liters/day) | l/day | ||
| SC | SC1: Green area (hectares) per 100,000 population | hec/100k inh | Urban planning |
| EO | EO1: Total end-use energy consumption per capita EO2: Percentage of total end-use energy derived from renewable source | kWh/y % | Energy |
| LABEL | INDICATOR | A1 | A2 | B1 | B2 | B3 | AT | BT | ES | RB |
|---|---|---|---|---|---|---|---|---|---|---|
| EO1 | Total end-use energy consumptions per capita | 4 | 1 | 3 | 2 | 3 | 4 | 8 | 32 | C+ |
| EO2 | Percentage of total end-use energy derived from renewable sources | 4 | 2 | 3 | 2 | 2 | 8 | 7 | 56 | D+ |
| PC1 | Fine particle matter (PM2.5) concentration | 3 | −3 | 2 | 2 | 1 | −9 | 5 | −45 | D- |
| PC2 | Particle matter (PM10) concentration | 3 | −3 | 2 | 2 | 1 | −9 | 5 | −45 | D- |
| PC3 | CO2 emissions measured in tons per capita | 4 | −3 | 3 | 3 | 3 | −12 | 9 | −108 | E- |
| PC4 | NO2 (nitrogen dioxide) concentration | 3 | −3 | 2 | 2 | 1 | −9 | 5 | −45 | D- |
| PC5 | SO2 (sulfur dioxide) concentration | 3 | −3 | 1 | 2 | 1 | −9 | 4 | −36 | D- |
| PC6 | Proportion of the city inhabitants exposed to noise levels above international/ national exposure limits | 1 | −2 | 2 | 1 | 1 | −2 | 4 | −8 | A- |
| BE1 | Percentage of city population with regular solid waste collection (residential) | 2 | 1 | 2 | 2 | 3 | 2 | 7 | 14 | B+ |
| BE2 | Percentage of the city’s solid waste that is recycled | 3 | 2 | 2 | 1 | 1 | 6 | 4 | 24 | C+ |
| BE6 | Total water consumption per capita (liters/day) | 3 | 1 | 1 | 3 | 1 | −3 | 5 | −15 | B- |
| BE3 | Percentage of city population served by wastewater collection | 2 | 3 | 2 | 2 | 1 | 6 | 5 | 30 | C+ |
| BE4 | Percentage of city’s wastewater receiving centralized treatment | 3 | 3 | 2 | 3 | 3 | 9 | 8 | 72 | E+ |
| BE5 | Percentage of city population with potable water supply service | 3 | 2 | 2 | 2 | 2 | 6 | 6 | 36 | D+ |
| SC1 | Green area (hectares) per 100,000 population | 1 | 3 | 2 | 2 | 3 | 3 | 7 | 21 | C+ |
| Strategic Areas | Smart Strategies and Applications | KPIs Involved |
|---|---|---|
| MOBILITY | Autonomous vehicles | E01, E02, PC1, PC2, PC3, PC4, PC5, PC6 |
| Intelligent traffic signals | E01, E02, PC1, PC2, PC3, PC4, PC5, PC6 | |
| Congestion pricing | E01, E02, PC1, PC2, PC3, PC4, PC5, PC6 | |
| Real-time public transit information | PC1, PC2, PC3, PC4, PC5, PC6 | |
| Demand-based micro-transit | PC1,PC2, PC3, PC4, PC5, PC6 | |
| Smart parking | PC1, PC2, PC3 | |
| Digital public transit payment | PC3, PC6 | |
| Predictive maintenance of transportation infrastructure | E01, PC6 | |
| ENERGY | Building automation systems | E01, E02, PC3 |
| Home energy automation systems | E01, E02, PC3 | |
| Home energy consumption tracking | E01, E02, PC3 | |
| Smart streetlight | E01, E02, PC3 | |
| Dynamic electricity pricing | E01, E02, PC3 | |
| Distribution automation systems | E01, E02, PC3 | |
| WATER | Water consumption tracking | BE6, BE3 |
| Leakage detection and control | BE3, BE4 | |
| Smart irrigation | SC1 | |
| Water quality monitoring | BE6, BE3 | |
| WASTE | Digital tracking and payment for waste disposal | BE1, BE2 |
| Optimization of waste collection routes | BE1, BE2 |
Publisher’s Note: MDPI stays neutral with regard to jurisdictional claims in published maps and institutional affiliations. |
© 2021 by the authors. Licensee MDPI, Basel, Switzerland. This article is an open access article distributed under the terms and conditions of the Creative Commons Attribution (CC BY) license (https://creativecommons.org/licenses/by/4.0/).
Share and Cite
Fiscal, P.R.; Taratori, R.; Pacho, M.A.; Ioakimidis, C.S.; Koutra, S. A Strategic and Smart Environmental Assessment of Rapid Urbanization in Beijing. Energies 2021, 14, 5138. https://doi.org/10.3390/en14165138
Fiscal PR, Taratori R, Pacho MA, Ioakimidis CS, Koutra S. A Strategic and Smart Environmental Assessment of Rapid Urbanization in Beijing. Energies. 2021; 14(16):5138. https://doi.org/10.3390/en14165138
Chicago/Turabian StyleFiscal, Paulina Rodríguez, Rallou Taratori, Marie Abigail Pacho, Christos S. Ioakimidis, and Sesil Koutra. 2021. "A Strategic and Smart Environmental Assessment of Rapid Urbanization in Beijing" Energies 14, no. 16: 5138. https://doi.org/10.3390/en14165138
APA StyleFiscal, P. R., Taratori, R., Pacho, M. A., Ioakimidis, C. S., & Koutra, S. (2021). A Strategic and Smart Environmental Assessment of Rapid Urbanization in Beijing. Energies, 14(16), 5138. https://doi.org/10.3390/en14165138