Abstract
The energy supply in Austria is significantly based on fossil natural gas. Due to the necessary decarbonization of the heat and energy sector, a switch to a green substitute is necessary to limit CO2 emissions. Especially innovative concepts such as power-to-gas establish the connection between the storage of volatile renewable energy and its conversion into green gases. In this paper, different methanation strategies are applied on syngas from biomass gasification. The investigated syngas compositions range from traditional steam gasification, sorption-enhanced reforming to the innovative CO2 gasification. As the producer gases show different compositions regarding the H2/COx ratio, three possible methanation strategies (direct, sub-stoichiometric and over-stoichiometric methanation) are defined and assessed with technological evaluation tools for possible future large-scale set-ups consisting of a gasification, an electrolysis and a methanation unit. Due to its relative high share of hydrogen and the high technical maturity of this gasification mode, syngas from steam gasification represents the most promising gas composition for downstream methanation. Sub-stoichiometric operation of this syngas with limited H2 dosage represents an attractive methanation strategy since the hydrogen utilization is optimized. The overall efficiency of the sub-stoichiometric methanation lies at 59.9%. Determined by laboratory methanation experiments, a share of nearly 17 mol.% of CO2 needs to be separated to make injection into the natural gas grid possible. A technical feasible alternative, avoiding possible carbon formation in the methanation reactor, is the direct methanation of sorption-enhanced reforming syngas, with an overall process efficiency in large-scale applications of 55.9%.
1. Introduction
To minimize carbon dioxide (CO2) emissions and the dependence on energy imports, many European countries see a large potential of biomass gasification for energy or synthetic fuel production. All aspects—heat, power and synthetic fuel production—are regarded in so-called poly-generation concepts, for which gasification represents a key technology [1]. Moreover, biomass is featured with carbon neutrality, which makes clean biomass-based fuel (b-fuel) production through gasification very attractive in future energy systems [2].
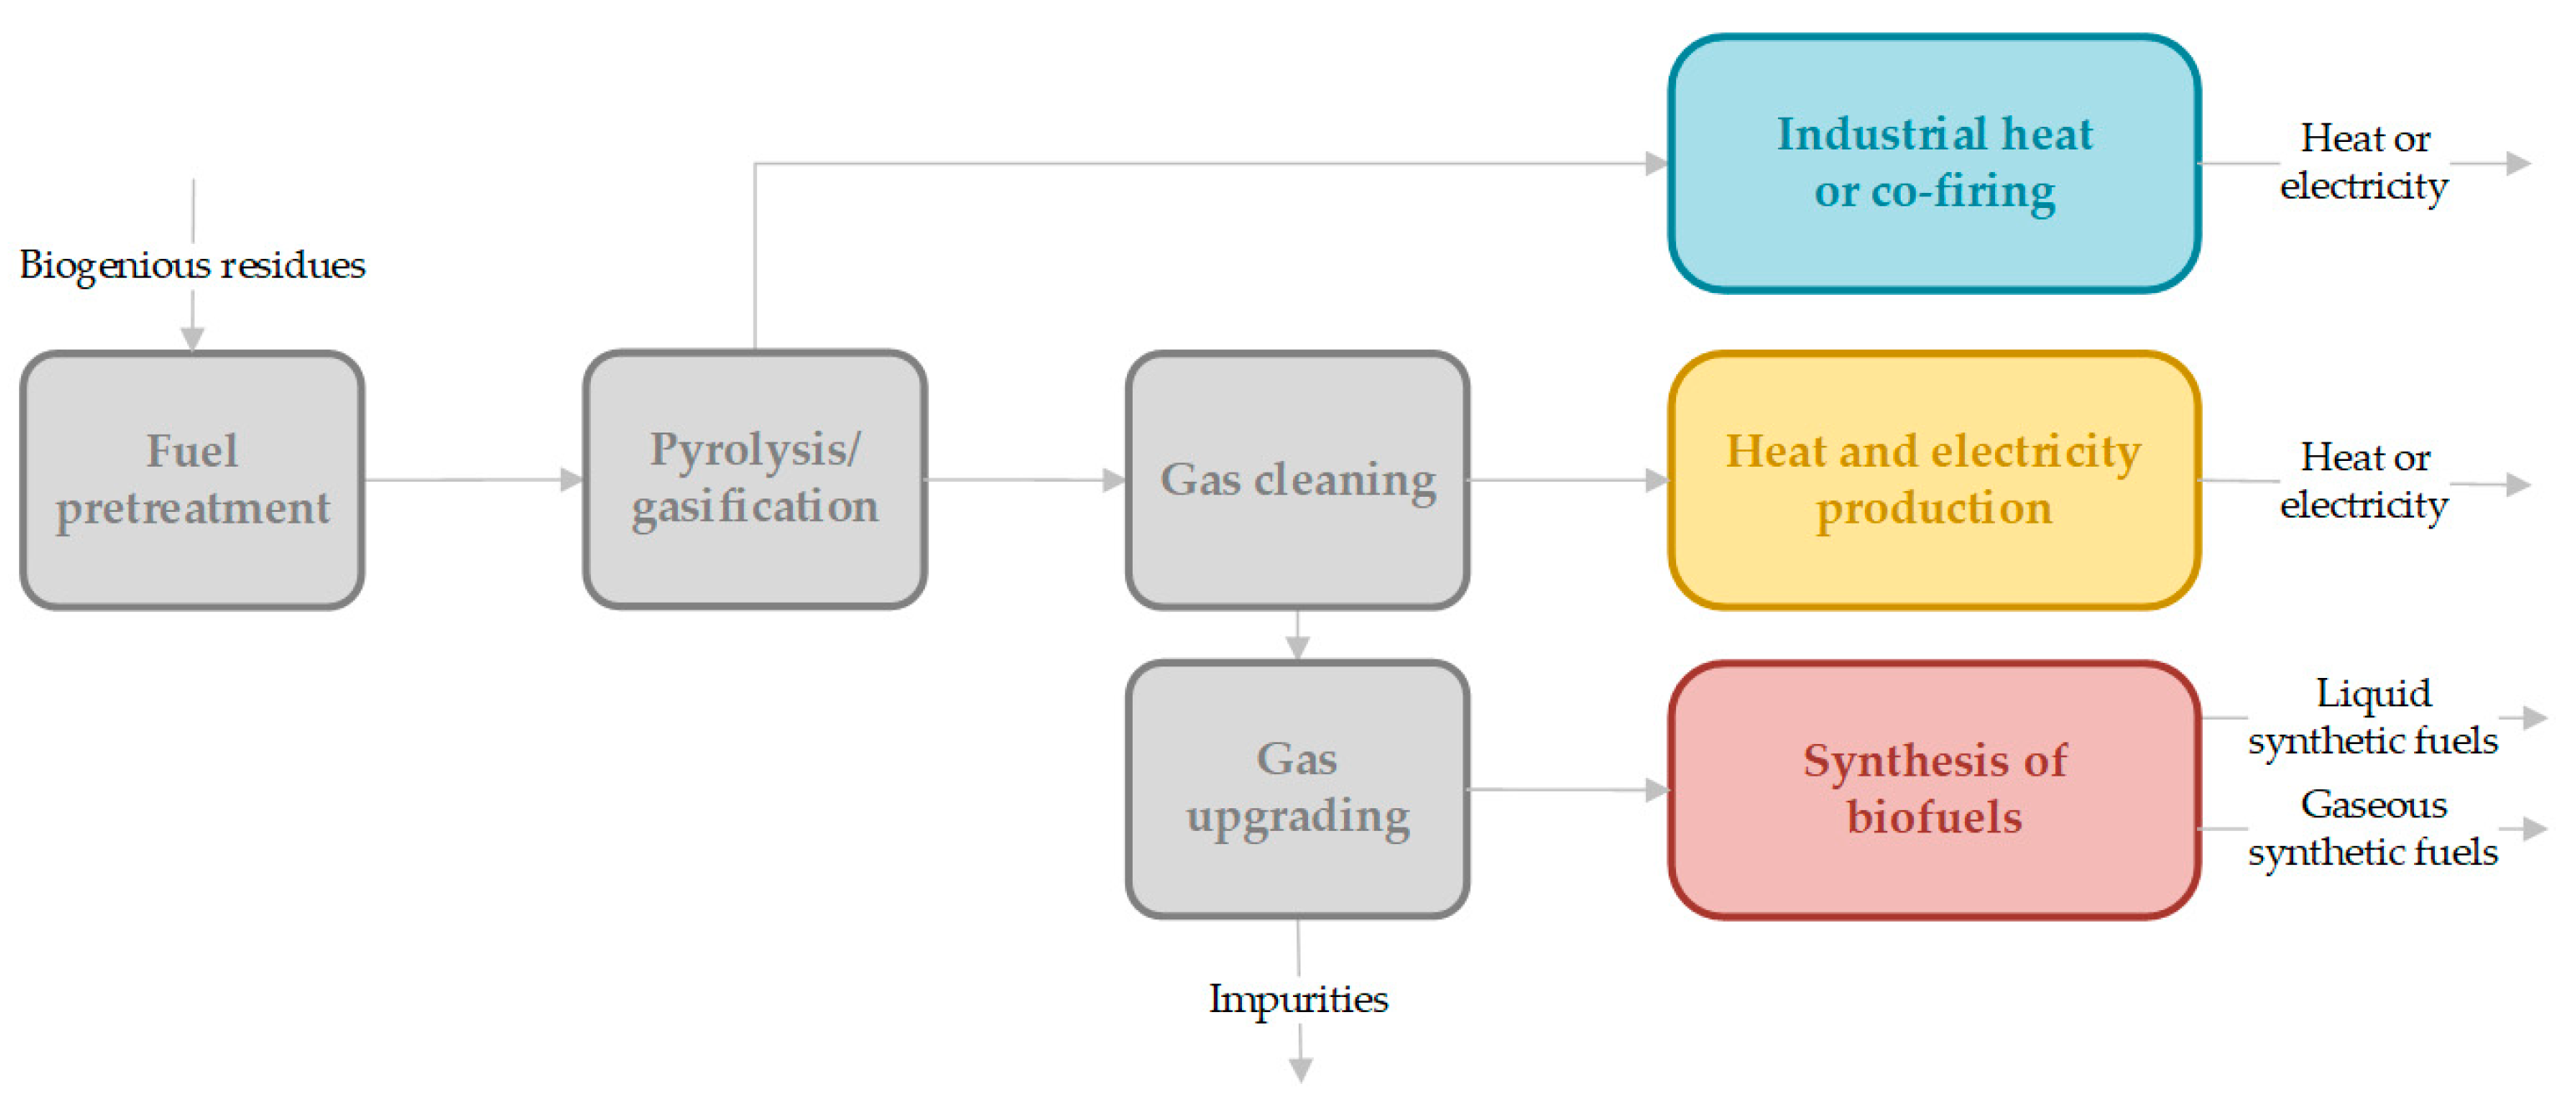
Basic considerations of the total process chain of gasification, including up- and down-stream process elements, have been discussed in a review by Hofbauer [3], in which the important process principles are explained in detail. A basic flowchart of the process units in gasification processes can be seen in Figure 1. Especially for synthetic fuel or electro-fuel (e-fuel) production, a specific gas composition (e.g., H2/COx ratio) without impurities or catalyst poisons needs to be ensured. However, further extensive gas cleaning and gas upgrading are required in this process route. Biofuels or e-fuels (especially synthetic natural gas (SNG)) can be stored as green energy carriers in existing infrastructure. For the application of syngas in an industrial heat or co-firing process, no specific gas cleaning steps are necessary. In combined heat and power generation, gas cleaning from tar and solid particles is required.
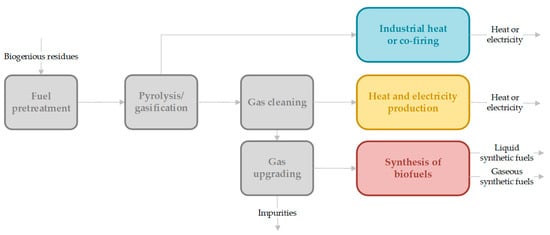
Figure 1.
Process units in gasification technology for the production of energy carriers (heat or electricity) or biofuels (Fischer Tropsch products, methanol (liquid) and di-methyl-ether and SNG (gaseous)), inspired by [3], Hofbauer: 2012.
Gasification reactors are distinguished by their fluid mechanical properties in fixed and fluidized bed systems [4]. In fixed-bed gasifiers, mainly coal or waste is used to generate a producer gas. More details on the working principle of fixed-bed gasifiers, as used for example at “Schwarze Pumpe” in Germany, can be found in [5]. In fluidized bed gasification, a bed material—catalytically active or inert—enables very good heat and mass transfer through an equal temperature distribution in the reactor and fuel mixing. The gas used for fluidization also serves as a gasification agent, which can be steam [6], air [7,8] or CO2 [9,10,11,12]. The latter method contributes to a conversion of CO2 as a carbon capture and utilization (CCU) technology. Dependent on the gas velocity and the particle size distribution of the bed material, two different types of fluidized bed gasifiers exist: bubbling and circulating fluidized beds [13]. The research group of Hofbauer combined these two technologies and developed the dual fluidized bed (DFB) configuration, which offers more advantages for syngas production, such as the production of a nitrogen-free syngas without the need of pure oxygen [3]. Additionally, the gasification and combustion chamber are separated. In the gasification reactor, the bed is fluidized with the gasification agent (steam or CO2), whereas the combustion chamber is fluidized by air. The generated heat from combustion is transferred to the gasification chamber via a circulating bed material (limestone or olivine) [3]. In this system, both steam and CO2 gasification processes are being investigated, whereas the latter is a new research topic which helps to reuse CO2 and enables its conversion to valuable products. Furthermore, sorption-enhanced reforming (SER) in combination with DFB technology is investigated for the production of an adjustable H2/CO ratio by using limestone as a bed material [14].
Besides feedstock characteristics (which are not considered here), the choice of the gasification set-up, the utilized gasification agent and its operation conditions, such as temperature and pressure, have a strong impact on the produced gas composition. This results in different subsequently needed gas cleaning or gas conditioning systems if the syngas is utilized for methanation processes (see Figure 1). Steam gasification processes generate a nitrogen-free syngas with a high share of hydrogen that matches the requirements for downstream synthesis processes very well. Hence, several demo plants have been realized (GoBiGas in Gothenburg, SWE [15], the Güssing Plant [16], Oberwart [17] and the 1 MW gasifier at the site of Wien Energie [18], all AUT). Syngas from CO2 gasification, which is still in an early phase of development, shows a high share of CO and CO2 and only small hydrogen amounts. SER syngas shows a very high share of hydrogen, as a special bed material removes CO2 from the producer gas through carbonation, but it is not as far developed as steam gasification. The gasification efficiency, known as cold gas efficiency, is the highest in steam gasification, with 84%, and CO2 gasification and SER feature an efficiency of 73%. This number describes the amount of chemical energy in the product gas in relation to the chemical energy of the fuel introduced in the gasification set-up minus heat losses [19].
Specified data of the gas composition from woody biomass were used from research activities from TU Wien and its 100 kWth dual-fluidized bed gasification pilot plant. Table 1 shows available feed gas compositions with softwood pellets as input material for chemical synthesis of e-fuels [20].

Table 1.
Different syngas compositions depending on gasification type based on research activities from TU Wien.
The syngas can only be used in biofuel synthesis if potential catalyst poisons such as dust, tars, C2 species (hydrocarbons with two C atoms), higher hydrocarbons (CxHy) and sulfur- and nitrogen-containing species are removed. A detailed summary of different hot and cold gas cleaning methods can be found in Asadullah et al.’s work [21].
A promising route for e-fuel production is catalytic methanation. Biological methanation also describes a well-developed SNG production method, however CO cannot be metabolized by the microorganisms applied in this technology. Therefore, CO shall be separated or converted to CO2 before the biological methanation. As CO is present in a high share (see Table 1), catalytic methanation is the preferred technology for SNG production from syngas [22]. Catalytic methanation together with electrolysis form the power-to-gas concept, in which electrical energy is converted to chemical energy [23]. The existing natural gas grid offers enormous storage potential for the green gases SNG and H2 respectively, and enables a link between the usage and seasonal storage of volatile renewable energies. Peak load boilers for district heating supply are run by natural gas, which needs to be substituted to reach the Austrian #mission2030 climate targets [24].
Different reactor set-ups for catalytic methanation processes are described in detail by Kopyscinski et al. [25]. The three basic reactors’ set-ups can be classified as follows: fixed-bed reactors (bulk or honeycomb catalysts), fluidized bed reactors or three-phase methanation reactors. In commercial applications, fixed-bed reactors are dominating [26] and can be purchased from different companies [27].
Several reactions [27] play a role in methanation processes. Hydrogenation of CO (Equation (1)) and CO2 (Equation (3)) aim at the production of methane and water. CO2 methanation can be seen as a linear combination of CO methanation and a reverse water-gas-shift reaction (rWGS) (Equation (2)). All reaction enthalpies are depicted for 298 K.
As both methanation reactions (Equations (1) and (3)) are volume-reducing reactions, higher pressures favor the production of methane. On the contrary, due to their exothermic nature, lower temperatures improve the conversion rate of COx [28]. Detailed illustrative material regarding pressure and temperature dependence of methanation reactions can be found in the publication of Gao et al. [29], where equilibrium compositions are calculated through Gibbs free energy minimization method in CHEMCAD [30].
For syngas methanation, species other than the above-mentioned also need to be considered. Syngas from gasification of carbon species crucially include hydrocarbons, whereas the main representative in the discussed case is C2H4. Consequently, many side reactions [29,31] lead to the formation of unwanted by-products, which have a negative effect on methanation performance. Coke formation follows the Boudouard reaction (Equation (4)) and leads to a blockage of active centers on the mainly used Ni-catalysts. Additionally, methane cracking leads to carbon deposition (Equation (6)) at higher temperatures (500–800 °C) [32]. Present hydrocarbons may be hydrogenated to methane (Equation (5)). Produced methane or methane included in the feed gas may undergo Equation (6) and may be cracked. However, formed carbon can undergo steam gasification (Equation (7)) and produce a syngas consisting of a mixture of CO and H2. Other side reactions are steam- or dry-reforming of ethylene, which both show an endothermic character (Equations (8) and (9)). The reaction enthalpy (at 298 K) of both of the latter mentioned reactions is calculated in HSC 10.
For full conversion, a stoichiometric H2/COx ratio, where H2/CO = 3 for CO methanation and H2/CO2 = 4 for CO2 methanation (Equations (1) and (3)), needs to be adjusted in the methanation reactor feed. This combined number is in total defined via the stoichiometric number (SN), which takes both stoichiometric ratios for CO and CO2 methanation into account (see Equation (10)). At SN = 1, a stoichiometric hydrogen supply is fed into the methanation unit according to Equations (1) and (3).
SN = yH2/(3 × yCO + 4 × yCO2)
Biomass gasification gained importance around the new millennium due to high subsidies and lower feed-in tariffs for renewable energies. Although biomass shows a lower energy density but a higher inhomogeneity compared to coal, it became an important feedstock for SNG production. Many studies have been carried out regarding the applicability for syngas methanation. Neubert et al. [33] evaluated different methanation possibilities for catalytic methanation from syngas of coal, or biomass gasification including syngas cleaning. Their simulations show that a double-stage process consisting of a structured and a fixed-bed reactor with intermediate condensate separation represents the most reasonable process design option for optimum results. Kienberger et al. [34] dealt with syngas methanation from autothermal fluidized bed gasification, where syngas was used without a pre-cleaning step from tars or sulfur components. They used a common nickel-based catalyst in a polytropic, temperature-controlled reactor. Due to the included impurities, the catalyst consumption increased during methanation processes. Even at the demonstration scale, Rehling [16] reveals that pipeline-ready SNG can be produced in the Güssing 1 MW gasifier, in which softwood was treated with downstream methanation. With improvements of the heat management between the gasification and methanation unit, the overall plant efficiency could be further increased. Basic thermodynamic evaluations of gasification types have been performed by Wang [35]. He proved that steam gasification is the preferred gasification scheme for subsequent biomethane production thanks to the high H2/CO ratio in the syngas. The performance of the different gasification schemes is evaluated by minimization of Gibbs free energy. Tremel et al. [36] modeled a combination of a small-scale biomass gasification unit with a downstream methanation unit in Aspen Plus. Both process units are realized as fluidized bed systems, and the gasifier needs to be operated at elevated pressures to avoid further compression prior to the methanation reactor. A fully heat-integrated process shows an overall efficiency of 91%, and the SNG quality meets the quality requirements for grid injection. Bartik et al. [31] also examined the combination of biomass gasification with downstream methanation in a fluidized bed, with a focus on low-temperature (300 °C) conversion at ambient pressure, as no compression energy for methanation is needed in this scheme. As gasification product gases, they assessed different syngases from SER, steam and H2O/CO2 gasification. A full conversion of CO and CO2 is only possible for SER product gases, while in the other investigated gas compositions, only full CO methanation could be achieved. Furthermore, H2O or H2O/CO2 gasification produced gases are more vulnerable to carbon formation in the methanation reactor. Steam supply up to 55 vol.% needs to be added for stable operation mode.
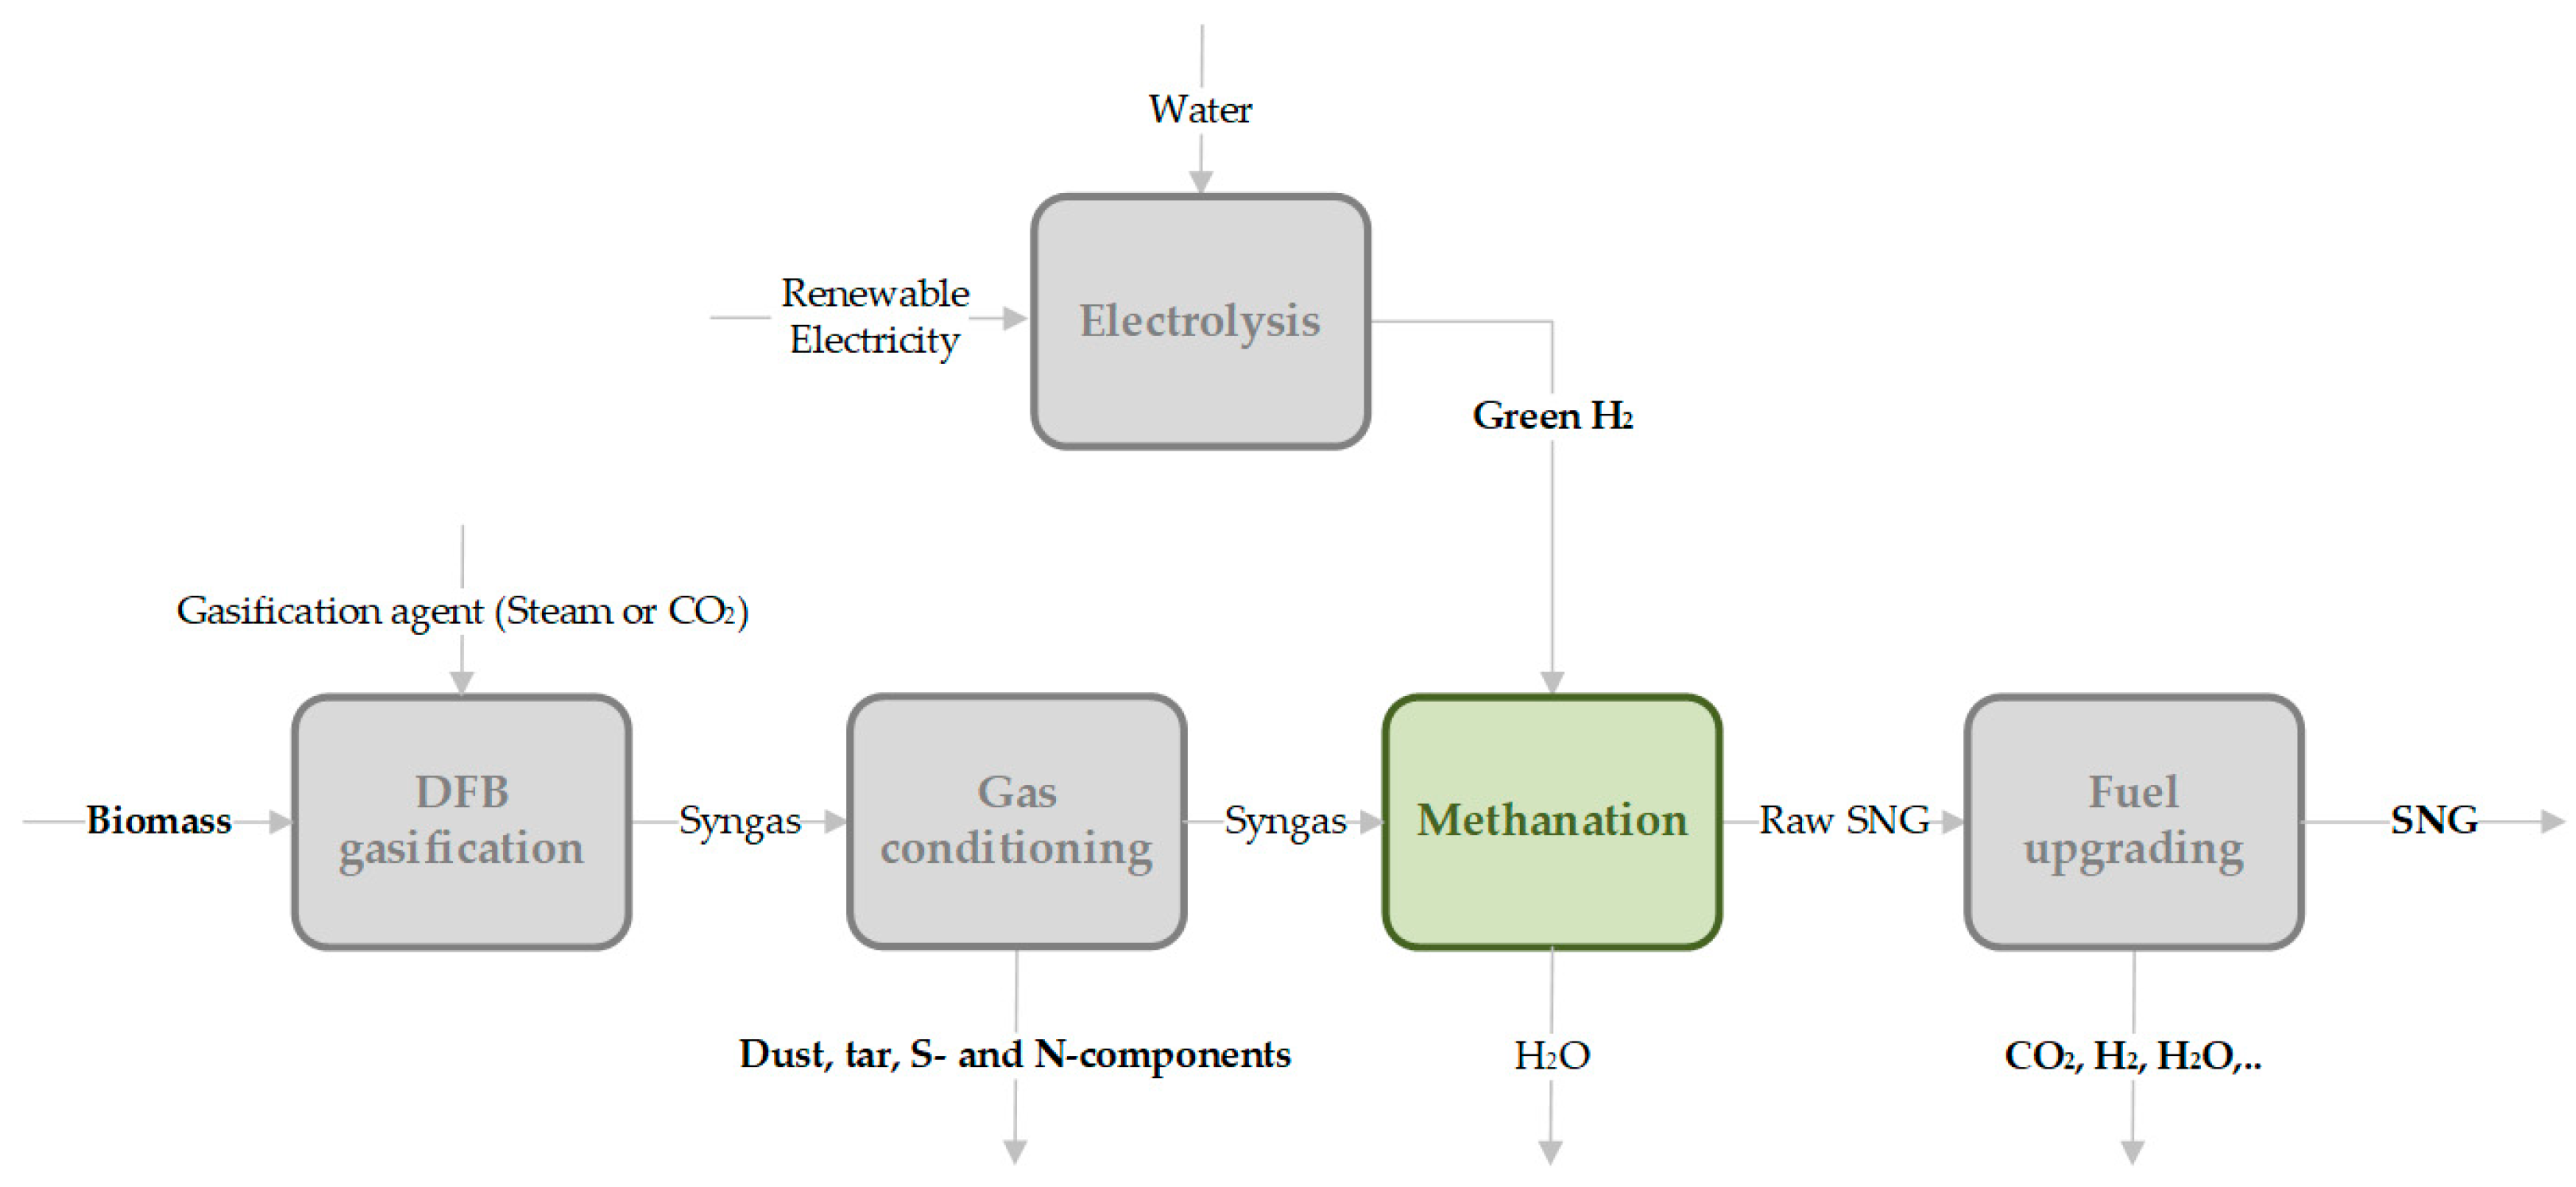
In this paper, a specific thermo-chemical production process of SNG in a fixed-bed methanation reactor is investigated. The first step of the evaluated process chain (see Figure 2) is gasification of renewable solid carbon sources with either steam, CO2 or in the SER process. For catalytic methanation, green hydrogen is assumed to be available, if needed, from water electrolysis powered by renewable electricity to ensure a climate-neutral process and product. The heterogeneously catalyzed methanation process is characterized by Equations (1)–(3). Further fuel upgrading implies the removal of all components to meet requested product quality criteria for feed into the Austrian gas grid, that are specified by the directive ÖVGW G B210 [37].
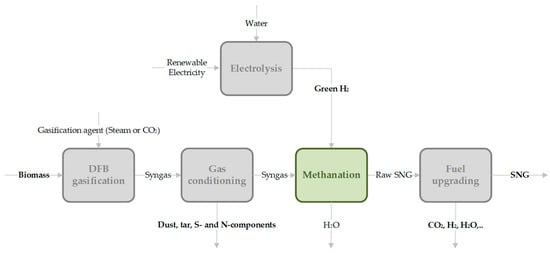
Figure 2.
General process route of thermochemical conversion of solid biomass (carbon source) via catalytic methanation to a synthetic fuel (e.g., SNG).
The novelty of the approach presented in this paper is the investigation of different methanation strategies with varying hydrogen supply downstream of the gasification unit, as this has not been considered in the literature so far. Since the syngas obtained from most of the gasification modes lacks a sufficient amount of hydrogen to perform full conversion to SNG, certain amounts of hydrogen have to be added.
The varying hydrogen supply from electrolysis enables a flexible usage of the syngas for e-fuel production depending on hydrogen availability. The limited source of renewable energy must be utilized optimally, and electrolysis capacity represents a costly investment. High costs of around 1100 EUR/kWel for PEM electrolysis are specified in 2020 by Thema et al. [38], following a predicted decreasing trend for the upcoming years. Therefore, this paper aims at investigating possibilities for syngas methanation (methanation strategies) which differ in hydrogen and carbon utilization to determine their technical feasibility, as well as identify promising approaches by evaluating the whole process chain. The detailed targets of this investigation are outlined as follows.
Direct, sub-stoichiometric and over-stoichiometric methanation of different syngas compositions are evaluated in a fixed-bed methanation set-up with thermodynamic considerations, simulation and through experimental tests. Ternary plots will demonstrate the probability of carbon formation during methanation processes and identify necessary remedial actions, such as steam supply, to shift the equilibrium composition. Experimental results applying sub- and over-stoichiometric methanation will be validated with modeled results from simulation works. These strategic considerations provide a future decision-making tool respecting given boundary conditions, such as availability of green electricity for hydrogen production or a limited investment budget. It can be conclusively pointed out which specified process configuration is technically feasible, and which is not.
Direct methanation requires no additionally produced hydrogen from electrolysis, which saves in investment costs and lowers the plant complexity. Due to the lack of hydrogen, a lower conversion rate of included carbon oxides in the syngas is expected and CO2 separation from the raw SNG is required before a feed into the gas grid. Sub-stoichiometric methanation offers less required electrolysis capacity as hydrogen shall be utilized and converted to a maximum extent. Maximum possible methane output with the provided hydrogen is targeted, taking lower carbon oxide conversion rates into account. Over-stoichiometric methanation enables full conversion of the included carbon oxides thanks to the available excess hydrogen.
Large-scale power-to-gas applications will be surveyed on their technical feasibility as the biomass input power is set to 25 MW, as this represents a large-scale scenario (see [3]). Units such as gasification output, electrolysis capacity and produced SNG from methanation are oriented towards the strategies described above. The effective extent of the biomass to SNG process chain is technically assessed, which allows to evaluate feasibility considerations for possible plant set-ups on a large scale considering available renewable power or investment budget.
2. Materials and Methods
In the following section, possible methanation operating strategies for gasification product gas pursuing different aims are described. Later, the working principle of different technical evaluation tools will be explained. Finally, it will be mentioned which evaluation tool is accordingly assessing each defined methanation strategy and why.
2.1. Different Methanation Operation Strategies (Aim of the Strategy)
- Direct methanation (low-investment strategy)
Generated syngas gas would be directly fed into the methanation unit without additional hydrogen. Direct methanation follows a low-investment strategy as the necessity for the construction of an electrolysis is not provided in this case.
This strategy is applied to all depicted syngas compositions in Table 1 (for product gas from steam gasification, from SER and from 100% CO2 gasification) to evaluate whether the included share of hydrogen is sufficient for downstream methanation and if carbon formation may occur during fuel synthesis.
- Sub-stoichiometric methanation at SN < 1 (maximum hydrogen usage)
As hydrogen is a valuable input in methanation processes because of its high specific production costs, its consumption is minimized, pursuing the smallest share of hydrogen present in the raw synthetic natural gas after methanation, while maximum carbon conversion is targeted. More specifically, the SN will be lowered in the feed to a selected sub-stoichiometric proportion, which ensures a maximum usage of the available hydrogen from electrolysis, while the highest possible carbon utilization in methanation is also considered at the same time. Through this operation strategy, hydrogen demand, and therefore electrolysis capacity, investment and renewable electricity consumption, can be reduced to a minimum level, which on the other hand ensures optimized carbon conversion.
This strategy is applied to product gas from steam gasification in the experimental evaluation section, as this syngas composition strikes the best balance between included hydrogen in the syngas and additionally needed hydrogen produced via electrolysis. SER offers a very high share (70 vol.%) and CO2 gasification a too-low (5 vol.%) share of hydrogen in the syngas. Considering the SER syngas composition, hydrogen is already present in a widely over-stoichiometric ratio (SN > 1). In the case of 100% CO2 gasification, the syngas offers a very low hydrogen share (SN = 0.05), requiring a significant large electrolysis capacity. Due to these extremely different hydrogen shares (either too high or very little), these syngas compositions are not considered in experimental tests pursuing sub-stoichiometric methanation.
- Over-stoichiometric methanation at SN > 1 (maximum carbon usage)
For the desired full conversion of COx, sufficient hydrogen needs to be present. Since syngas contains a small share of methane, the chemical equilibrium shifts to the educt side in methanation processes as one of the reaction products is included in the feed. A slight surplus of hydrogen in the feed for methanation will shift the equilibrium back to the product side, enables full conversion of the present COx components in the syngas, limits carbon deposition and achieves high selectivity for methane. A technologically evaluated hydrogen excess lies at 3% above methanation stoichiometry, as it has been assessed by Krammer et al. [39] for the production of a satisfying product gas composition.
This strategy will only be applied to steam gasification syngas in the experimental section following the same arguments as mentioned in the section on the sub-stoichiometric methanation strategy.
To summarize the approach presented here, an overview about the applied methanation strategies on different syngas compositions is shown in Table 2.

Table 2.
Overview of applied methanation strategies on different syngas types with additional hydrogen supply from electrolysis (*).
2.2. Technical Evaluation Tools
- Basic thermodynamic evaluations
Fundamental thermodynamic evaluations of Gibbs free energy (ΔG) were conducted with the software HSC 10, as the minimization of ΔG features chemical equilibrium and predicts occurring reactions during methanation processes, assuming ideal gas mixtures. Equations (1)–(9) will be assessed.
- Ternary plot
With the help of a ternary diagram, the investigated syngas composition can be shown as a single point at chemical equilibrium in a 2D coordinate system described by the C-H-O-ratio. Six species which appear in Equations (1)–(4) are constituted of three atoms, namely C, H and O. Equilibrium lines of carbon deposition (depending on selected temperature and pressure) will be implemented, dividing the area in which carbon deposition is thermodynamically possible (above lines) or not (below lines). The ternary plot visualizes if carbon deposition occurs for each specific syngas composition. Frick et al. [40] and Bai et al. [41] also used ternary diagrams for visualizing possible carbon formation in methanation processes and approved that ternary diagrams are an adequate tool for the design-finding procedure of the methanation section.
- Determination of the optimum sub-stoichiometric hydrogen feed
Aspen Plus was used to model the syngas conversion in a catalytic methanation process and to predict the raw SNG composition. To find the optimum hydrogen supply for sub-stoichiometric methanation, two Gibbs reactors assuming thermodynamic equilibrium by minimization of Gibbs free energy were applied. In this simulation, the lowest possible hydrogen feed is modeled chasing two different but coupled goals. Firstly, the least possible share of hydrogen in the product gas should be obtained. Secondly, the available hydrogen is supposed to convert itself with as many carbon oxides as possible. This results in the main goal of this strategy, which is described by a full conversion of the valuable resource, hydrogen, because of its costly and energy-intensive production.
- Lab-scale experiments
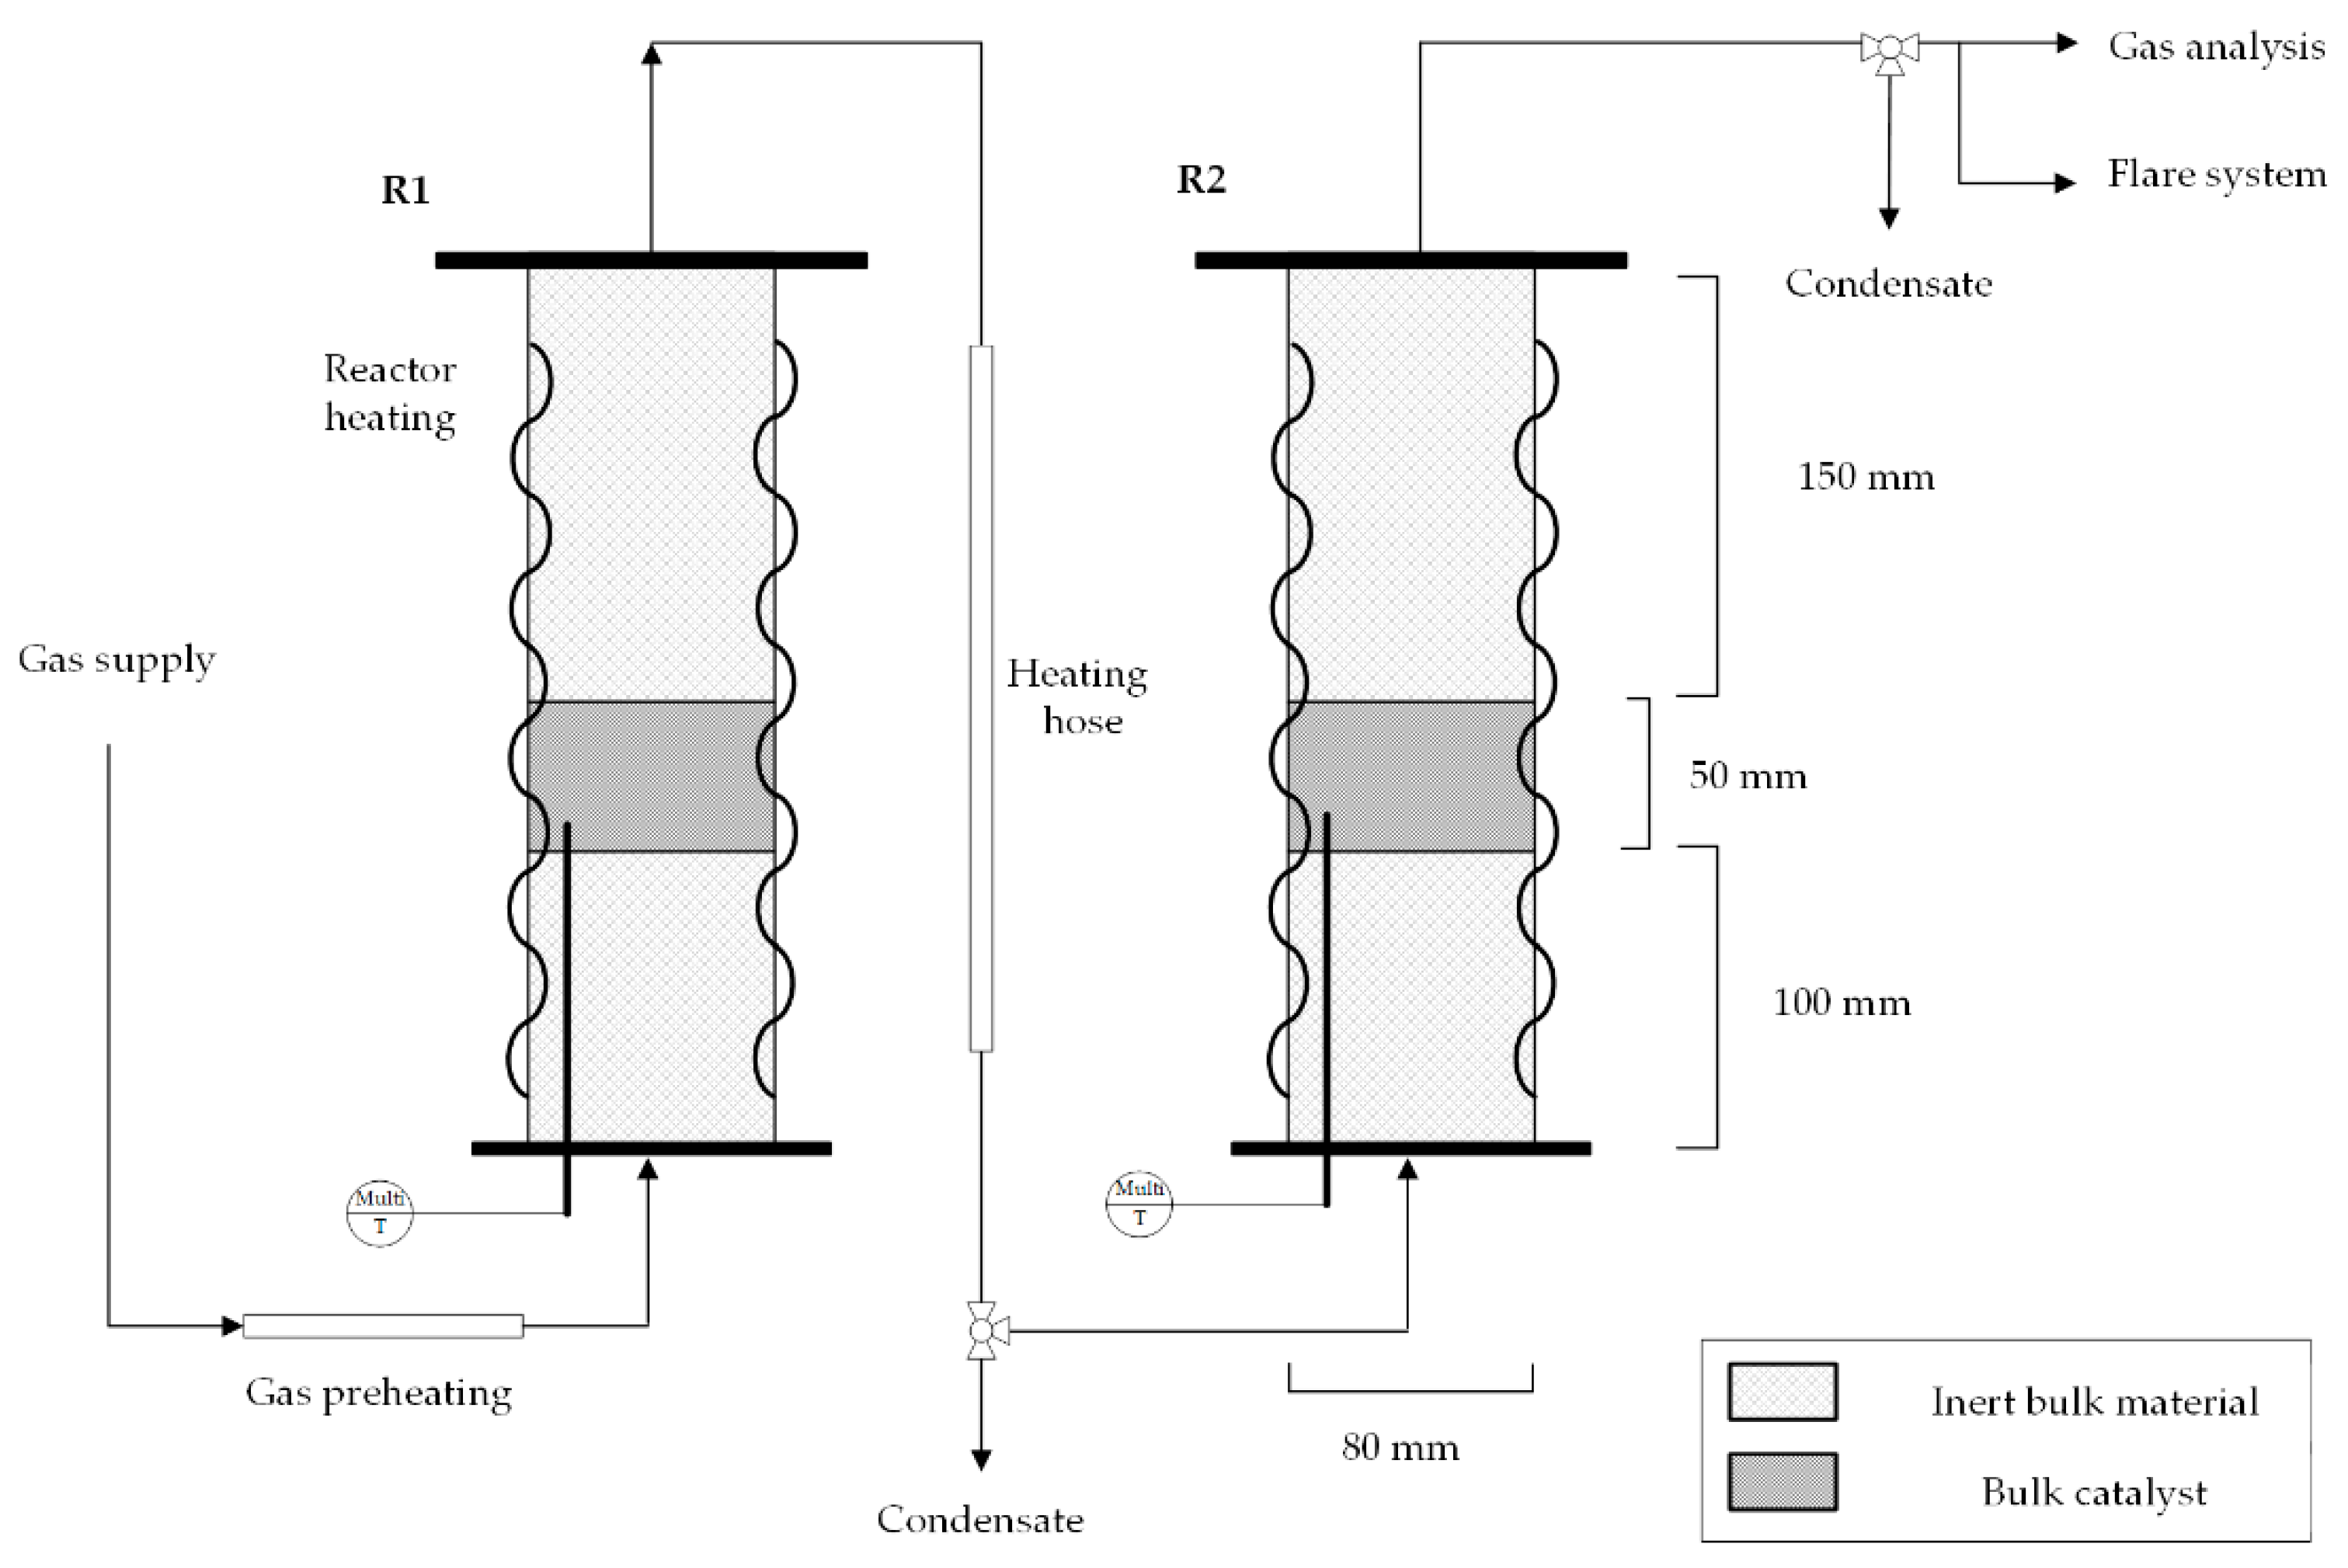
As an experimental methanation set-up, the laboratory reactor cascade at the Chair of Process Technology in Leoben was used (see Figure 3). The pilot plant consists of three fixed-bed reactors, which can be operated alone or in series, and each of them is filled with 0.25 L of a commercial 20 wt.% Ni-bulk catalyst named Meth 134®. To examine the methanation performance of syngas from steam gasification, two fixed-bed reactors were operated in series. The first reactor stage reaches thermodynamic equilibrium and hinders the full conversion of COx. Gas mixtures, synthetically mixed from gas bottles, according to Table 1, can be fed with up to 50 LSTP/min, and a maximum pressure of 20 bar. Gas cooling between the reactor stages is attained through uninsulated pipelines, so that condensate is drained at the lowest pipeline height before the inlet to the next reactor stage. A multi-thermocouple with six measuring points along the axis in the catalyst bed enables accurate temperature measurement in each reactor, which is schematically pictured in Figure 3. The gas composition of the intermediate product (after the first methanation stage) and the final product (after the second methanation stage) was analyzed with an infrared photometer (AL3000 URAS26) and a thermal conductivity analyzer (AL3000 CALDOS27) from ABB [28,42].
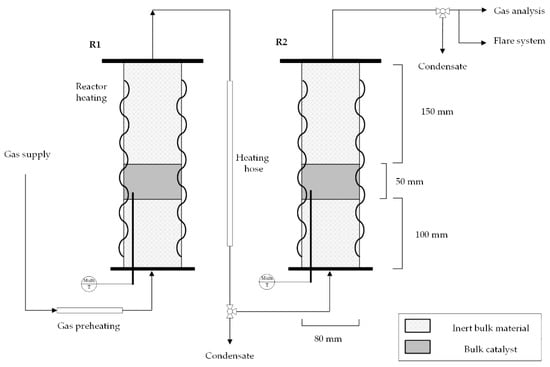
Figure 3.
Laboratory double-stage methanation set-up consisting of two fixed-bed reactors (R1 and R2) with an introduced multi-thermocouple in the catalyst bed.
In Table 3, the synthesized gas mixtures used for experimental test runs are shown, considering both a hydrogen feed at SN = 0.78 and SN = 1.03 for steam gasification product gas. For test runs, dry gas mixtures are produced by bottled synthesized gases, and hydrocarbons are not available to be fed into the lab-scale methanation plant. The operating pressure was set to 7 bar since this pressure level strikes a good balance between necessary syngas compression and sufficient methanation performance, as CO and CO2 hydrogenation (Equations (1) and (3)) are strongly pressure-dependent [39]. The gas flow amounts to 8.4 LSTP/min, resulting in a GSHV (gas hourly space velocity) of 2000 h−1. The GHSV is calculated as the value of standard volume input flow divided by the catalyst volume.

Table 3.
Steam gasification syngas composition used for experimental lab-scale methanation test runs at 7 bar and at GHSV = 2000 h−1. Hydrogen included in the syngas and additional supplied hydrogen are indicated.
- Modeling approach for lab-scale methanation results
Experimental results were also modeled in Aspen Plus by implementing a kinetic model from Rönsch et al. [43], as the model allows a broad temperature range due to its background from dynamic methanation operation. In this model, CO2 methanation is regarded as the linear combination of CO methanation and rWGS. Rönsch et al. propose two reaction rates for CO methanation for an 18 or 50 wt.% Ni-catalyst. In the present work, the kinetic reaction rate using the 18 wt.% Ni-catalyst (published by Klose et al. [44]) was chosen as it matches best with the catalyst implemented in the laboratory set-up. The implemented reaction rate by Rönsch et al. follows the format of a LHHW (Langmuir–Hinshelwood–Hougon–Watson) approach. The reactor set-up in the simulation flowsheet is modeled as a one-dimensional plug-flow reactor system with two stages (Figure 4). This layout best represents the experimental set-up consisting of two fixed-bed reactors in series, considering the measured temperature profiles in each reactor. For the modeling process, experimental parameters such as the reactor dimensions (di = 80 mm), chosen catalyst (20 wt.% Ni-loading) with a height of 50 mm, temperature profiles, pressure level (7 bar) and the investigated feed gas composition from Table 3 were implemented in the chosen kinetic model.

Figure 4.
Aspen simulation model showing a two-stage methanation process with intermediate product gas cooling.
- Technical evaluation parameters
To assess the overall performance of the different investigated methanation strategies, several technical evaluation parameters were employed. The COx conversion given as a percentage can be specified for a single stage or for the overall process, and is characterized by Equation (12). Generally, the molarities, , are calculated by the molar flow, , and wet gas composition, , which themselves are calculated by , the dry gas composition, with specifying each component and j specifying feed or product (see Equation (11)):
The COx conversion is determined as follows (Equation (12)):
The hydrogen conversion is important, especially for the assessment of the sub-stoichiometric and over-stoichiometric strategy, and is given according to Equation (13):
For large-scale methanation applications, gross assessment was conducted for all syngas compositions depicted in Table 3, considering only technical feasible methanation strategies. The required hydrogen and the resulting electrolysis capacity, as well as the generated synthetic natural gas output, were ideally calculated and rated to the biomass input power. The evaluation of the overall efficiency of a power-to-gas set-up (Equation (14)) will be discussed in detail in the Results Section.
For large-scale power-to-gas concepts, the required electrolysis capacity was calculated via the required hydrogen amount, complying with the methanation strategies specified in Section 2.1. A specific energy demand for electrolysis of 5 kWh/m3 H2 was assumed. The capacities of electrolysis and the output of produced SNG were scaled to the biomass input power of 25 MW, while the capacities are always standardized to the lower heating value (LHV). The overall efficiency of the whole process chain from biomass to methane for the considered strategies is defined in Equation (14), with respect to the assumed constant biomass input power of 25 MW, which suitably describes a large-scale scenario [45]:
The Wobbe Index in kWh/m3STP (Equation (15)) is defined as the ratio between higher heating value of a gas mixture, , and the root of its relative density, . More details of each characteristic value can be found in [37].
2.3. Assessment Methodology for Each Methanation Strategy
The different methanation strategies from Section 2.1 will be evaluated with the technical evaluation tools from Section 2.2, as described in the following sections. Evaluation parameters from Equations (12)–(15) will be used for the validation, supporting technical assessment tools from Section 2.2 to rate different methanation strategies.
Table 4 provides an overview of which evaluation methods consisting of experiments, modeling and large-scale concept calculations were applied on each specified methanation strategy for the three different syngas compositions. All syngas compositions from Table 1 (steam gasification, SER and 100% CO2 gasification) were examined based on their potential for downstream direct methanation without additional hydrogen supply in an illustrative ternary plot (C-H-O). Experimental double-stage, lab-scale methanation test runs were only carried out for sub-stoichiometric and over-stoichiometric methanation of syngas from steam gasification. The investigated SN for sub-stoichiometric methanation was identified with Aspen Plus to be 0.78, supplying enough hydrogen so that a full conversion of hydrogen is guaranteed. At over-stoichiometric methanation, SN lies at 1.03.

Table 4.
Assessment methodology matrix showing technical figure evaluation tools applied on different methanation strategies and syngas compositions (steam gasification = SG, SER, 100% CO2 gasification = CO2-g or none (-)).
The obtained methanation results from laboratory experiments will also be shown in a ternary plot and later compared with modeled results generated in a double-stage methanation process, with implemented reaction kinetics from Rönsch in Aspen Plus. Additionally, all strategies were analyzed based on their suitability for large-scale applications.
3. Results
In this section, the main results from basic thermodynamic investigations for all syngas compositions are presented. Laboratory experimental and simulation results will be shown for two of three methanation operation strategies (sub-stoichiometric and over-stoichiometric), and ideally calculated large-scale power-to-gas set-ups will be assessed based on their technical feasibility for future industrial-scale applications.
3.1. Basic Syngas Composition Evaluation
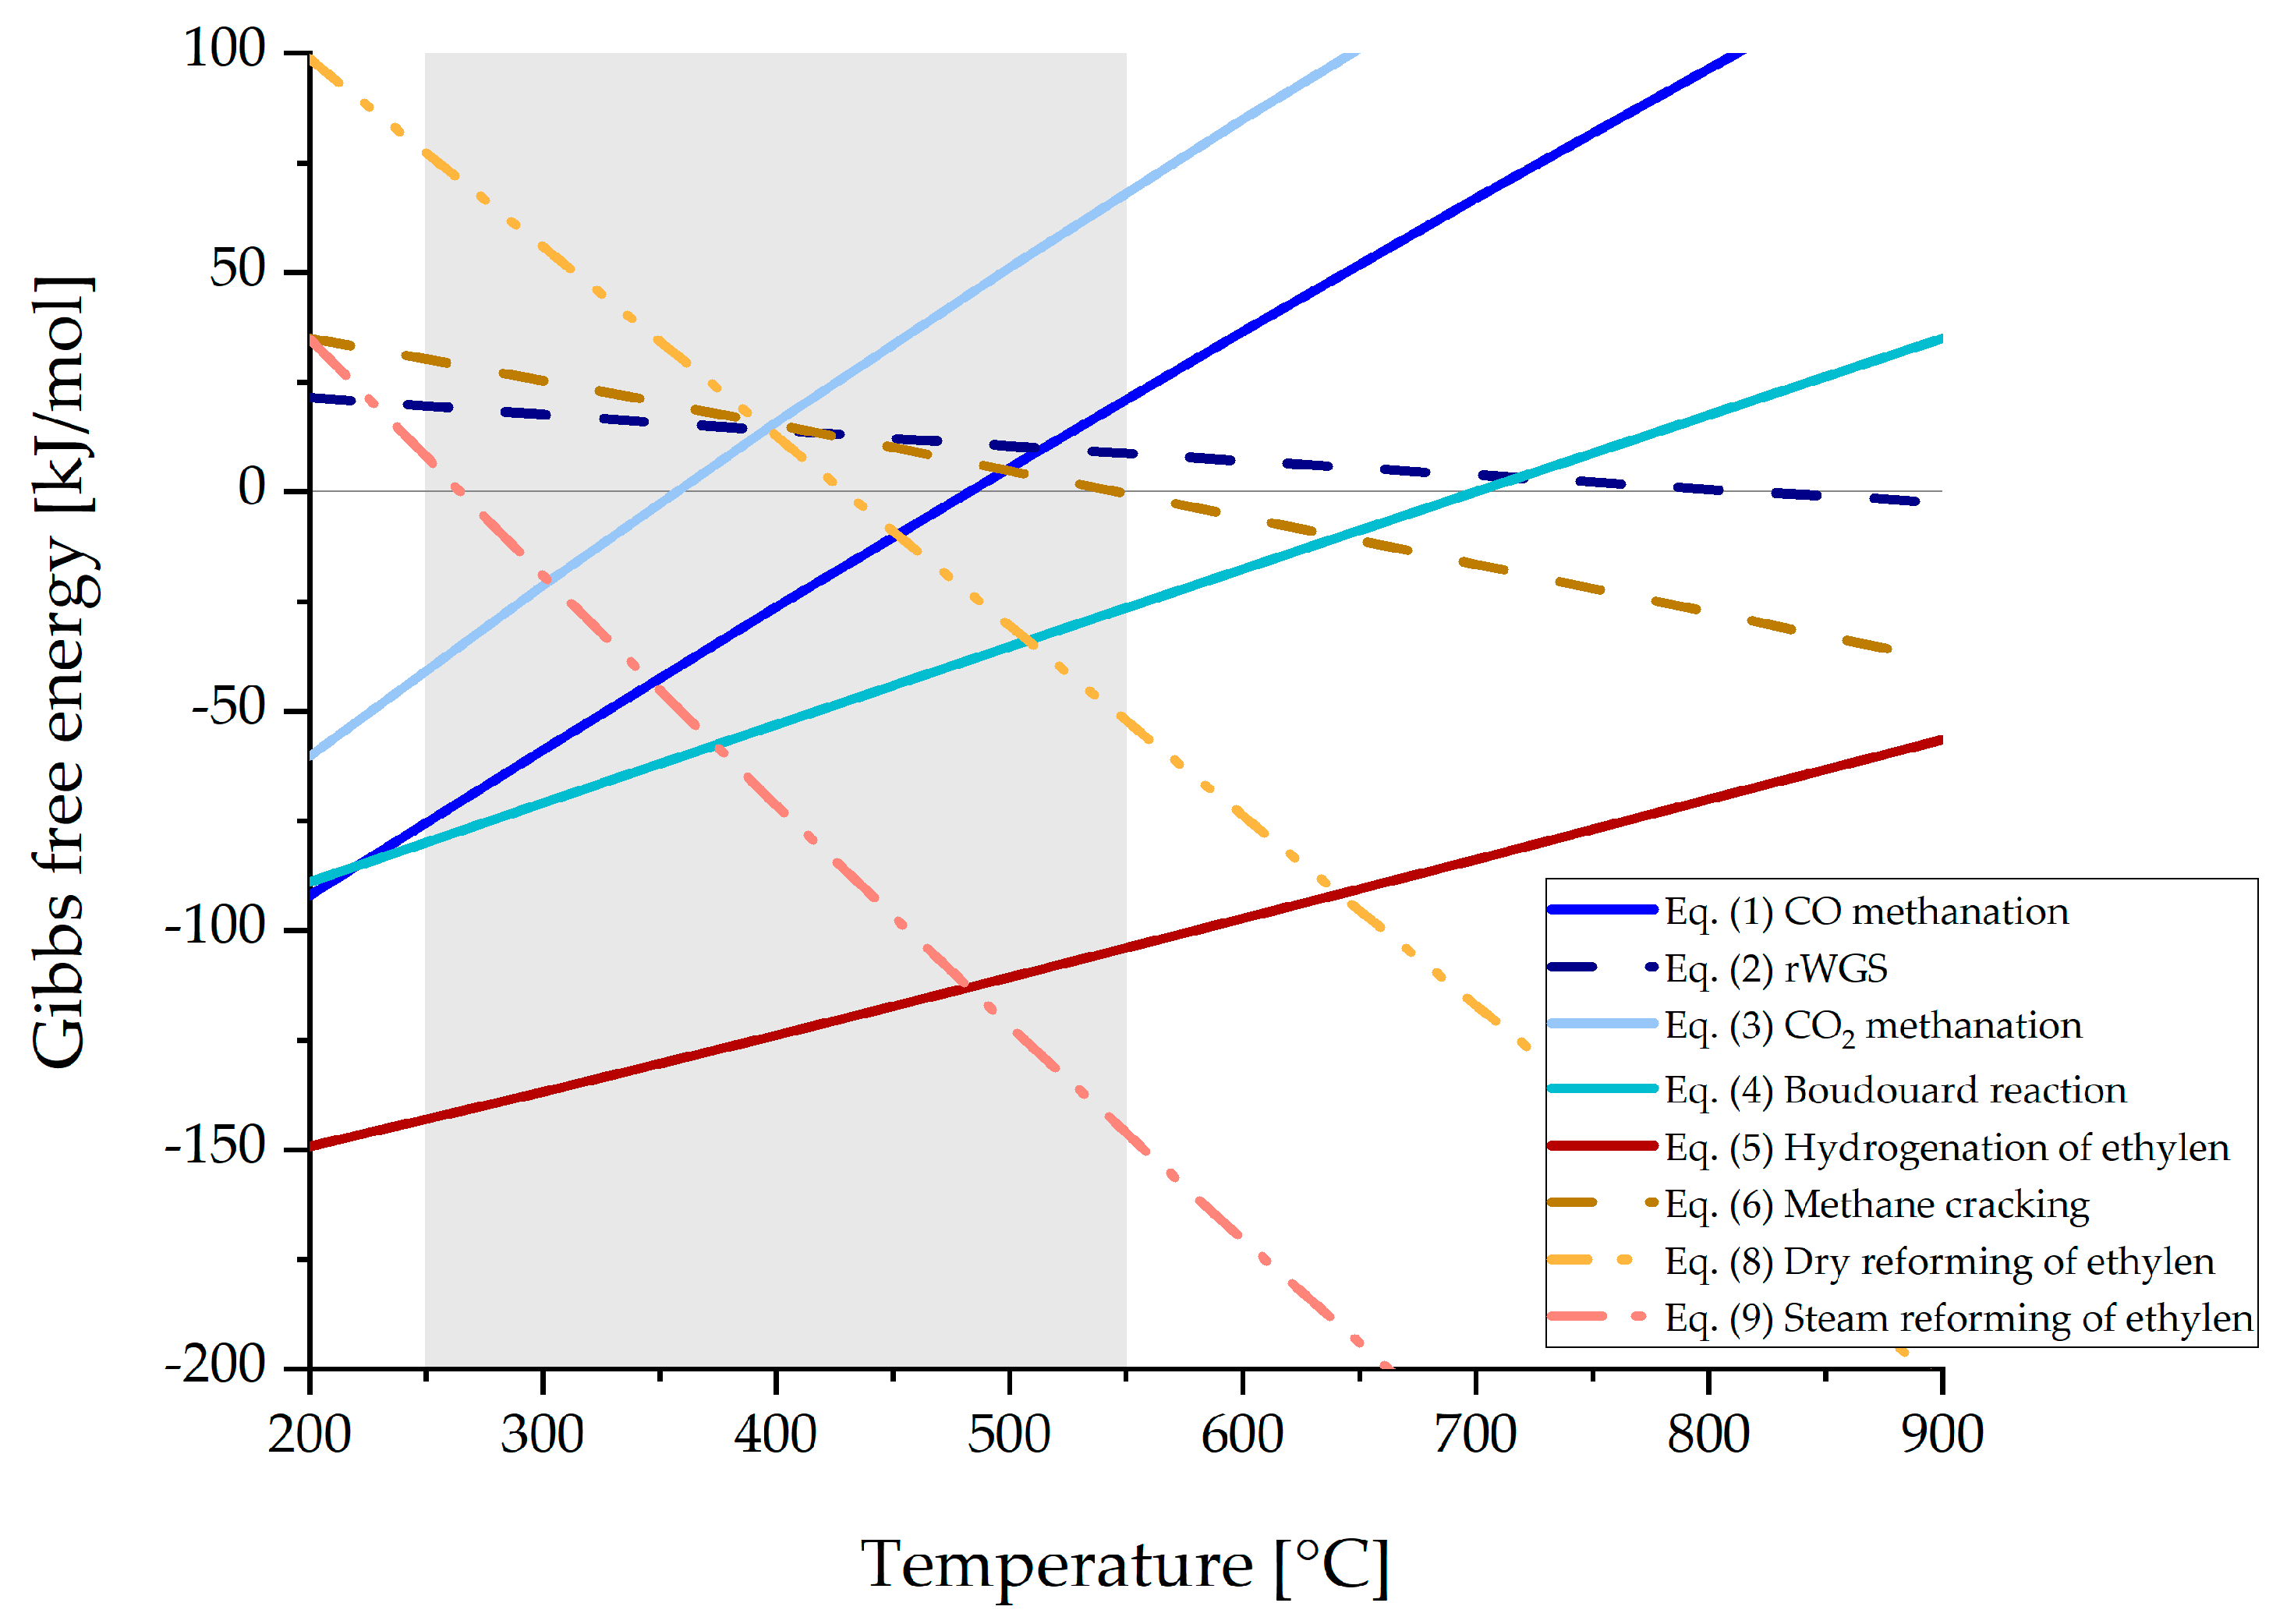
In Figure 5, Gibbs free energy of the reactions Equations (1)–(9), excluding Equation (7), are shown as a function of temperature. The grey shaded area indicates typical methanation operating temperatures from 250 to 550 °C. Below 250 °C and in the presence of carbon monoxide, poisonous Ni(CO)4 is formed, which blocks active centers on the catalyst surface. Operating temperatures above 550 °C may lead to thermal sintering of the catalyst according to the manufacturer’s specifications, which again results in a loss of catalyst activity [46].
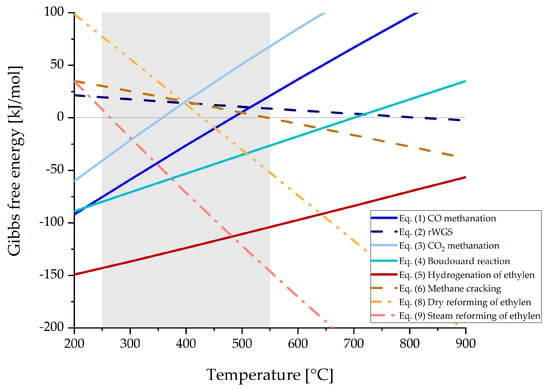
Figure 5.
Gibbs free energy for relevant reactions for syngas methanation applications, generated with HSC 10.
Exothermic reactions such as CO and CO2 methanation (Equations (1) and (3)) happen preferably at lower temperatures, while CO methanation is generally favored against CO2 methanation as the free energy values are lower. Additionally, ethylene is more likely to be hydrogenated to methane at lower operating temperatures (Equation (5)), which reduces the risk of carbon formation that emerges from methane cracking (Equation (6)), as this process would happen at elevated temperatures. At temperatures from 450 °C upwards, the dominating reactions are the hydrogenation of ethylene (Equation (5)), steam reforming of ethylene (Equation (9)), that again produces a CO/H2 mixture, and the Boudouard reaction, that raises the possibility of carbon formation. Therefore, temperatures above 550 °C should be avoided in the methanation reactor as the conversion of CO and CO2 (Equations (1) and (3)) is totally inhibited by all other reactions shown in Figure 5.
3.2. Assessed Methanation Strategies
- Direct methanation (low-investment strategy)
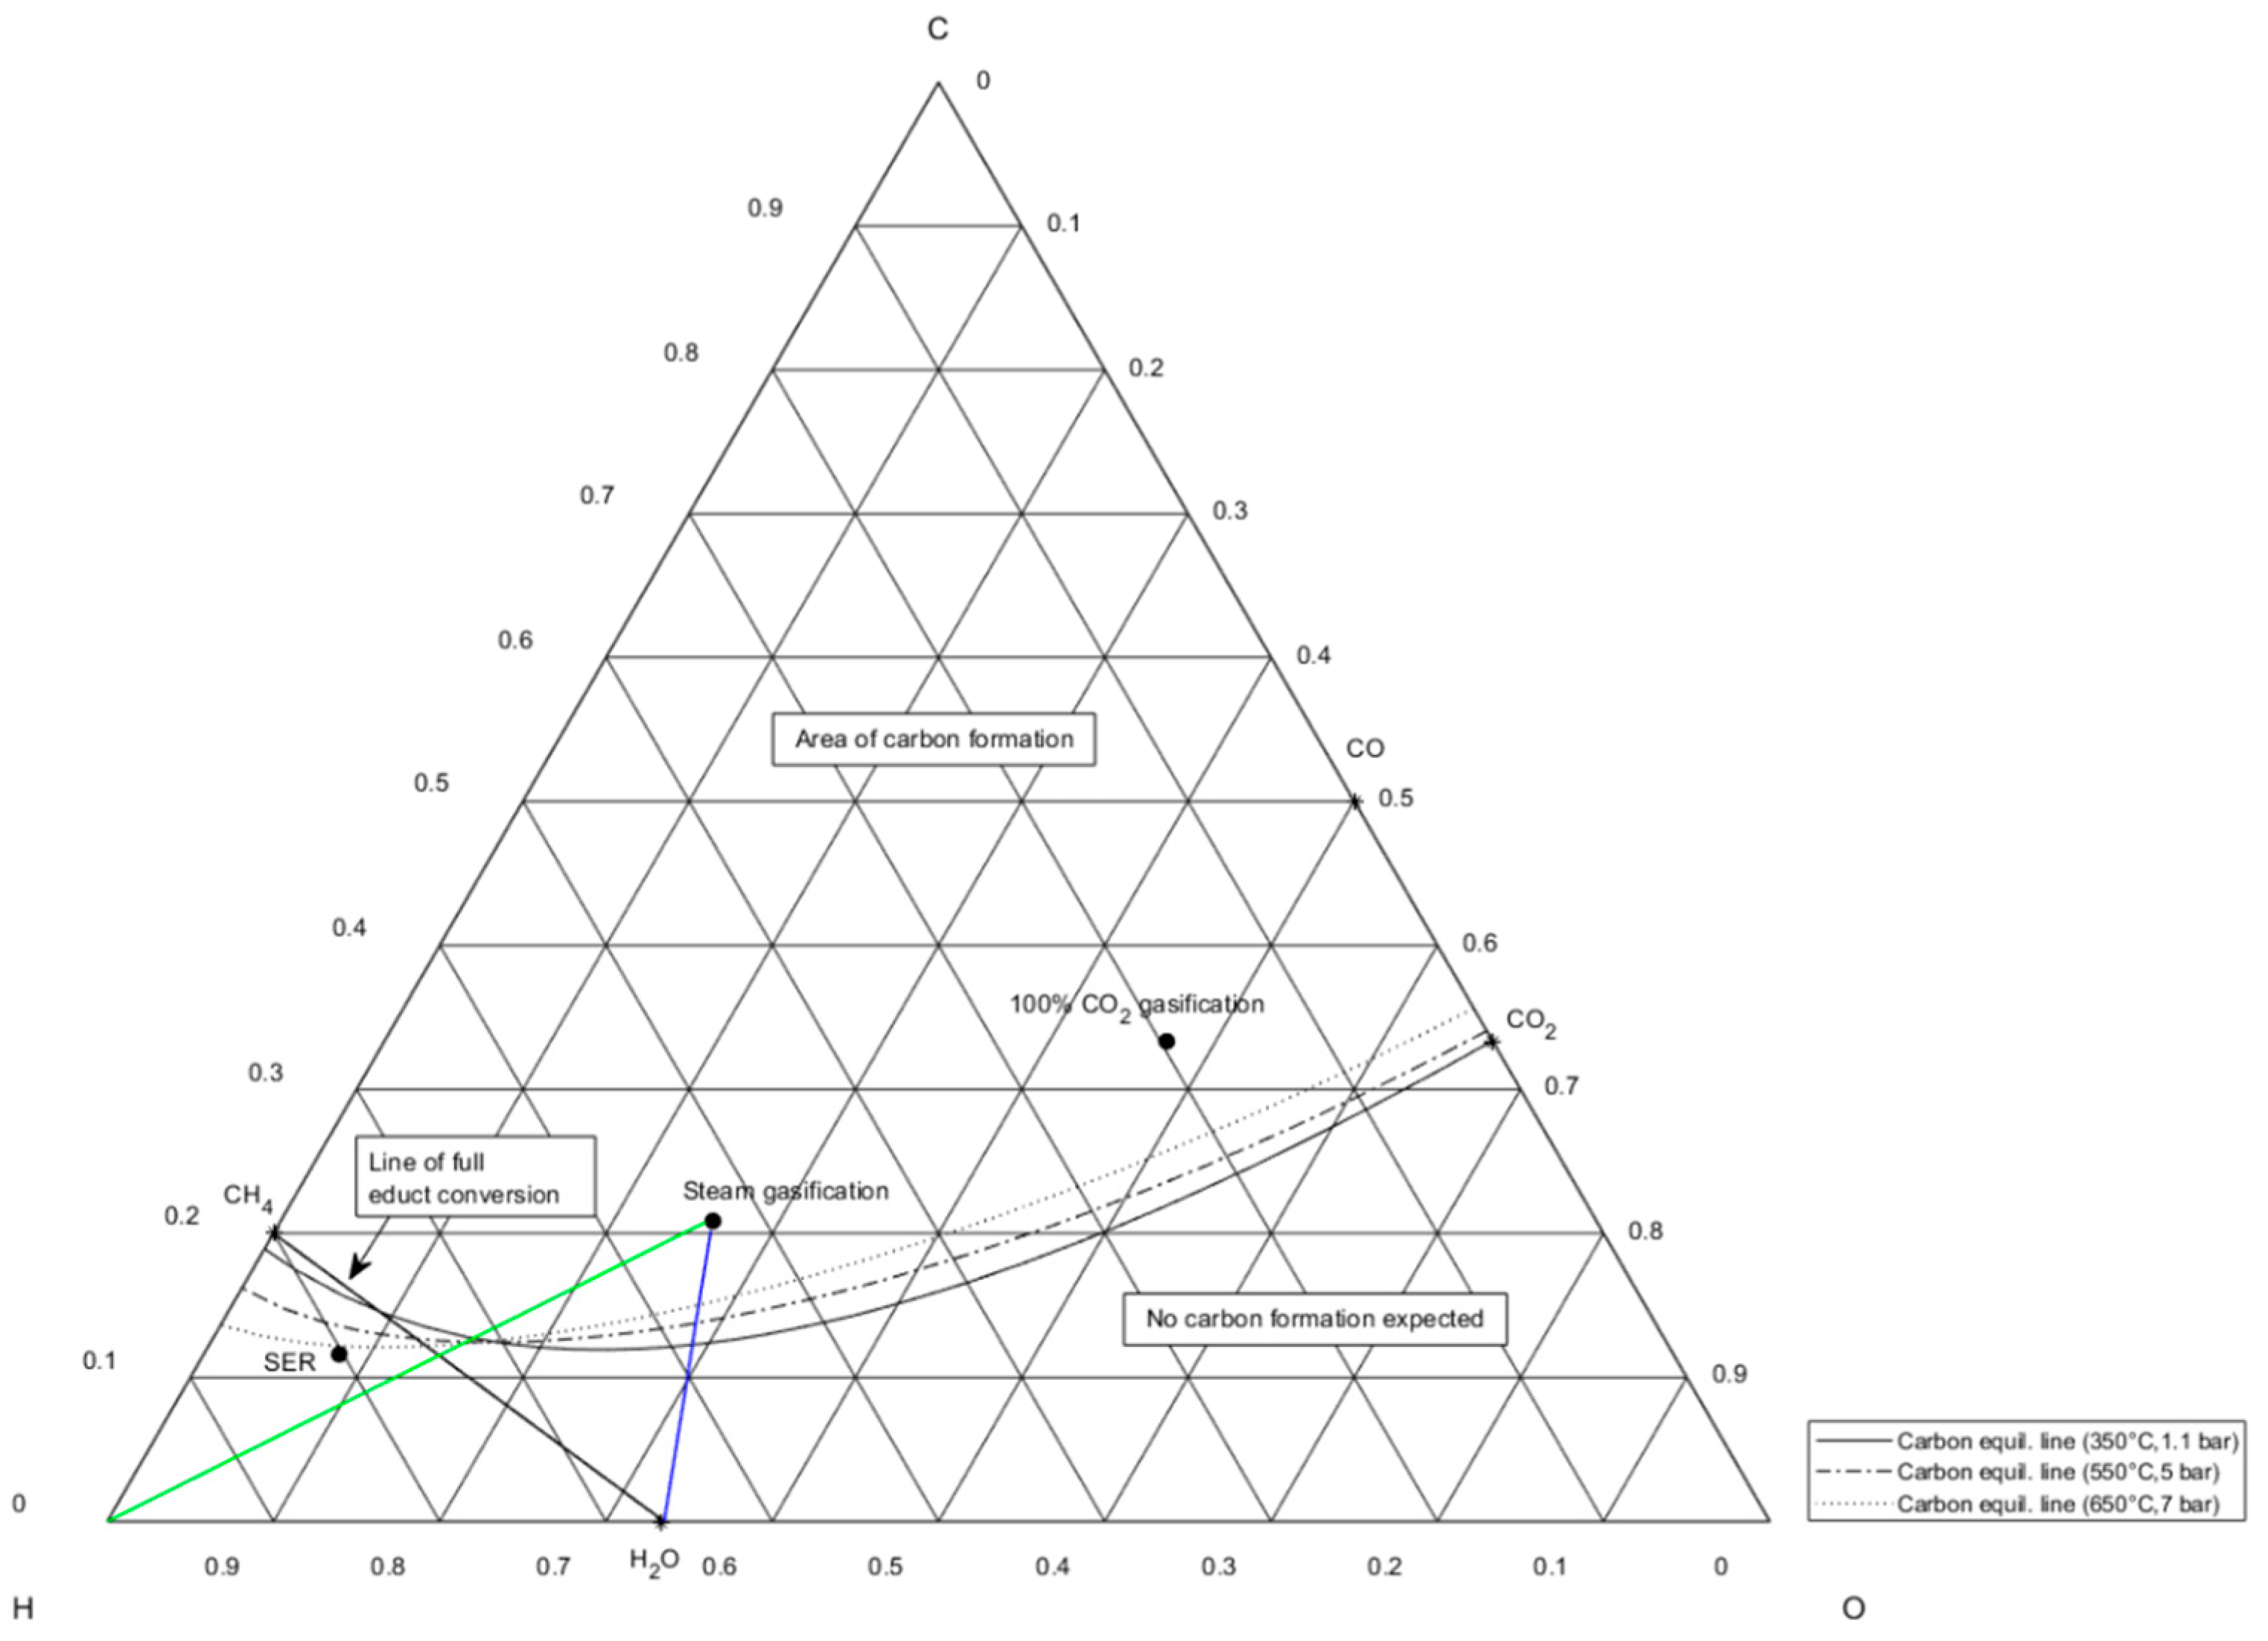
The ternary diagram in Figure 6 depicts different syngas compositions by their C-O-H ratio. The diagram shows that the product composition from SER gasification is not likely to form carbon deposition due to its high share of hydrogen (70 vol.%) in the syngas. The other two syngas compositions (from steam gasification and 100% CO2 gasification) are located above the carbon deposition line, which would lead to the formation of solid carbon in the case of direct methanation. The reason is a too-low SN, as the values lie at 0.31 and 0.05 for steam and 100% CO2 gasification, respectively. This result was also proven by Kopyscinski et al. [25], who state that gas produced from coal or biomass gasification offer a too-low hydrogen share for sufficient COx conversion and long catalyst lifetime.
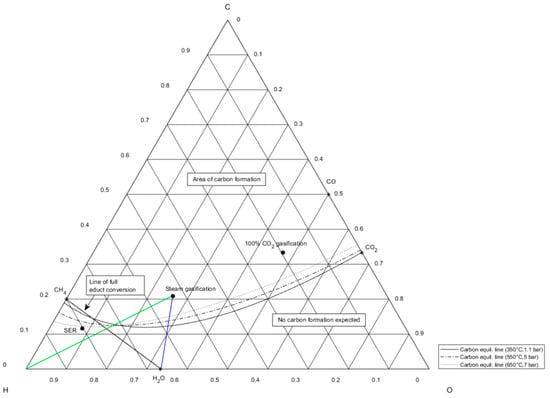
Figure 6.
Ternary C-H-O ratio diagram showing carbon equilibrium lines at different temperature and pressure levels and fractional compositions of syngas from Table 1.
A remedial action to suppress carbon formation can be the continuous dosage of water vapor, referring to Neubert [33]. Steam dosage is illustratively shown for steam gasification gas through the blue line in Figure 6 in case of no available hydrogen supply. The optimum operation point for methanation of syngas from steam gasification, which does not lie in the area of possible carbon formation, matches the intersection of the hydrogen supply line in green and the line of full educt conversion in black. Anyway, steam supply would not lead to the desired output gas compositions with a high share of methane as it pulls the C-H-O composition further away from methane on the CH4-H2O connection line in the direction of H2O. Only carbon deposition is hindered through the shift of chemical equilibrium away from the carbon formation equilibrium lines.
The strategy of direct syngas methanation is technologically implementable for small- and large-scale power-to-gas applications only under the usage of SER gasification gas, as its SN of 1.3 shows an over-stoichiometric available hydrogen share of 30%. For the two other syngas compositions, a direct methanation strategy will not yield the desired product gas composition, i.e., a high share of methane, and would immensely shorten catalyst lifetime due to carbon deposition.
- Sub-stoichiometric methanation (maximum H2 usage)
With two Gibbs reactors applied in the Aspen Plus simulation, the sub-stoichiometric ratio for maximum hydrogen usage was determined as 0.78, as mentioned in Section 2.3. As the least hydrogen should be present in the product gas after a double-stage methanation, a share of unconverted COx is expected in the unconditioned SNG. Laboratory experiments with defined dry steam gasification syngas composition from Table 3 were conducted. The results from lab-scale methanation experiments can be seen in Table 5, in which the product gas composition of sub- and over-stoichiometric steam gasification syngas methanation are shown.

Table 5.
Results of double-stage methanation experiments of steam gasification syngas in a laboratory plant at the Chair of Process Technology and Environmental Protection in Leoben.
As hydrogen is restrictedly available in the sub-stoichiometric methanation strategy, a high share of 16.8 mol% of CO2 is present in the product gas of the methanation, which would require CO2 separation before the product gas can be fed into the natural gas grid in Austria. Although only 3.45 mol% of hydrogen is present in the product gas, meeting Austria’s current quality criteria for a feed into the natural gas grid (<10 mol.%), the share of included CO2 with nearly 17 mol.% is higher than the specified value in the directive. CO2 can be separated according to today’s available technologies (amine scrubber [47,48]) to around 93%. Assuming a moderate CO2 separation rate of 90% from the raw SNG, the included share of hydrogen rises to about 4.6 mol.% and CO2 is lowered to around 1.7 mol.%, whereby the gas quality criteria can be met. The hydrogen conversion rate lies at 98.4% due to high reaction temperatures in the first methanation stage, at approximately 460 °C. In the second methanation reactor, temperature peaks were lowered due to limited occurring reactions. The average temperature in the second stage lies at 304 °C, resulting in an elevated hydrogen conversion rate after the first reactor stage.
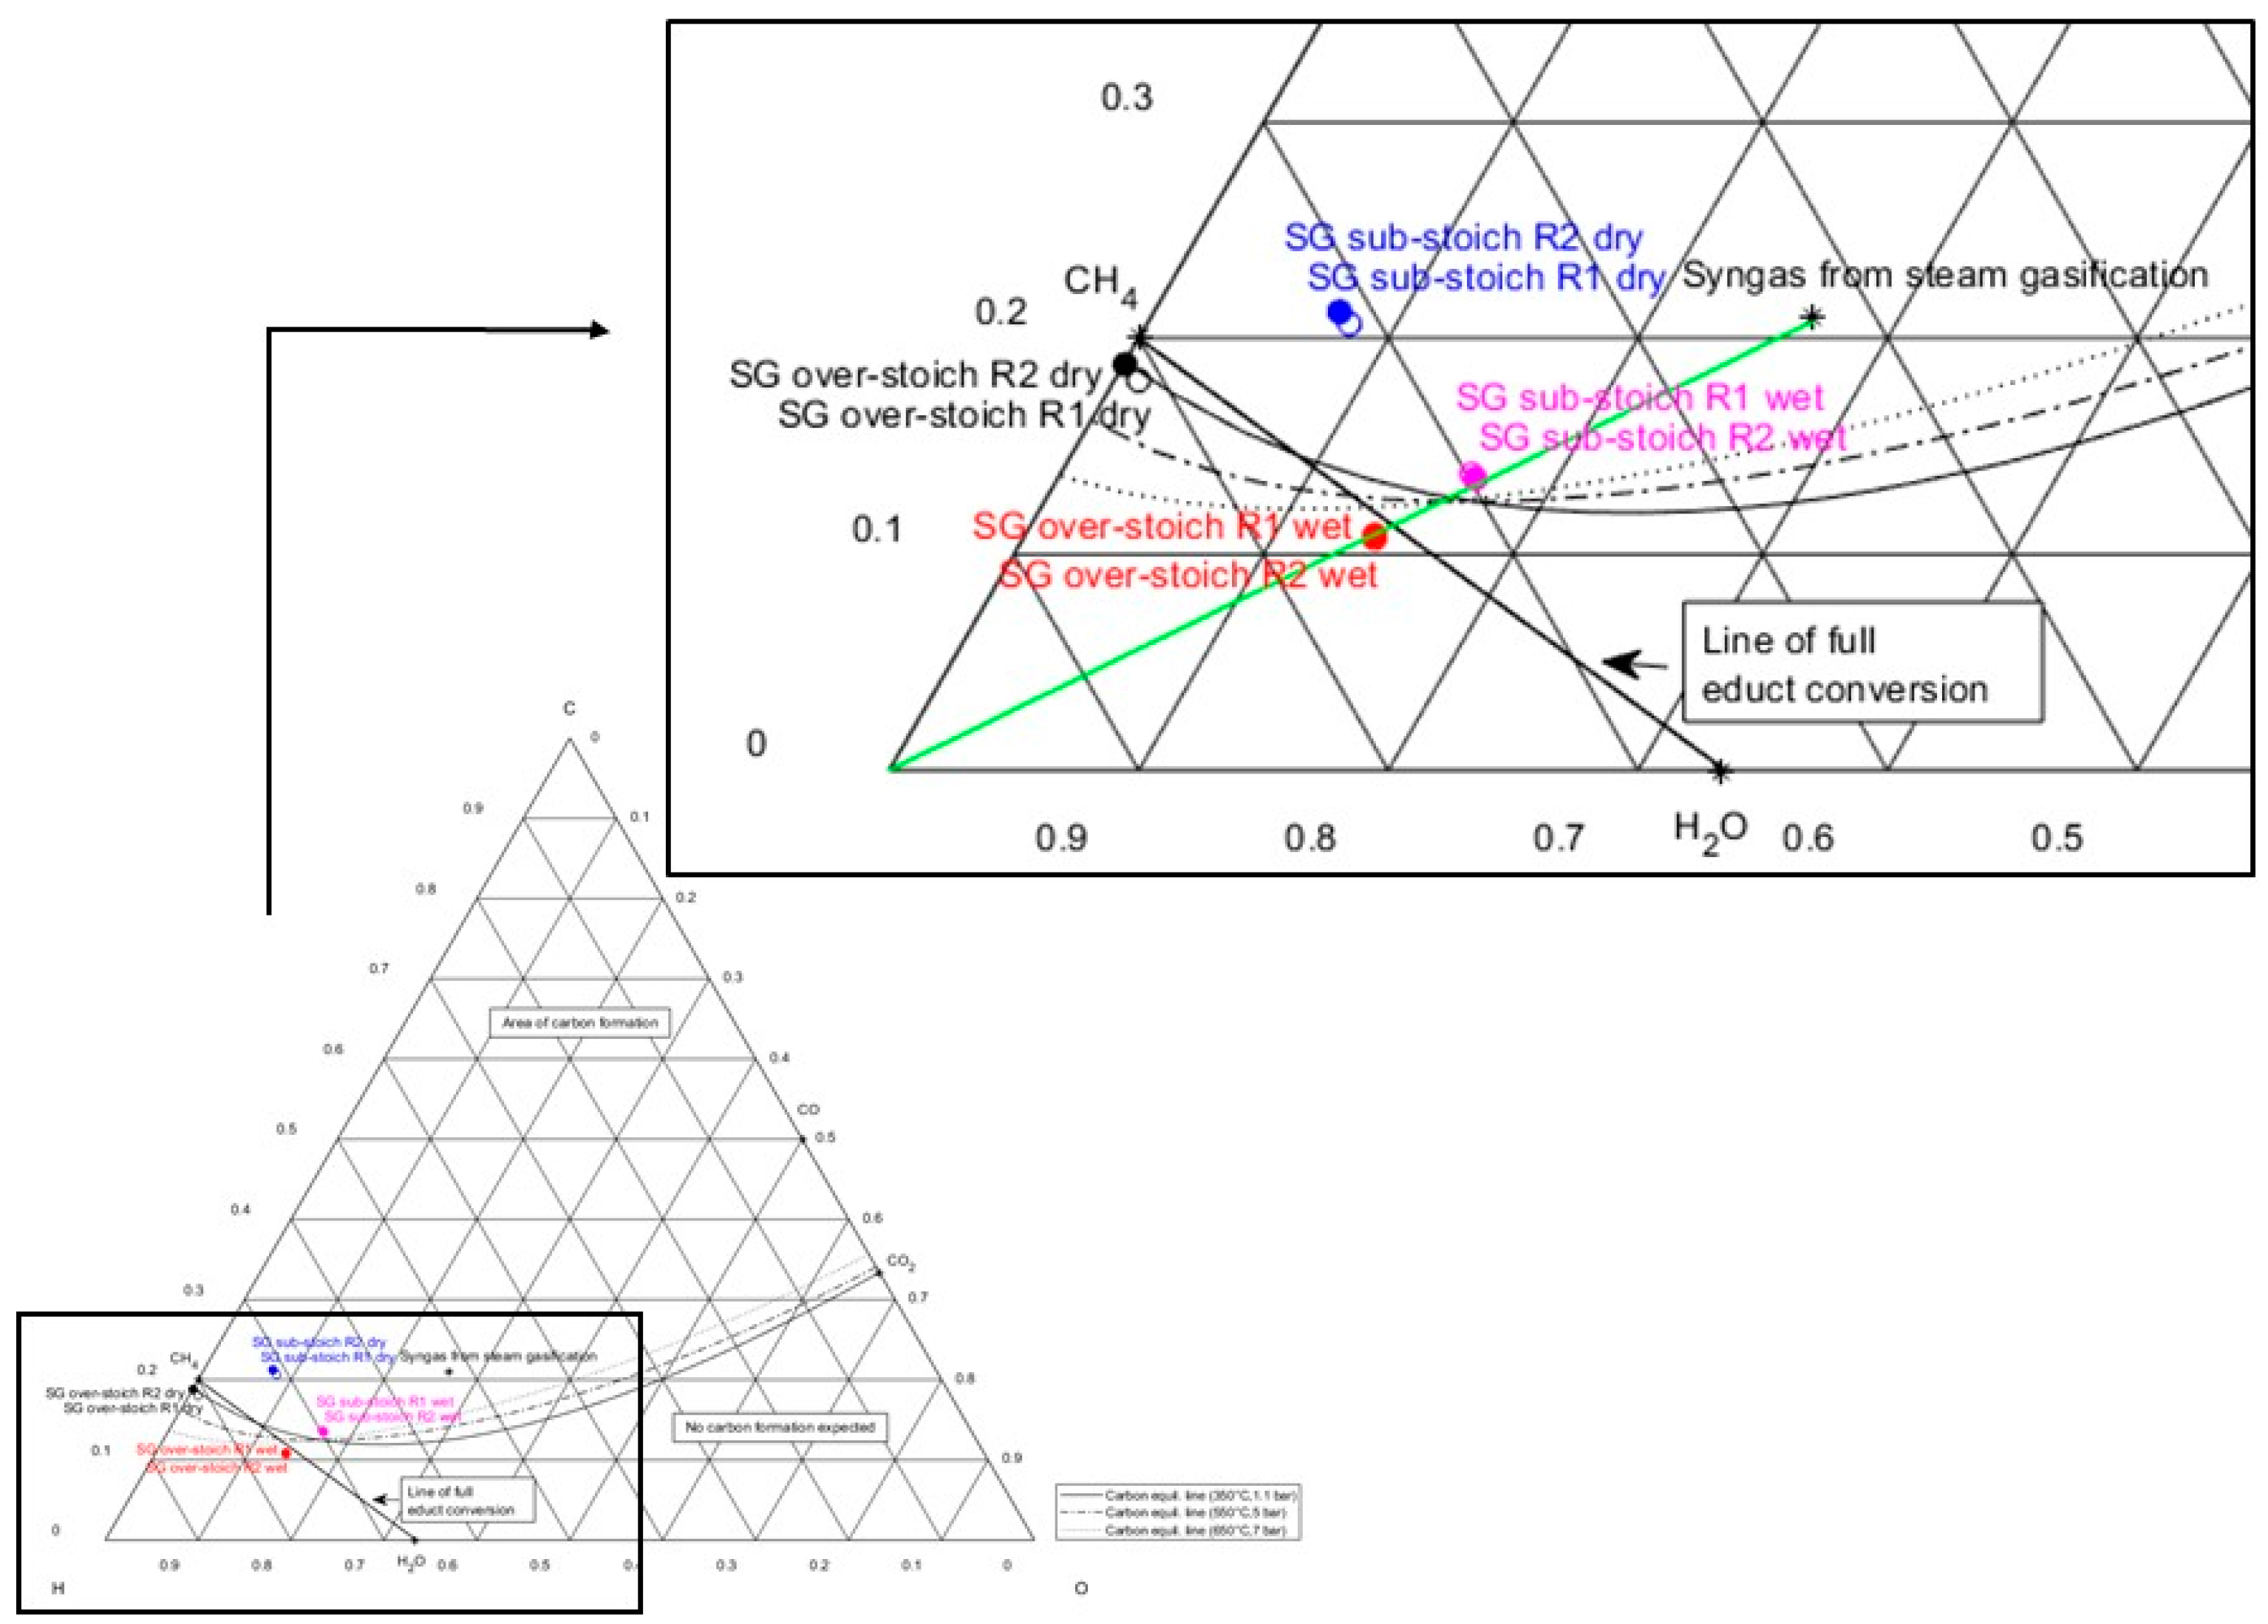
Figure 7 shows a ternary plot of wet and dry product gas compositions downstream of the first and second methanation stages (R1 or R2), taken from experimental test runs with sub- and over-stoichiometric methanation strategies. The composition of steam gasification syngas is marked in the area of carbon formation, while the connection line of steam gasification syngas with hydrogen in the lower left corner of the plot indicates a methanation process. The line of full educt conversion is shown, connecting the compounds CH4 and H2O. The dry product gas from the sub-stoichiometric methanation strategy after the first and second reactor stages is positioned within the area of carbon deposition (blue markers, Figure 7). This very likely results in carbon formation during methanation processes, in small- and in large-scale applications after drying the product gas for a feed into the grid. To hinder unwanted catalyst deactivation, additional steam supply during sub-stoichiometric methanation will shift the equilibrium composition even further towards H2O, as highlighted in pink markers (Figure 7) for the wet gas composition. This will enable operation in the area below the carbon formation line.
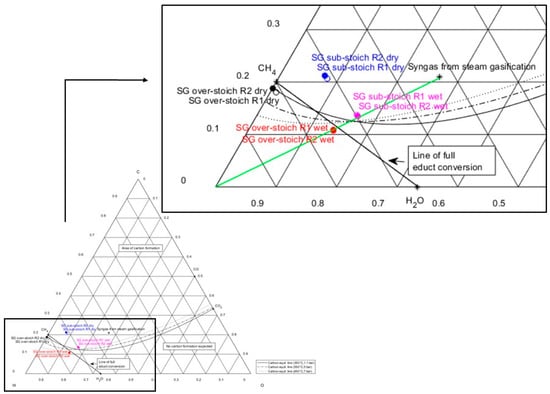
Figure 7.
Ternary C-H-O ratio diagram showing wet and dry intermediate and product gas compositions (after first and second stages, R1 and R2) of syngas methanation from steam gasification under sub-stoichiometric and over-stoichiometric hydrogen supply.
- Over-stoichiometric methanation (maximum carbon transformation)
As hydrogen is supplied in an over-stoichiometric ratio during test series, a full COx conversion can be achieved for steam gasification syngas methanation. This results firstly in no carbon dioxide present in the product gas (see Table 5). Secondly, the share of left-over hydrogen in the product gas from methanation amounts to nearly 14 mol.%, which demands further gas upgrading to meet the feed-in quality criteria. This can also be assessed by the parameter of lower hydrogen conversion (94.8%).
The experimental results of the over-stoichiometric methanation strategy are also visualized in the ternary plot in Figure 7. The dry gas composition downstream of the first and second methanation stages (black markers) can be found very close to CH4, because a high share (in this case: 85.1 mol.%) of methane is present in the methanation product gas. For a complete substitution of natural gas, methane concentrations of more than 95 vol.% are required. Otherwise, the product gas can only substitute natural gas to some extent, or needs to be mixed with other gases [33]. Therefore, further gas upgrading after methanation is also necessary for this methanation strategy.
3.3. Summary of Experimental Results of Sub- and Over-Stoichiometric Methanation Strategy
In Table 5, some combustion criteria according to ÖVGW G B210 are listed. In case of sub-stoichiometric methanation, a too-high share of carbon dioxide decreases the higher heating value, that finally does not meet the required criteria. In case of over-stoichiometric methanation, a too-high share of hydrogen is included, whereas the combustion criteria can be met. Further gas upgrading—either H2 or CO2 separation—is necessary in both cases for injection of the produced gas into the natural gas grid. Additional costs and energy expenditures for the product gas purification will not be discussed in detail in this article.
3.4. Comparison of Laboratory Experiments and Modeled Results Applying Sub- and Over-Stoichiometric Methanation Strategies
It can be seen in Table 6 that the implemented kinetic model from Rönsch et al. [43] predicts the COx conversion behind both methanation stages with a similar trend as the achieved experimental results. The total H2 conversion in the double-stage methanation process is slightly over-estimated. For sub- and over-stoichiometric methanation, the modeled H2 conversion lies at 99.5% and 95.5%, respectively. In contrast, it lies at 98.4% and 94.8% according to the experimental results for sub- and over-stoichiometric methanation. Both calculations, COx and H2 conversion, are based on the modeled gas compositions after the first and second reactor stages in Aspen Plus. Additionally, the intermediate (first stage) and product gas compositions (second stage) do not show a major deviation with the obtained gas composition during experimental test runs. Therefore, the kinetic model of Rönsch can describe the experimental results in a good approximation when the system parameters are considered.

Table 6.
Experimental and modeled results from sub- and over-stoichiometric methanation strategies.
3.5. Preview: Large-Scale Power-to-Gas Concepts
All syngas compositions shown in Table 1 have been evaluated based on their applicability for large-scale power-to-gas concepts. Assuming 25 MW of constant biomass input power and cold gas efficiencies provided in Table 1, generated syngas power to methanation considering the lower heating value (LHV), the required hydrogen demand and the output of synthetic natural gas have been ideally calculated. To provide an overview about different concept set-ups, the installed electrolysis capacity follows the methanation strategies from Section 2.1 for steam and 100% CO2 gasification gas. Hydrogen in SER product gas is already present in a widely over-stoichiometric ratio (SN = 1.3), and therefore only direct methanation is assessed for SER product gas. The hypothetical power-to-gas layouts are shown in Table 7.

Table 7.
Large-scale power-to-gas concepts following the methanation strategies for the chosen gasification product gas compositions (assumed constant biomass input of 25 MW).
Set-ups considering direct methanation of product gas from steam and 100% CO2 gasification (Table 7, columns 1 and 5) are not technically feasible, as the ternary plot in Figure 6 shows that in these two cases, carbon is certainly formed without additional hydrogen supply during methanation processes. However, in the case of direct steam gasification (column 1), the overall process efficiency would show the highest value of all considered scenarios, with 67.3%, as the included hydrogen share would enable the conversion of COx to an appropriate share of synthetic methane (namely, 17 MWLHV SNG). Examining the methanation of CO2 gasification product gas, a major advantage would be the opportunity for CCU, whereas a very low hydrogen share in the syngas (5 vol.%) leads to enormous electrolysis capacities (80 or 107 MW) for the two chosen methanation strategies (columns 6 and 7). As these capacities are significantly higher than in other investigated scenarios, the overall efficiencies show the lowest values for the methanation of syngas from CO2 gasification. Recapitulatory, the grey shaded columns in Table 7 show not technically feasible (columns 1 and 5) and not economically feasible (columns 6 and 7) large-scale power-to-gas set-ups.
The columns 2–4 (white background, Table 7) indicate the large-scale power-to-gas concepts which show technical potential for realization.
An immense difference in the required installed electrical power of the electrolysis unit can be seen between the sub- and over-stoichiometric methanation strategies of syngas from steam gasification (columns 2 and 3). In the latter case, electrolysis capacity corresponds to 1.5 times the value of the sub-stoichiometric methanation strategy. In contrast to the high difference in installed power of the electrolyzer, the generated synthetic natural gas power amounts to either 30 or 36 MW for the two methanation strategies. The SNG output power enlargement of 20% underlies the 52% of additionally needed electricity for electrolysis operation, which results in elevated operational costs. The overall efficiency with nearly 60% for the sub-stoichiometric methanation strategy considering maximum hydrogen usage is higher than for the over-stoichiometric methanation strategy with nearly 57% considering maximum carbon usage. At over-stoichiometric methanation conditions, a surplus of hydrogen is produced in the electrolysis, as unused hydrogen (nearly 14 mol.%) can be detected in the product gas, see the experimental results in Table 5.
Due to its high hydrogen share (70 vol.%), SER syngas does not require an electrolysis for stoichiometric methanation of the syngas (column 4, Table 7). However, owing to its low share of carbon dioxide and carbon monoxide (5.6 and 8.6 vol.%), synthetic natural gas with a power of only 14 MW could be produced. Consequently, nearly 38 mol.% of hydrogen is still present in the raw-SNG, which has to be lowered to <10 mol.% to meet Austria’s feed-in quality criteria by an appropriate separation step [42] (i.e., polymer membranes). Bartik et al. also indicate around 22 vol.% of hydrogen in the product gas after SER methanation experiments [31]. The overall efficiency of SER product gas methanation lies at nearly 56%, while left-over hydrogen can also be further utilized.
The optimum large-scale set-up is the sub-stoichiometric methanation strategy, which implies the least required hydrogen supply while exhibiting the highest possible overall process efficiency.
3.6. Summary of Results
In Table 8, an overview is provided about the advantages and disadvantages of each investigated methanation strategy applied on different syngas compositions. Additionally, comments are included about why one of the methanation strategies has not been applied on a specific syngas composition. The technological readiness level of the gasification technologies is ranked from top to bottom in Table 8 (steam gasification = best developed technology, SER = medium development status, CO2-gasification = technology under development).

Table 8.
Overview of advantages and disadvantages of the applied methanation strategies on different syngas compositions.
4. Discussion
The obtained syngas from gasification features a different gas composition based on the gasification technology (steam or CO2 as a gasification agent, or SER). Regardless of the gasification technology, all syngases need basic gas cleaning from dust, tar, sulfur, and nitrogen components prior to e-fuel synthesis. The presented results from the combined approach of gasification and methanation proved to be promising, while the different methanation operation strategies considering varying hydrogen supply have a strong effect on the produced SNG gas composition.
Direct methanation represents the best strategy from an economic point of view as the plant complexity and additional expenditures for hydrogen production are minimized. The exclusively suitable syngas for direct methanation is SER syngas due to its high share of hydrogen (around 70 vol.%), as SN lies at 1.31. Included COx can be totally converted with the over-stoichiometrically present hydrogen, and carbon formation does not occur. The overall efficiency from the process chain starting from biomass to SNG including SER gasification is the lowest of all considered technically feasible cases in column 4 in Table 7, with almost 56%. According to Fuchs et al. [20], the practical feasibility of the SER process is provided in pilot plant scale. Further investigation should be carried out in a demonstration plant ensuring the working principle in the range of MW and in long-time operation mode. If syngas from steam or CO2 gasification is directly used for methanation, carbon formation certainly occurs, which would reduce the catalyst’s lifetime (see ternary plot in Figure 6). Additionally, conversion rates are not sufficient as the present hydrogen share is low. Both arguments strengthen the reasoning for no further pursuits of a direct methanation strategy if syngas from steam or CO2 gasification is utilized.
The most promising operation mode is sub-stoichiometric methanation, especially of syngas from steam gasification. Sub-stoichiometric methanation features an optimized hydrogen usage as the availability of renewable energy is restricted for hydrogen production. Laboratory methanation test runs in a double-stage fixed-bed methanation set-up operated with a commercial bulk catalyst showed a 98.4% hydrogen conversion. The pursued aim of maximized hydrogen usage was reached and the overall process efficiency from biomass to SNG was the highest, at 59.9%. Due to too-little hydrogen present, COx conversion declined, and the product gas composition did not meet the feed-in quality criteria for the gas grid. Additionally, carbon formation is likely to occur, as it was shown in the ternary diagram (Figure 6). Steam supply may shift the equilibrium composition in the area of no carbon formation. For large-scale sub-stoichiometric biomass to SNG applications, this challenge needs to be precisely considered with fundamental thermodynamic evaluations in the future. The hydrogen supply may be increased, but still appear at sub-stoichiometric character (SN < 1) to firstly save renewable energy and investment costs, and secondly enhance the COx conversion. This sweet spot of hydrogen supply can be assessed in future investigations to be a possible optimum operation mode. Replacing the commercial bulk catalyst with a structured honeycomb catalyst that offers better load-flexible operation qualities is also a possibility for further investigations at the laboratory scale [23].
The applied over-stoichiometric methanation showed different results compared with the sub-stoichiometric operation mode. The available excess of H2 enabled full conversion of COx and led to high methane concentrations in the produced SNG, but showed a 94.8% conversion of hydrogen only. Most literature sources focus on this methanation strategy either in fixed or fluidized bed methanation set-ups. A negative aspect of the over-stoichiometric methanation strategy is characterized by the unused share of hydrogen which is present in the produced SNG (around 14 mol.% in experimental investigations by using syngas from steam gasification). Considering an economic point of view, the wastage of elaborately produced hydrogen does not represent a possible operation mode for catalytic methanation of syngas in large-scale applications.
5. Conclusions
The utilization of biomass and excess electricity shows great potential to produce synthetic fuels such as SNG. The focus of this article was on the identification of technological possible methanation routes for a large-scale biomass to SNG set-up, combining biomass-based (b-fuels) and electro-fuels (e-fuels) based on fundamental technical evaluations.
The presented concept, consisting of methanation of syngas from steam gasification, was identified to show the most favorable syngas composition for downstream methanation. The included hydrogen share of around 48 vol.% in the syngas and the high technical readiness level of steam gasification in large-scale gasification set-ups provide a good starting position for further plant concept elaborations including biomass to SNG technologies.
The operation mode of sub-stoichiometric methanation (SN = 0.78) applied to syngas from steam gasification offers a good compromise between the reduction of hydrogen demand and a high overall process efficiency. As the aim is for hydrogen to be used to a maximum extent, laboratory tests showed a hydrogen conversion rate of 98.4%, which represents a satisfactory result. In a large-scale set-up, an overall efficiency from biomass to SNG of 59.9% can be reached. Further studies on predicted catalyst lifetime need to be conducted under the help of water vapor dosage in the methanation system to shift the equilibrium composition into the area of no carbon formation during methanation. The sweet spot of operation needs to be elaborated in detail as the stochiometric number of hydrogen supply and additional steam supply can be varied in future test series. Subsequent gas cleaning after the methanation unit will be inevitable to meet the feed-in quality criteria for H2 and CO2.
Author Contributions
Conceptualization, K.S. and T.S.; methodology, K.S. and T.S.; validation, K.S. and T.S.; formal analysis, K.S. and T.S.; investigation, K.S.; resources, K.S. and T.S.; data curation, K.S.; writing—original draft preparation, K.S.; writing—review and editing, K.S. and T.S.; visualization, K.S.; supervision, T.S.; project administration, K.S and T.S. Both authors have read and agreed to the published version of the manuscript.
Funding
This research received no external funding.
Institutional Review Board Statement
Not applicable.
Informed Consent Statement
Not applicable.
Data Availability Statement
Not applicable.
Conflicts of Interest
The authors declare no conflict of interest.
List of Symbols
The following symbols are used in the manuscript:
| Index | gas component in mixture |
| Index | feed or product gas stream |
| density | |
| ΔG | Gibbs free energy |
| ΔHR | reaction enthalpy |
| higher heating value | |
| molarities | |
| molar flows | |
| conversion rate | |
| wet gas composition | |
| dry gas composition | |
| Wobbe Index | |
| overall process efficiency |
Abbreviations
The following abbreviations are used in this manuscript:
| AUT | Austria |
| CCU | Carbon capture and utilization |
| CH4 | Methane |
| CO2 | Carbon dioxide |
| CO2-g. | CO2 gasification |
| DFB | Dual-fluidized bed gasification |
| GHSV | Gas Hourly Space Velocity (h−1) |
| H2 | Hydrogen |
| H2O | Water or Steam |
| LHV | Lower heating value (MW) |
| mol.% | molar share |
| Multi-T | Multi-Thermocouple |
| ÖVGW | Österreichische Vereinigung für das Gas- und Wasserfach—Austrian Association for Gas and Water |
| R1-R2 | Reactor 1 or 2 |
| SER | Sorption-enhanced reforming |
| SG | Steam gasification |
| SNG | Synthetic natural gas |
| SWE | Sweden |
| TU Wien | Technical University of Vienna |
| vol.%db | share in volume percent (dry basis) |
| wt.% | share in weight percent |
References
- Biollaz, S.M.; Schildhauer, T.J. (Eds.) Synthetic Natural Gas from Coal, Dry Biomass, and Power-to-Gas Applications; John Wiley & Sons Inc.: Hoboken, NJ, USA, 2016. [Google Scholar]
- Kirkels, A.F.; Verbong, G.P.J. Biomass gasification: Still promising? A 30-year global overview. Renew. Sustain. Energy Rev. 2011, 15, 471–481. [Google Scholar] [CrossRef]
- Hofbauer, H. Biomass Gasification for Electricity and Fuels, Large Scale. In Encyclopedia of Sustainability Science and Technology; Springer: New York, NY, USA, 2012; pp. 1426–1445. [Google Scholar]
- Kaltschmitt, M.; Hartmann, H.; Hofbauer, H. Energie aus Biomasse: Grundlagen, Techniken und Verfahren, 2nd ed.; Springer: Berlin, Germany, 2009. [Google Scholar]
- Knoef, H.; Ahrenfeldt, J. Handbook Biomass Gasification; BTG Biomass Technology Group B.V.: Enschede, The Netherlands, 2012; Available online: http://www.btgworld.com/en/references/publications/paper-handbook-biomass-gasification.pdf (accessed on 25 May 2021).
- Müller, S.; Stidl, M.; Pröll, T.; Rauch, R.; Hofbauer, H. Hydrogen from biomass: Large-scale hydrogen production based on a dual fluidized bed steam gasification system. Biomass Conv. Bioref. 2011, 1, 55–61. [Google Scholar] [CrossRef] [Green Version]
- Gil, J.; Caballero, M.A.; Martín, J.A.; Aznar, M.-P.; Corella, J. Biomass Gasification with Air in a Fluidized Bed: Effect of the In-Bed Use of Dolomite under Different Operation Conditions. Ind. Eng. Chem. Res. 1999, 38, 4226–4235. [Google Scholar] [CrossRef]
- Zhang, Y.; Li, B.; Li, H.; Liu, H. Thermodynamic evaluation of biomass gasification with air in autothermal gasifiers. Thermochim. Acta 2011, 519, 65–71. [Google Scholar] [CrossRef]
- Cheng, Y.; Thow, Z.; Wang, C.-H. Biomass gasification with CO2 in a fluidized bed. Powder Technol. 2016, 296, 87–101. [Google Scholar] [CrossRef]
- Stec, M.; Czaplicki, A.; Tomaszewicz, G.; Słowik, K. Effect of CO2 addition on lignite gasification in a CFB reactor: A pilot-scale study. Korean J. Chem. Eng. 2018, 35, 129–136. [Google Scholar] [CrossRef]
- Jeremiáš, M.; Pohořelý, M.; Svoboda, K.; Manovic, V.; Anthony, E.J.; Skoblia, S.; Beňo, Z.; Syc, M. Gasification of biomass with CO2 and H2O mixtures in a catalytic fluidised bed. Fuel 2017, 210, 605–610. [Google Scholar] [CrossRef] [Green Version]
- Valin, S.; Bedel, L.; Guillaudeau, J.; Thiery, S.; Ravel, S. CO2 as a substitute of steam or inert transport gas in a fluidised bed for biomass gasification. Fuel 2016, 177, 288–295. [Google Scholar] [CrossRef]
- Pio, D.T.; Tarelho, L.A.C. Industrial gasification systems (>3 MWth) for bioenergy in Europe: Current status and future perspectives. Renew. Sustain. Energy Rev. 2021, 145, 111108. [Google Scholar] [CrossRef]
- Fuchs, J. Verfahrenscharakteristika von Sorption Enhanced Reforming in einem einem Fortschrittlichen Gaserzeugungssystem: Verfahrenscharakteristika von Sorption Enhanced Reforming in einem einem Fortschrittlichen Gaserzeugungssystem, Wien. Available online: https://repositum.tuwien.at/handle/20.500.12708/16812?mode=full (accessed on 27 May 2021).
- Thunman, H.; Seemann, M.; Vilches, T.B.; Maric, J.; Pallares, D.; Ström, H.; Berndes, G.; Knutsson, P.; Larsson, A.; Breitholtz, C.; et al. Advanced biofuel production via gasification-lessons learned from 200 man-years of research activity with Chalmers’ research gasifier and the GoBiGas demonstration plant. Energy Sci. Eng. 2018, 6, 6–34. [Google Scholar] [CrossRef]
- Rehling, B.; Hofbauer, H.; Rauch, R.; Aichernig, C. BioSNG—process simulation and comparison with first results from a 1-MW demonstration plant. Biomass Conv. Bioref. 2011, 1, 111–119. [Google Scholar] [CrossRef]
- Wilk, V.; Hofbauer, H. Analysis of optimization potential in commercial biomass gasification plants using process simulation. Fuel Process. Technol. 2016, 141, 138–147. [Google Scholar] [CrossRef]
- WienEnergie. Available online: https://positionen.wienenergie.at/projekte/mobilitaet/gruener-treibstoff/ (accessed on 1 July 2021).
- Mauerhofer, A.M.; Müller, S.; Bartik, A.; Benedikt, F.; Fuchs, J.; Hammerschmid, M.; Hofbauer, H. Conversion of CO2 during the DFB biomass gasification process. Biomass Conv. Bioref. 2021, 11, 15–27. [Google Scholar] [CrossRef]
- Fuchs, J.; Schmid, J.C.; Müller, S.; Hofbauer, H. Dual fluidized bed gasification of biomass with selective carbon dioxide removal and limestone as bed material: A review. Renew. Sustain. Energy Rev. 2019, 107, 212–231. [Google Scholar] [CrossRef]
- Asadullah, M. Biomass gasification gas cleaning for downstream applications: A comparative critical review. Renew. Sustain. Energy Rev. 2014, 40, 118–132. [Google Scholar] [CrossRef]
- DNV GL. Methanation: Technical Fundamentals and Market Overview; Report Methanation (vs 1 dec 2019), Report number: OAG.19.R.10157194; DNV GL: Bærum, Norway, 2019. [Google Scholar]
- Lehner, M.; Biegger, P.; Medved, A.R. Power-to-Gas: Die Rolle der chemischen Speicherung in einem Energiesystem mit hohen Anteilen an erneuerbarer Energie. Elektrotech. Inftech. 2017, 134, 246–251. [Google Scholar] [CrossRef] [Green Version]
- Bundesministerium für Verkehr, Innovation und Technologie and Bundesministerium für Nachhaltigkeit und Tourismus, #mission2030—Die Österreichische Klima- und Energiestartegie. Available online: https://www.bundeskanzleramt.gv.at/dam/jcr:903d5cf5-c3ac-47b6-871c-c83eae34b273/20_18_beilagen_nb.pdf (accessed on 28 May 2021).
- Kopyscinski, J.; Schildhauer, T.J.; Biollaz, S.M.A. Production of synthetic natural gas (SNG) from coal and dry biomass—A technology review from 1950 to 2009. Fuel 2010, 89, 1763–1783. [Google Scholar] [CrossRef]
- Lehner, M.; Tichler, R.; Steinmüller, H.; Koppe, M. Power-to-GAS: Technology and Business Models; Springer: Cham, Switzerland; Heidelberg, Germany, 2014. [Google Scholar]
- Rönsch, S.; Schneider, J.; Matthischke, S.; Schlüter, M.; Götz, M.; Lefebvre, J.; Prabhakaran, P.; Bajohr, S. Review on methanation—From fundamentals to current projects. Fuel 2016, 166, 276–296. [Google Scholar] [CrossRef]
- Medved, A. The Influence of Nitrogen on Catalytic Methanation. Ph.D. Thesis, Montanuniversität Leoben, Leoben, Austria, 2020. [Google Scholar]
- Gao, J.; Wang, Y.; Ping, Y.; Hu, D.; Xu, G.; Gu, F.; Su, F. A thermodynamic analysis of methanation reactions of carbon oxides for the production of synthetic natural gas. RSC Adv. 2012, 2, 2358. [Google Scholar] [CrossRef]
- CHEMCAD: Chemstations. Available online: https://www.chemstations.com/CHEMCAD/ (accessed on 31 May 2021).
- Bartik, A.; Benedikt, F.; Lunzer, A.; Walcher, C.; Müller, S.; Hofbauer, H. Thermodynamic investigation of SNG production based on dual fluidized bed gasification of biogenic residues. Biomass Conv. Bioref. 2021, 11, 95–110. [Google Scholar] [CrossRef]
- Bartholomew, C.H. Mechanisms of catalyst deactivation. Appl. Catal. A Gen. 2001, 212, 17–60. [Google Scholar] [CrossRef]
- Neubert, M. Catalytic Methanation for Small-and Mid-Scale Sng Production. Ph.D. Thesis, Friedrich-Alexander Universität Erlangen-Nürnberg, Erlangen, Germany, 2020. Available online: https://opus4.kobv.de/opus4-fau/frontdoor/index/index/start/2/rows/20/sortfield/score/sortorder/desc/searchtype/simple/query/neubert+michael/doctypefq/doctoralthesis/docId/13118 (accessed on 2 June 2021).
- Kienberger, T. Methanierung Biogener Synthesegase Mit Hinblick Auf Die Direkte Umsetzung von Höheren Kohlenwasserstoffen. Ph.D. Thesis, Institut für Wärmetechnik, TU Graz, Graz, Austria, 2010. Available online: https://www.osti.gov/etdeweb/biblio/21397329 (accessed on 2 June 2021).
- Wang, S.; Bi, X.; Wang, S. Thermodynamic analysis of biomass gasification for biomethane production. Energy 2015, 90, 1207–1218. [Google Scholar] [CrossRef]
- Tremel, A.; Gaderer, M.; Spliethoff, H. Small-scale production of synthetic natural gas by allothermal biomass gasification. Int. J. Energy Res. 2013, 37, 1318–1330. [Google Scholar] [CrossRef]
- VGW Österreichische Vereinigung für das Gas- und Wasserfach. Erdgas in Österreich—Gasbeschaffenheit ÖVGW G B210: 2019 06; ÖVGW Österreichische Vereinigung für das Gas- und Wasserfach: Wien, Austria, 2021. [Google Scholar]
- Thema, M.; Bauer, F.; Sterner, M. Power-to-Gas: Electrolysis and methanation status review. Renew. Sustain. Energy Rev. 2019, 112, 775–787. [Google Scholar] [CrossRef]
- Krammer, A.; Medved, A.; Peham, M.; Wolf-Zöllner, P.; Salbrechter, K.; Lehner, M. Dual Pressure Level Methanation of Co-SOEC Syngas. Energy Technol. 2021, 9, 2000746. [Google Scholar] [CrossRef]
- Frick, V.; Brellochs, J.; Specht, M. Application of ternary diagrams in the design of methanation systems. Fuel Process. Technol. 2014, 118, 156–160. [Google Scholar] [CrossRef]
- Bai, X.; Wang, S.; Sun, T.; Wang, S. Influence of Operating Conditions on Carbon Deposition Over a Ni Catalyst for the Production of Synthetic Natural Gas (SNG) from Coal. Catal. Lett. 2014, 144, 2157–2166. [Google Scholar] [CrossRef]
- Kirchbacher, F.; Biegger, P.; Miltner, M.; Lehner, M.; Harasek, M. A new methanation and membrane based power-to-gas process for the direct integration of raw biogas—Feasability and comparison. Energy 2018, 146, 34–46. [Google Scholar] [CrossRef]
- Rönsch, S.; Köchermann, J.; Schneider, J.; Matthischke, S. Global Reaction Kinetics of CO and CO2 Methanation for Dynamic Process Modeling. Chem. Eng. Technol. 2016, 39, 208–218. [Google Scholar] [CrossRef]
- Klose, J. Kinetics of the methanation of carbon monoxide on an alumina-supported nickel catalyst. J. Catal. 1984, 85, 105–116. [Google Scholar] [CrossRef]
- Larsson, A.; Kuba, M.; Vilches, T.B.; Seemann, M.; Hofbauer, H.; Thunman, H. Steam gasification of biomass—Typical gas quality and operational strategies derived from industrial-scale plants. Fuel Process. Technol. 2021, 212, 106609. [Google Scholar] [CrossRef]
- Schmidt, M.; Schwarz, S.; Stürmer, B.; Wagener, L.; Zuberbühler, U. Technologiebericht 4.2a Power-to-Gas (Methanisierung Chemisch-Katalytisch) Innerhalb des Forschungsprojektes TF_Energiewende; ZSW: Stuttgart, Germany, 2018. [Google Scholar]
- Aaron, D.; Tsouris, C. Separation of CO2 from Flue Gas: A Review. Sep. Sci. Technol. 2005, 40, 321–348. [Google Scholar] [CrossRef]
- Fischedick, M.; Görner, K.; Thomeczek, M. (Eds.) CO2: Abtrennung, Speicherung, Nutzung; Springer: Berlin/Heidelberg, Germany, 2015. [Google Scholar]
Publisher’s Note: MDPI stays neutral with regard to jurisdictional claims in published maps and institutional affiliations. |
© 2021 by the authors. Licensee MDPI, Basel, Switzerland. This article is an open access article distributed under the terms and conditions of the Creative Commons Attribution (CC BY) license (https://creativecommons.org/licenses/by/4.0/).

