
Fossil Energy in the Framework of Sustainable Development: Analysis of Prospects and Development of Forecast Scenarios

 ,
,  ,
, 
Abstract
:1. Introduction
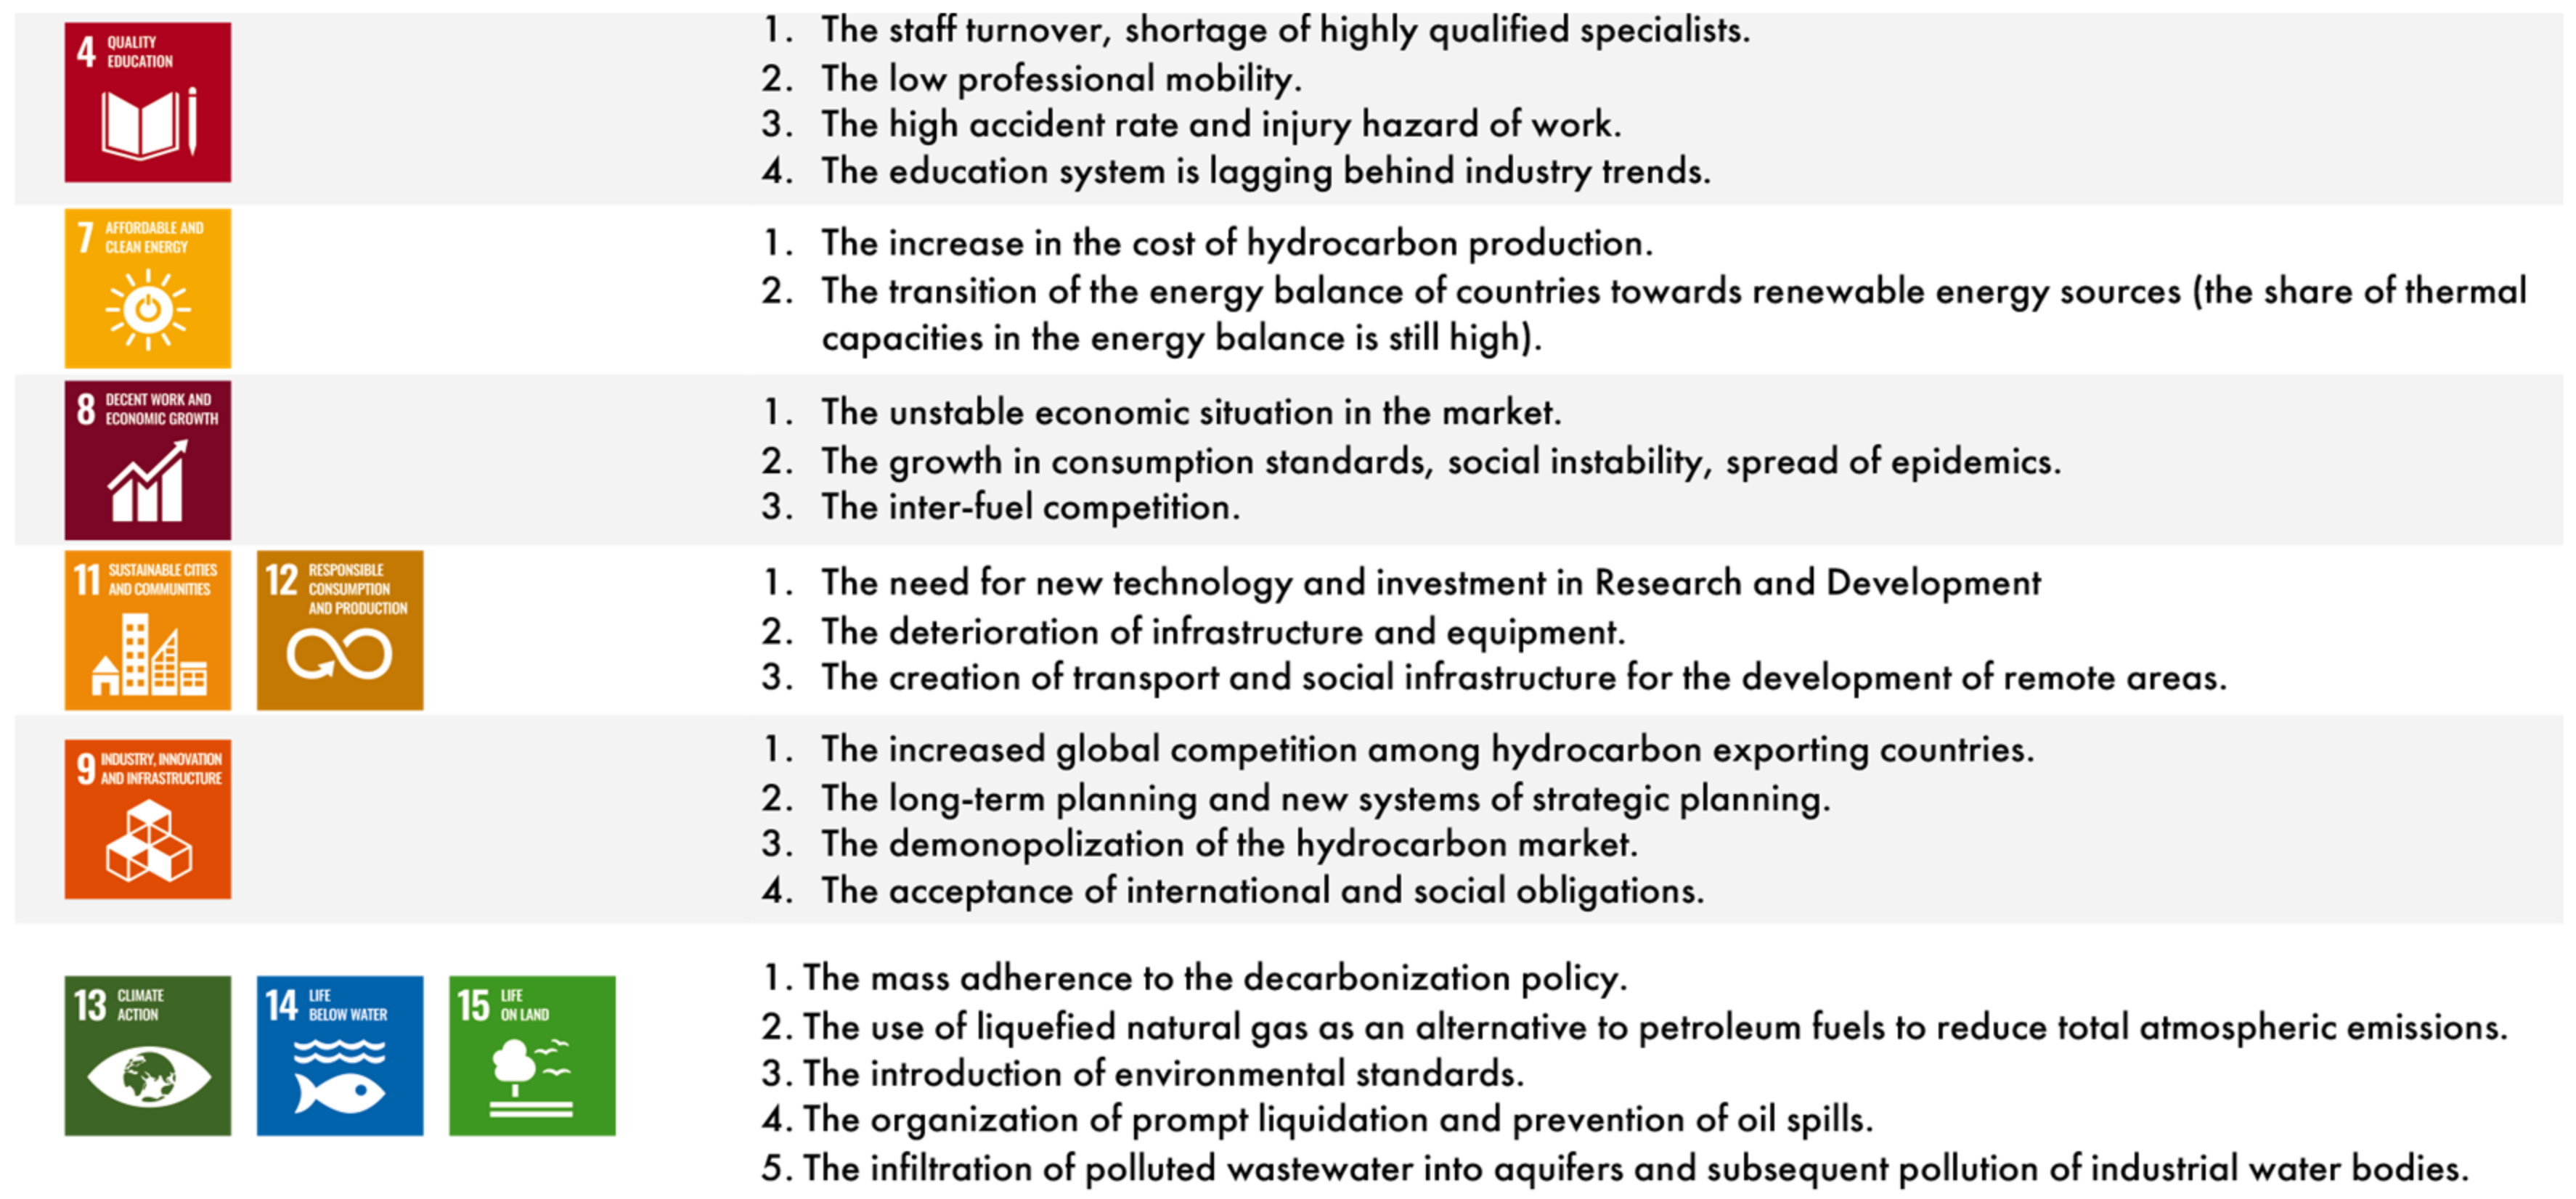
1.1. The Key Role of the Developing Countries in the Sustainable Development of the Energy Sector
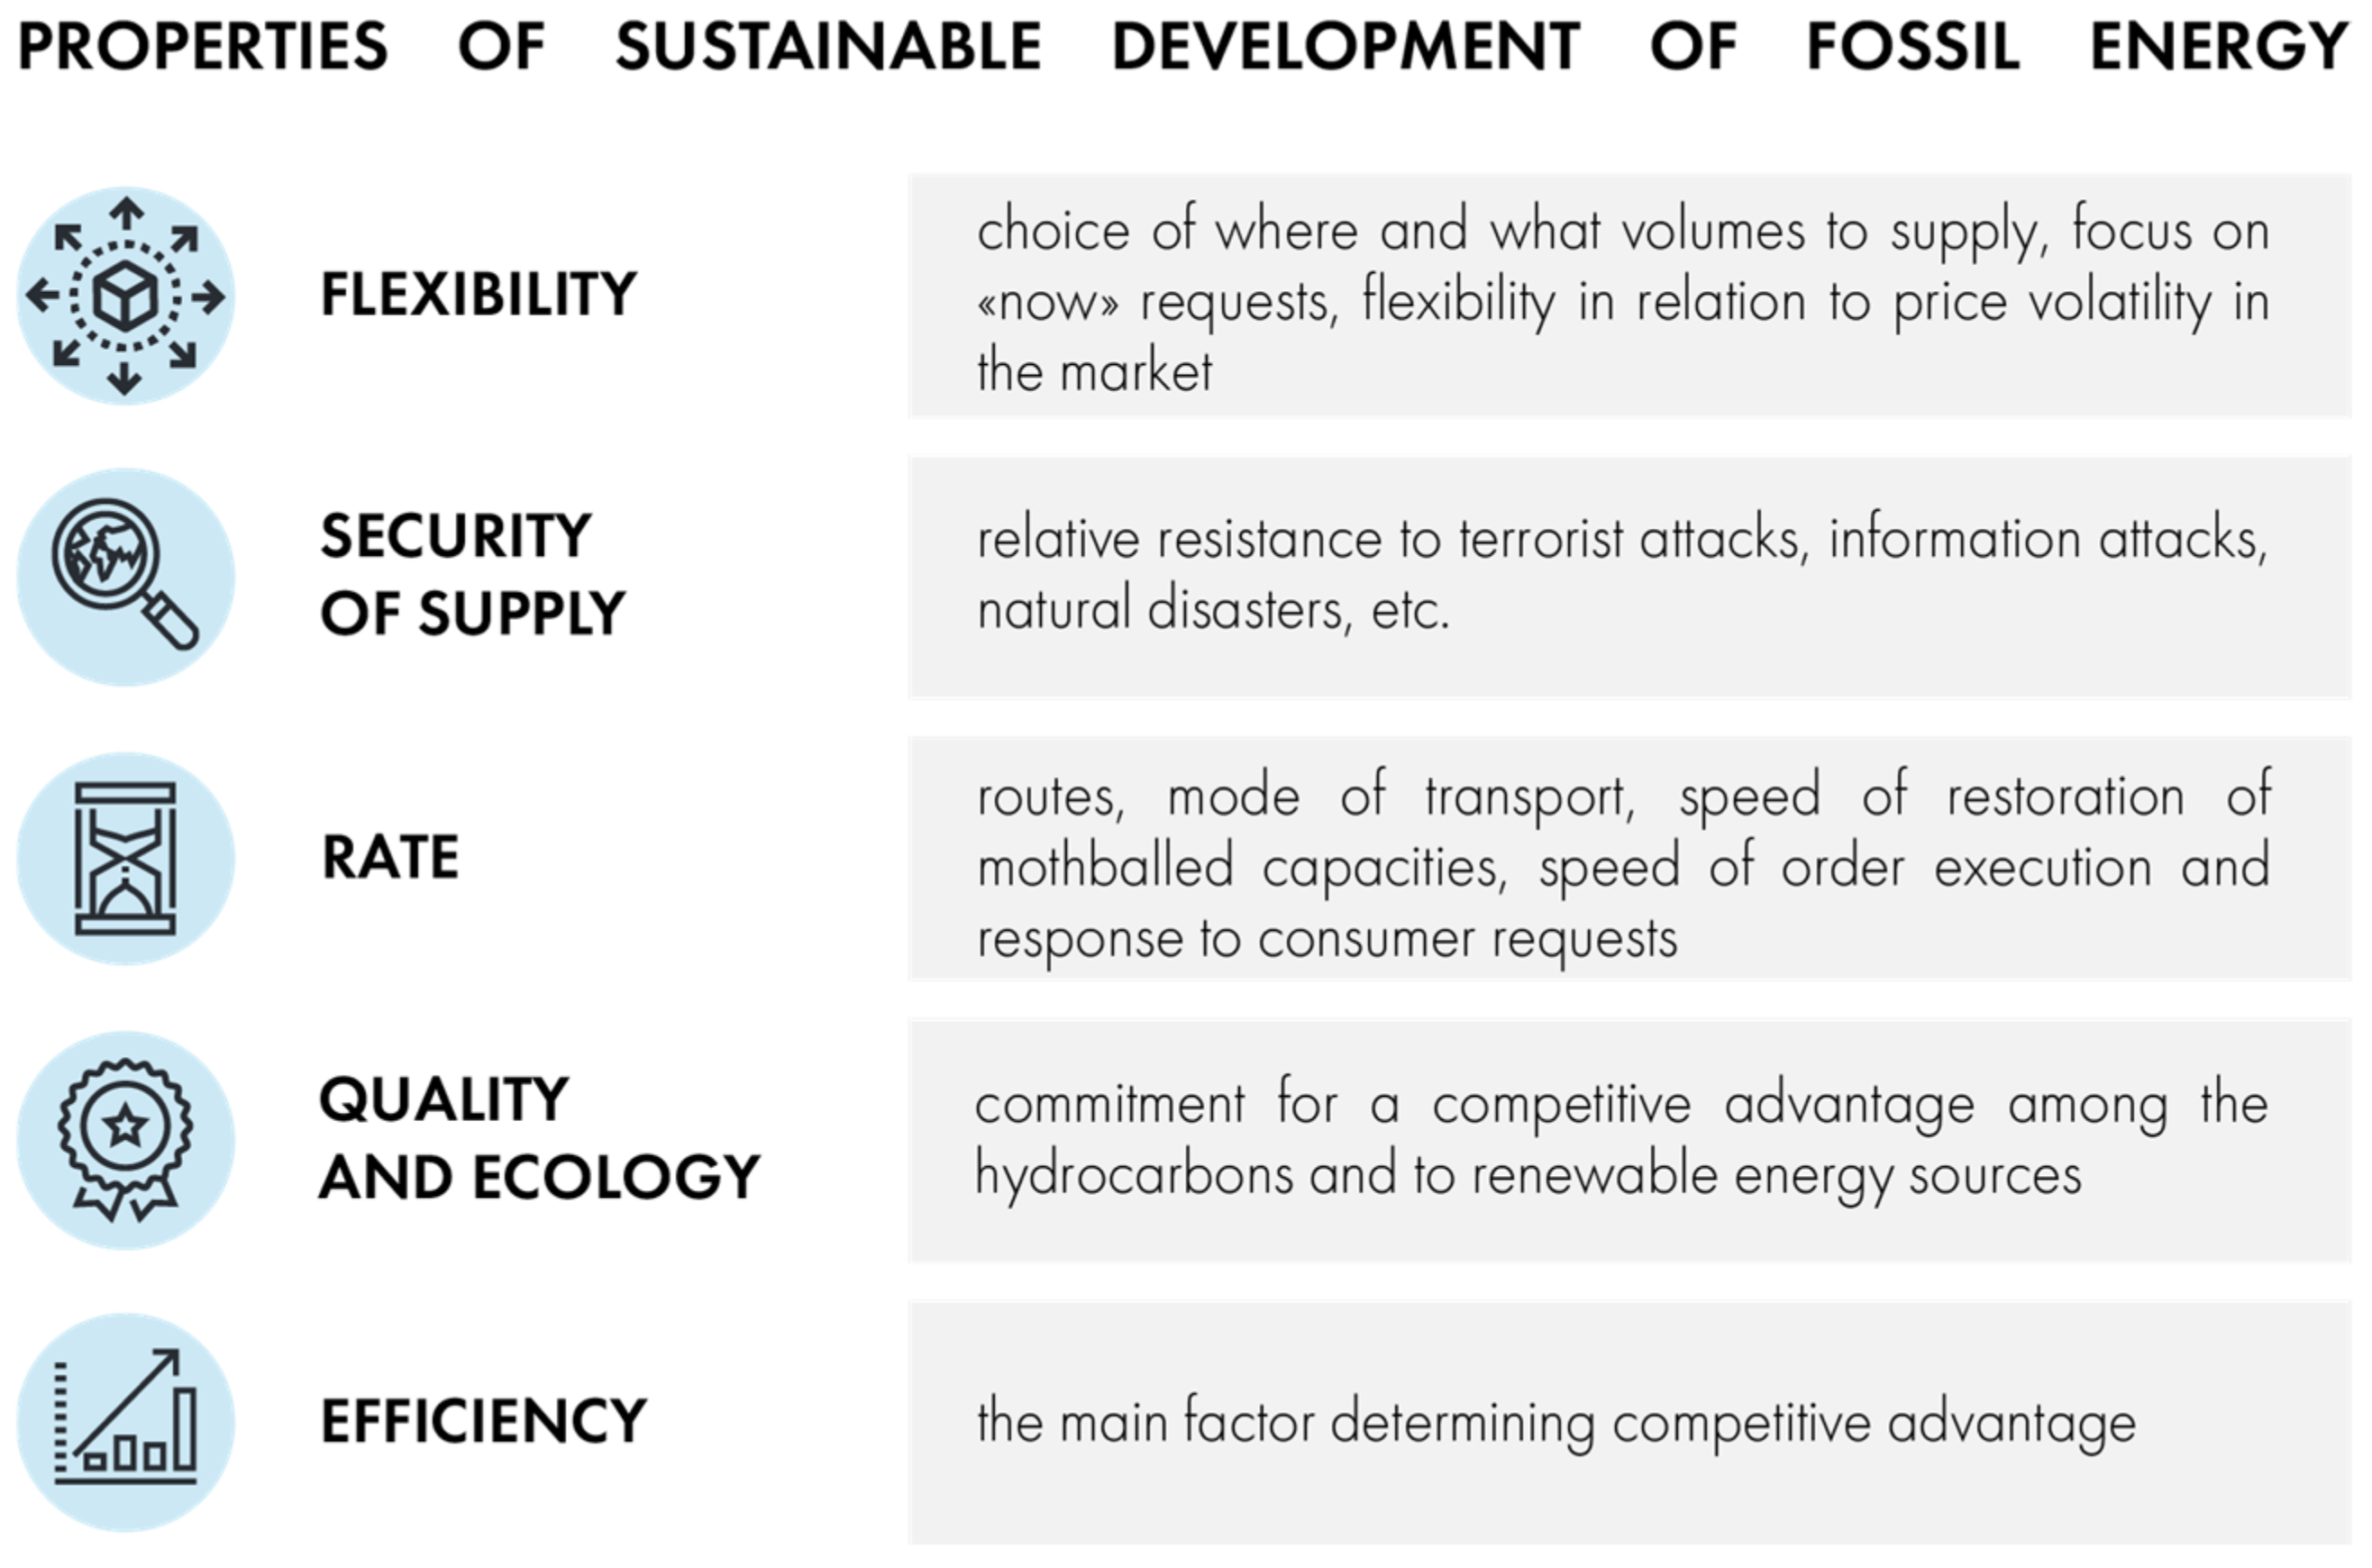
1.2. Properties of the Transformations of the Fossil Energy
- -
- Digitalization is changing the way the power system works; there is a new understanding of how electricity is used, how electricity is generated and delivered, and how plants and systems are built to generate, transport, distribute, and store the energy.
- -
- Decarbonization is related to the climate as well as the primary fuel supply and electrification. It can also bring both economic and environmental benefits.
- -
- Decentralization is linked to the changes in industries and to trends in the distribution of the energy consumption towards more small economic hubs. It stimulates innovation from, e.g., energy storage to smart meters.
- 1.
- Technology trend of “digital transformation”
- 2.
- Technology trend of “sustainability”
- 3.
- Technology trend of “import substitution”
- 4.
- Technology trend of “hard stocks”
- 5.
- Technology trend of “transport electrification”
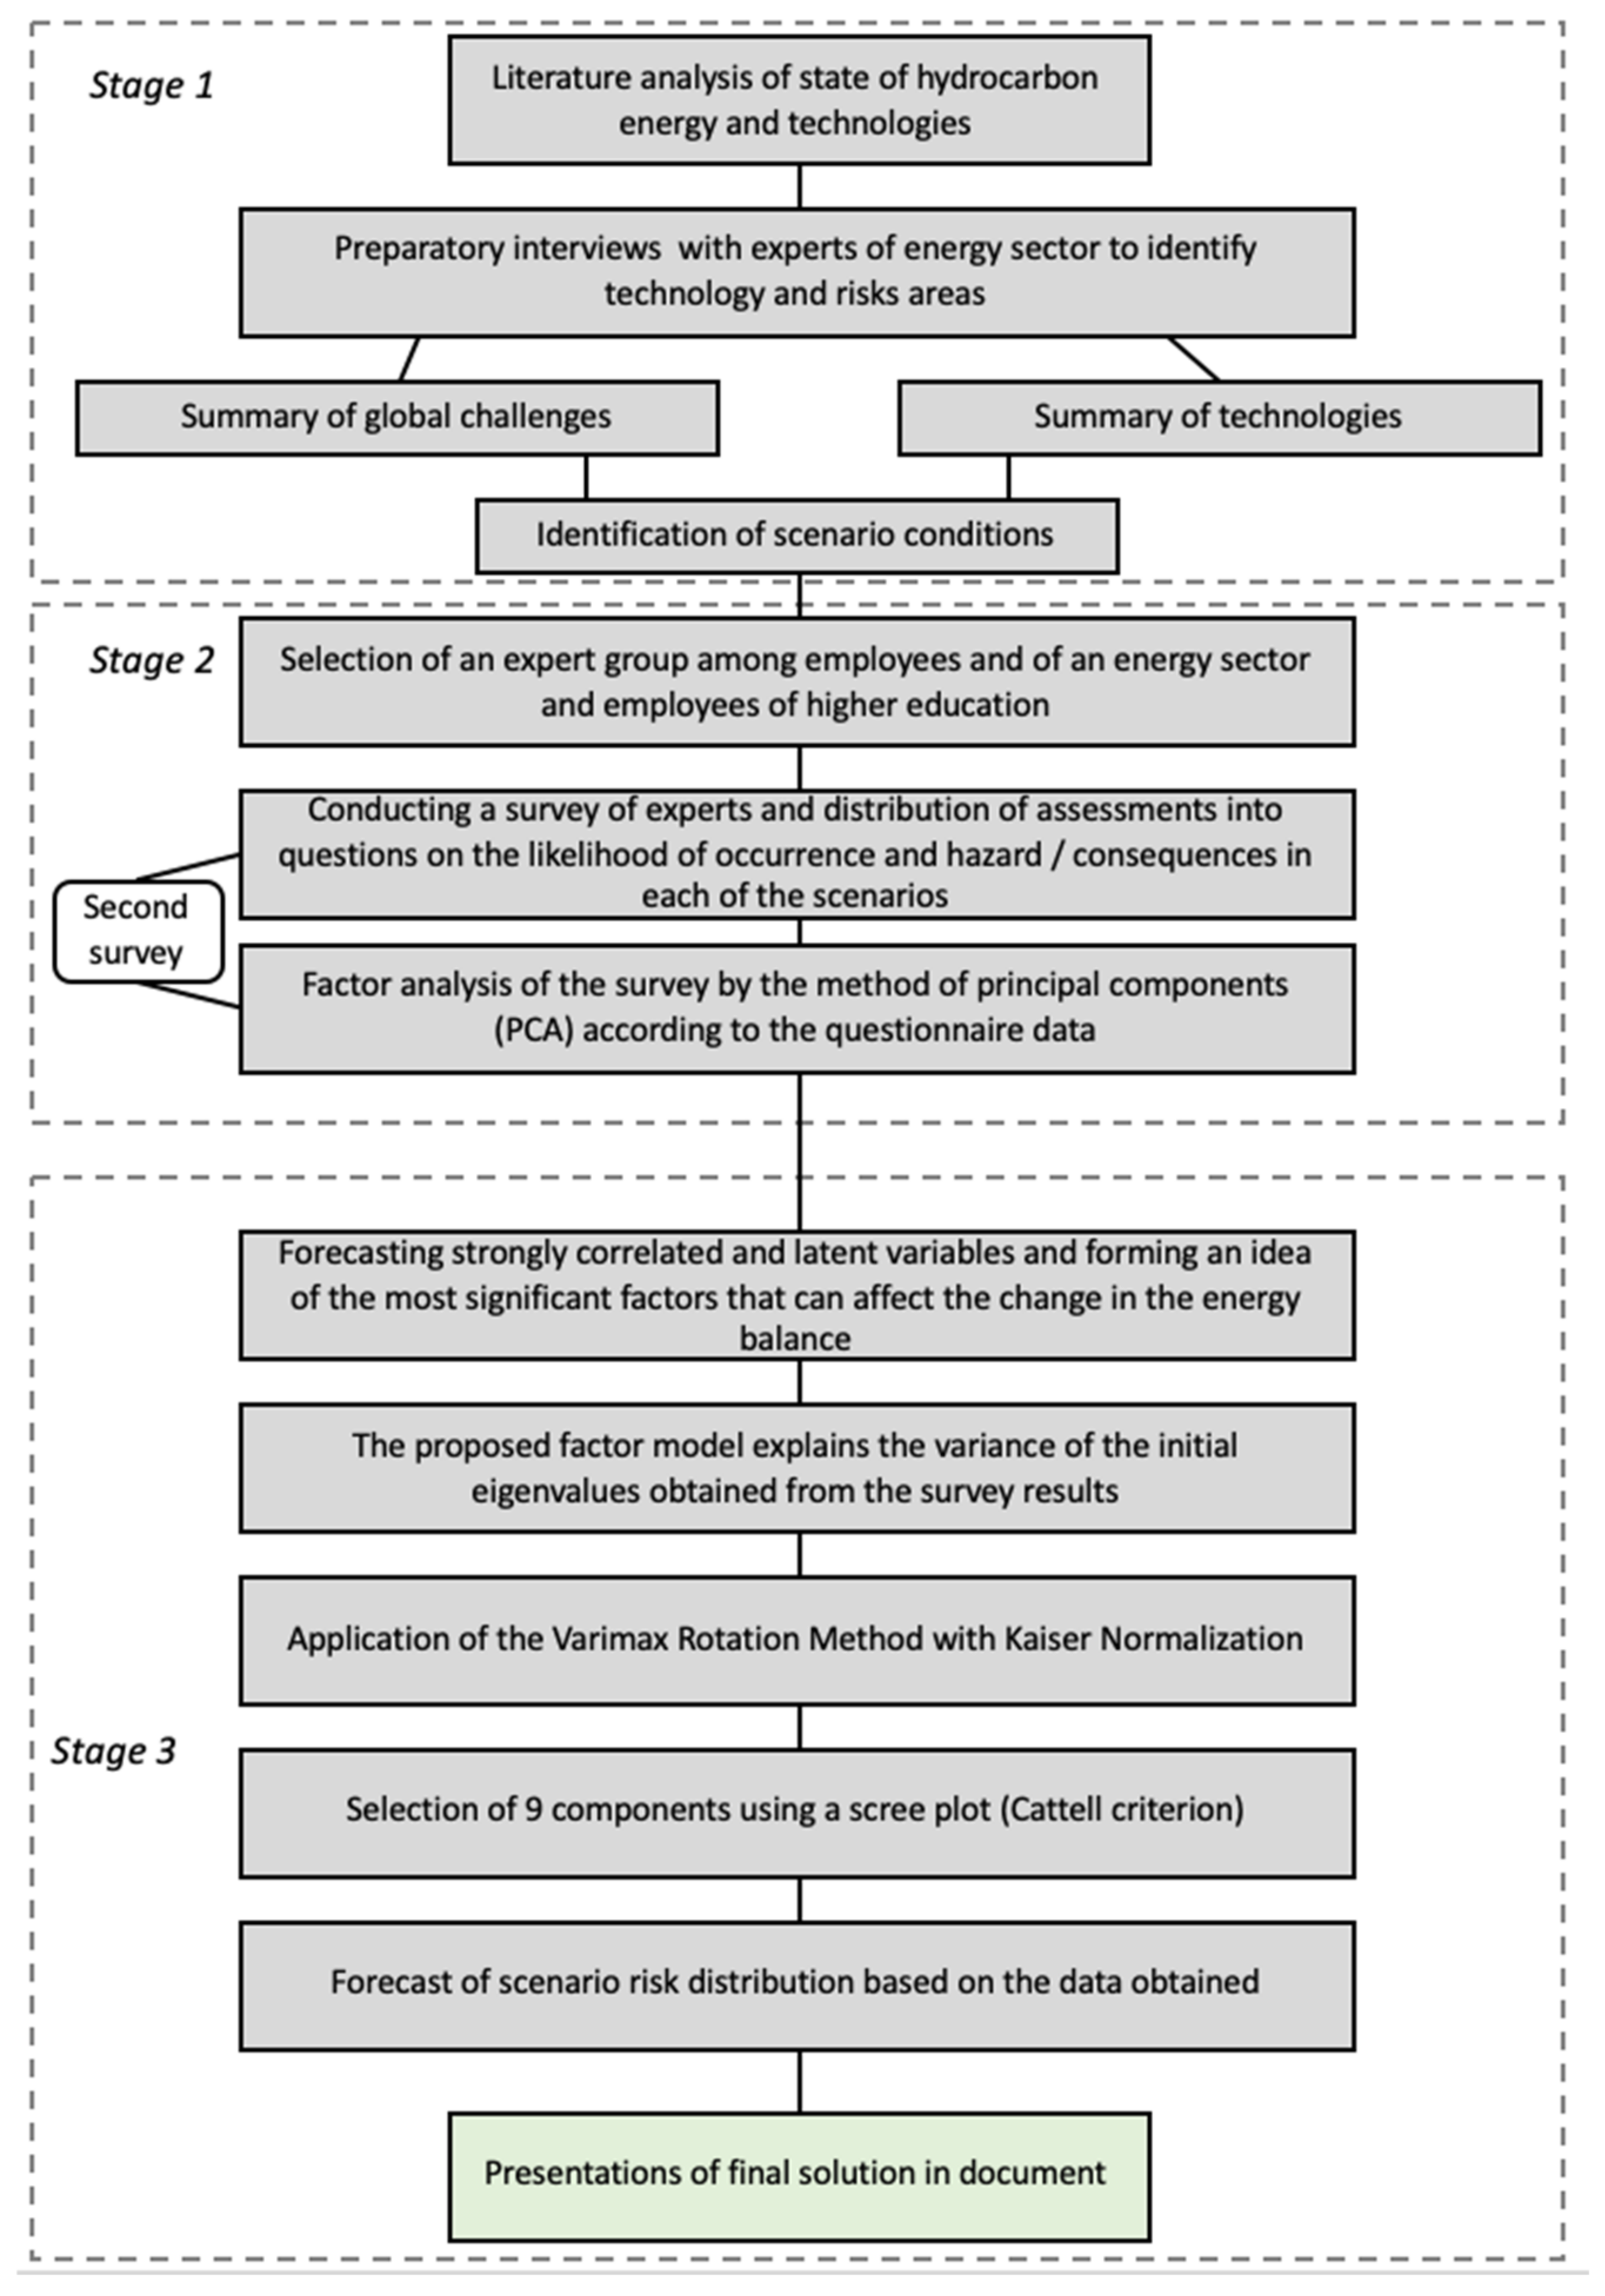
2. Materials and Methods
- Technologies and the directions of their development of primary interest;
- Analysis of the state and the prospects of the development of the fossil energy;
- Comprehensive analysis of global risks [28];
- Factor analysis based on expert assessments resulting from a survey of employees of energy companies and graduates of specialized universities.
2.1. Analysis of Global Risks
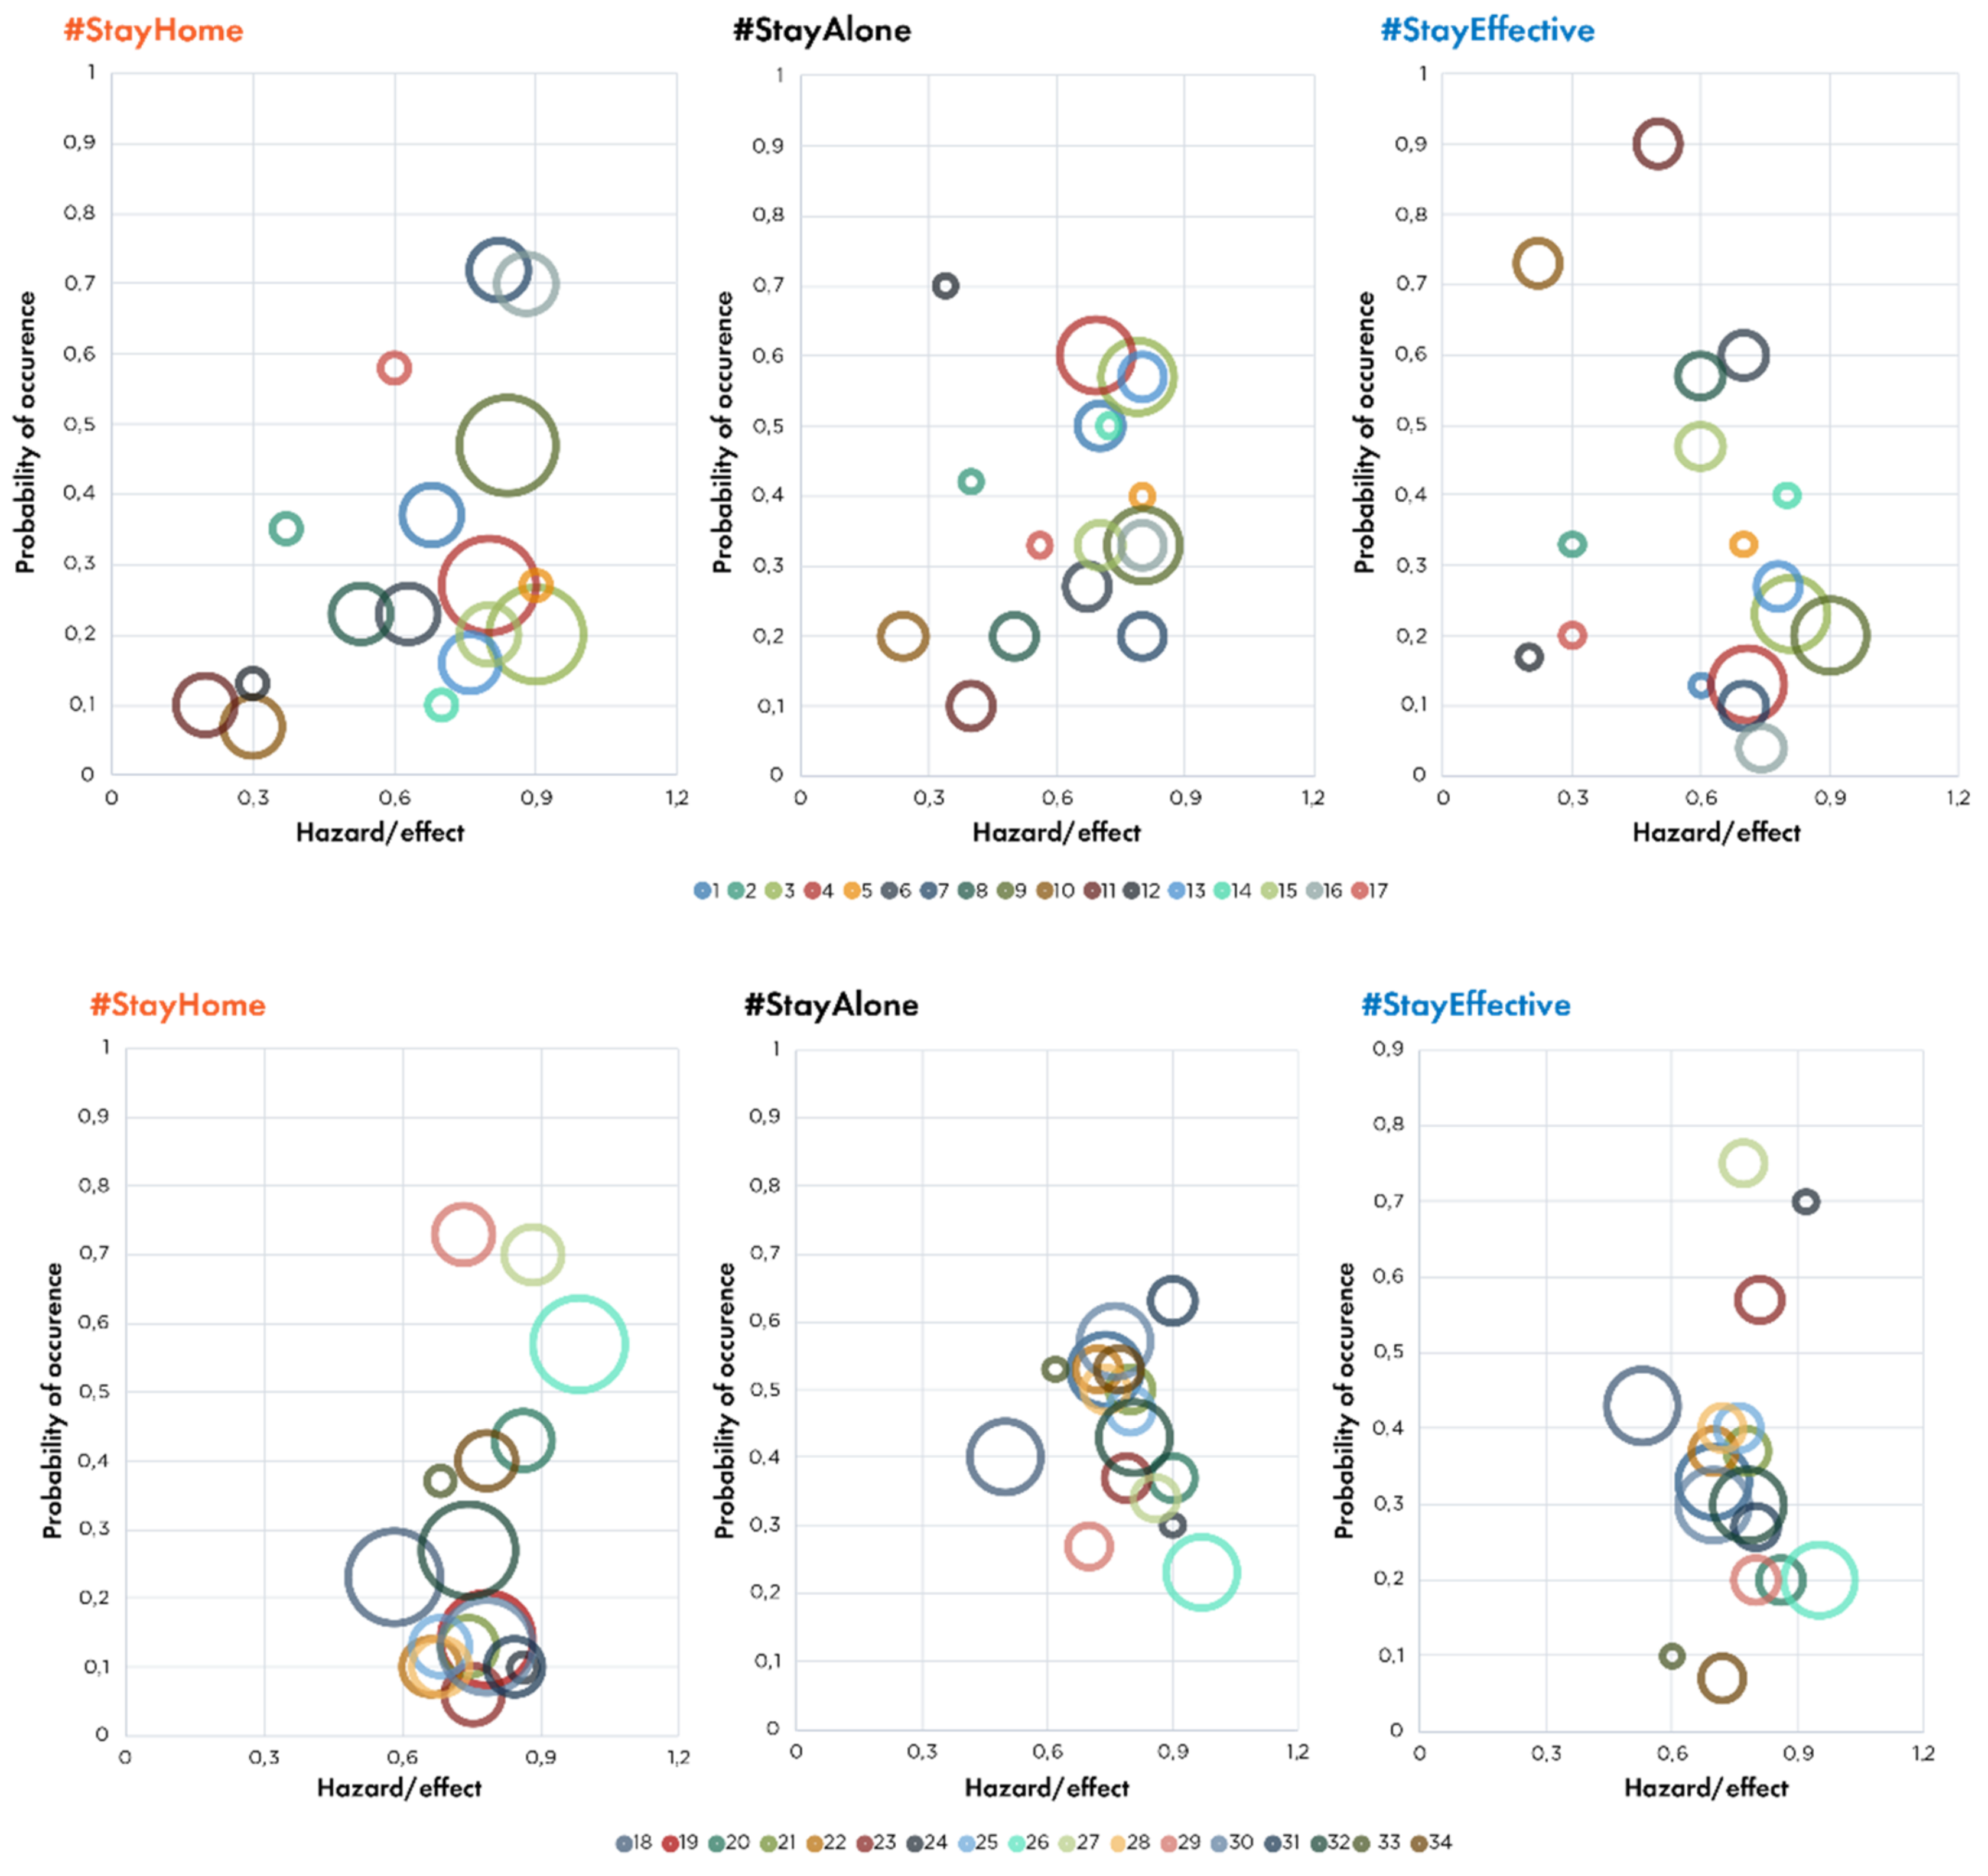
2.2. Description of the Scenarios
2.2.1. Negative Scenario: #StayHome
- -
- Maintaining isolation of certain groups of citizens, businesses, and countries;
- -
- Reducing of the consumption of energy, goods, and services to reach a minimum in 2022–2023 in the perspective of maintaining it at a low level until the end of the horizon of our forecasting;
- -
- Growing unemployment;
- -
- High volatility of energy prices;
- -
- Outflow of investment;
- -
- Accelerated deterioration of the infrastructure;
- -
- Deterioration of the environmental situation;
- -
- Risk of energy hunger as well as water and food shortages for certain categories of countries;
- -
- Growth of social tensions in energy-poor countries and countries with a significant foreign trade deficit;
- -
- Reduction of global trade in goods and services in physical and monetary terms;
- -
- Reorientation of products to domestic markets;
- -
- Acceleration of imported substitution.
2.2.2. Moderate Scenario: #StayAlone
- -
- Partial restoration of chains of international supply of goods, energy, and materials and instability in the supply of minerals and energy;
- -
- Resumption of the development of unprofitable deposits;
- -
- Investment gap in the infrastructure remains;
- -
- Investments in renewable energy;
- -
- Growing need for qualified personnel;
- -
- Return of the global energy consumption to the previous level;
- -
- Continued deterioration of the environmental situation;
- -
- Increased investment in research, equipment, and personnel for the energy sector.
2.2.3. Positive Scenario: #StayEffective
- -
- Complete restoration of temporarily destroyed global supply chains of energy, materials, and goods to reduce costs and to exclude political influence.
- -
- Creation of prerequisites for sustainable development of the global energy infrastructure through international planning and financing;
- -
- Implementation of digital technologies in all life cycles of hydrocarbons, restraining the growth of their consumption;
- -
- Launch of a reliable international system for tracing the origin and for the replenishment of energy and resources, confirming the level of efficiency of the supplied energy and goods and their carbon-free nature.
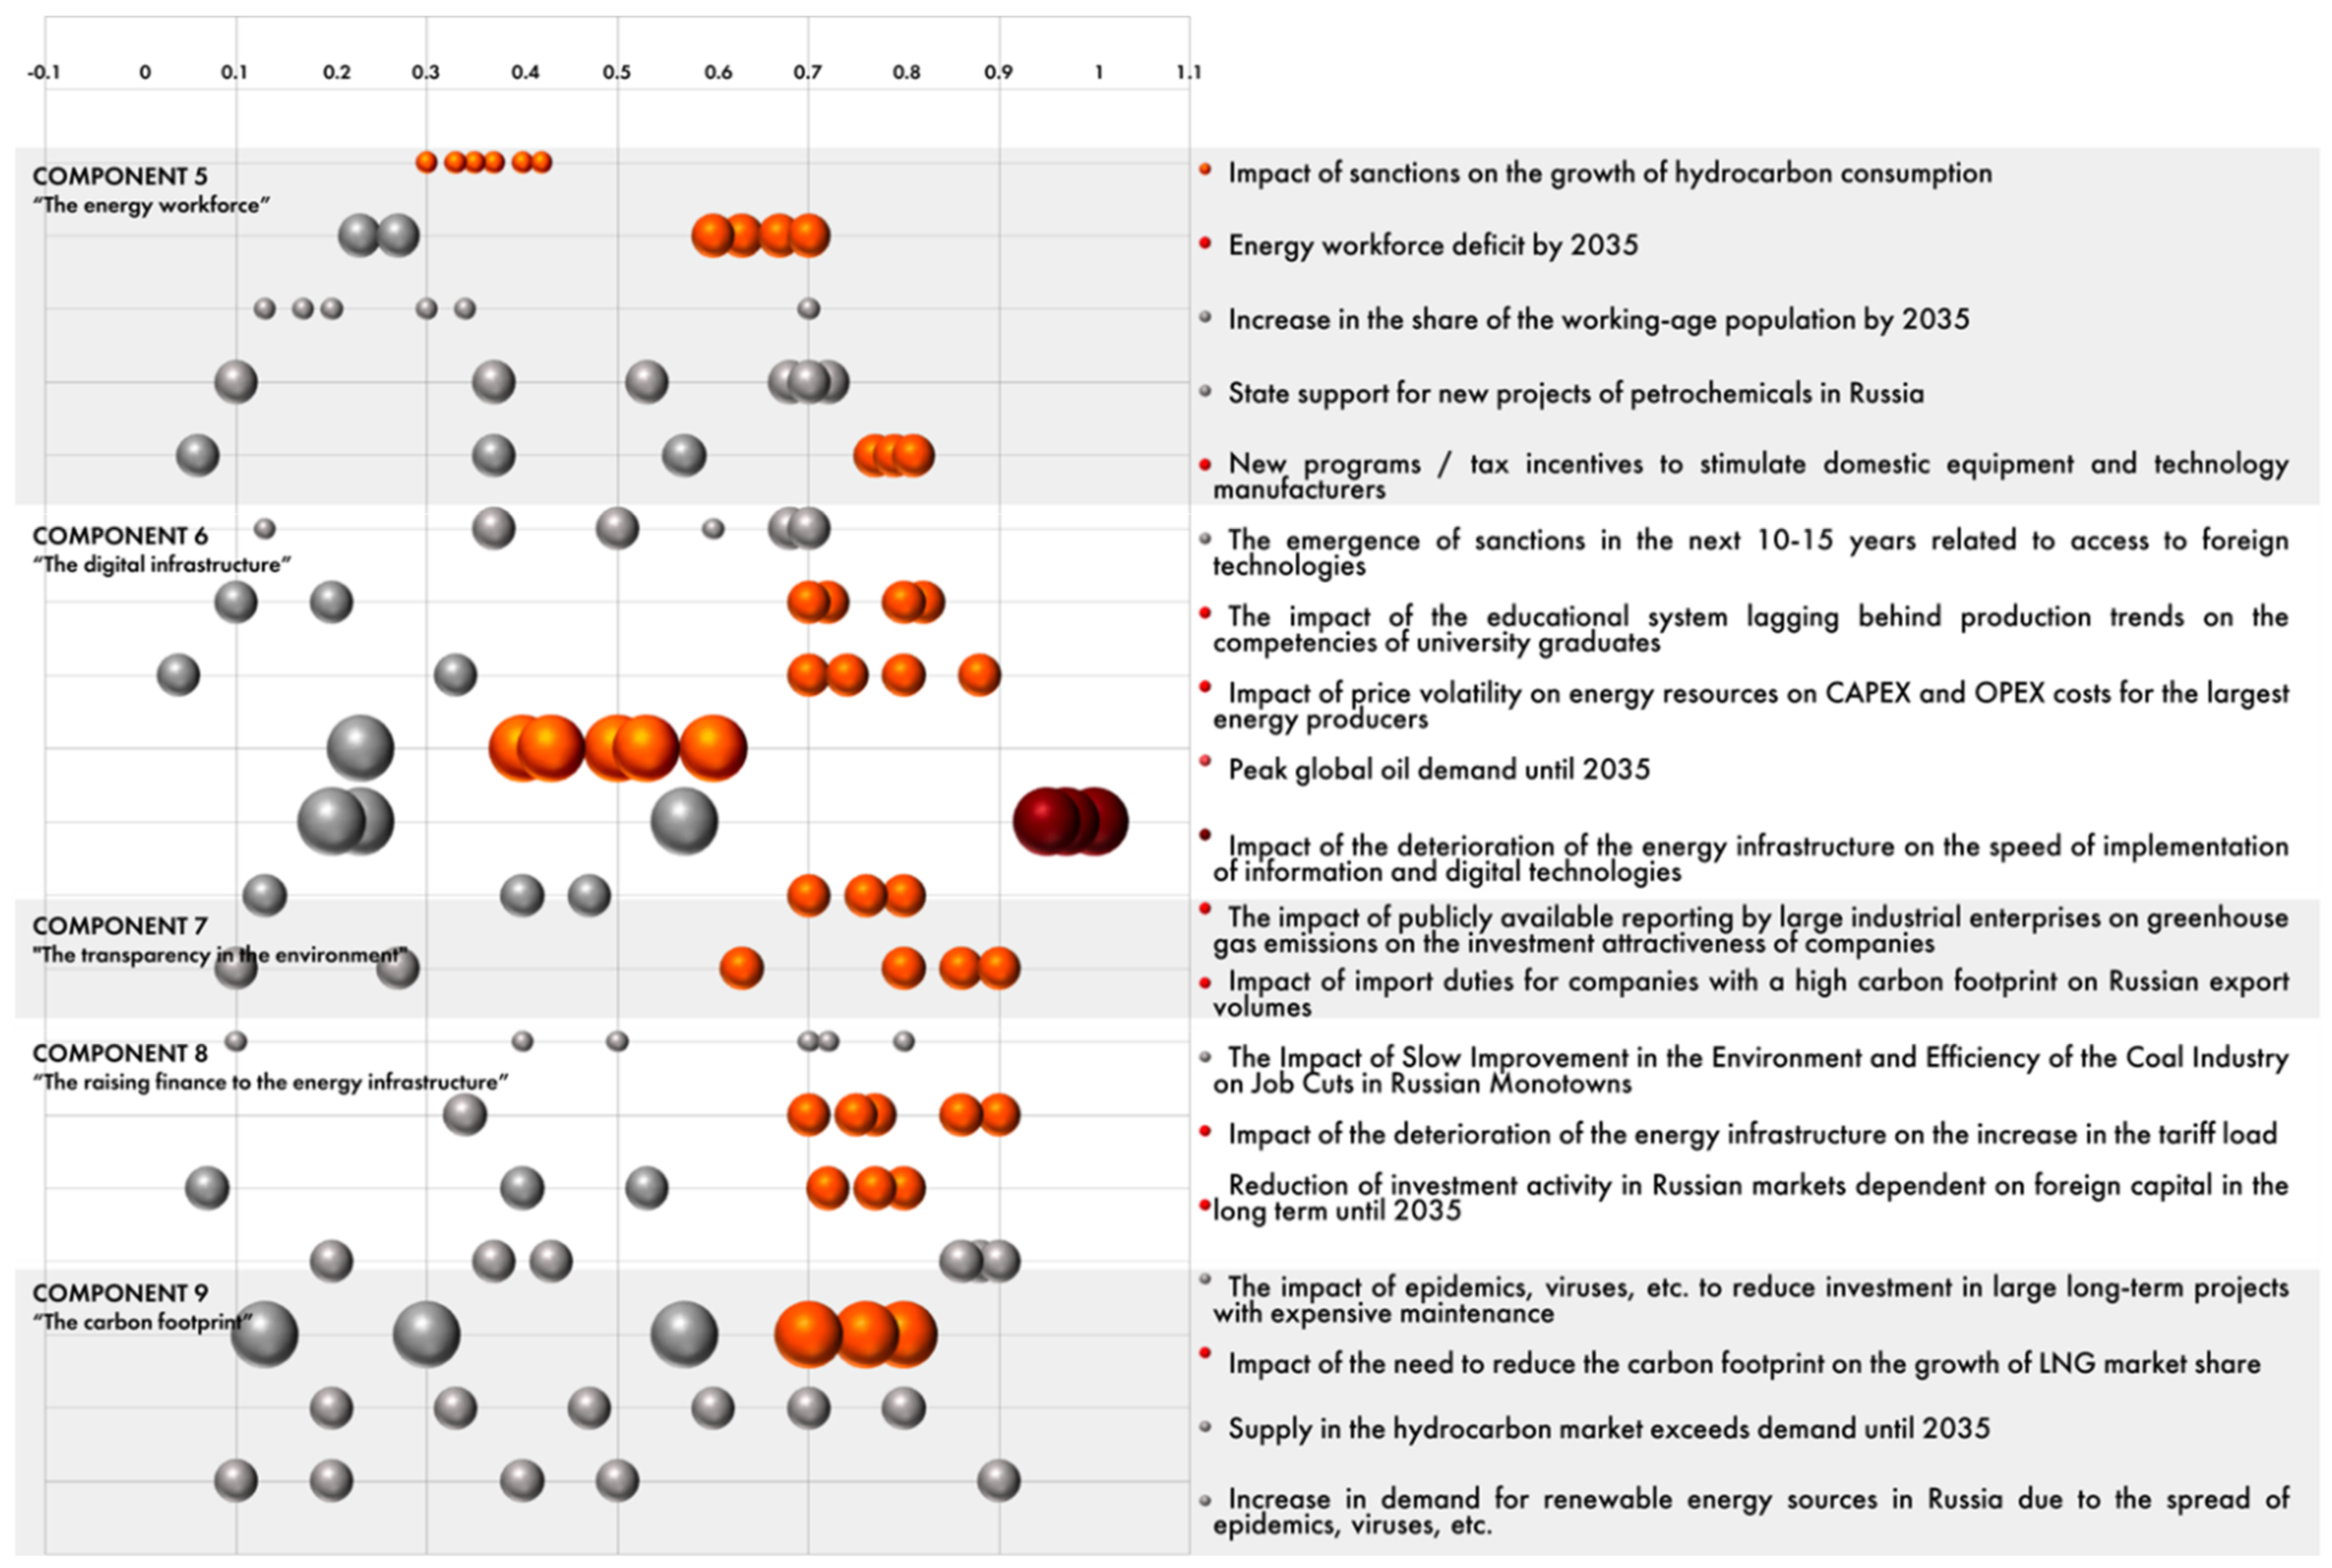
2.3. Analysis of the Expert Survey
3. Results and Discussions
3.1. The Programs of Development of the Energy Sector
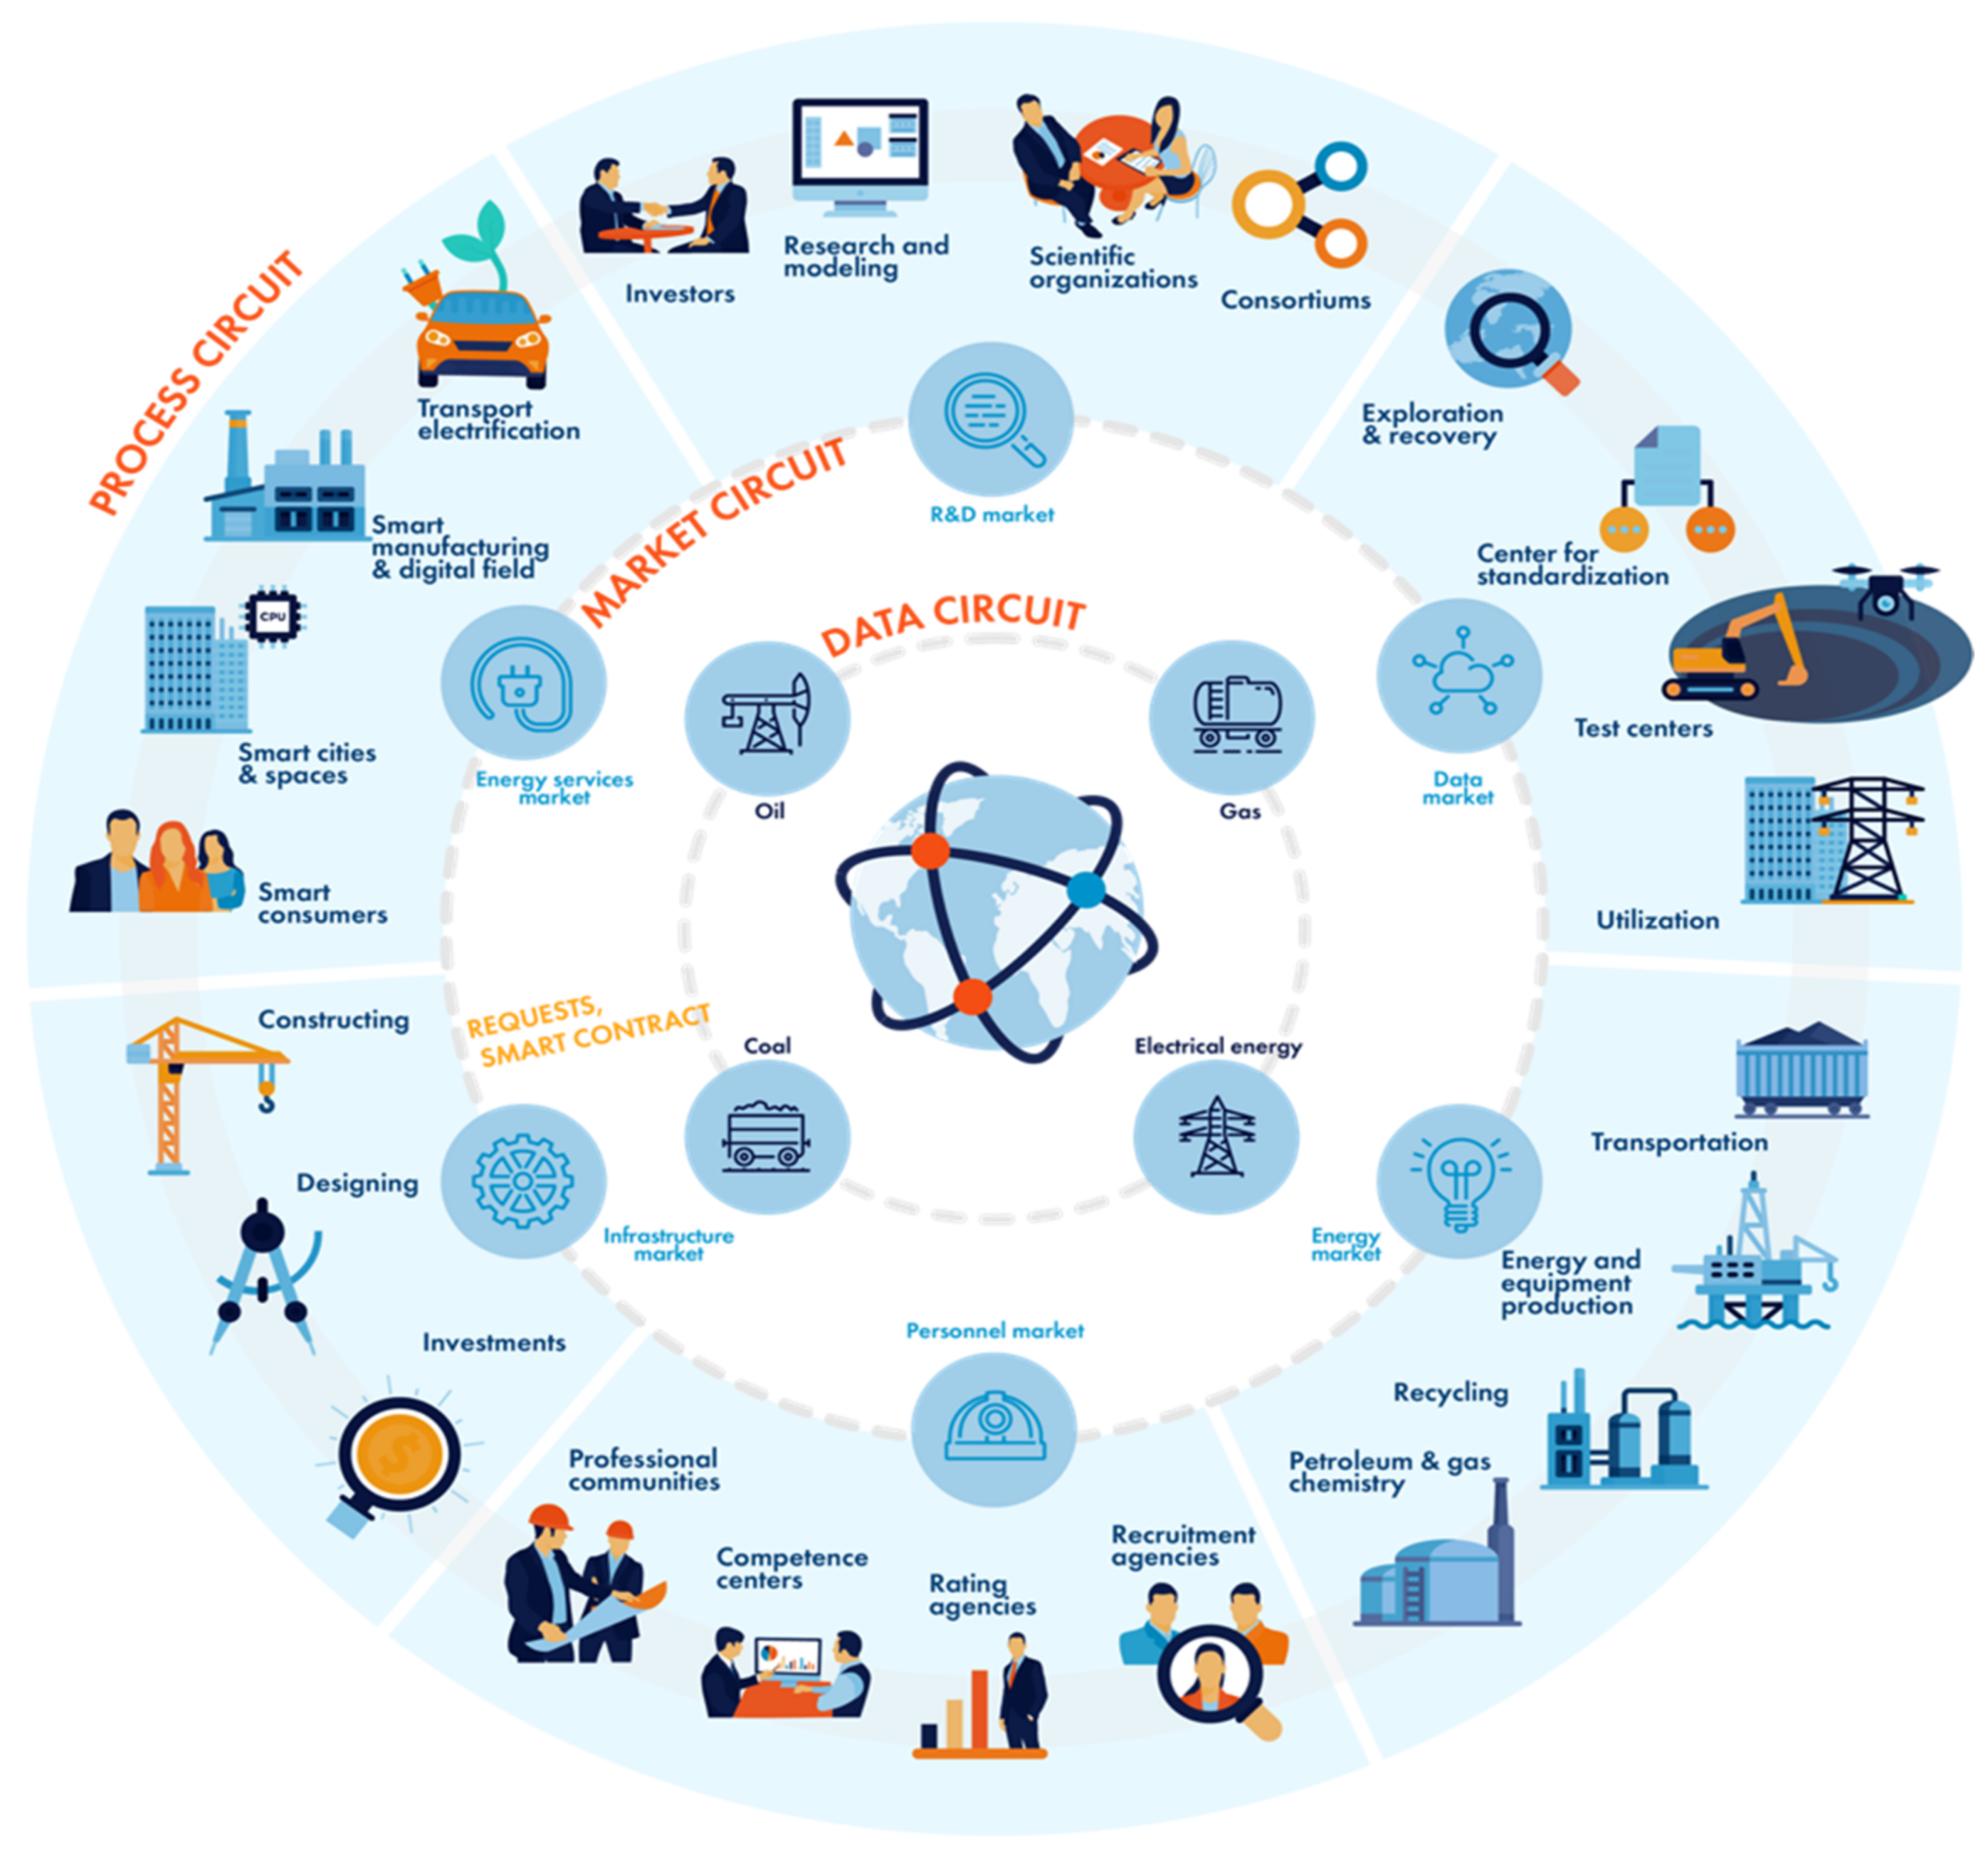
3.2. The Development of Digital Platfrom
- -
- determines the likelihood of peak power consumption;
- -
- allows better use of energy when demand is minimal;
- -
- encourages users to actively use periods of low demand;
- -
- increases the efficiency of operations;
- -
- analyzes unstructured data, which now make up 80% of the information in companies;
- -
- predicts the technical condition of the equipment;
- -
- detects infrastructure failures;
- -
- performs maintenance, data processing, and training and schedules optimization tasks.
- In the field of electricity generation, IoT can be used to monitor the generation of electricity by various types of power plants (fossil fuels, wind, solar energy, biomass), gas emissions, energy storage, energy consumption, and prediction of the required capacity to supply consumers.
- IoT can be used to determine power consumption, to dispatch, monitor, and protect power lines, substations, and towers, and to control and monitor equipment.
- IoT can be used on the consumer side at the level of smart meters for measuring various types of parameters, energy consumption, interaction between different networks, charging and discharging electric vehicles, and managing consumption.
- -
- The smart contract is complete automation and reliability of the execution of contractual relations [57,70]. It is an ensemble of electronic algorithms that describe a set of conditions, the implementation of which entails some events in the real world and/or digital systems, as presented in a previous study [56]. Due to the consensus protocols embedded in the blockchain platform, it will be possible to share resources between several users in the format of exchanging energy resources between infrastructure, data, or using a common centralized storage. Blockchains and smart contracts can enable sharing of a single source based on digitally signed agreements.
- -
- The data market is the basis for using artificial intelligence in predicting violations of the safe operation of energy facilities [71].
- -
- Research & Development markets and personnel markets appear to enhance the quality of education and science. These are the basis for the development of connections between the blocks of the platform.
- -
- The energy services market is energy saving, demand management, integration of distributed energy sources, and other digital energy technologies.
- -
- Energy market and infrastructure market provide access to investment and ownership of energy facilities at any level, which will affect the cost of consumption of energy and generate income.
4. Conclusions
Author Contributions
Funding
Conflicts of Interest
References
- Cantarero, M.M.V. Of renewable energy, energy democracy, and sustainable development: A roadmap to accelerate the energy transition in developing countries. Energy Res. Soc. Sci. 2020, 70, 101716. [Google Scholar] [CrossRef]
- Bucci, A.; Eraydin, L.; Muller, M. Dilution effects, population growth and economic growth under human capital accumula-tion and endogenous technological change. J. Macroecon. 2019, 62, 103050. [Google Scholar] [CrossRef] [Green Version]
- O’Sullivan, J.N. The social and environmental influences of population growth rate and demographic pressure deserve greater attention in ecological economics. Ecol. Econ. 2020, 172, 106648. [Google Scholar] [CrossRef]
- Xu, Z.; Li, Y.; Chau, S.N.; Dietz, T.; Li, C.; Wan, L.; Zhang, J.; Zhang, L.; Li, Y.; Chung, M.G.; et al. Impacts of international trade on global sustainable development. Nat. Sustain. 2020, 3, 964–971. [Google Scholar] [CrossRef]
- Scown, M.W. The Sustainable Development Goals need geoscience. Nat. Geosci. 2020, 13, 714–715. [Google Scholar] [CrossRef]
- Rogelj, J.; McCollum, D.; Riahi, K. The UN’s ‘Sustainable Energy for All’ initiative is compatible with a warming limit of 2 °C. Nat. Clim. Chang. 2013, 3, 545–551. [Google Scholar] [CrossRef]
- Balogun, A.-L.; Marks, D.; Sharma, R.; Shekhar, H.; Balmes, C.; Maheng, D.; Arshad, A.; Salehi, P. Assessing the Potentials of Digitalization as a Tool for Climate Change Adaptation and Sustainable Development in Urban Centres. Sustain. Cities Soc. 2019, 53, 101888. [Google Scholar] [CrossRef]
- Simsek, Y.; Santik, W.G.; Anisuzzaman, M.; Urmee, T.; Bahri, P.A.; Escobara, R. An analysis of additional energy requirement to meet the sustainable development goals. J. Clean. Prod. 2020, 272, 122646. [Google Scholar] [CrossRef]
- UN. Sustainable Energy Goals. 2020. Available online: https://www.un.org/sustainabledevelopment/ (accessed on 20 February 2021).
- Reyers, B.; Selig, E.R. Global targets that reveal the social-ecological interdependencies of sustainable development. Nat. Ecol. Evol. 2020, 4, 1011–1019. [Google Scholar] [CrossRef]
- Buonocore, J.J.; Choma, E.; Villavicencio, A.H.; Spengler, J.D.; Koehler, D.A.; Evans, J.S.; Lelieveld, J.; Klop, P.; Sanchez-Pina, R. Metrics for the sustainable development goals: Renewable energy and transportation. Palgrave Commun. 2019, 5, 136. [Google Scholar] [CrossRef]
- Iakovleva, E.; Lavrik, A.; Leskov, A. Assessing Solar Power Plant Efficiency Degradation Resulting from Heating. J. Ecol. Eng. 2018, 19, 115–119. [Google Scholar] [CrossRef]
- BP. Energy Outlook 2020. Available online: https://www.bp.com/content/dam/bp/business-sites/en/global/corporate/pdfs/energy-economics/energy-outlook/bp-energy-outlook-2020.pdf (accessed on 2 February 2021).
- McKinsey Energy Insight of Global Energy Perspective 2020. Available online: https://www.mckinsey.com/~/media/McKinsey/Industries/Oil%20and%20Gas/Our%20Insights/Global%20Energy%20Perspective%202019/McKinsey-Energy-Insights-Global-Energy-Perspective-2019_Reference-Case-Summary.ashx (accessed on 10 February 2021).
- Spillias, S.; Kareiva, P.; Ruckelshaus, M.; McDonald-Madden, E. Renewable energy targets may undermine their sustainability. Nat. Clim. Chang. 2020, 10, 974–976. [Google Scholar] [CrossRef]
- Sonter, L.J.; Dade, M.C.; Watson, J.E.M.; Valenta, R.K. Renewable energy production will exacerbate mining threats to biodiversity. Nat. Commun. 2020, 11, 1–6. [Google Scholar] [CrossRef] [PubMed]
- World Economic Forum. Which Countries Could Gain the Most from Renewable Energy? 2018. Available online: https://www.weforum.org/agenda/2018/05/these-20-water-stressed-countries-have-the-most-solar-and-wind-potential (accessed on 1 March 2021).
- Litvinenko, V. Digital Economy as a Factor in the Technological Development of the Mineral Sector. Nat. Resour. Res. 2019, 29, 1521–1541. [Google Scholar] [CrossRef]
- Zeppini, P.; Jeroen, C.J.M.; van den Bergh, J. Global competition dynamics of fossil fuels and renewable energy under climate policies and peak oil: A behavioral model. Energy Policy 2020, 136, 110907. [Google Scholar] [CrossRef]
- Wang, Q.; Li, S.; Pisarenko, Z. Heterogeneous effects of energy efficiency, oil price, environmental pressure, R&D investment, and policy on renewable energy—Evidence from the G20 countries. Energy 2020, 209, 118322. [Google Scholar] [CrossRef]
- Brockway, P.E.; Owen, A.; Brand-Correa, L.I.; Hardt, L. Estimation of global final-stage energy-return-on-investment for fossil fuels with comparison to renewable energy sources. Nat. Energy 2019, 4, 612–621. [Google Scholar] [CrossRef] [Green Version]
- Bazhin, V.Y.; Nikitina, L.N.; Savchenkov, S.A. Experience of mining specialists training at the chair of process and production automation of the mining university. Eur. Min. 2017, 1, 42–44. [Google Scholar] [CrossRef]
- Dvoynikov, M.; Nutskova, M.; Blinov, P.A. Developments Made in the Field of Drilling Fluids by Saint Petersburg Mining University. Int. J. Eng. 2020, 33, 702–711. [Google Scholar] [CrossRef]
- Huynh, T.L.D.; Hille, E.; Nasir, M.A. Diversification in the age of the 4th industrial revolution: The role of artificial intelligence, green bonds and cryptocurrencies. Technol. Forecast. Soc. Chang. 2020, 159, 120188. [Google Scholar] [CrossRef]
- Kishita, Y.; Mizuno, Y.; Fukushige, S.; Umeda, Y. Scenario structuring methodology for computer-aided scenario design: An application to envisioning sustainable futures. Technol. Forecast. Soc. Chang. 2020, 160, 120207. [Google Scholar] [CrossRef]
- Worku, G.; Teferi, E.; Bantider, A.; Dile, Y.T. Prioritization of watershed management scenarios under climate change in the Jemma sub-basin of the Upper Blue Nile Basin, Ethiopia. J. Hydrol. Reg. Stud. 2020, 31, 100714. [Google Scholar] [CrossRef]
- Jefferson, M. Scenario planning: Evidence to counter ‘Black box’ claims. Technol. Forecast. Soc. Chang. 2020, 158, 120156. [Google Scholar] [CrossRef]
- Linzenich, A.; Zaunbrecher, B.; Ziefle, M. “Risky transitions?” Risk perceptions, public concerns, and energy infrastructure in Germany. Energy Res. Soc. Sci. 2020, 68, 101554. [Google Scholar] [CrossRef]
- Zhong, Q.-C. Synchronized and Democratized Smart Grids To Underpin The Third Industrial Revolution. IFAC-PapersOnLine 2017, 50, 3592–3597. [Google Scholar] [CrossRef]
- Soares, N.; Martins, A.; Carvalho, A.; Caldeira, C.; Du, C.; Castanheira, E.; Rodrigues, E.; Oliveira, G.; Pereira, G.I.; Bastos, J.; et al. The challenging paradigm of interrelated energy systems towards a more sustainable future. Renew. Sustain. Energy Rev. 2018, 95, 171–193. [Google Scholar] [CrossRef] [Green Version]
- Oil and Gas Industry Expansions Could Add as Much Greenhouse Gas Pollution as 50 Coal Plants by 2025; Environmental Integrity Project: Washington, DC, USA, 2020.
- Liu, Z.; Ciais, P.; Deng, Z.; Davis, S.J.; Zheng, B.; Wang, Y.; Cui, D.; Zhu, B.; Dou, X.; Ke, P.; et al. Carbon Monitor, a near-real-time daily dataset of global CO2 emission from fossil fuel and cement production. Sci. Data 2020, 7, 1–12. [Google Scholar] [CrossRef] [PubMed]
- World Development Indicators Database, World Bank 2021. Available online: https://databank.worldbank.org/source/world-development-indicators (accessed on 12 February 2021).
- UN. Data Sources, Country Classifications, and Aggregation Methodology. United Nations. 2020. Available online: https://www.un.org (accessed on 11 February 2021).
- EIA. International Energy Outlook 2019 with Projections to 2050. U.S. Energy Information Administration. 2019. Available online: https://www.eia.gov/outlooks/ieo/pdf/ieo2019.pdf (accessed on 2 February 2021).
- Umar, M.; Ji, X.; Kirikkaleli, D.; Alola, A.A. The imperativeness of environmental quality in the United States transportation sector amidst biomass-fossil energy consumption and growth. J. Clean. Prod. 2020, 285, 124863. [Google Scholar] [CrossRef]
- Pashke, M. Legal Aspects of Germany’s New Energy Policy. J. Min. Inst. 2017, 226, 487. [Google Scholar]
- Frenzy, F. How the Fracking Industry is Threatening the Planet 2014/Friends of the Earth Europe. 2014. Available online: http://www.foeeurope.org/sites/default/files/publications/fracking_frenzy_0.pdf (accessed on 25 February 2021).
- EIA. Natural Gas Explained. 2020. Available online: https://www.eia.gov/energyexplained/natural-gas/data-and-statistics.php (accessed on 2 February 2021).
- Nevskaya, M.; Seleznev, S.G.; Masloboev, V.A.; Klyuchnikova, E.M.; Makarov, D.V. Environmental and Business Challenges Presented by Mining and Mineral Processing Waste in the Russian Federation. Minerals 2019, 9, 445. [Google Scholar] [CrossRef] [Green Version]
- Tarazanov, I.G.; Gubanov, D.A. Results of the work of the coal industry in Russia for January–December 2020. Coal 2020, 3, 27–43. (In Russian) [Google Scholar]
- FORTUM—For a Cleaner World. Fortum Investor Relations and Financial Communications. 2020. Available online: https://www.fortum.com (accessed on 12 February 2021).
- Russian Export of the Most Important Goods. Federal Customs Service of the Russian Federation. 2019. Available online: http://customs.ru (accessed on 23 February 2021). (In Russian).
- Statistical Yearbook of World Energy. Enerdata. 2019. Available online: https://yearbook.enerdata.ru (accessed on 4 February 2021). (In Russian).
- Di Silvestre, M.L.; Favuzza, S.; Sanseverino, E.R.; Zizzo, G. How Decarbonization, Digitalization and Decentralization are changing key power infrastructures. Renew. Sustain. Energy Rev. 2018, 93, 483–498. [Google Scholar] [CrossRef]
- BloombergNEF. New Energy Forecast 2020. Available online: https://about.bnef.com/new-energy-outlook/ (accessed on 25 February 2021).
- Rissse, M.; Rentyuk, V. Several steps to effective data processing from oil and gas fields. Control Eng. 2019, 81, 20–24. [Google Scholar]
- High-Efficiency, Low-Emissions Coal Plants: Come HELE or High Water/Transform. Energy Outlook. 2018. Available online: https://www.ge.com (accessed on 2 February 2021).
- Sustainability Report 2018. Royal Dutch Shell. 2018. Available online: https://reports.shell.com/sustainability-report/2018/ (accessed on 2 December 2020).
- Global Energy Highlights 2019. Enerdata. 2020. Available online: https://yearbook.enerdata.net (accessed on 27 February 2021).
- Bardanov, A.I.; Vasilkov, O.S.; Pudkova, T.V. Modeling the process of redistributing power consumption using energy storage system with various configurations to align the electrical loads schedule. In Proceedings of the International Conference on Innovations, Physical Studies and Digitalization in Mining Engineering 2020, IPDME 2020, St. Petersburg, Russia, 23–24 April 2020; Volume 1753, pp. 1–9. [Google Scholar]
- IRENA. Scenarios for the Energy Transition: Global Experience and Best Practices; IRENA: Abu Dhabi, United Arab Emirates, 2020. [Google Scholar]
- The Global Electric Vehicle Market in 2020: Statistics & Forecasts; Virta: Helsinki, Finland, 2020.
- IEA. Global EV Outlook 2019; International Energy Agency: Paris, France, 2020. [Google Scholar]
- IEA. World Energy Outlook 2019. Available online: https://webstore.iea.org/world-energy-outlook-2019 (accessed on 28 February 2021).
- Shabalov, M.Y.; Zhukovskiy, Y.L.; Buldysko, A.D.; Gil, B.; Starshaia, V.V. The influence of technological changes in energy efficiency on the infrastructure deterioration in the energy sector. Energy Rep. 2021, 7, 2664–2680. [Google Scholar] [CrossRef]
- Shove, E. Time to rethink energy research. Nat. Energy 2020, 6, 118–120. [Google Scholar] [CrossRef]
- Zhukovskiy, Y.L.; Starshaia, V.V.; Batueva, D.E.; Buldysko, A.D. Analysis of technological changes in integrated intelligent power supply systems. Innovation-Based Development of the Mineral Resources Sector: Challenges and Prospects. In Proceedings of the 11th Russian-German Raw Materials Conference, Potsdam, Germany, 7–8 November 2018; pp. 249–258. [Google Scholar]
- Chen, K.; Ren, Z.; Mu, S.; Sun, T.; Mu, R. Integrating the delphi survey into scenario planning for China’s renewable energy development strategy towards 2030. Technol. Forecast. Soc. Chang. 2020, 158, 120157. [Google Scholar] [CrossRef]
- Jones, A.W. Perceived barriers and policy solutions in clean energy infrastructure investment. J. Clean. Prod. 2015, 104, 297–304. [Google Scholar] [CrossRef] [Green Version]
- Jonek-Kowalska, I. Efficiency of Enterprise Risk Management (ERM) systems. Comparative analysis in the fuel sector and energy sector on the basis of Central-European companies listed on the Warsaw Stock Exchange. Resour. Policy 2019, 62, 405–415. [Google Scholar] [CrossRef]
- Pashkevich, M.A.; Petrova, T.A. Technogenic impact of sulfide-containing wastes produced by ore mining and processing at the Ozernoe deposit: Investigation and forecast. J. Ecol. Eng. 2017, 18, 127–133. [Google Scholar] [CrossRef]
- Vaillancourt, K.; Bahn, O.; Frenette, E.; Sigvaldason, O. Exploring deep decarbonization pathways to 2050 for Canada using an optimization energy model framework. Appl. Energy 2017, 195, 774–785. [Google Scholar] [CrossRef]
- EIA. Natural Gas-Fired Generation has Increased in Most U.S. Regions Since 2015. U.S. Energy Information Administration. 2020. Available online: https://www.eia.gov/ (accessed on 2 February 2021).
- Cleopatra, W.A.; André, W. Varimax Rotation Based on Gradient Projection Is a Feasible Alternative to SPSS. Front. Psychol. 2019, 10, 645. [Google Scholar] [CrossRef]
- Hew, A.; Perrons, R.K.; Washington, S.; Page, L.; Zheng, Z. Using digital technologies to deliver scenarios to geographically dispersed stakeholders: Lessons learned from the transportation sector. Futures 2020, 120, 102567. [Google Scholar] [CrossRef]
- Tcvetkov, P.; Cherepovitsyn, A.; Makhovikov, A. Economic assessment of heat and power generation from small-scale lique-fied natural gas in Russia. Energy Rep. 2020, 6, 391–402. [Google Scholar] [CrossRef]
- Coady, D.; Parry, I.; Sears, L.; Shang, B. How large are global fossil fuel subsidies? World Dev. 2017, 91, 11–27. [Google Scholar] [CrossRef]
- Shell. LNG Outlook 2019; Shell: Hague, The Netherlands, 2020. [Google Scholar]
- Zhukovskiy, Y.; Malov, D. Concept of Smart Cyberspace for Smart Grid Implementation. J. Phys. Conf. Ser. 2018, 1015, 42067. [Google Scholar] [CrossRef]
- Lynch, C. How do your data grow? Nature 2008, 455, 28–29. [Google Scholar] [CrossRef]
- Savage, N. The race to the top among the world’s leaders in artificial intelligence. Nature 2020, 588, S102–S104. [Google Scholar] [CrossRef]
- Wetzstein, G.; Ozcan, A.; Gigan, S.; Fan, S.; Englund, D.; Soljačić, M.; Denz, C.; Miller, D.A.B.; Psaltis, D. Inference in artificial intelligence with deep optics and photonics. Nature 2020, 588, 39–47. [Google Scholar] [CrossRef]
- Vazirani, A.A.; O’Donoghue, O.; Brindley, D.; Meinert, E. Blockchain vehicles for efficient Medical Record management. NPJ Digit. Med. 2020, 3, 1–5. [Google Scholar] [CrossRef]
- Vranken, H. Sustainability of bitcoin and blockchains. Curr. Opin. Environ. Sustain. 2017, 28, 1–9. [Google Scholar] [CrossRef] [Green Version]
- Howson, P. Tackling climate change with blockchain. Nat. Clim. Chang. 2019, 9, 644–645. [Google Scholar] [CrossRef]
- Lu, H.; Guo, L.; Azimi, M.; Huang, K. Oil and Gas 4.0 era: A systematic review and outlook. Comput. Ind. 2019, 111, 68–90. [Google Scholar] [CrossRef]
- Li, X.; Huang, Q.; Wu, D. Distributed large-scale Co-simulation for IoT-aided smart grid control. IEEE Access 2017, 5, 19951–19960. [Google Scholar] [CrossRef]
- Rao, L.; Liu, X.; Xie, L.; Pang, Z. Hedging Against Uncertainty: A Tale of Internet Data Center Operations Under Smart Grid Environment. IEEE Trans. Smart Grid 2011, 2, 555–563. [Google Scholar] [CrossRef]
- Ciavarella, S.; Joo, J.-Y.; Silvestri, S. Managing contingencies in smart grids via the Internet of Things. IEEE Trans. Smart Grid 2016, 7, 2134–2141. [Google Scholar] [CrossRef]


| Countries | Production | GDP PPP | Type of Economy | |||||||
|---|---|---|---|---|---|---|---|---|---|---|
| Oil | Gas | Coal | All | USD Billion, 2020 | Growth Rate 1990–2019 (%) | Rate of Increase 1990–2019 (%) | ||||
| I | II | III | ||||||||
| Mtoe | Mtoe | Mtoe | Mtoe | |||||||
| The United States | 74.42 | 856.23 | 63.93 | 994.59 | 21,433.23 | 27.82 | 259.43 | |||
| The Russian Federaion | 55.95 | 665.79 | 42.5 | 764.24 | 4315.44 | 27.53 | 263.29 | |||
| China | 19.52 | 157.49 | 368.96 | 545.97 | 23,547.03 | 4.74 | 2011.23 | |||
| Iran | 13.72 | 216.01 | 0.1 | 229.83 | 1070.68 | 37.91 | 163.76 | |||
| Canada | 26.79 | 164.86 | 5.18 | 196.83 | 1898.87 | 29.39 | 240.31 | |||
| Australia | 1.61 | 125.01 | 49.94 | 176.57 | 1324.17 | 22.34 | 347.72 | |||
| Saudi Arabia | 54.48 | 88.28 | 0 | 142.76 | 1677.38 | 31.05 | 222.01 | |||
| Indonesia | 3.9 | 59.11 | 58.48 | 121.49 | 3332.1 | 16.78 | 495.94 | |||
| Norway | 7.9 | 106.54 | 0.02 | 114.46 | 363.54 | 21.49 | 365.41 | |||
| India | 3.84 | 27.68 | 74.47 | 106 | 9556.76 | 10.98 | 810.7 | |||
| Algeria | 6.42 | 81.43 | 0 | 87.85 | 516.52 | 34.49 | 189.92 | |||
| United Arab Emirates | 18.24 | 56.39 | 0 | 74.64 | 683.52 | 23.33 | 328.57 | |||
| Egypt | 3.14 | 62.69 | 0 | 65.83 | 1230.88 | 16.94 | 490.48 | |||
| Malaysia | 2.92 | 59.77 | 0.35 | 63.04 | 944.56 | 13.01 | 668.35 | |||
| Kazakhstan | 9.01 | 40.26 | 11.65 | 60.92 | 508.5 | 26.59 | 276.08 | |||
| Uzbekistan | 0.24 | 53.67 | 0.4 | 54.31 | 246.33 | 20.76 | 381.67 | |||
| Nigeria | 9.91 | 40.22 | 0 | 50.14 | 1075.69 | 18.23 | 448.67 | |||
| Argentina | 3.04 | 42.66 | 0 | 45.7 | 1033.45 | 22.71 | 340.3 | |||
| United Kingdom | 5.15 | 35.89 | 0.22 | 41.25 | 3237.46 | 36.75 * | 172.13 * | |||
| Brazil | 14.55 | 23.63 | 0.61 | 38.79 | 3181.87 | 31.38 | 218.66 | |||
| Mexico | 9.38 | 23.41 | 1.01 | 33.79 | 2608.65 | 26.01 | 284.52 | |||
| Kuwait | 14.43 | 17.98 | 0 | 32.41 | 216.09 | 27.39 ** | 265.16 ** | |||
| Netherlands | 0.11 | 30.3 | 0 | 30.42 | 1031.48 | 27.73 | 260.65 | |||
| Thailand | 1.81 | 26.86 | 1.41 | 30.09 | 1337.41 | 18.23 | 448.43 | |||
| South Africa | 0.51 | 0.9 | 26.42 | 27.83 | 761.82 | 31.02 | 222.41 | |||
| Colombia | 4.6 | 12.58 | 8.25 | 25.43 | 786.81 | 21.09 | 374.22 | |||
| Ukraine | 0.26 | 19.08 | 2.65 | 22 | 560.55 | 67.63 | 47.87 | |||
| Venezuela | 5.84 | 15.37 | 0.07 | 21.28 | 506.34 *** | 37.23 *** | 168.63 *** | |||
| Germany | 0.32 | 5.83 | 13.23 | 19.38 | 4644.17 | 33.21 | 201.13 | |||
| Poland | 0.16 | 5.16 | 11.23 | 16.55 | 1296.59 | 18.14 | 451.38 | |||
| Types of the Risk | The Name of the Risk | Type of Influence | Event Probability: High (> 60%), Medium (20–60%), Low (<20%) | Degree of Influence: Weak (<0.2), Medium (0.2–0.6), Strong (>0.6) | |
|---|---|---|---|---|---|
| R1. Political | P1 | Sanctions | Indirect | High | 0.5 |
| P2 | Nationalization of the industry | Direct | Medium | 0.8 | |
| P3 | Weakening the system of globalization | Direct | High | 0.7 | |
| R2. Sociocultural | S4 | Shortage of human resources | Direct | High | 0.9 |
| S5 | Insufficient popularization of energy-saving production and consumption | Direct | High | 0.8 | |
| S6 | Emergencies (spread of epidemics, viruses, etc.) | Indirect | High | 0.95 | |
| S7 | Growing and aging of the population | Indirect | Medium | 0.8 | |
| S8 | Crisis of city-forming coal enterprises | Direct | Medium | 0.7 | |
| R3. Economic | E9 | The volatility of the prices of the energy | Direct | High | 0.9 |
| E10 | Price dumping | Direct | Medium | 0.6 | |
| E11 | Power consumption | Direct | High | 0.9 | |
| E12 | Financial crises | Direct | High | 0.9 | |
| R4. Legal | L13 | Changes in tax legislation | Indirect | Medium | 0.7 |
| L14 | Environmental regulation | Direct | High | 0.8 | |
| R5. Technological | T15 | Lack of developed energy infrastructure | Direct | High | 0.8 |
| T16 | Deterioration of the quality characteristics of hydrocarbons | Direct | High | 0.9 | |
| T17 | Growth of hard-to-recover reserves | Direct | High | 0.9 | |
| R6. Environmental | E18 | Growth in carbon footprint | Direct | High | 0.8 |
| E19 | Environmental pollution | Direct | High | 0.9 | |
| R7. Commercial | K20 | Access to loans | Direct | High | 0.8 |
| K21 | Investments | Direct | High | 0.8 | |
| Type of the Risk | Questions |
|---|---|
| R1 | 1. What is the likelihood that sanctions related to access to foreign technology will be imposed in the next 10–15 years? |
| 2. What impact do the sanctions have on the growth of hydrocarbon consumption? | |
| 3. What is the likelihood of stagnation in the development of the oil and gas sector due to the nationalization of the industry? | |
| 4. How strong is the impact of industry nationalization on the development of the fossil fuel sector of the Russian energy sector? | |
| 5. What will be the share of operating expenses in the oil market until 2035? | |
| R2 | 1. What will be the shortage of human resources in the energy sector until 2035? |
| 2. How does the lag of the education system and production trends affect the competencies of university graduates? | |
| 3. How is the growing demand for energy related to the popularization of energy-efficient production and consumption? | |
| 4. What is the impact of the spread of epidemics. viruses. etc. on long-term plans for environmental programs? | |
| 5. How does the spread of epidemics, viruses, etc. affect the transition to electric vehicles? | |
| 6. What is the impact of the spread of epidemics, viruses, etc. on the transition to renewable energy sources? | |
| 7. What is the probability of an increase in the share of the working-age population by 2035? | |
| 8. What is the probability that coal exports to the Asia-Pacific region will decrease by 2035? | |
| 9. How does the coal industry’s slow improvement in environmental friendliness and efficiency affect job losses in Russia’s single-industry towns? | |
| R3 | 1. Will the trend of outstripping supply in the hydrocarbon market over demand continue until 2035? |
| 2. What is the impact of energy price volatility on the capital and operating costs ofmajor energy producers? | |
| 3. How does the use of energy price dumping affect the geopolitical situation in the world? | |
| 4. Will global oil demand peak by 2035? | |
| 5. How will the demand for oil change if primary energy consumption continues to increase? | |
| 6. How will epidemics, viruses, etc. affect investment in large long-term projects with high maintenance costs? | |
| 7. Should the government be expected to invest in short- and long-term projects through government economic incentives/programs? | |
| R4 | 1. Should we expect state support for new petrochemical projects in Russia? |
| 2. Should we expect new programs/tax incentives to stimulate domestic manufacturers of equipment and technology? | |
| 3. Should we expect the development of the LNG market in Russia? | |
| 4. What is the relationship between publicly available greenhouse gas emissions reporting by large industrial companies and the investment attractiveness of these companies? | |
| R5 | 1. What effect does the deterioration of the energy infrastructure have on the speed of adoption of information and digital technologies? |
| 2. How does the deterioration of the energy infrastructure affect electricity tariffs? | |
| 3. What impact will the formation of petrochemical clusters have on the development of the petrochemical market? | |
| 4. What new risks will emerge due to the growth of hydrocarbon production costs? | |
| R6 | 1. How does the need to reduce the carbon footprint affect the growth of LNG market share? |
| 2. How do possible import duties for companies with high carbon footprints affect Russian exports? | |
| 3. Should we expect innovative state programs for industrial waste disposal before 2035? | |
| R7 | 1. Will the impact of the coronavirus affect the deterioration of the quality of credit portfolios of large industrial exporting companies in Russia? |
| 2. What will be the investment activity of foreign capital in the long term until 2035 on the Russian markets? |
| Negative | Positive | Conservative | |
|---|---|---|---|
| P1 | 1. Decrease in crude oil production by 4% (from 83 million barrels per day to 80 million barrels per day) 2. Lack of access to foreign technologies for the implementation of new projects 3. Lack of technological capabilities to stimulate production at existing fields | 1. Adaptation to new conditions 2. Search for new partners (projected growth of crude oil production of 2%) (from 83 million barrel/day to 84.66 million barrel/day) 3. Development of our own technologies | 1. Interruptions in the supply of energy resources 2. Maintaining the existing production volumes at the expense of already prepared deposits 3. Possible decrease in crude oil production by 2% to 81.34 million barrels per day |
| P2 | 1. Imbalance in ownership (100% is either in private hands or in the hands of the state) 2. Adoption of subjective decisions aimed at meeting the needs of an exclusively specific copyright holder 3. Stagnation or regression of the oil and gas sector is likely in both technological and economic terms | 1. Balance of ownership (45% in the hands of the state) 2. Most decisions are made by private companies under partial control of the state. 3. High rate of development of the NG industry | 1. Minor imbalance in ownership (60% in the hands of the state) 2. Most of the decisions are made by private companies under strict partial control of the state. 3. Insignificant losses in economic and technological development of the sector |
| P3 | 1. Decline in the share of OPEC: less than 45% in the market 2. Market volatility fluctuations in oil prices (from negative values to USD 5.00/barrel) and gas (less than USD 1.6/million BTU) 3. Price dumping-subsidized oil consumption | 1. OPEC share up to 65% in the market 2. Consolidation of interests of companies in the fuel and energy complex 3. Containment of oil prices at USD 45.00/barrel | 1. OPEC share up to 60% in the market 2. More new players enter the market (USA, Brazil, Canada, Norway) 3. Saturation of the market with cheap energy sources (shale oil, Canadian bituminous oil) 4. Containment of oil prices at USD 25.00–35.00 per barrel |
| S4 | 1. Lagging education system 2. Decrease in labor productivity 3. The disappearance of old professions (up to 60 specialties) 4. Retraining of 10% of company employees (up to 31% of a thousand people leave for a new job due to their unwillingness to change) | 1. Retraining of more than 60% of employees of oil and gas companies 2. Cooperation of enterprises and universities 3. Wide information availability 4. Labor productivity growth5. The disappearance of up to 200 old professions. but the emergence of new professions | 1. Increasing the attractiveness of jobs due to the introduction of a center for additional professional education 2. Retraining up to 35% of employees 3. Growth in labor productivity with a significant increase in operating expenses for the production of raw materials |
| S5 | 1. Growth of energy losses up to 30% due to the lack of a modern system of organizational and legal management mechanism 2. Decrease in labor productivity 3. Growth of injury risk at production facilities4. Growth of demand for energy resources (unfounded consumption) | 1. Reducing dependence on imported equipment and technologies 2. Growth of investments in energy saving by 2% of GRP annually 3. Progress in introducing energy-efficient thinking into society 4. Decrease in demand for energy resources | 1. Stagnation of the energy intensity of GDP (over the past 10 years, the energy intensity of the RF GDP decreased by only 9%. In the last 4 years, the energy intensity of GDP did not decrease) 2. Development of systems for stimulating personnel to efficient consumption based on digital technologies |
| S6 | 1. Sharp decline in demand for hydrocarbons by 20% 2. An abnormal drop in oil prices to negative values for the first time in 30 years 3. Serious threat to long-term action on climate change 4. A sharp decline in demand for renewable energy5. Suspension of the life of megalopolises; conservation of production processes | 1. Temporary reduction in global carbon dioxide emissions (250 million tons CO2, 18% below normal levels) 2. Reducing the load on the transport infrastructure 3. Introduction of government packages of economic stimulus that will invest in clean energy technologies and contain the economic crisis 4. Maintaining demand for renewable energy at the level of 2020 | 1. Reducing the demand for renewable energy up to 55% 2. Provisional focus on short-term economic incentives instead of long-term clean technologies 3. The economic crisis slows down the growth rate 4. Sustainability of the gas industry compared to other fuels |
| S7 | 1. Decrease in fertility rates of 2.5 children per woman in 2019 to 1.5 in 2050. 2. The able-bodied population will be less than 78% by 2050 3. Regional and transcontinental migration 4.5% of skilled engineers are going to retire in the next 10 years | 1. Steady growth in the global standard of living 2. Growth of the working-age population up to 85% 3. Growth in average world life expectancy by about 15% 4. Growth of potential for implementation and mastering of new technologies | 1. A slight decrease in fertility from 2.5 children per woman in 2019 to 2.2 in 2050 2. Growth of the working-age population up to 80% 3. Growth in average life expectancy by 10% (77 years in the world on average) |
| S8 | 1. Reduction of jobs in more than 30 monotowns with a population of up to 110 thousand people 2. Falling demand and price volatility with a decrease in coal exports to Europe and China (50% of the 2019 export volume) 3. Restrictions on exports to the countries of the Asia-Pacific region | 1. Growth of exports to the Asia-Pacific region by an average of 0.65%/year (13% by 2040) 2. Development of related industries (coal chemistry, mechanical engineering, metallurgy) 3. The volume of investments by 2035 will amount to 2.5–3.5 trillion rubles 4. Tax revenues will grow by 2.6 times | 1. Growth of exports to the Asia-Pacific region by an average of 0.4%/year (8% by 2040) 2. Modernization of coal generation facilities 3. Raising the level of industrial safety and improving working conditions, creating digital competence centers 4. Improving the environmental friendliness and efficiency of the coal industry |
| E9 | 1. Decrease in momentary values of oil prices below USD 5.00/barrel 2. Decrease in gas price below USD 1.6/million BTU 3. Decrease in world demand for oil by 10–11 million barrels per day with an increase in supply by 5–6 million barrels per day 4. Decrease in the average annual rate of world GDP growth by 2.4% 5. Capital and operating expenses are 6–7 times higher than oil prices for the largest producers | 1. Maintaining the price at USD 40.00/barrel 2. Decrease in world demand for oil by 10–11 million barrels per day with a mutual decrease in supply by 5–6 barrels/day, supply exceeds demand by no more than 10% 3. Decrease in the average annual rate of world GDP growth by 0.5% 4. Costs for capital and operating expenses are commensurate with oil prices for the largest producers | 1. Decrease in oil prices below USD 22.00/barrel 2. Supply exceeds demand by no more than 25% 3. Economic and industrial imbalance in the short term3. Decrease in average annual rates of world GDP growth from 0.5% to 2.5% 4. Costs for capital and operating expenses are 2–3 times higher than oil prices for the largest producers |
| E10 | 1. Competitors of the Russian Federation and the United States offer oil at a price of about USD 25.00 per barrel, which is a huge discount compared to the price of other producers 2. Increase in oil production by 25% (by 12.3 million barrels per day) by Saudi Arabia-increasing competition and ensuring artificial monopolization of oil markets 3. Loss of exports in Saudi Arabia5. Crowding out unsubsidized energy sources | 1. Maintaining a unified policy of price regulation of oil prices 2. Reducing the sharp increase in oil production to 3%/day in order to maintain anti-crisis oil prices 3. Without subsidies, oil and gas exporters will still have a comparative advantage in the energy sector since a low-cost base can provide a consistently low domestic price | 1. Sharp reduction of oil production increase to 7%/day to support anti-crisis oil prices 2. The impact of the pricing reform on energy consumers can be significantly mitigated if the reform is combined with enhanced energy efficiency measures with significant financial and environmental benefits 3. Decrease in the price for the business of largest oil companies in the Russian Federation: USD 20.00/barrel |
| E11 | 1. Primary energy consumption will increase by 30% by 2040 2. The growth in demand for oil will be 17% and will reach 4.9–5 billion tons by 2040 3. Natural gas consumption will increase by 40%–55% by 2040. 4. Demand for electricity will increase by 60% by 2040 5. Decrease in demand for renewable energy sources. The share of the new generation will increase by 1.5 times. 6. Demand for coal will peak until 2025 | 1. Consumption of primary energy will increase by no more than 10% by 2040 2. Decrease in demand for oil to 20% which will reach 3.2 billion tons. by 2040 3. Renewable energy generation will increase 5–6 times by 2040. 4. Energy strategy of the Russian Federation forecasts LNG production up to 120–140 million tons in 2035 | 1. Consumption of primary energy will increase by no more than 25% by 2040 2. Growth in electricity consumption by 2035 by 1.18–1.25 times to 1380 billion kWh 3. Generation of renewable energy sources will increase 2.5 times 4. Growth in natural gas consumption: the share of which in world energy consumption in the period until 2040 will grow from 22% to 27% |
| E12 | 1. Decrease in the average annual growth rate of world GDP by 2.4% 2. Hyperinflation (growth rate over 50%) 3. Mothballing production at large fields with expensive maintenance 4. Reduced investment in short-term and long-term projects | 1. Increase in the average annual growth rate of world GDP by 3.3% 2. Moderate inflation (8%–10%) 3. Maintaining investments in short-term and long-term projects at the expense of the state economic incentives | 1. Decrease in the average annual growth rate of world GDP from 0.5% to 2.5% 2. Moderate inflation (10%–15%) 3. Reduced investment in long-term projects |
| L13 | 1. Tightening the tax regime for mature fields 2. Introduction of value-added taxes (VAT), which depends on the financial result of the project. If it proves its viability, it will be introduced to a greater number of mature fields | 1. Providing loans at low interest rates to oil and gas producers who face declining oil prices due to the epidemiological situation 2. Target system of tax incentives in the form of VAT refunds (5%–13%), tax holidays, customs subsidies, and negative excise taxes on raw materials 3. Subsidizing the procurement of new equipment and technologies. support for investment projects | 1. State support for new projects in the petrochemical industry. incentives for equipment and technology manufacturers. incentives for large-scale products 2. Tax incentives for new fields with high water cuts |
| L14 | 1. As a result of the lack of clear values of MPC (maximum permissible concentration) of oil products in the soil, the process of taking corrective measures to reclaim damaged areas is complicated 2. Tightening the decarbonization policy forcibly reducing greenhouse gas emissions | 1. Monitoring and reporting of large industrial and energy enterprises with an annual emission of greenhouse gases of 150 thousand tons in terms of carbon dioxide (CO2 equivalent) and more 2. Economic incentives for the utilization of associated petroleum gas by gradually increasing fees for negative impact on the environment | 1. Decarbonization policy by keeping the growth of the global average temperature within 1.5‒2 °C 2. Between 2020 and 2025, state regulation of emissions will be implemented for greenhouse gases 3. Conditions were created to stimulate the implementation of projects aimed at reducing greenhouse gas emissions and their absorption |
| T15 | 1. Depreciation of energy infrastructure will approach 75% by 2040 2. The required investments exceed the existing ones by 42 thousand billion rubles (21%) 3. Decreased reliability of the hydrocarbon transportation process 4. In the Russian Federation, up to 19,000 accidents annually due to the use of outdated low-efficiency equipment | 1. Depreciation of the energy infrastructure can reach 35% 2. The required investments exceed the existing ones by 13 trillion rubles (7%). 3. Reduction of the number of accidents when using worn-out equipment by 2–3 times 4. Implementation of virtual power plants: long-term tariff agreements The launch of training for new personnel ready to work in the digital power grid complex | 1. Depreciation of the energy infrastructure can reach 48% 2. The required investments exceed the existing ones by 28 trillion rubles (17%) 3. The tariff burden will continue to increase. taking into account inflation by 12% annually |
| T16 | 1. Decrease in product quality 2. Depreciation of production assets-the risk of the impossibility of updating (a large share of technological imports) 3. Low bandwidth of hydrocarbon transportation facilities | 1. Formation of petrochemical clusters (from extraction to the production of end products with high added value) 2. Development of the ethylene and olefins market (creation of transport infrastructure-ethylene pipelines and railway transport-infrastructure mortgage) 3. Using cycling technology in the gas market | 1. Increasing the depth of oil refining (up to 90%). Increasing the yield of light oil products (up to 74%) 2. Completion of the program of modernization of oil refineries 3. Reducing operating costs at refineries through the use of digital technologies 4. Expansion of production and consumption of NGV fuel 5. Development of the unified gas Supply system, construction of auxiliary LNG infrastructure 6. Increase in LNG production by 5 times or more 7. Creation of LNG clusters8. Slight growth in demand for methanol up to 2% per year |
| T17 | 1. Increase in the cost of hydrocarbon production 2. Significant increase in the costs of exploration and production 3. Increased risks associated with the need of additional capital investments | 1. Growth of the latest production technologies (Russian reserves of heavy and high-viscosity oils are estimated at 5–7 billion tons) 2. In-depth development of existing traditional oil fields using production intensification methods | 1. The peak of production of traditional light oils will be reached already in 2030 2. Stagnation of technologies for the production of heavy and bituminous oil with huge reserves |
| E18 | 1. By 2030, the number of carbon dioxide emissions in the world can reach 40 gigatons 2. Global warming by 3.5 °C 3. In the Russian Federation, the growth of greenhouse gas emissions from 1.6 billion tons of CO2 eq. to 2.4 billion tons of CO2 eq. by 2030 | 1. Reducing the intensity of carbon dioxide emissions due to energy efficiency and an increase in the share of renewable energy sources 2. Growth of the share of LNG as an alternative to fuel oil by 5% per year by 2035 (reduction of SOx, NOx, and particulate matter emissions) 3. In the Russian Federation, the increase in the intensity of emission growth from 1.6 billion tons of CO2 eq. to 1.9 billion tons of CO2 eq. by 2030 and a decrease to 1.6 billion t eq. by 2050 | 1. Expansion in the market of the gas and the LNG continues and LNG demand is expected to increase by 3.6% per annum until 2035 2. In the Russian Federation, the growth of greenhouse gas emissions from 1.6 billion g of CO2 eq. to 2.07 billion tons of CO2 eq. CO2 by 2030 |
| E19 | 1. Infiltration of wastewater up to 40% of the oil that got into reservoirs settles to the bottom in the form of bottom sediments 2. Significant decline in biodiversity and, more importantly, soil fertility 3. Forest fires4. Increasing the sorption capacity of coal | 1. Introduction of energy-saving technologies, reduction of energy losses 2. Increasing the volume of waste processing, reclamation of the largest landfills, utilization of methane 3. Production and use of products with high energy efficiency class 4. Protection of forests from fires and pests, reduction of clear felling | 1. Prevention of accidents and their consequences 2. Filtration of contaminated wastewater at the stage of drilling operations 3. Reclamation of contaminated land in the northern regions4. Introduction of modern technologies of oil production |
| K20 | 1. In 2020, a slowdown in consumer demand growth is expected (to 0.6% after 1.0% in 2019) driven by a slowdown in consumer credit growth 2. Against the backdrop of the COVID-19 pandemic, the banking sector is facing a deterioration in the quality of loan portfolios of both corporate and retail borrowers | 1. Suspension of the key rate cut cycle 2. Development of lending within the framework of state programs, rates for which are in the range of 2%–5% | 1. A significant reduction in foreign currency lending (86.2% of total capital at the beginning of 2020 versus 113% as of September 2008) 2. Slowdown in the growth rate of the portfolio of consumer loans.3. Rapid decline in the key interest rate |
| K21 | 1. Investment in fixed assets can be reduced by 5%–8% | 1. By 2024, an increase in investment by 7.5 trillion rubles. That is, in fact, an increase in the volume of 50% compared to the current situation 2. Implementation of large investment projects at the expense of instruments (public–private partnership, territories of advanced social and economic development, special investment contracts, protected investment programs, etc. | 1. A break in the activity, but key players will continue their investment activity, focusing on “safe” markets 2. In addition to the volatility of exchange rates during the second and third quarters of 2020, investment activity will also be affected by the inability to physically visit assets 3. Markets that are dependent on foreign capital may face a decline in investment activity |
| Name of Program | Preventive Measures | |
|---|---|---|
| 1 | Efficient energy |
|
| 2 | High cost of production |
|
| 3 | Oil and gas chemistry |
|
| 4 | Recycling and disposal |
|
| 5 | Energy workforce |
|
| 6 | Digital infrastructure |
|
| 7 | Transparency in the environment |
|
| 8 | Raising financing of the energy infrastructure |
|
| 9 | Carbon footprint |
|
Publisher’s Note: MDPI stays neutral with regard to jurisdictional claims in published maps and institutional affiliations. |
© 2021 by the authors. Licensee MDPI, Basel, Switzerland. This article is an open access article distributed under the terms and conditions of the Creative Commons Attribution (CC BY) license (https://creativecommons.org/licenses/by/4.0/).
Share and Cite
Zhukovskiy, Y.L.; Batueva, D.E.; Buldysko, A.D.; Gil, B.; Starshaia, V.V. Fossil Energy in the Framework of Sustainable Development: Analysis of Prospects and Development of Forecast Scenarios. Energies 2021, 14, 5268. https://doi.org/10.3390/en14175268
Zhukovskiy YL, Batueva DE, Buldysko AD, Gil B, Starshaia VV. Fossil Energy in the Framework of Sustainable Development: Analysis of Prospects and Development of Forecast Scenarios. Energies. 2021; 14(17):5268. https://doi.org/10.3390/en14175268
Chicago/Turabian StyleZhukovskiy, Yuriy Leonidovich, Daria Evgenievna Batueva, Alexandra Dmitrievna Buldysko, Bernard Gil, and Valeriia Vladimirovna Starshaia. 2021. "Fossil Energy in the Framework of Sustainable Development: Analysis of Prospects and Development of Forecast Scenarios" Energies 14, no. 17: 5268. https://doi.org/10.3390/en14175268
APA StyleZhukovskiy, Y. L., Batueva, D. E., Buldysko, A. D., Gil, B., & Starshaia, V. V. (2021). Fossil Energy in the Framework of Sustainable Development: Analysis of Prospects and Development of Forecast Scenarios. Energies, 14(17), 5268. https://doi.org/10.3390/en14175268