Article

Optimization of Thermal Management System with Water and Phase Change Material Cooling for Li-Ion Battery Pack

1
Department of Mechanical Engineering, Korea Maritime & Ocean University, 727 Taejong-ro, Yeongdo-gu, Busan 49112, Korea
2
School of Material Engineering, Shanghai University of Engineering Science, 333 Longteng Road, Songjiang, Shanghai 201620, China
*
Author to whom correspondence should be addressed.
Energies 2021, 14(17), 5312; https://doi.org/10.3390/en14175312
Submission received: 30 July 2021 / Revised: 19 August 2021 / Accepted: 24 August 2021 / Published: 26 August 2021
(This article belongs to the Section D2: Electrochem: Batteries, Fuel Cells, Capacitors)

Abstract

:
The cooling structure of a battery pack and coupled liquid cooling and phase change material (PCM) were designed in a thermal management system to enhance the cooling performance and extend the service life of lithium-ion battery packs. Numerical simulations were conducted based on the finite volume method. This study focuses on factors such as the layout of the terminal, flow rate of the coolant, different sections of the cooling pipe, position of the cooling pipe, and coupled liquid cooling, and investigates their influences on the operating temperature. The results show that a reasonable terminal layout can reduce heat generation inside the batteries. The appropriate flow rate and position of the cooling pipe effectively reduced the maximum temperature and minimized energy consumption. Then, the PCM was placed between the adjacent batteries near the outlet to enhance the uniformity of the battery pack. The temperature difference was reduced to near 5 K. This study provides a clear direction for improving the cooling performance and extending the service life of battery packs.

1. Introduction

Recently, environmental issues and alternatives to fossil fuels have gained increasing attention globally. Lithium-ion batteries (LIBs) are considered promising candidates to store energy, owing to their high specific energy density, high discharge voltage, long cycle life, lack of memory effect, low self-discharge rate, and fast charge capability [1,2]. They are now widely used in electric vehicles (EVs) and consist of a battery pack. Operating temperature has a prominent influence on LIB performance; the optimal operation temperature range for LIBs is 20–40 °C [3]. It is essential that the thermal management system (TMS) maintains the optimal working temperature to achieve excellent performance in all climates. It should also remove the excess heat dissipated during operation. Moreover, the performance of the battery pack has a bucket effect; this prevents the occurrence of excessively high or low temperatures in a single cell in the battery pack, which may cause overall battery pack failure. The TMS can guarantee a uniform battery temperature in the battery pack. Without this, thermal runaway or even fire accidents may occur. Hence, the numerical simulation of LIBs is essential for optimizing the TMS to enhance battery pack performance.
The TMS can be divided into air, liquid, a phase change material (PCM), and any combination of these, according to the category of the heat transfer medium. Although air cooling is the simplest and cheapest solution, it is restricted for use in EVs, owing to its low specific heat capacity, which leads to a large temperature difference in the battery pack [2]. Liquid cooling comprises both direct and indirect cooling solutions. In the direct method, the coolant contacts the cell surfaces and dissipates heat by conduction during operation; however, the leakage of coolant must be considered to prevent a short circuit. As a solution, mineral oil is regarded as a coolant, and it can avoid the short-circuit limitation. However, its specific heat capacity is low, and its viscosity is relatively large; this results in high external energy consumption and a more complex coolant circuit system. For indirect cooling, there is a jacket between the cells and coolant, and it is widely employed in EVs compared with the former method [4]. The temperature stability, large latent heat, simple structure, and low consumption are promising merits of the PCM; thus, they can be used in the TMS to maintain the cell temperature within the appropriate range [5,6]. The PCM may completely melt if it is implemented as an insulator with long-term continuous operation. Removing heat becomes increasingly difficult, and the temperature of the battery pack will continue to rise, which may lead to the risk of thermal runaway. An assisted cooling mode is essential to maintain the enduring effectiveness of the PCM-based TMS. Mehdi et al. [7] integrated a PCM with heat-sink air cooling to cool the battery pack. The results exhibited good thermal performance, especially for a long working time in an appropriate temperature range under a reasonable air velocity of 3.2 km h−1. Wang et al. [8] used the combination of an oscillating heat pipe and a PCM to cool the battery pack. The experimental results indicated that the TMS enables the system to maintain an even temperature and a lower average temperature.
In the abovementioned methods, liquid cooling can decrease the maximum temperature during the working period; however, the temperature difference resulting from these methods is larger than that of other methods. A large temperature difference may cause the LIB capacity to fade, which shortens the service life of the battery pack [9]. The PCM can mitigate this limitation to obtain better temperature dispersion results. Some studies have reported the use of TMS-coupled PCM and liquid cooling [10,11,12], which cannot address the battery temperature issues under high-rate implementation.
The aim of this study is to solve the issues of long-term operation under high-rate discharge conditions. The cooling system combined liquid cooling and a PCM is designed to enhance cooling performance. The cooling channels are arranged at the main heat-producing area to dissipate most of the heat over time. The PCM is distributed around the batteries and can reduce the temperature difference in the battery pack. The purpose of this study is to propose a design for battery pack cooling.

2. Materials and Methods

2.1. System Description

The system presented in this study is a sub-module of a battery pack. First, the appropriate layout of the tab terminal is chosen to mitigate the ohmic heat caused by this part of the system. The active material can be fully used, owing to its feasible layout design. A small 1P3S battery pack was selected to explore the effect of the terminal location, which can well illustrate the issue. Figure 1 presents four terminal layouts, which were executed at a constant power of 200 W. Second, the optimal position of the cooling pipe and the fluid velocity were established, as shown in Figure 2. Then, two types of cooling pipe sections were studied to investigate which would decrease the maximum temperature. In this study, round and square sections were selected. The 1P7S battery pack was regarded as the research object to optimize liquid cooling because its high-power discharge is more in line with practical situations. In this case, the two pipes are arranged near the terminal, and the optimal position was determined by changing the distance between the two pipes. Finally, the liquid cooling and PCM were coupled to enhance the uniformity of the battery temperature. The PCM is distributed near the terminals, which not only serves as a cooling medium but also improves the mechanical strength of the battery pack. Liquid cooling can prevent the PCM from playing an insulator role when it completely melts.

2.2. Lithium-ion battery (LIB) Reaction Mechanism

In the discharge–charge processes, the working principle of LIBs focuses on the insertion and extraction of lithium ions in positive and negative materials. The LIB electrochemical reaction can be illustrated by the following equations [1,13]:
x L i + + x e + L i 1 x M O 2 L i M O 2
L i x C n n C + x L i + + x e
L i 1 x M O 2 + L i x C n L i M O 2 + n C ,
where M represents many types of metal elements, such as Mo, Ni, and Fe.

2.3. Heat Generation Model

Heat generation is determined by establishing a competing model to simulate the temperature variation of the prismatic battery under operation because internal heat generation influences the temperature distribution. Therefore, it is essential to adopt a reasonable heat generation mechanism. Despite the various categories of electrode materials, such as lithium iron phosphate and lithium nickel cobalt manganate, the heat generation principle remains consistent. Newman et al. [14] proposed the thermal model shown in Equation (4) to illustrate heat generation:
q = I ( V U ) + I T d U d T + C P d T d t ,
where q is the rate of total heat generation,   I is the total current in the circuit, V is the terminal voltage, U is the open circuit voltage, T is the battery temperature,   C P is the heat capacity of the battery, and t is time.
In Equation (4), the term I ( V U ) represents the irreversible heat, including the ohmic heat and polarization heat expressed as q i r , and I T d U d T is the reversible electrochemical reaction heat. C P d T d t is the internal energy change; thus, a simplified equation is obtained as follows:
q = I ( V U ) + I T d U d T ,
where V and U need to be solved in the simulation process with a suitable coupled electrical-thermal model. The resistance thermal model was employed to compute the heat generation during operation.
η p = Φ 1 , p Φ 2 , p U e , p
η n = Φ 1 , n Φ 2 , n U e , n
where η p and η n represent the positive and negative electrode overpotentials, respectively, which represent the difference between the electrode potential and its equilibrium potential under a current density. Φ 1 denotes the solid phase potential, and Φ 2 is the liquid-phase electricity. U e is the equilibrium electrode potential, and the subscripts p and n refer to the positive and negative electrodes, respectively.
The decrease in potential that occurs in the solid and liquid phases can be simplified to the relationship of the linear battery ohmic resistance:
( Φ 1 , p Φ 1 , n ) + ( Φ 2 , p Φ 2 , n ) = I R o
where R o is the ohmic resistance in battery.
Thus, q i r can be indicated as follows:
q i r = I ( V U ) = I 2 R o + I ( η p η n )
where ( η p η n ) is caused by the polarization resistance, owing to the overpotential; therefore, it can be expressed by the polarization resistance R p :
η p η n = I R p .
According to Equation (10), Equation (9) can be modified as follows:
q i r = I 2 ( R o + R p ) .

2.4. Lithium-Ion Battery (LIB) Heat Transfer Model

Heat transfer can occur via three methods: conduction, convection, and radiation. LIBs have an operating temperature of less than 60 °C, and this amount of radiation heat is low; thus, it is neglected in the heat transfer model [15,16]. This study focuses on coupled liquid cooling and the PCM. Thus, the conduction heat transfer primarily comprises dissipated heat in the battery pack. This can be represented by the following expression:
q = h Δ T
where q is the heat flux, h is the conduction heat transfer coefficient, and Δ T is the difference in temperature.
The model needs to be simplified to avoid complex simulations; thus, the electrochemical reaction and heat generation during the discharge process are simplified. The following characteristics were assumed to simplify the simulation:
  • Although the LIB components theoretically have different thermal-physical properties, each LIB is thought to be a homogenous body.
  • The boundary condition between the terminal and cell body is defined as a coupled state to maintain temperature continuity through this section [17].
  • Heat transfer is isotropic in all directions.
  • The flow condition for a melted PCM is not considered.
  • The radiation heat transfer is negligible, owing to the small radiation heat.
  • The heat transfer method at the terminal is defined as free convection.
In the cooling system, an appropriate PCM is selected to enhance the cooling performance. According to existing literature [11], a high-melting-point PCM was adopted, which is essential to improve the cooling effect. Chebyshev polynomials are employed to obtain the precision function of the PCM properties, such as density, dynamic viscosity, thermal conductivity, and specific heat. The maximum temperature of the PCM in its solid state is T solid , the initial temperature of the PCM in its liquid state is T liquid , and it appears as a mushy state between T solid and T liquid . The specific function expressions are shown in Appendix A. The latent heat of the PCM is decided according to the purity and variety of the PCM material. A previous study proposed the optimization of the cooling performance; therefore, the latent of the PCM was selected to be 243.5 kJ/kg [18]. The parameters used in this study are listed in Table 1. The properties of the PCM are changed at different temperatures; therefore, a user-defined function (UDF) was employed using Fluent (ANSYS).

2.5. Numerical Model

Three-dimensional computational fluid dynamics (CFD) was employed to simulate complex systems involving fluid flow based on the finite volume method. ANSYS Fluent is widely used in fluid and heat transfer simulations. There are many cases for reference, and some details are provided for analysis. The double-precision transient model was set to simulate the cooling performance of the battery pack in Fluent 18.
During the simulation, the following energy equations are used [11,17,19,20]:
ρ H t = λ ( 2 H x 2 + 2 H y 2 + 2 H z 2 )
H = h r e f + T r e f T c p c m d T + β L ,
where ρ ,   H ,   and   λ   are the density, enthalpy, and thermal conductivity of the PCM, respectively; h r e f ,   c p c m ,   β ,   and   L   are the enthalpy at the reference temperature, specific heat, liquation fraction, and latent heat of the PCM, respectively.
The value of β is dependent on the melting point of PCM.
β = { 0   T < T s o l i d   0 β 1   T s o l i d < T < T l i q u i d   1   T > T l i q u i d .
Water was used as the coolant that was distributed around the battery in the pipes. The relevant governing equations are presented below.
The energy conservation equation of water:
τ ( ρ w c w T w ) + × ( ρ w c w v T w ) = × ( λ w T w ) .
The momentum conservation equation of water:
τ ( ρ w v ) + × ( ρ w v 2 ) = P .
The continuity conservation equation of water in the pipe:
ρ w τ = × ( ρ w v ) ,
where ρ w ,   c w ,   and   T w are the density, specific heat, and temperature of water, respectively; v   is the velocity of water at the inlet position; and P is the static pressure.
The Reynolds number (Re) was used to describe the flow states of the liquid coolant. The value of Re has a significant influence on liquid cooling performance [21] and is defined as follows:
R e = ρ w v d μ ,
where d is the diameter of the water channel, and μ   is the dynamic viscosity of water. In this study, the maximum flow rate was selected to be 0.20 m/s at the inlet, corresponding to Re = 466, which belongs to the laminar region.

3. Results

The layout of the terminal, flow rate of the coolant, position of the pipe, pipe section, coupled liquid cooling, and PCM were studied. The cooling performance of the battery pack was determined by the maximum temperature and temperature consistency corresponding to the temperature difference. The minimum extra energy consumption was determined to reduce the possibility of thermal runaway in the battery pack.
In the simulation, the convergence criterion was below 1 × 10⁻⁴ for the residual. To achieve solution accuracy, the optimal grid size was determined to save computing resources. Four different grid sizes (2, 1, 0.8, and 0.5 mm) were employed to compare the accuracy of the results. When 0.8 mm was selected, the result showed that the temperature distribution deviation was less than 0.5% compared with that of the 0.5 mm grid size. Therefore, a grid size of 0.8 mm was adopted in the 1P3S battery pack. For the 1P7S battery pack, the grid size was reasonably adjusted on this basis to meet the requirement of calculation accuracy. The initial temperature of the battery pack was the same as the ambient temperature of 300 K for the 1P3S and 1P7S; however, the initial temperature of the water used as coolant was 293.15 K at the inlet.

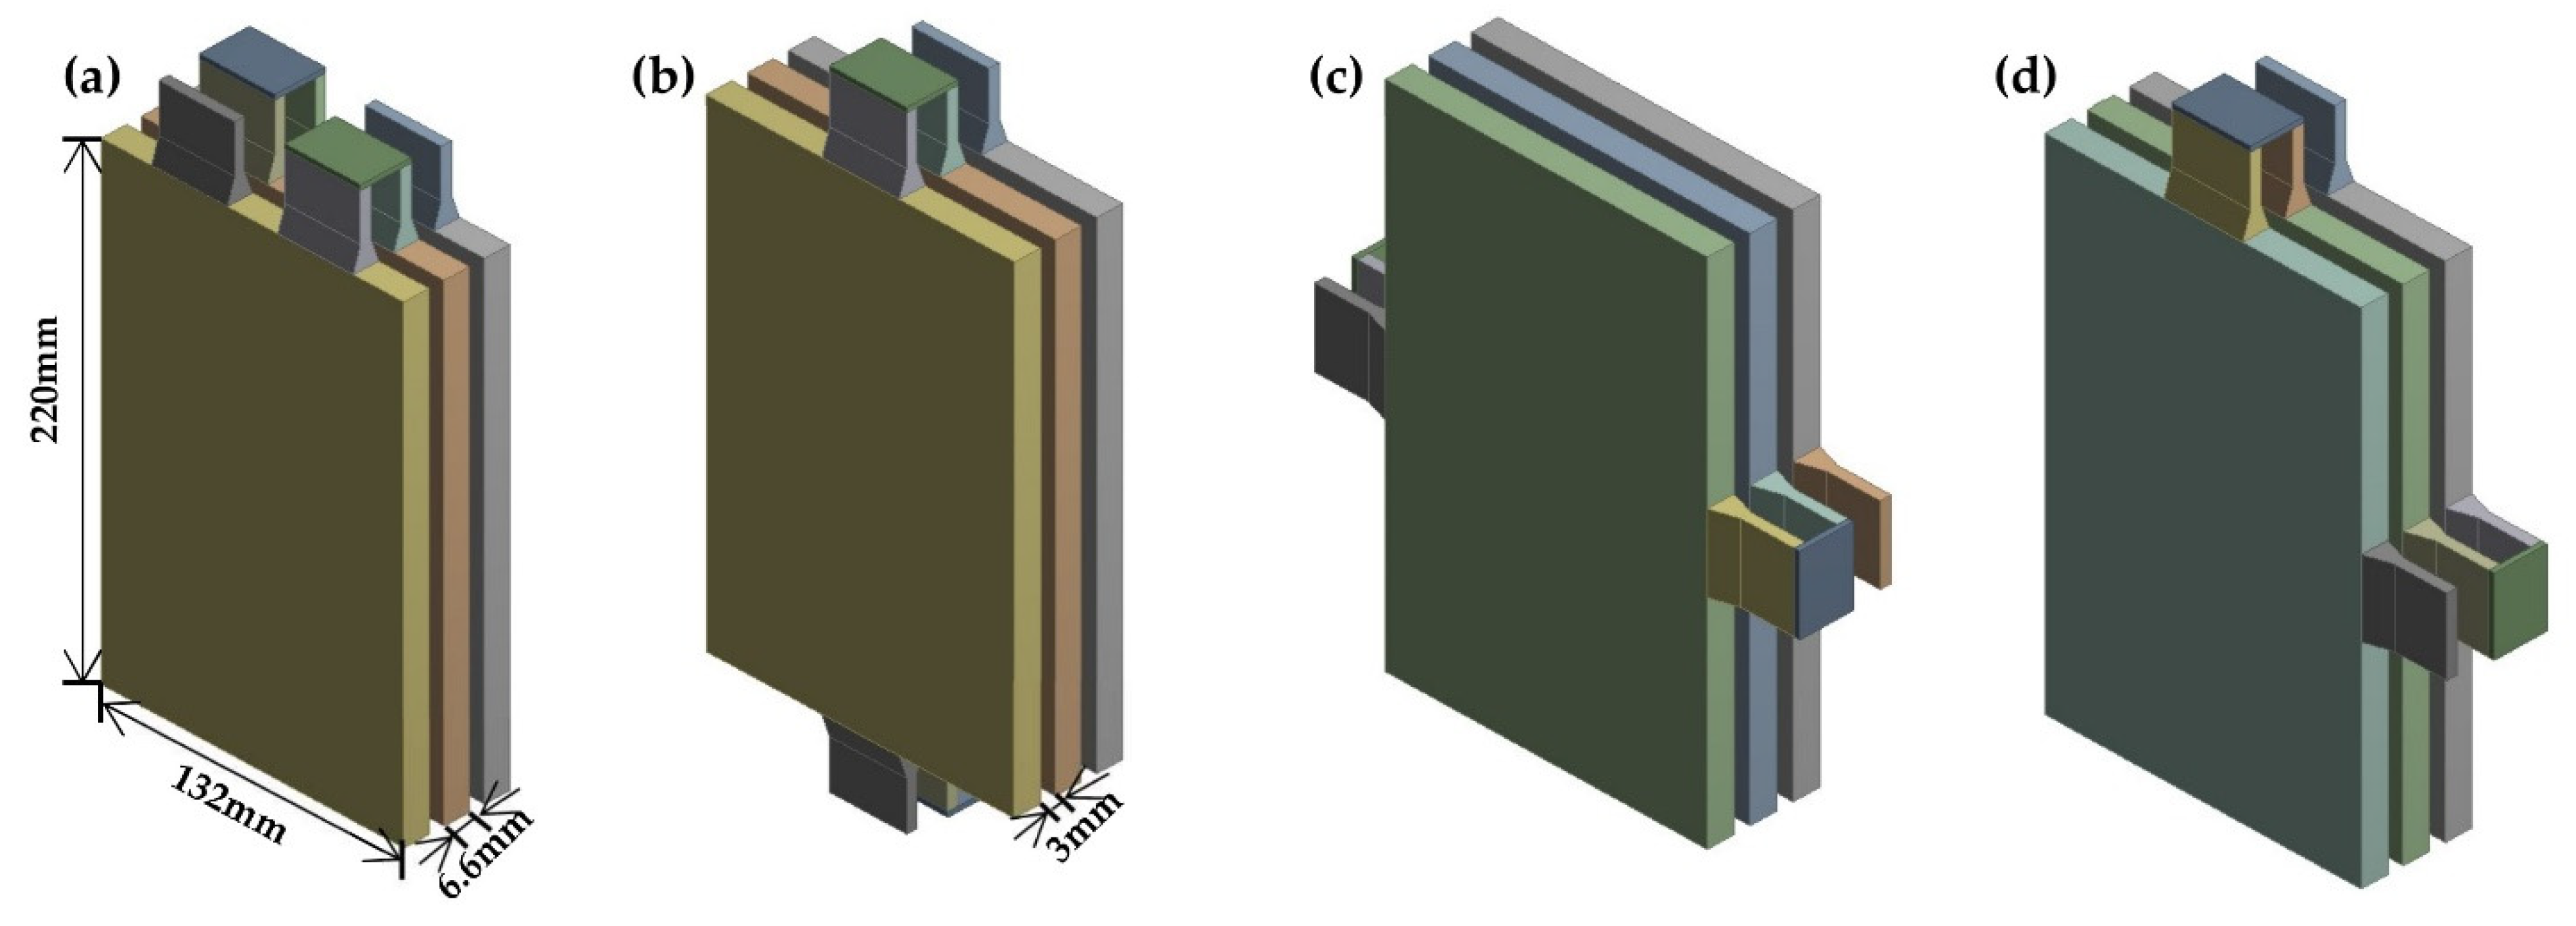
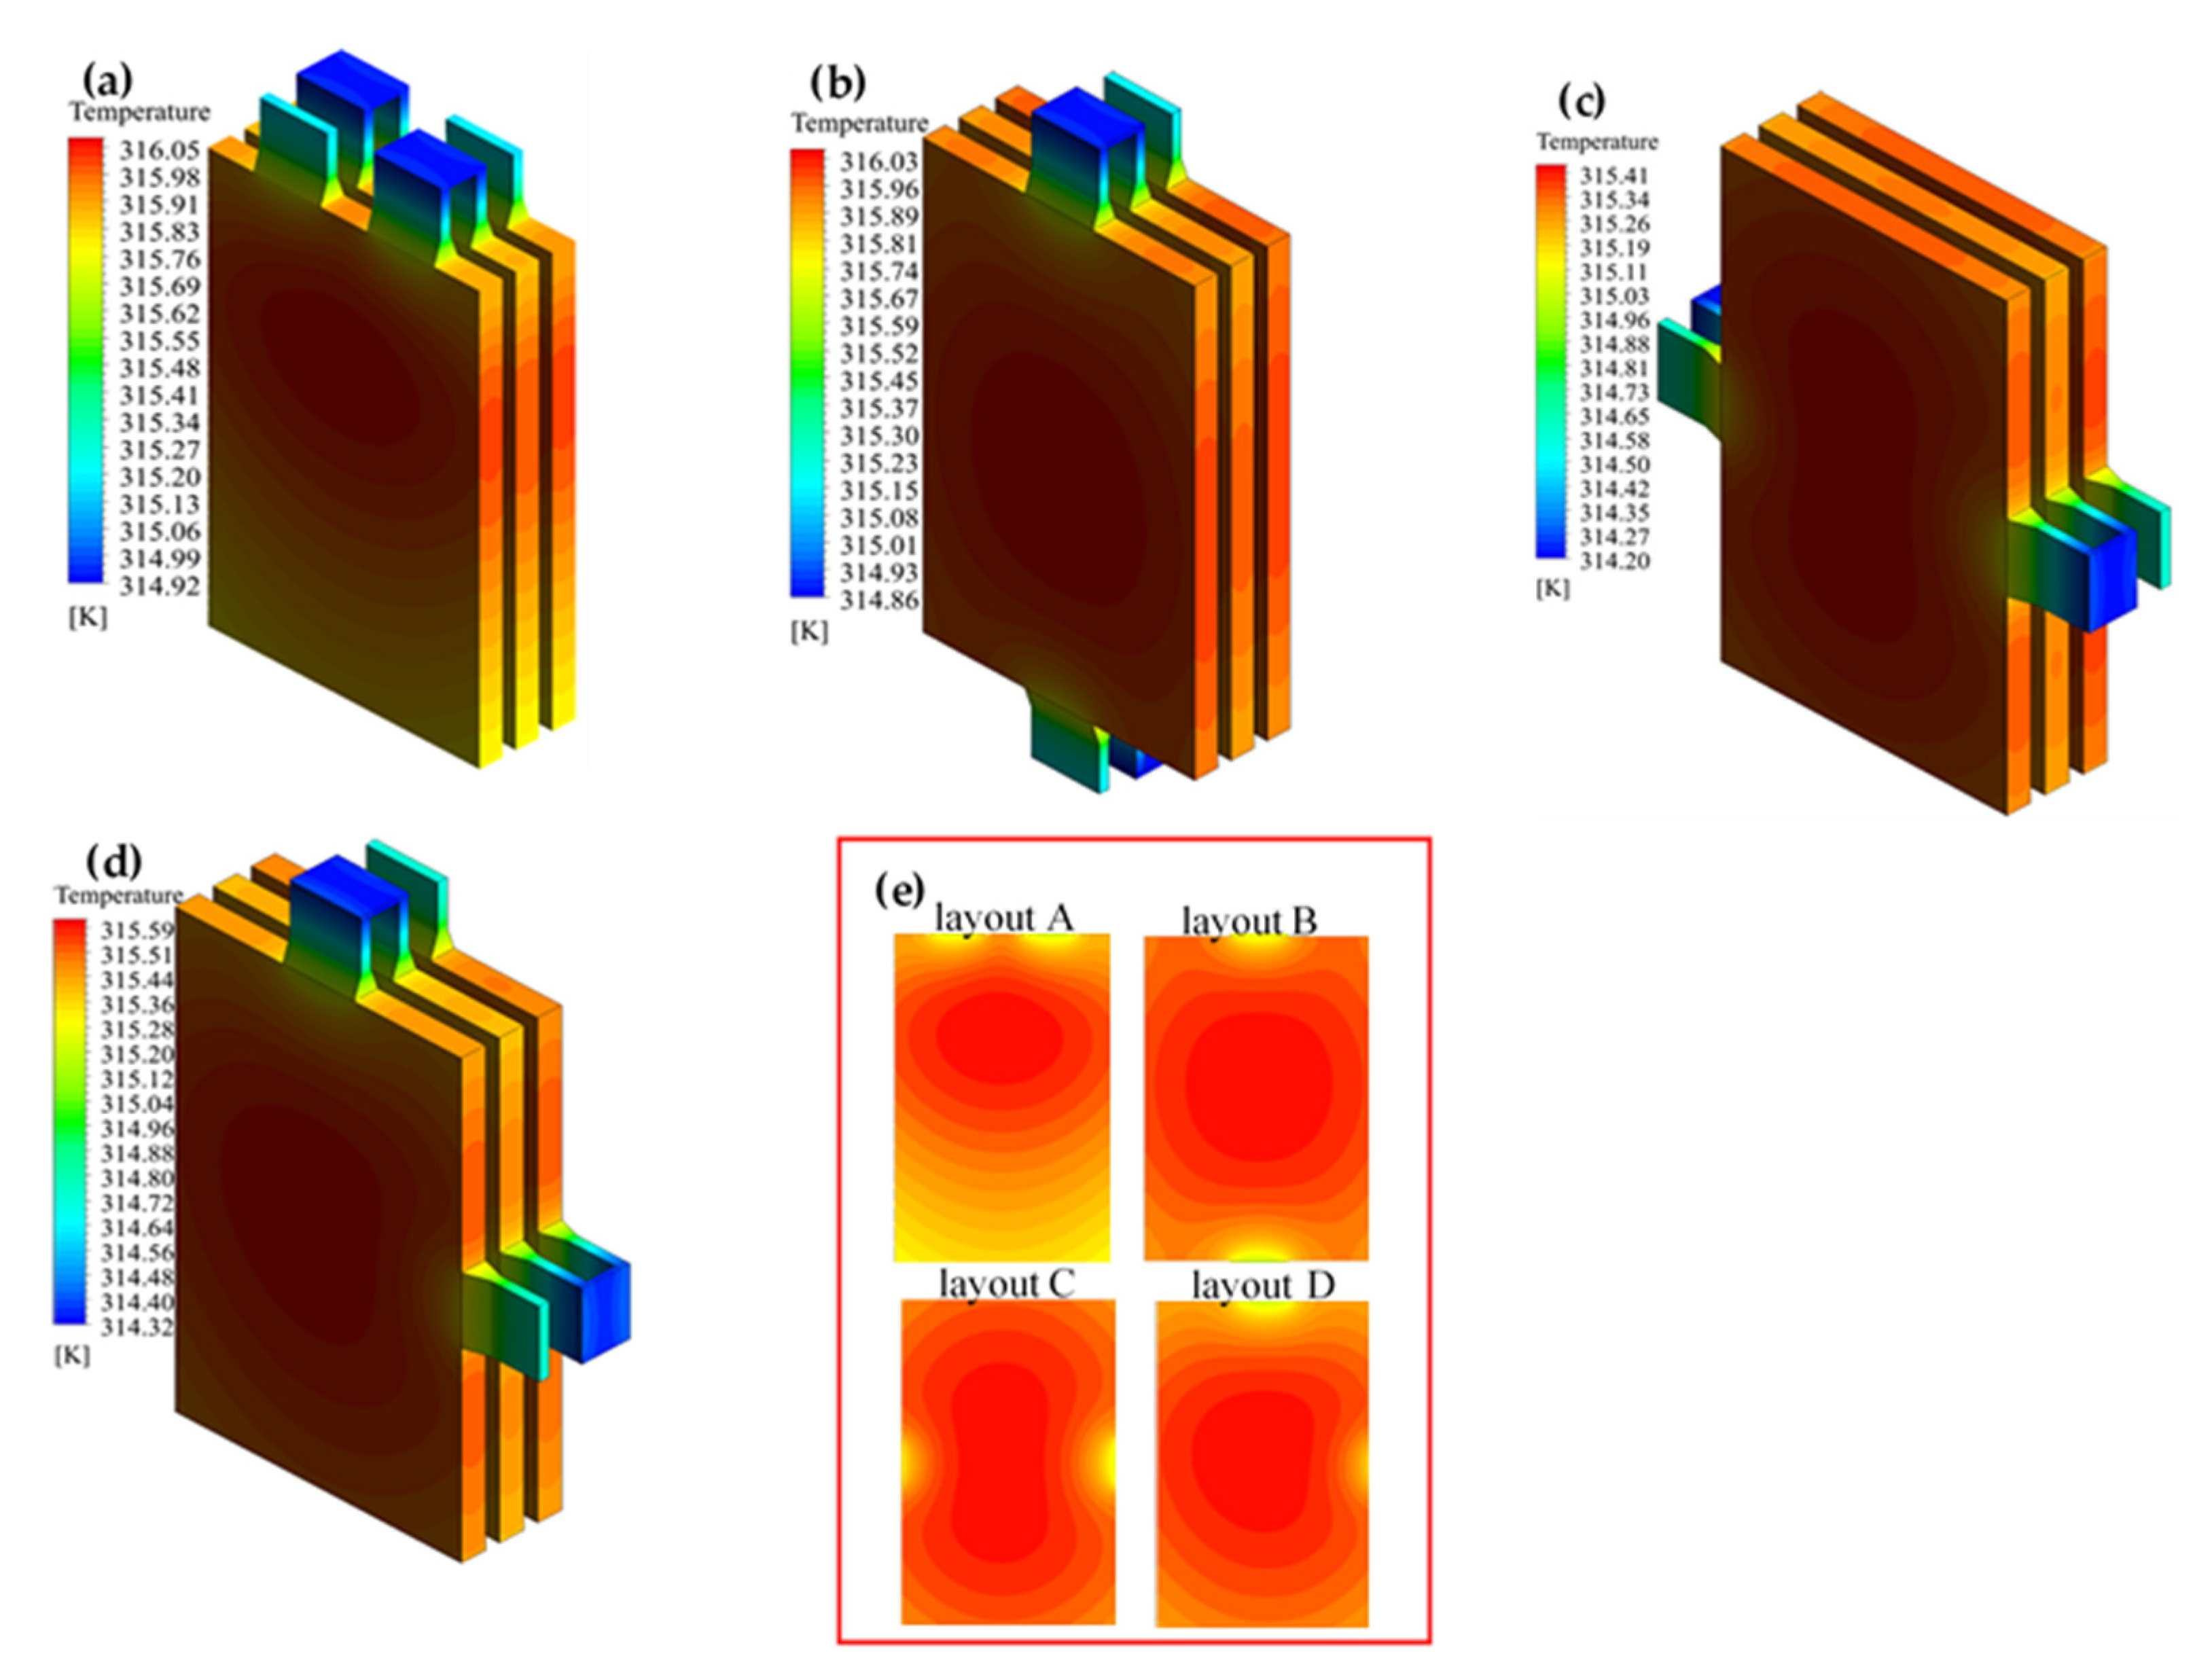
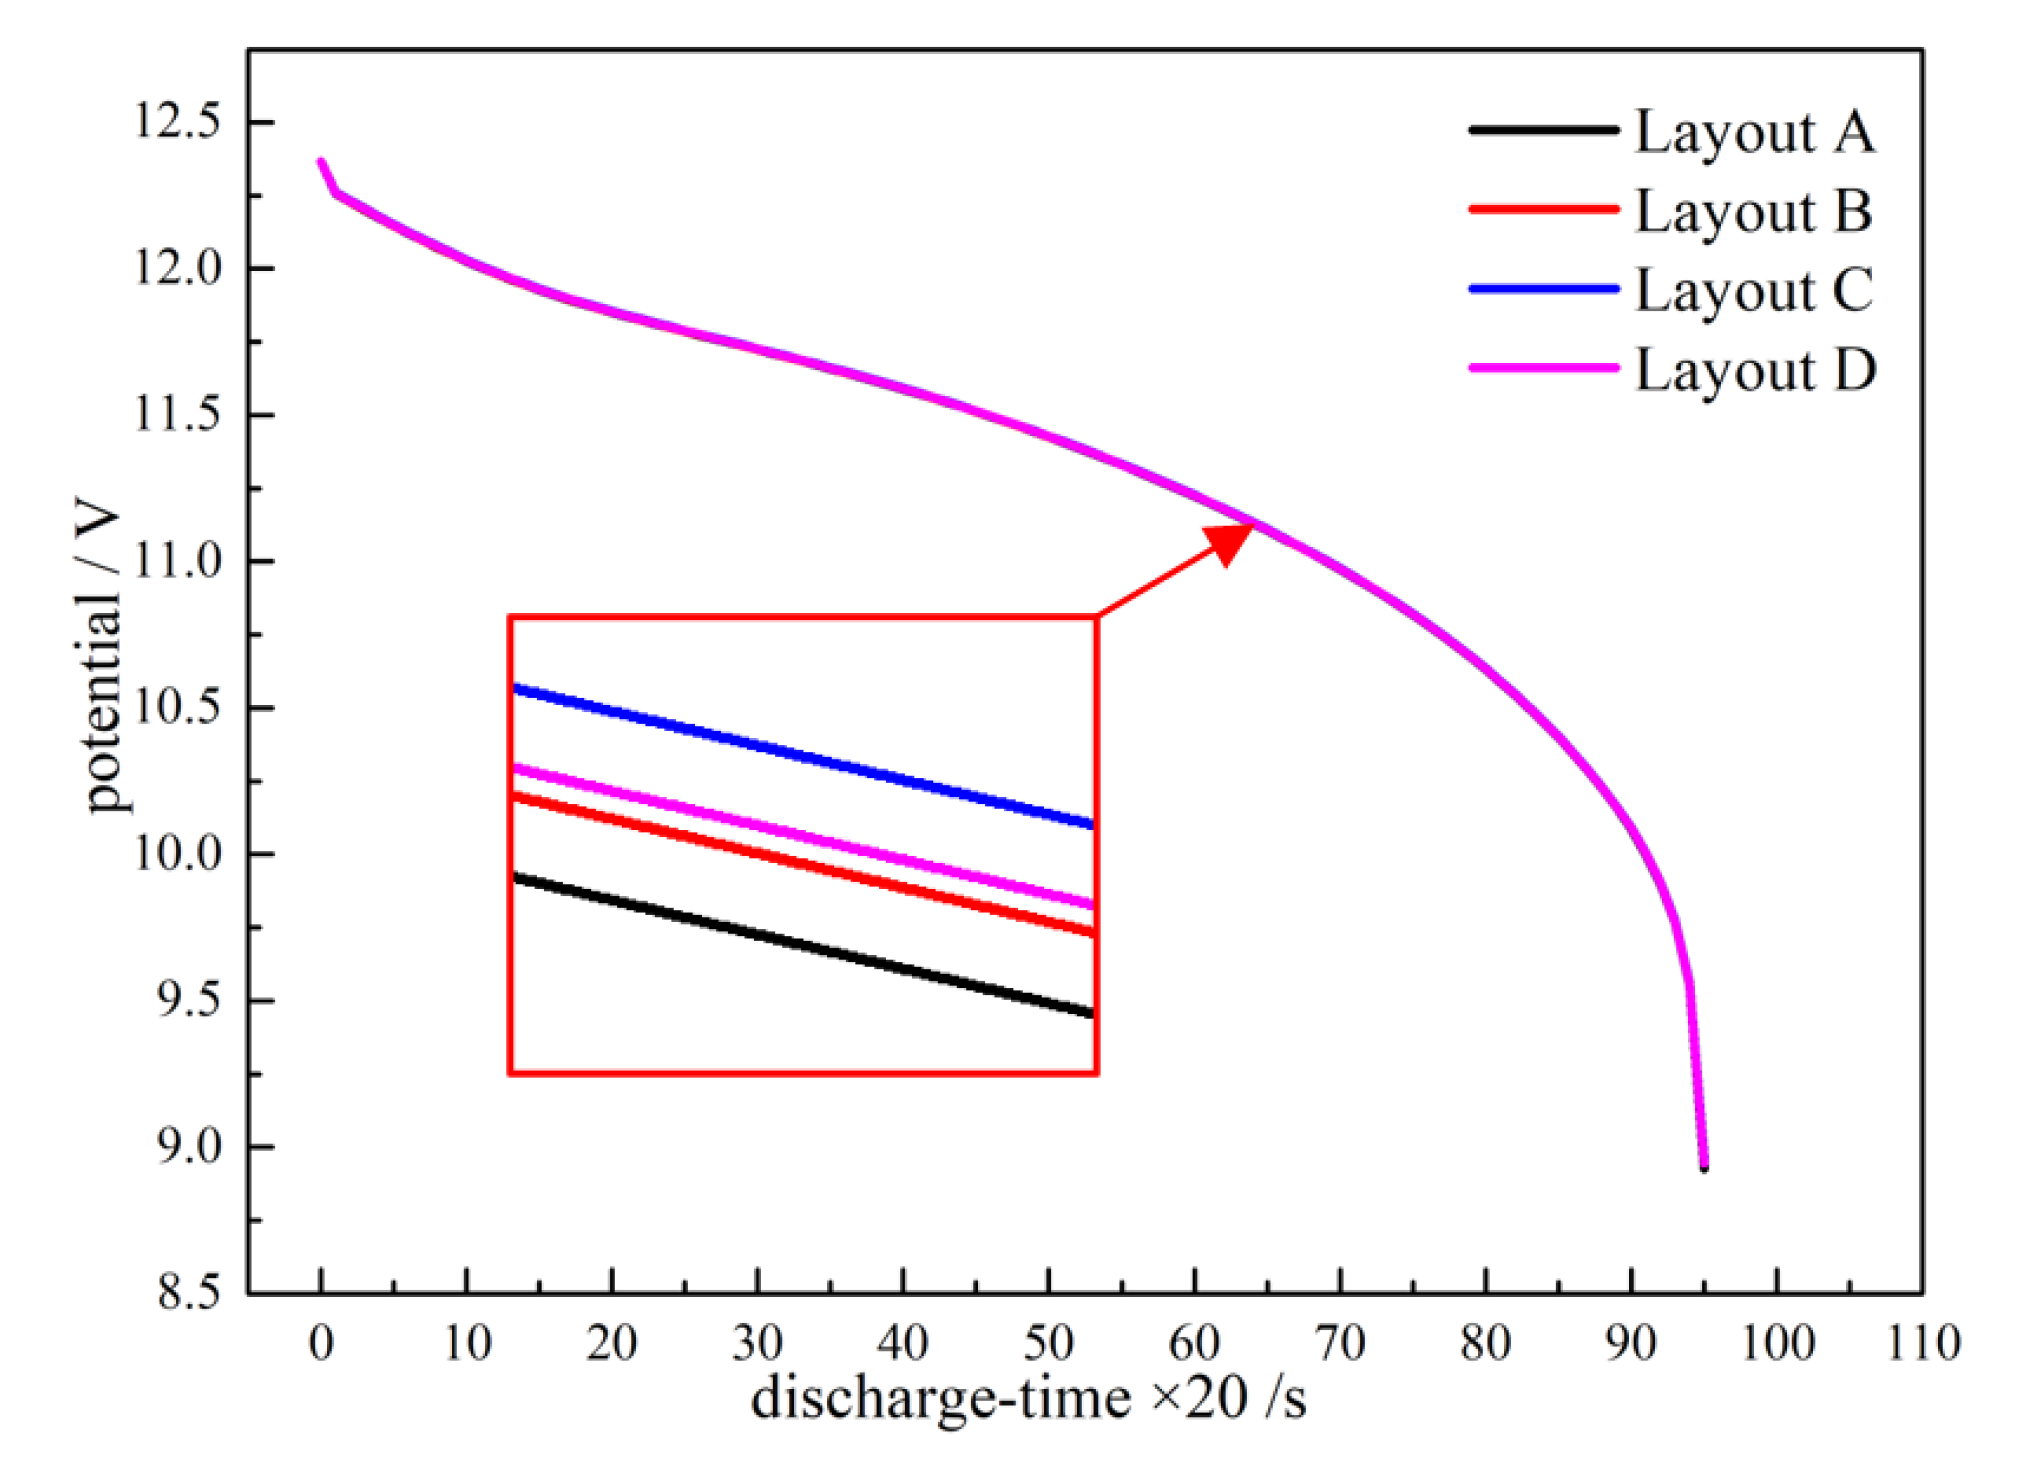
3.1. Effect of Terminal for Heat Generation

The layout of the terminal was changed to four configurations. The 1P3S battery pack was discharged to a minimum stop voltage of 3 V for a single cell under a constant power of 200 W. Figure 3 shows the temperature distributions of the four layouts. It was found that layout C had the lowest maximum temperature among all the configurations, followed by layouts D, B, and A. From Figure 3e, different terminal layouts caused various distributions of the maximum temperature. Moreover, it was observed that layout C had a larger maximum temperature area. This can be interpreted as being more involved in the calculations during the simulation and is equivalent to there being more electrochemically active substances participating in the electrochemical reaction during the charging process. Under the same discharge current density, more active materials that are used can reduce excessive local heat generation. Due to the different layout of the terminals, the current flows different paths inside the battery, so that the utilization of active materials is different. In an electrochemical reaction, more active material support needed ions and electrons to mitigate local heat generation. This can be explained by the change in the internal potential of the battery. The change in the potential curves at the positive tab terminal was determined, as shown in Figure 4. The downward trend of the potential was consistent with the configuration order of the maximum temperature, where the faster the potential downward, the higher the maximum temperature. Terminal layout optimization is of great significance for the stack structure of the entire battery pack for EVs.

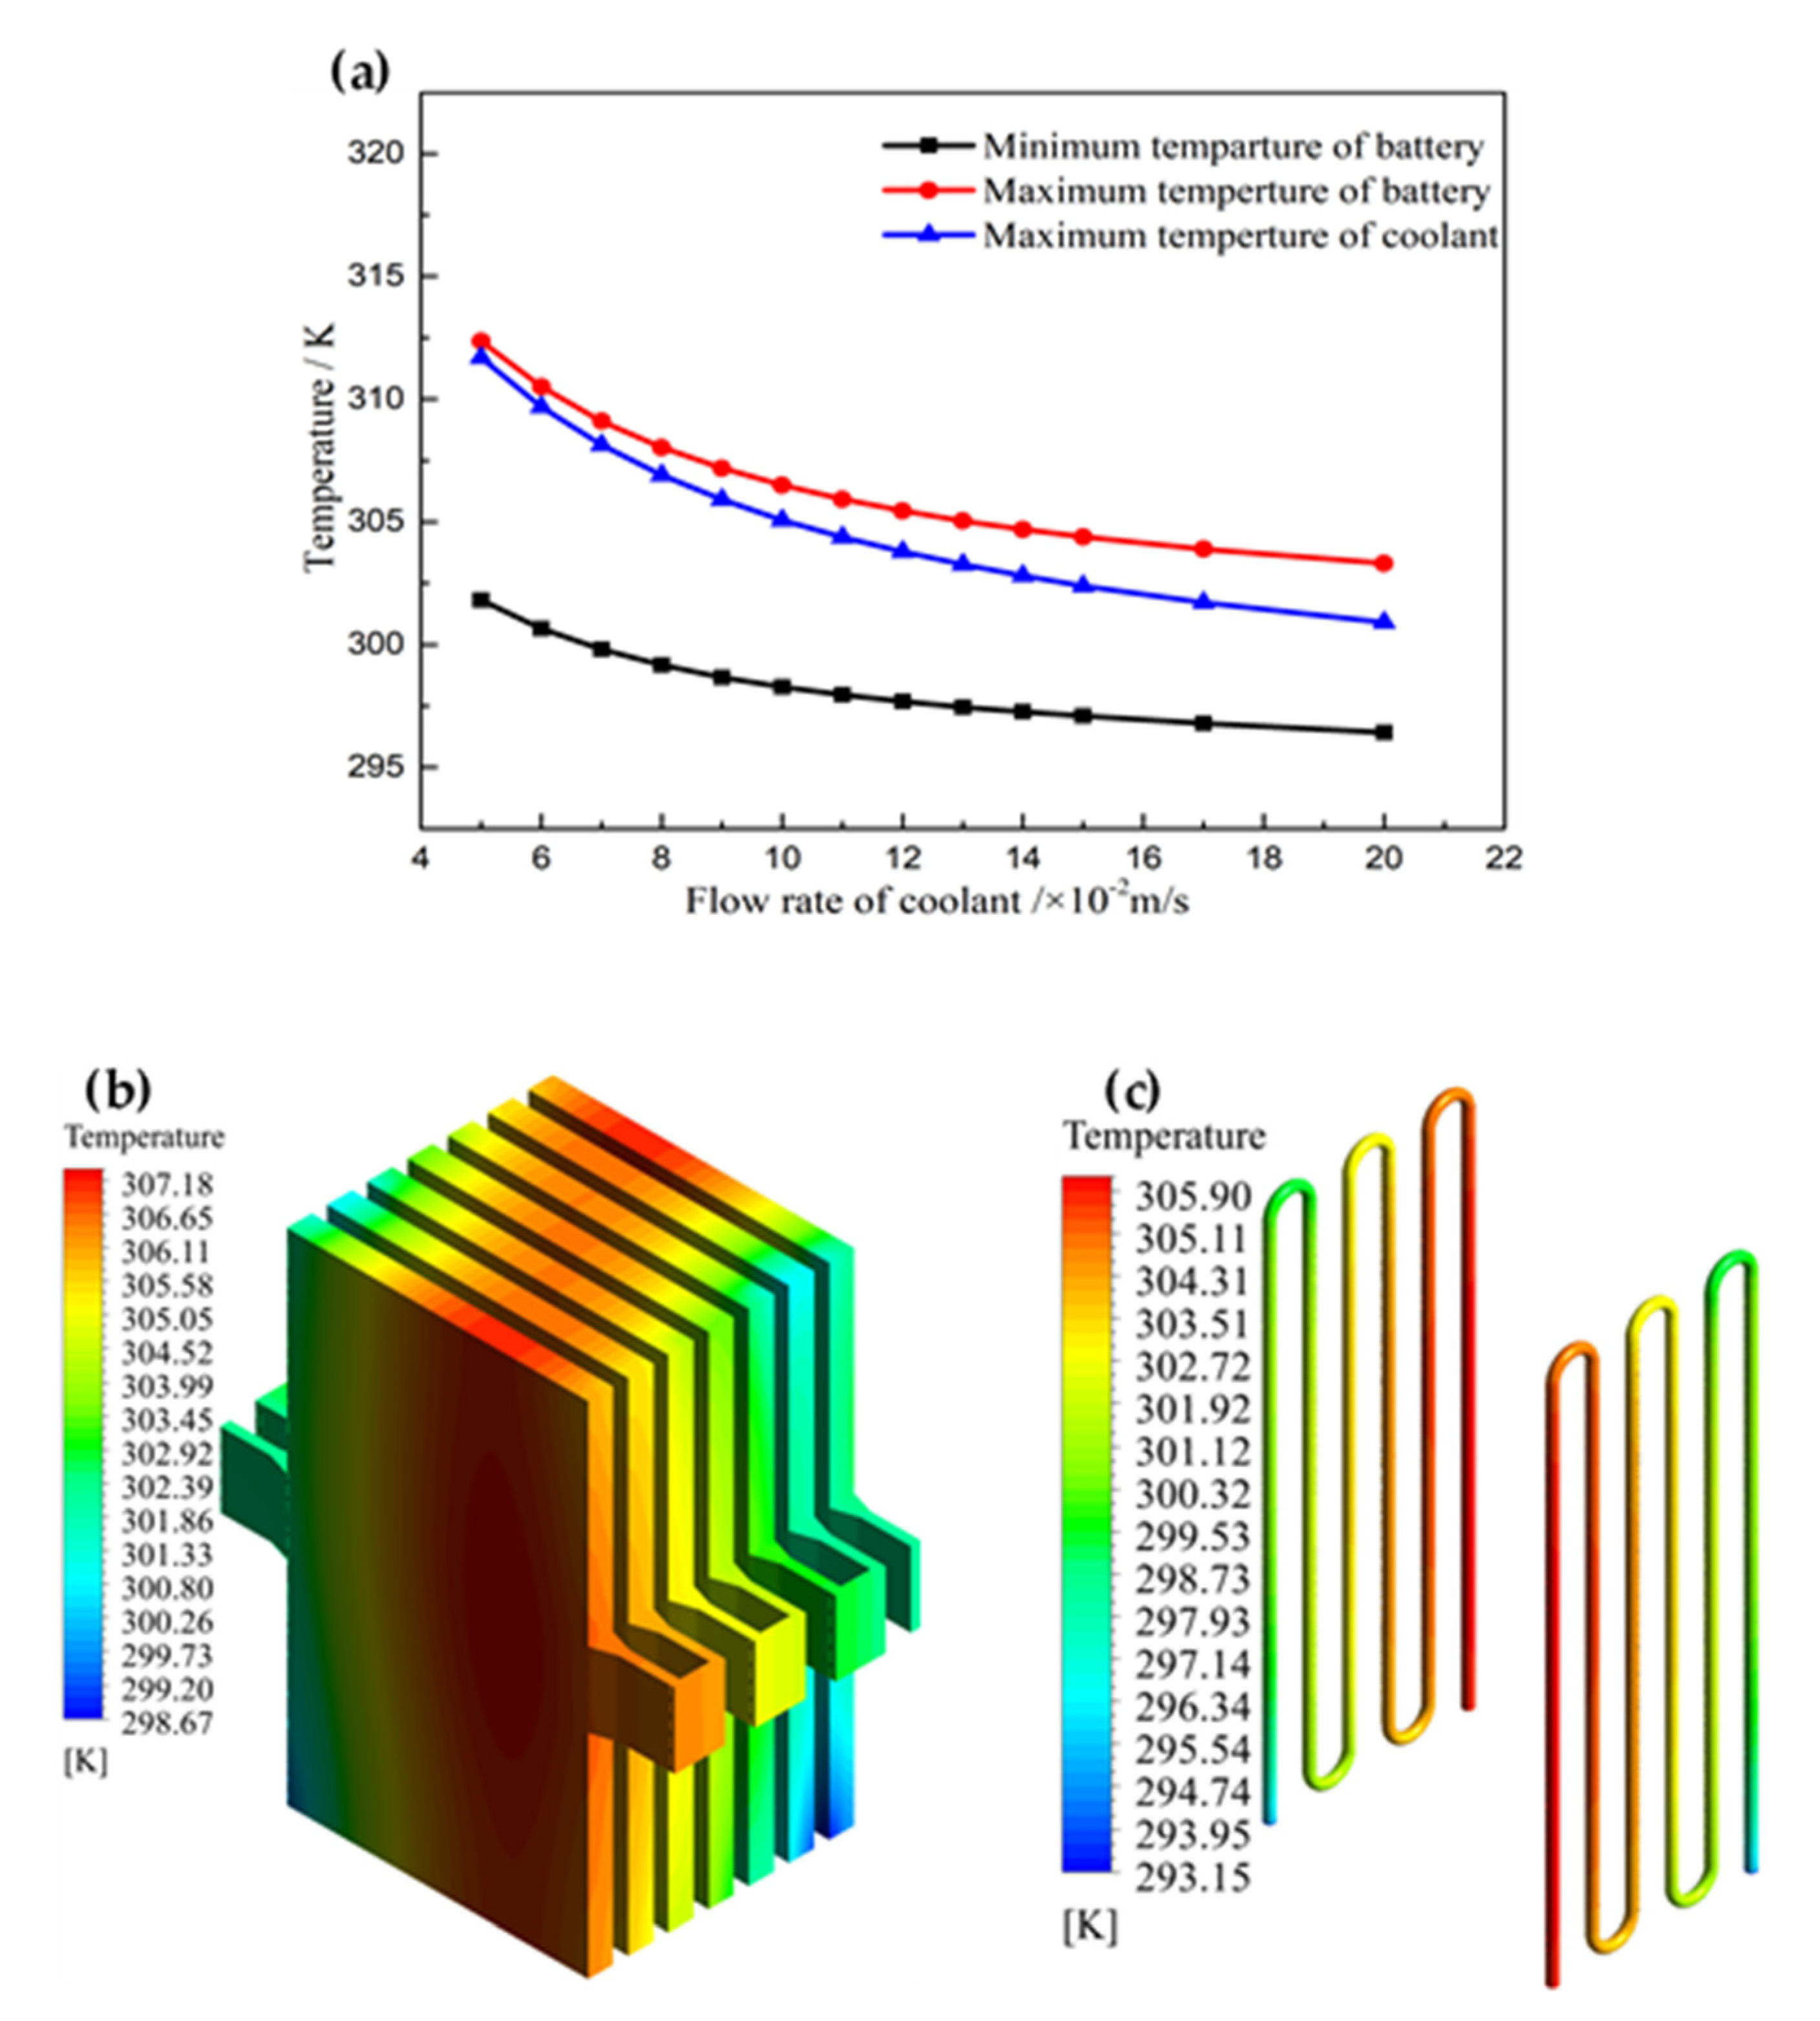
3.2. Effect of Flow Rate of Coolant

The appropriate flow rate not only effectively dissipates heat but can also reduce extra energy consumption. Therefore, a suitable flow rate should be established for different liquid-cooling systems. In this case, a coolant flow rate in the range of 0.05–0.20 m/s was employed, which corresponds to 1.56 × 10⁻⁴ − 4.68 × 10⁻⁴ kg/s. The discharge was to the minimum stop voltage of 3 V under a constant power of 800 W in the 1P7S battery pack. The position of the cooling pipe is shown in Figure 2a. From this, the layouts of the inlet and outlet can be understood to obtain a relatively uniform initial temperature distribution. The battery pack should be operated within the optimal temperature range. The maximum temperature was 312.36 K (39.12 °C), which is nearly 40 °C, at a 0.05 m/s flow rate, as shown in Figure 5a. As the flow rate increased, the slope of the maximum temperature change curve decreased. Figure 5b,c exhibit the temperature distributions of the 1P7S battery pack and cooling pipe, respectively, to show the temperature difference when the flow rate was 0.09 m/s and the maximum temperature was 307.18 K. The deviation of the maximum temperature was 0.25% when the flow rate was changed from 0.09 m/s to 0.1 m/s. The maximum temperature of the cooling water decreased as the flow rate increased. Furthermore, it was observed that the temperature difference increased between the batteries and coolant as the flow rate increased at the maximum temperature, as shown in Figure 5a. It can be inferred that the faster the flow rate, the less heat is dissipated per unit mass of coolant, which leads to a lower utilization of coolant. It was difficult to decrease the temperature difference to less than 5 K, as shown in Figure 5a; hence, the 0.09 m/s flow rate was suitable to maintain the balance of extra energy consumption and cooling performance in this system. In the following section, the 0.09 m/s flow rate is employed in the calculations.

3.3. Effect of Section and Position of Cooling Pipe

Few studies have discussed the influence of the cooling pipe section on cooling performance. Under the condition of the same area and wall thickness, two different sections of the cooling pipe were used, as shown in Figure 2b. The flow rate was 0.09 m/s, and the maximum and minimum temperatures of the 1P7S battery pack were 309.78 K and 297.53 K using the square cooling pipe in Figure 6a, respectively. The temperature difference was larger than that when using a round pipe. The velocity of a point at the same position was determined to obtain a higher velocity using the square pipe. Compared with the former, the square cooling pipe cannot dissipate heat well, owing to the same reason as that for the flow rate. A smooth surface has a higher heat exchange rate. Moreover, the square cooling pipe adds more mass and decreases the mass energy density of the system. Thus, a round cooling pipe is more suitable for this system.
In previous studies, cooling pipes were arranged to obtain a better cooling performance [12,21,22]. A feasible cooling pipe position is helpful in dissipating heat, thereby decreasing the number of pipes. In this section, the structure of the 1P7S battery pack is characterized by symmetry; thus, the two pipes also have symmetry on this basis. The influence of the position of the cooling pipe on the cooling performance was studied for an inlet flow rate of 0.09 m/s. The distance H between the pipes and terminal was set to 0, 5, 10, 15, 20, and 25 mm, as shown in Figure 2c.
The positions of the pipe were set to 0, 5, 10, 15, 20, and 25 mm, which is the distance H between the pipes and terminal. From Figure 6b and Figure 7, it was observed that the maximum temperature was lower (at 306.75 K) for a position of 5 mm compared with that at other positions keeping in line with the reference [23]. The center area had a higher temperature, and with increasing distance, the cooling pipe was surrounded by a higher temperature area; thus, it was not conducive to heat dissipation. Therefore, the cooling pipe was closer to the center, and the cooling performance worsened. From Figure 3f, the cross-sectional view of layout C shows that the cooling pipe was located near the temperature boundary area, which not only removed the heat in the high-temperature area, but also facilitated the dissipation of heat. The coolant temperature exhibited a downward trend at the outlet. This indicates that the cooling efficiency decreased as the distance increased.

3.4. Effect of Coupling the Liquid Cooling and Phase Change Material (PCM)

Liquid cooling played a significant role in decreasing the maximum temperature of the coupled cooling system. The aim of the PCM is to decrease the temperature difference; that is, it can provide a more uniform temperature distribution in the battery pack. The PCM was placed near the high-temperature batteries, as shown in Figure 2c. The melt temperature of the PCM was classified into four groups: 301.6, 302.6, 303.6, and 304.6 K. The UDF function in Fluent was used to adjust the change in the PCM properties at different temperatures. The results are depicted in Figure 8. The change in the maximum temperature is shown in Figure 8a. It was observed that the best result was obtained for a melting temperature of 302.6 K. The rate of the temperature increase was greater near the end of the discharge. When the melting temperature of the PCM is low, it can fully exert its endothermic effect. However, when the PCM completely melts, it acts as a thermal insulation layer and hinders heat dissipation. In contrast, if the PCM does not sufficiently melt, the cooling effect is not completely exerted. In this battery pack system, when the PCM has a melting temperature of 302.6 K, the maximum temperature of the battery pack reaches a relatively stable value of PCM melting temperature as the voltage decreases to the reaction potential. Heat can be dissipated with time. The PCM with melting points of 303.6 K and 304.6 K could also absorb part of the heat but could not fully function. Figure 8b,c show the temperature range and temperature distribution at a 302.6 K melting temperature. The temperature uniformity improved. The temperature-increase of the PCM also affected the surrounding temperature distribution, causing a slight change in the temperature at the entrance. Thus, it is essential to select an appropriate PCM melting temperature.

4. Conclusions

The aim of this study was to couple the liquid cooling and PCM, owing to the excellent cooling effect of liquid cooling and the desirable control-temperature effect of the PCM. The battery pack was designed and analyzed to minimize the maximum temperature and decrease the temperature gradients using a numerical model. The variables involved, such as the layout of the terminal, flow rate of the coolant, position of the cooling pipes, and height and position arrangement of the PCM, were studied to investigate their influences on the maximum temperature and temperature difference of the battery pack. The results obtained were as follows:
  • A different terminal layout results in different internal current paths. Thus, the different positions involved in the reaction were affected. An optimized layout results in a lower potential decrease than the other layouts. The maximum temperature decreased slightly; however, the temperature distribution was more even in the body area for a single battery.
  • The maximum temperature can be reduced by increasing the inlet flow rate. However, the cooling efficiency decreased when the flow rate exceeded a particular range. When the flow rate was beyond the range, the downward trend of the temperature became smoother, and the extra energy consumption increased. Therefore, a flow rate of 0.09 m/s was utilized in this system, and the deviation in the maximum temperature was smaller than 0.25%, which is comparable to 0.1 m/s. More heat can be removed by the unit mass coolant when using the appropriately selected flow rate.
  • The cross-section of the pipe has an effect on the interflow rate of the coolant, which causes a difference in the cooling performance. Thus, the temperature difference was affected by the cross-section. Appropriate cross-section selection can decrease the temperature difference to below 10 K. Moreover, the positions of the cooling pipes were reasonably arranged, according to the main heat-generation area. This arrangement enables the dissipation of heat in a timely manner at the edge of the high-temperature zone. Moreover, it can maintain a more uniform temperature for the battery pack. It is necessary to arrange the cooling pipes in the main heating area for heat dissipation.
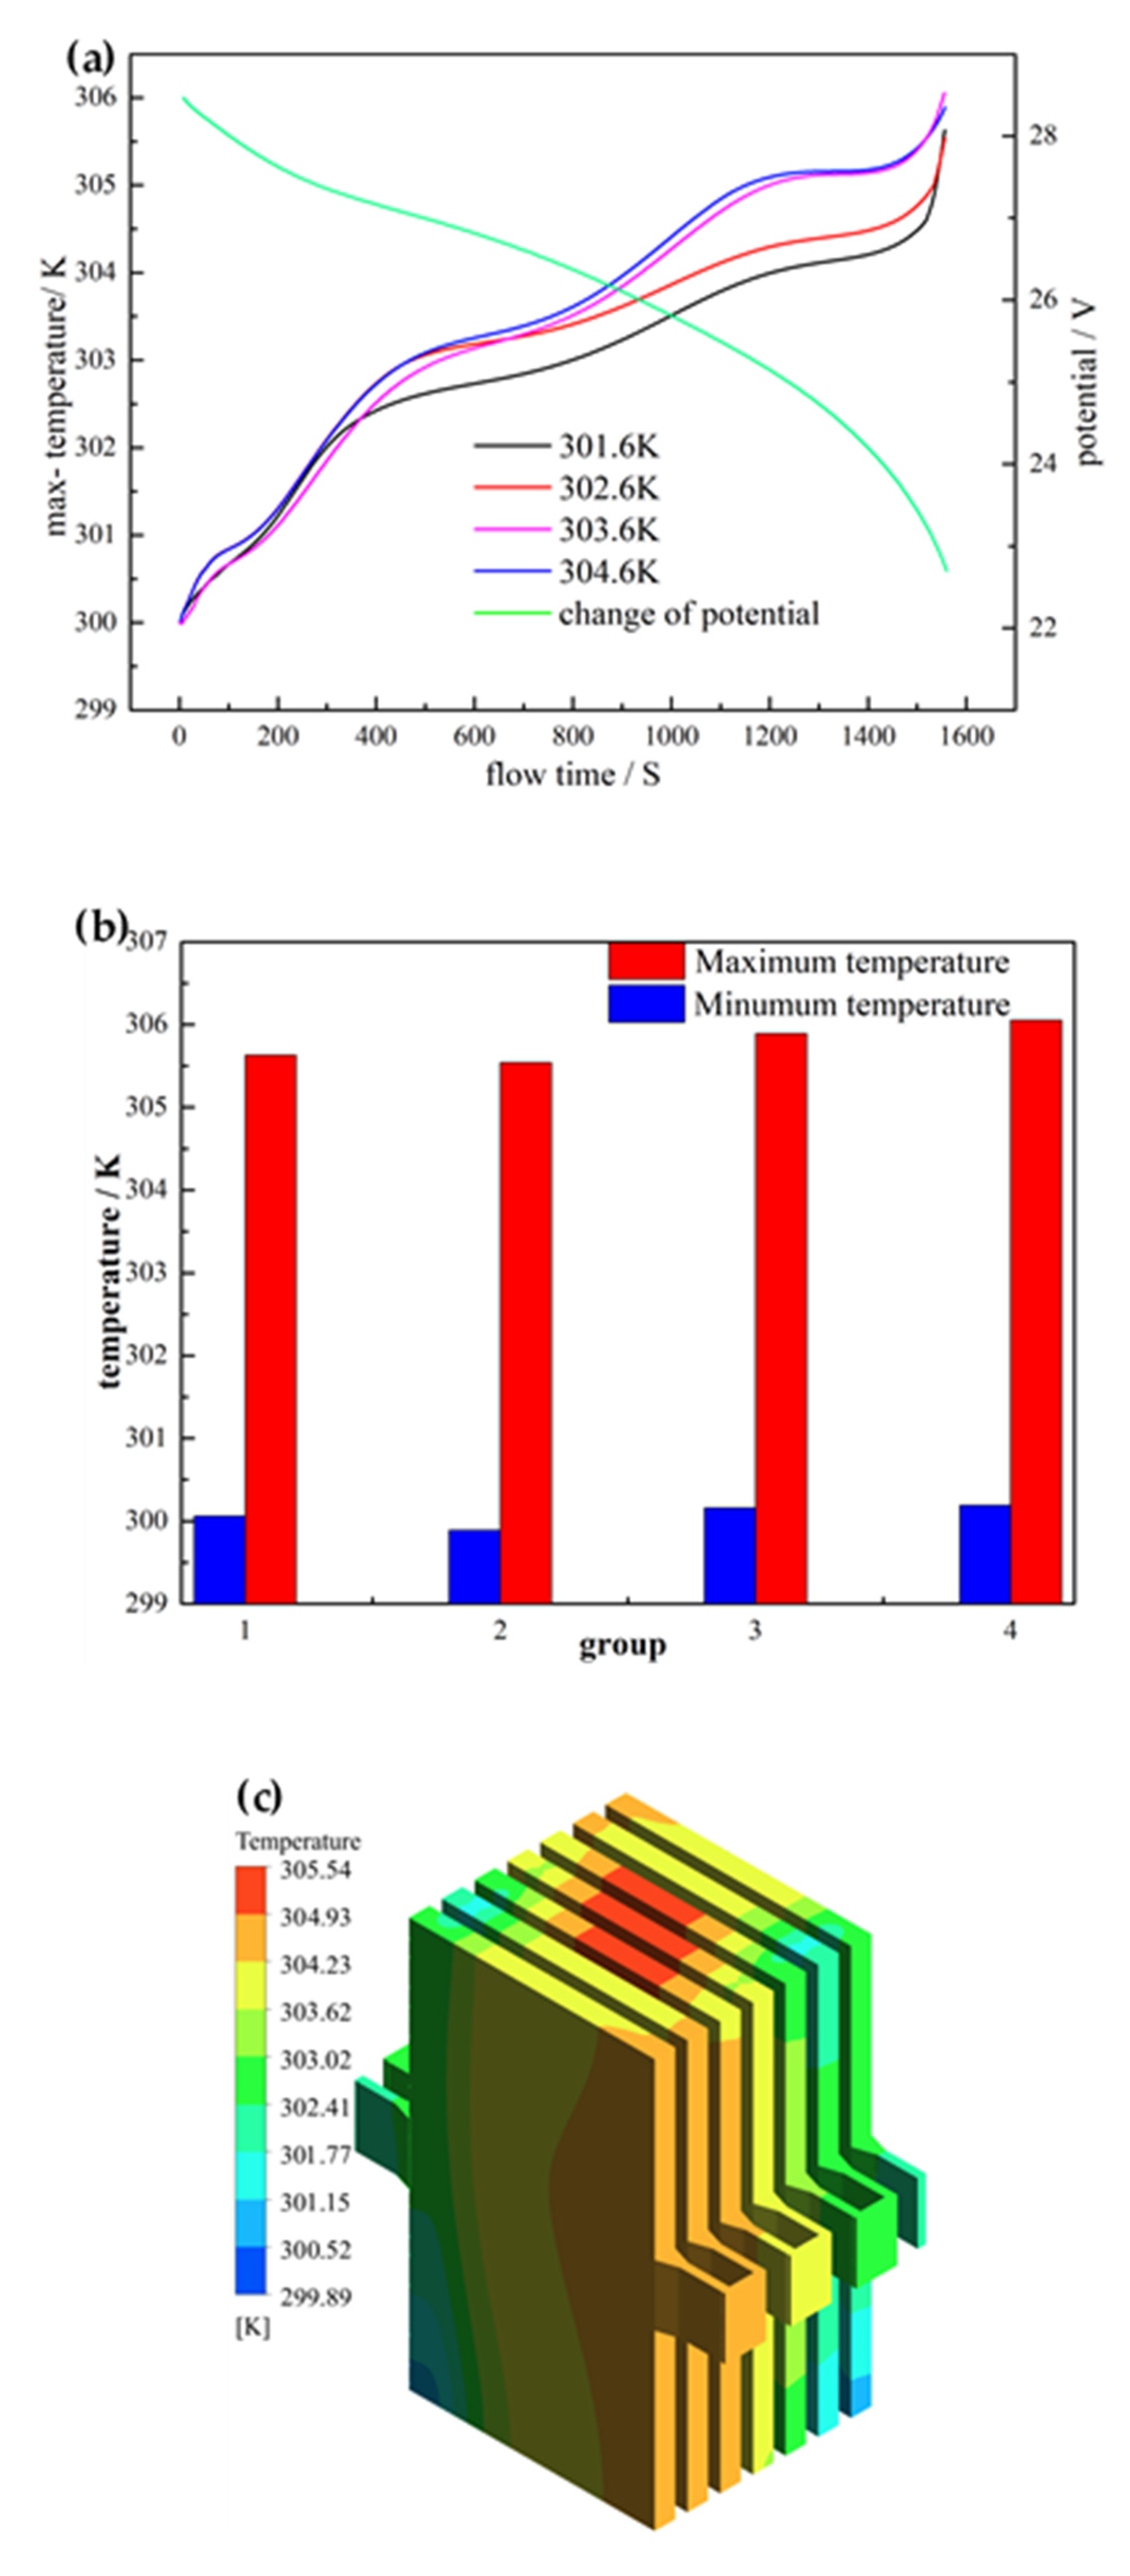
  • The PCM assumed an auxiliary role in optimizing the temperature distribution. Selecting the type of PCM according to the highest temperature of the battery pack can improve the cooling effect to reduce the battery temperature difference. It is beneficial to extend the working life of a battery pack.
The results were obtained using a finite volume method simulation in the case of multiple variables so that corresponding adjustments could be made based on these results in actual tests and production. To enhance the reliability of the results, future work will combine the simulation with experiments under different working conditions. There are many other aspects that may be exploited to enhance the cooling efficiency of the TMS.

Author Contributions

J.-R.C. contributed to the source of the model parameters, and Q.L. to the numerical simulation analysis and writing—original draft preparation. J.Z. contributed to the revision of the language of the article. All authors have read and agreed to the published version of the manuscript.

Funding

This research received no external funding.

Institutional Review Board Statement

Not applicable.

Informed Consent Statement

Not applicable.

Data Availability Statement

The data presented in this study are available upon request from the corresponding author.

Conflicts of Interest

The authors declare no conflict of interest.

Appendix A

In this appendix, the UDF used in the Fluent programming code is described, which involves the change function of the PCM density, specific heat capacity, thermal conductivity, and viscosity as the temperature changes. (The melt temperature of the example material is 302.6 K.) -Program intentionally deleted.

References

  1. Li, Q.; Yang, Q.; Zhao, Y.; Wan, B. Carbon-based coating containing ultrafine MoO2 nanoparticles as an integrated anode for high-performance lithium-ion batteries. J. Nanoparticle Res. 2017, 19, 332. [Google Scholar] [CrossRef]
  2. Saw, L.H.; Poon, H.M.; San Thiam, H.; Cai, Z.; Chong, W.T.; Pambudi, N.A.; King, Y.J. Novel thermal management system using mist cooling for lithium-ion battery packs. Appl. Energy 2018, 223, 146–158. [Google Scholar] [CrossRef] [Green Version]
  3. Peng, X.; Ma, C.; Garg, A.; Bao, N.; Liao, X. Thermal performance investigation of an air-cooled lithium-ion battery pack considering the inconsistency of battery cells. Appl. Therm. Eng. 2019, 153, 596–603. [Google Scholar] [CrossRef]
  4. Bahiraei, F.; Fartaj, A.; Nazri, G.A. Electrochemical-thermal modeling to evaluate active thermal management of a lithium-ion battery module. Electrochem. Acta 2017, 254, 59–71. [Google Scholar] [CrossRef]
  5. Li, Y.; Huang, G.; Xu, T.; Liu, X.; Wu, H. Optimal design of PCM thermal storage tank and its application for winter available open-air swimming pool. Appl. Energy 2018, 209, 224–235. [Google Scholar] [CrossRef]
  6. Li, Y.; Du, Y.; Xu, T.; Wu, H.; Zhou, X.; Ling, Z.; Zhang, Z. Optimization of thermal management system for Li-ion batteries using phase change material. Appl. Therm. Eng. 2018, 131, 766–778. [Google Scholar] [CrossRef]
  7. Mehrabi-Kermani, M.; Houshfar, E.; Ashjaee, M. A novel hybrid thermal management for Li-ion batteries using phase change materials embedded in copper foams combined with forced-air convection. Int. J. Therm. Sci. 2019, 141, 47–61. [Google Scholar] [CrossRef]
  8. Wang, Q.; Rao, Z.; Huo, Y.; Wang, S. Thermal performance of phase change material/oscillating heat pipe-based battery thermal management system. Int. J. Therm. Sci. 2016, 102, 9–16. [Google Scholar] [CrossRef]
  9. Bahiraei, F.; Ghalkhani, M.; Fartaj, A.; Nazri, G.A. A pseudo 3D electrochemical-thermal modeling and analysis of a lithium-ion battery for electric vehicle thermal management applications. Appl. Therm. Eng. 2017, 125, 904–918. [Google Scholar] [CrossRef]
  10. Ling, Z.; Cao, J.; Zhang, W.; Zhang, Z.; Fang, X.; Gao, X. Compact liquid cooling strategy with phase change materials for Li-ion batteries optimized using response surface methodology. Appl. Energy 2018, 228, 777–788. [Google Scholar] [CrossRef]
  11. Bai, F.; Chen, M.; Song, W.; Feng, Z.; Li, Y.; Ding, Y. Thermal management performances of PCM/water cooling-plate using for lithium-ion battery module based on non-uniform internal heat source. Appl. Therm. Eng. 2017, 126, 17–27. [Google Scholar] [CrossRef]
  12. Rao, Z.; Wang, Q.; Huang, C. Investigation of the thermal performance of phase change material/mini-channel coupled battery thermal management system. Appl. Energy 2016, 164, 659–669. [Google Scholar] [CrossRef]
  13. Qian, X.; Xuan, D.; Zhao, X.; Shi, Z. Heat dissipation optimization of lithium-ion battery pack based on neural networks. Appl. Therm. Eng. 2019, 162, 114289. [Google Scholar] [CrossRef]
  14. Thomas, K.E.; Newman, J. Thermal modeling of porous insertion electrodes. J. Electrochem. Soc. 2003, 150, A176–A192. [Google Scholar] [CrossRef]
  15. Putra, N.; Ariantara, B.; Pamungkas, R.A. Experimental investigation on performance of lithium-ion battery thermal management system using flat plate loop heat pipe for electric vehicle application. Appl. Therm. Eng. 2016, 99, 784–789. [Google Scholar] [CrossRef]
  16. Zhao, J.; Rao, Z.; Li, Y. Thermal performance of mini-channel liquid cooled cylinder based battery thermal management for cylindrical lithium-ion power battery. Energy Convers. Manag. 2015, 103, 157–165. [Google Scholar] [CrossRef]
  17. Javani, N.; Dincer, I.; Naterer, G.F.; Yilbas, B.S. Heat transfer and thermal management with PCMs in a Li-ion battery cell for electric vehicles. Int. J. Heat Mass Transf. 2014, 72, 690–703. [Google Scholar] [CrossRef]
  18. Agyenim, F.; Hewitt, N.; Eames, P.; Smyth, M. A review of materials, heat transfer and phase change problem formulation for latent heat thermal energy storage systems (LHTESS). Renew. Sustain. Energy Rev. 2010, 14, 615–628. [Google Scholar] [CrossRef]
  19. Yang, H.; Zhang, H.; Sui, Y.; Yang, C. Numerical analysis and experimental visualization of phase change material melting process for thermal management of cylindrical power battery. Appl. Therm. Eng. 2018, 128, 489–499. [Google Scholar] [CrossRef]
  20. Liu, R.; Chen, J.; Xun, J.; Jiao, K.; Du, Q. Numerical investigation of thermal behaviors in lithium-ion battery stack discharge. Appl. Energy 2014, 132, 288–297. [Google Scholar] [CrossRef]
  21. Song, L.; Zhang, H.; Yang, C. Thermal analysis of conjugated cooling configurations using phase change material and liquid cooling techniques for a battery module. Int. J. Heat Mass Transf. 2019, 133, 827–841. [Google Scholar] [CrossRef]
  22. Chen, D.; Jiang, J.; Kim, G.H.; Yang, C.; Pesaran, A. Comparison of different cooling methods for lithium ion battery cells. Appl. Therm. Eng. 2016, 94, 846–854. [Google Scholar] [CrossRef] [Green Version]
  23. Thompson, D.L.; Hartley, J.M.; Lambert, S.M.; Shiref, M.; Harper, G.D.; Kendrick, E.; Anderson, P.; Ryder, K.S.; Gaines, L.; Abbott, A.P. The importance of design in lithium ion battery recycling—A critical review. Green Chem. 2020, 22, 7585–7603. [Google Scholar] [CrossRef]
Figure 1. Four different terminal layouts named (a), (b), (c) and (d) in order.
Energies 14 05312 g001
Figure 2. Schematic of liquid cooling: (a) layout of pipes of 1P7S battery pack; (b) different sections for the round and square pipes; (c) movement of pipe position (top view); (d) symbols for coolant inlet and outlet.
Energies 14 05312 g002
Figure 3. Temperature distribution of different terminal layouts: (ad); (e) shows the internal cross-section view of each layout.
Energies 14 05312 g003
Figure 4. Potential curves of different terminal layouts at the positive tab.
Energies 14 05312 g004
Figure 5. (a) Maximum and minimum temperature of battery pack and coolant maximum temperature; (b) and (c) show the temperature distribution of the battery pack and coolant for a flow rate of 0.09 m/s, respectively.
Energies 14 05312 g005
Figure 6. Temperature distribution of the battery pack using the (a) square and (b) round cooling pipes with H = 5 mm between the cooling pipe and terminal.
Energies 14 05312 g006
Figure 7. Temperatures for different distances between the cooling pipe and terminal.
Energies 14 05312 g007
Figure 8. (a) Maximum and minimum temperature varying with pipe position; (b) maximum and minimum temperature for different PCM melting temperatures: groups 1–4 correlate to 301.6 K, 302.6 K, 303.6 K, and 304.6 K, respectively; (c) temperature distribution using 302.6 K PCM melting temperature.
Energies 14 05312 g008
Table 1. Parameters used in simulation. (T1: melting temperature; T2: temperature of completely liquid state).
ParametersSymbol (unit)Value
Latent heat of PCM L PCM (J kg−1)243,500
Specific heat of PCM C PCM (J kg−1 k−1)1800 (T ≤ T1)
1800 + (600 × (T − T1)/2) (T1 < T < T2)
2400 (T2 ≤ T)
Density of PCM ρ PCM (kg m−3)785 (T ≤ T1)
785 − (36 × (T − 301.6)/2) (T1 < T < T2)
749 × (1 − 0.001 × (T − T2)) (T2 ≤ T)
Viscosity of PCM ν PCM (kg m−1 s−1)1 (T ≤ T1)
(303.6 − T)/2 (T1 < T < T2)
0.000169 (T2 ≤ T)
Thermal conductivity of PCM λ PCM (W m−1 k−1)0.6 (T ≤ T2)
0.6 − (0.01 × (T − T1)/2) (T1 < T < T2)
0.59 (T2 ≤ T)
Specific heat of water C w (J kg−1 k−1)4182
Density of water ρ w (kg m−3)996.5
Viscosity of water ν w (kg m−1 s−1)0.001003
Thermal conductivity of water λ w (W m−1 k−1)0.6
Publisher’s Note: MDPI stays neutral with regard to jurisdictional claims in published maps and institutional affiliations.

