Abstract
District heating (DH) has a major potential to increase the efficiency, security, and sustainability of energy management at the community scale. However, there is a huge challenge for decision makers due to the lack of knowledge about thermal energy demand during a year. Thermal energy demand is strongly dependent on the outdoor temperature, building area, and activities. In this context, this paper presents an innovative monthly thermal energy mapping method to calculate and visualize heat demand accurately for various types of buildings. The method includes three consecutive phases: (i) calculating energy loss, (ii) completing a dataset that includes energy and building information, and (iii) generating the monthly heat demand maps for the community. Determining the amount of demand and the best location for energy generators from the perspective of energy efficiency in a DH system in an urban context is one of the important applications of heat maps. Exploring heat demand characteristics and visualizing them on maps is the foundation of smart DHs.
1. Introduction
Cities are responsible for more than 50% of total global energy demand [1], while a huge portion of this demand is utilized for thermal purposes to provide comfortable indoor temperatures as well as domestic hot water in buildings [2,3]. In the ‘Heating and Cooling Strategy’ of the European Commission (EC), the significant potential of heating demand to reduce energy consumption was highlighted on one hand, and on the other hand, district heat networks (DHN) were recommended as a successful method for decarbonizing cities [3]. District heating (DH) is a promising approach to achieve low carbon heat [4] and supports the use of various thermal sources, such as fossil fuels, renewables, and waste heat [5].
However, compared with the electrical smart grid, DHN did not develop, particularly in terms of sharing surplus heat technology. The main reason involves the complicated prediction of heat demand for various types of buildings, such as hotels, sports centers, colleges, residences, and commercial structures.
This study assessed the characteristics of a group of network members, i.e., buildings, in terms of their ever-changing heat demand during a month or even a day. The patterns of heat energy demand were investigated in further detail to generate a smart DHN (SDHN). Using a case study, the authors explored how the heat demand varies in each month at a university campus. The developed methodology helps to manage the heat demand in shorter time periods, and this achievement increases the efficiency as well as the security of a DHN. This method can improve knowledge in the field of DHN, moving the field toward smart DHN (SDHN). SDHN can apply all types of energy sources, including fossil fuels, renewables, or hybrids. The methodology provides a platform to share the extra heat between the network members.
Understanding the amount and pattern of heat consumption of the studied campus was the main objective of the research. The efficiency of heat consumption in the individual heat boilers was assessed and compared with the efficiency of the DH system.
In addition, based on the completed energy building database (EBD), a GIS-based tool, i.e., district heat balance (DHB) tool, was developed and applied to generate heat maps. Then, the heat maps were used to discover thermal demand density, the baseload, and the peak load of case study buildings. The main purpose of heat maps is to understand heat consumption (size) and geo-scattering of thermal anchor loads. Heat maps are used to extract effective policies to reduce thermal energy at the community scale. Determination of the best location for central heat generators in an urban context from the perspective of energy efficiency is one of the basic advantages of the heat maps. Assessing the criteria, such as minimum heat loss and costs and maximum efficiency, as well as the optimum land cost to determine the best location for heat generators, could be investigated in future studies.
2. Background
District Heat Network (DHN)
In the contemporary century, four generations of district heat network (DHN) were developed. The first and second generations applied before 1980, and they circulated steam or pressurized water at over 100 °C. However, the third-generation (3G) circulates water at medium to high temperature (80–100 °C), and all these are mentioned as high-temperature district heat networks (HTDH). Since 2008, the fourth generation (4G) system introduced what are called low-temperature district heating networks (LTDH), and they circulate water between 30 and 70 °C. A study [6] has suggested that future grids may use 4G distribution networks with annual mean temperatures of 50 and 20 °C for supply and return, respectively. The references [7,8] have assessed ‘ultra-low temperature networks’ with the temperature below 50 °C. In this method, high-efficiency heat pumps can be used at the endpoint (building boundary) if heat demand with higher temperatures is required.
The fifth generation (5G) of DHN is integrated with renewable energy resources and relies on smart technologies [9]. The 5G systems are decentralized, bi-directional, close to ground temperature networks that apply direct exchange of heat, combined heating and cooling, cold return flows, and thermal storage to balance thermal demand as much as possible [10,11]. The 5Gs focus on the decentralized heat generators installed at customer stations. The success of this system highly depends on the accurate prediction of heat demand.
Spatial analysis is essential to control DHN potential since its applicability depends on the local characteristics of heat demands and patterns. Recently, Ireland started moving toward the application of DHN when its first spatial energy demand analyses were produced for South Dublin in 2015 [12]. Nevertheless, the predominant heating method in the country is local central heating (mostly individual boilers) and uses fossil fuel.
Most of the studies on DHN focused on the water temperature, and others [13,14,15] presented a heat atlas that illustrated heat supply and demand at a large scale, such as a city without focusing on individual buildings’ demands. A group of studies assessed the length of network pipes using mixed integer linear programming (MILP) solvers [16], a minimum spanning tree algorithm [17], or similar optimal network decision methods to reduce heat losses during the heat distribution process [18].
Based on actual heat demand data, DH managers can design efficient DH plants and consequently reduce the energy price [19]. The total daily space heating (SH) demand for each geographical zone was calculated based on the proportion of day-specific heating, in degree days [20]. Some studies also have been conducted to evaluate heat losses in DH systems by efficient transmission loads along a distribution network [21,22] as well as determining the location of thermal energy demands [23,24]. Discovering the location of huge thermal demands (large building size and high demand) in terms of DH network energy efficiency is crucial.
The authors of [25,26] developed an algorithm to evaluate design heat demand of a future urban context as a pathway for decision-makers. In references [27,28] using three building case studies, a detailed investigation was presented on building consumption profile modeling. A certain load profile was used for all buildings in the same category. However, the buildings in an urban context are not necessarily classifiable in one group.
Based on the studies conducted across Europe in terms of domestic hot water demand, Harney et al. [29] classified the demand into four categories, including short draw (e.g., handwashing), medium draw (e.g., dishwashing), shower bath, and bathtub. Each demand class was responsible for 14%, 36%, 40%, and 10% of the total volume of daily domestic hot water consumption, respectively.
Nicholas Fry [30] developed a method for mapping building-level heat demand for three US demonstration municipalities, i.e., Montana, Idaho, and Washington. The author determined 9 building categories, such as single family residential, office and retail, multifamily, school/campuses, restaurants, and hospital–healthcare. According to this study, a hospital’s annual heat demand is very much lower than that of a single family residence. However, Chartered Institution of Building Services Engineers, CIBSE TM 46 [31], has suggested that both of them need 420 kWh/m2/year.
One of the best references for heat and electricity demand at the building level is CIBSE TM46 [31], which presented the heat demand of 29 building categories based on local weather, building conditioned area, and building type. For example, a school, a university building, a hotel, a general office, and a restaurant need 150, 240, 330, 120, 370 kWh/m2/year of thermal energy, respectively. Comparing other published research, TM46 presents a comprehensive number of building types with a high level of accuracy. It shares a method to adjust energy demand patterns—for instance, the difference between full and part time usage of a building. Nevertheless, TM46 does not present the demand for monthly or shorter periods.
Hanmer et al. [32] studied the heat demand patterns in UK residences, and they explored social routines, e.g., the timing of work and school affect heat consumption. Based on the actual data and interview, the authors found two heat consumption peaks at 07:00 and 19:00 o’clock when people are leaving home for work and switching off boilers at nighttime.
Directive (EU) 2019/944 determines and regulates the formation of citizen low energy communities. Allowing for a broader diffusion of on-site renewable energy sources, for example, solar thermal is believed to be a key factor in decreasing buildings’ carbon footprint by generating and maximizing renewable energy self-consumption [33]. Several studies investigated solar power community energy, but few studies focused on sharing the extra solar thermal hot water at the community scale. Solar thermal hot water generation varies during a day and year. Visualizing solar heat demand and generation as well as the balance between them are applicable, applying daily or monthly heat maps. Addressing the gap in this area could improve the security of SDHNs.
On the whole, the studies in the field of DHN could be classified into three categories: (i) water temperature and the related technology, (ii) network characteristics, members (buildings), and their efficiency as well as cost-effectiveness, and (iii) heat supply and demand, energy resources, smart networks [34], and technology [35].
The reviewed literature highlighted the role of smart heat networks and their efficiency, while heat demand and its consumption patterns are the fundamental part of this network. The study of heat demand or supply maps and research in this field will help to achieve a zero-carbon city. Open access to energy consumption and buildings data is fundamental to improve energy assessments and mapping. Openness is the best way to speed up research by public administrations, governments, and scholars. Therefore, open access promotes the construction of a reliable and robust dataset [36]. Open access to energy data is the main obstacle in front of research in the DHN area.
3. Methods and Datasets
3.1. The Case Study
Trinity College Dublin (TCD), Ireland, founded in 1592 and located in Dublin city center [37], was used as a case study. Figure 1 shows the boundary of the TCD campus. The campus area is approximately 172,000 m2 and its perimeter is about 1718 m. There are 68 buildings located on the campus, with a footprint area of 51,615 m2. The overall building area is approximately 156,665 m2. The footprint area shows the area of land used by the ground floor of a building on the campus site, while the overall building area includes the area of all floors, such as the basement floor. The scattering of the 68 case study buildings on the campus is shown in Figure 1.
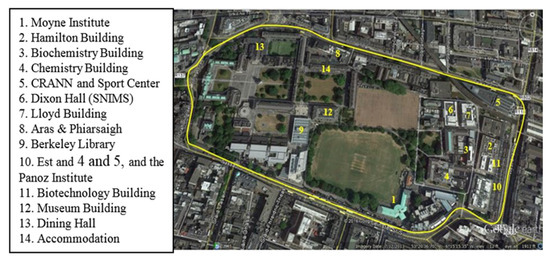
Figure 1.
The boundary of TCD campus.
3.2. Visualizing Current TCD Campus Heating Method
The heating systems at TCD can be divided into two groups: (1) district heating (DH) system, and (2) individual boiler systems. These heating systems are not connected, so that each system is run, managed, and serviced independently. The first system applies in the west part of the campus (yellow color in Figure 2) and serves the Buttery Restaurant; Atrium; Houses 4, 10, 12, 14, 24, 26, and 35; Graduate Memorial Building; Provost’s House, Public Theater; Reading Room; and Dining Hall. Individual boiler systems, on the other hand, serve the rest of the buildings on the campus. The size of green circles on the map (Figure 2) shows the number of boilers installed in each building. For example, in Berkeley Library, six boilers were installed. As visualized, it will be possible in the future to connect the individual boilers to create second or third DH zones on the campus.
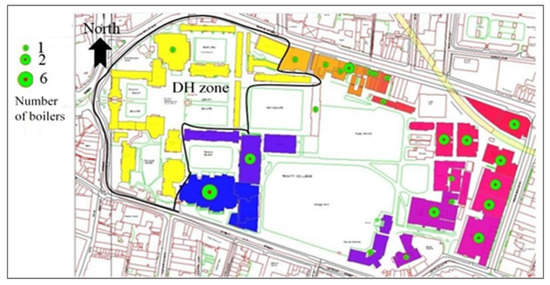
Figure 2.
The current heating systems of TCD.
To generate a robust base for a DH system, energy models and maps are essential [38]. Since a DH relies on local thermal energy demand densities as well as on resources, energy maps that involve detailed information at the building scale are a prerequisite. The DH heating system in TCD was compared with individual boiler systems.
3.3. Assessment of Heat Losses at TCD Campus
Based on the actual data shared by the Estates Office of TCD, the overall annual heat loss of the boiler systems was calculated. In addition, the heat loss of each boiler was assessed. According to the ArcGIS analysis, the overall useful area of the buildings serviced by the DH system was 43,793 m2. According to the CIBSE TM46:2008 methodology [31] and the monthly thermal energy models (MTEMs) developed in [39,40], the buildings needed (in 2012) 11,312,468 kWh thermal energy per year. These buildings occupy approximately 14,916 m2 of the campus land (the overall area of the footprint of buildings). The detailed information, including the area and thermal energy demand of all buildings heated by the DH system, is presented in Table 1.

Table 1.
Information of the buildings heated by the DH system.
The Estates Office of TCD in 2015 reported that the boilers were switched off at nighttime, between 7:00 p.m. and 6:00 a.m., throughout the year [41]. The results of the survey show that the temperature of water in the boiler’s storage tank before switching off was 70 °C, but in the morning, it was 20 °C. The 50 °C difference between evening and morning temperature of water indicates a significant heat loss. The Estates Office is switching off the boilers because at nighttime there was nearly zero demand (kWh) for space heating or hot water in many buildings. This was accomplished as a part of the campus policy for energy efficiency. The policy was also implemented during the holidays and weekends.
Based on the volume of water associated (i.e., the volume of the tanks), and other necessary information (Table 2), the monthly and annual heat losses were calculated. Equation (1) was used to calculate the heat losses.
where Q is the amount of heat loss, c is the specific heat of water (c = 4.1868 J/gr × °C), M is water mass (liter), T2 − T1 = 50 °C, 1 L of water ≅ 1000 g.
Q = [c × M × (T2 − T1)] = cM ΔT
Table 2.
The calculated heat loss of boilers at TCD campus.
According to the calculations, the overall annual heat loss of TCD boilers was approximately 1679 MWh. This is a huge heat loss and needs to be addressed properly. The DH system in the west of TCD did not follow the daily switching on/off strategy. The reason was that the DH system at nighttime serves a group of buildings, e.g., residential accommodations, that need hot water continuously. The mixed-use functions of buildings in the network—such as residential, which has continual heat demand—caused the DH system to not need to turn on/off daily. The purpose of calculating the heat losses from the individual boiler systems was to indicate that the other system, i.e., DHN, is more efficient.
3.4. Calculation of Thermal Demand
A university campus is a sample of a community with various buildings that have different thermal demands and patterns. The amount of heat demand is modified based on the activities in buildings [40], outdoor temperature, and building area. Therefore, calculating the accurate amount of thermal energy demand based on these factors is fundamental. The actual heat demand data applied in the assessments related to both space heating and domestic hot water. The monthly heat demand calculation was addressed comprehensively by applying valid monthly thermal energy models (MTEMs) [39] for typical educational buildings, such as a college. However, a campus also includes other types of buildings, which are important from the heat demand perspective. Sports centers, libraries, laboratories, amphitheaters, shops, and restaurants are usually found on a campus, and they need a large amount of heat energy per unit area. For example, a restaurant needs thermal energy of 370 kWh/m2 per year [31].
The other types of buildings on a campus except for the typical college buildings, such as a restaurant, were called non-UC buildings, with various heat demand sizes and patterns. The monthly heat demand estimations in non-UC buildings are also essential to quantify daily or monthly thermal energy demand at the campus scale. The heat map (HM) methodology developed in this paper considered all types of buildings on a campus when calculating the heat demands. The HM method and the capability of the DHB tool are explained in further detail in the following sections.
In fact, non-UC building types comprise 28 categories, as defined by CIBSE TM46 [31]. These 28 categories cover all types of buildings on a campus, and they include many building types, for example, sport center, swimming pool, restaurant, lab, library, shop, etc. Each type has its special thermal demand benchmark. To calculate the amount of mean monthly thermal energy demand of non-UC buildings, the annual thermal energy benchmarks based on the dominant function (single function) of the buildings were derived from TM46 and divided by 12 (number of months in a year). Then the result was multiplied by the total useful floor area (TUFA) of that building, which was obtained by survey. Using Equation (2), the mean monthly heat demand was calculated for non-UC building types.
The mean monthly thermal energy demand for a non-UC building (Q1) with dominant function (i) is:
where benchmark (i) in kWh/m2/yr refers to the dominant function of the building, and A is the total useful floor area (m2) of a given building.
Q1 = ((TM46 benchmark (i))/12) × A
A hybrid heat map (HM) methodology was developed, which was a suitable GIS-based method for analysis and management of heat demand or surplus at the community scale, in this case, a university campus. Hybrid methodology means the combination of both MTEMs and TM46 methods. HM was also applied to assessing the efficiency and feasibility of district heating (DH) systems at the case study campus.
3.5. Development of the Smart District Heating Network (SDHN) Dataset
The district heat balance (DHB) tool developed in this research is applicable for calculating heat demand and generation at daily or monthly resolutions. In addition, it can share a lot of valuable information about the buildings and energy analysis. If a user of the DHB tool clicks on a given building in ArcGIS, for example on the Lloyd Building, a window will open that delivers valuable information in a table format, as presented in Figure 3. The information can be used for multiple purposes, for instance, energy efficiency planning to reduce fossil energy consumption at the neighborhood scale. The DHB tool shares useful information such as the monthly heat demand analysis data, dominant and mixed activities in the building, gross heat density (H_UEDg), footprint heat density (H_UEDf), building floor area, building total area, number of floors, and the annual thermal energy demand of the case study buildings.
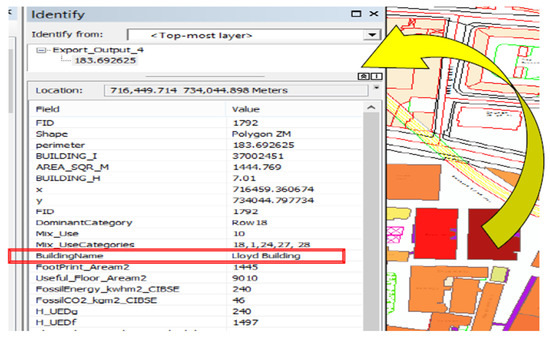
Figure 3.
Screenshot of attribute table of DHB tool, energy and building information.
4. Results and Discussion
Monthly Heat Maps for TCD Campus
The DHB tool is a GIS-based tool developed in this research to generate monthly thermal energy maps. In ArcGIS, the DHB tool was linked with EBD (energy building database), which includes all the energy data, such as display energy certificate information, monthly thermal energy models (MTEMs) data, monthly thermal energy benchmarks (MTEBs), and heat density. It also includes all the information obtained from the survey. The attribute table of the DHB tool comprises 120,000 data cells, which were used to generate the monthly heat maps.
To generate the monthly heat demand maps for case study buildings, two methods were combined. The method of monthly thermal energy models (MTEMs) [39] was applied for typical college buildings (PTC types) that did not need heating in summers. The CIBSE TM46 [31] method was also applied to calculate the energy demand for non-UC buildings (PTC types). In ArcGIS, both methods were combined, and the heat maps were generated. Further information about these methods was explained in Section 3.4.
The analysis of the thermal energy map of TCD in January 2012 revealed that the highest thermal energy demand among the buildings on the campus was 330,748 kWh belonging to the Arts Building, followed by the Panoz Institute and Lloyd Building, with 231,550 and 225,250 kWh, respectively (Figure 4). The lowest demand, however, was approximately 6500 kWh belonging to a storage facility building in the north of the campus behind the Simon Perry Building. In the figure, the darker colors show a higher thermal energy demand and lighter colors a lower thermal energy demand. NCC refers to ‘No Condition Control’ spaces or unconditioned spaces such as a garage.
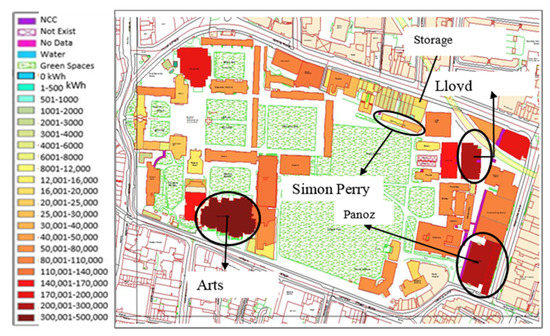
Figure 4.
The heat demand (HM) map of January.
The key characteristic of a spatial thermal demand map is to identify the locations of potential anchor thermal energy loads. Anchor thermal energy loads are high heat demand buildings, such as swimming pools. In addition to the high-density thermal energy load, the other parameter that should be considered in the identification of an anchor load is the continuing demand pattern. For instance, a building with high thermal energy density during a short period, such as a month or even a season, is not a thermal anchor load.
Detailed analyses of the monthly fossil thermal energy demand of TCD buildings were undertaken using the DHB tool and, as a sample, the demands in August are shown in Table 3 at the building level. The analyses were presented at the building level; however, they can be presented at a larger level, such as at a campus or an urban context level.
Table 3.
The thermal energy demand in August at the building level.
The HM of TCD in July 2012 is presented in Figure 5. According to the map, the thermal energy demands of UC buildings (typical college buildings) at TCD were zero; however, the non-UC buildings with functions such as residential, Sports Center (swimming pool), restaurants, and library needed the thermal energy over this month. For the definition and typical characters of a college building, refer to [40]. According to the HM of July, the highest thermal energy demand belonged to Dining Hall with 186,384 kWh followed by Sports Center with 177,854 kWh.
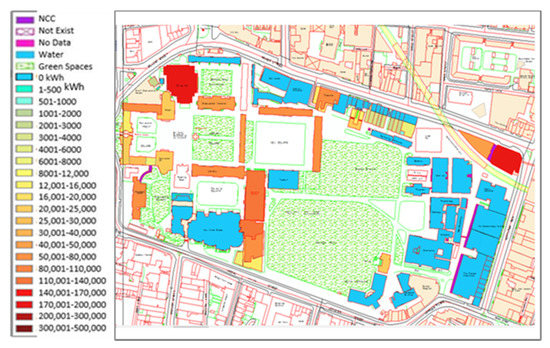
Figure 5.
The heat demand map of July.
According to the ArcGIS statistical analysis, the overall thermal demand of non-UC buildings in July 2012 was 1,529,438 kWh. In addition, the average daily thermal energy demand was approximately 51,000 kWh, which indicates the baseload (the lowest daily load) of the campus. On the other hand, the peak load (monthly and daily) can be derived from the analysis of the January heat map presented in Figure 4. Based on the statistical assessments, the thermal energy demand of TCD in January 2012 was approximately 3,944,680 kWh, which shows an average daily demand of 131,000 kWh. The difference between baseload and peak load was 80,000 (kWh/day), which refers to the space heating.
This detailed information, i.e., baseload and peak load, which was obtained from the analysis of the monthly heat maps, is crucial in designing a DH system. Such information is very valuable at an urban scale. For example, understanding the thermal density, extracted from the HM, helps urban planners to determine the optimized location for energy plants nearby the anchor loads. This strategy reduces the energy loss of hot water in a DH system due to the short distance between the energy plant and energy consumer, i.e., anchor loads. In addition, knowing the base and peak heat loads is useful in the design of a DH system plant in terms of water tank capacity and power. For instance, such evidence could be used by mechanical engineers to calculate efficient plants.
By comparing both January and July maps (2012), essential information regarding the anchor loads of the campus was obtained. The maps revealed the location of both anchor loads, i.e., Dining Hall in the northwest of the campus and Sports Center on the opposite side, northeast.
In addition, by analysis of the July heat map (Figure 5), two classes of buildings were defined from the heat demand pattern perspective, (i) continual thermal consumers (CTC), all buildings on the map except blue colored and NCC, and (ii) periodic thermal consumers (PTC), blue colored buildings. PTC needs very low or nearly zero thermal energy during summers or at nighttime and holidays. Typical college buildings are a sample of this class. CTC and PTC can be used as a foundation for thermal energy balance analysis.
The detailed analysis of thermal energy demand of both classes of buildings indicates the footprint area of PTC was 28,234 m2, whereas the footprint area of the CTC class was 21,835 m2. The useful building area of PTC was 87,049 m2 while the useful building area of CTC was 60,852 m2. Accordingly, the annual thermal energy consumption of the PTC class was approximately 14,640 MWh, while the annual consumption of the CTC class was 16,657 MWh. The monthly thermal energy consumption of PTC buildings at the campus scale is presented in Figure 6.
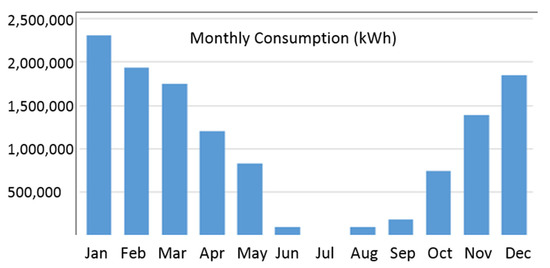
Figure 6.
The monthly thermal energy consumption of PTC buildings.
To explore the daily heat demand patterns, the hourly actual heat consumption data were obtained from the TCD energy database. Based on these hourly data, the daily heat demand pattern of case study buildings was discovered. Through the assessment of daily consumption data of PTC buildings, the daily energy demand pattern was extracted as shown in Figure 7.
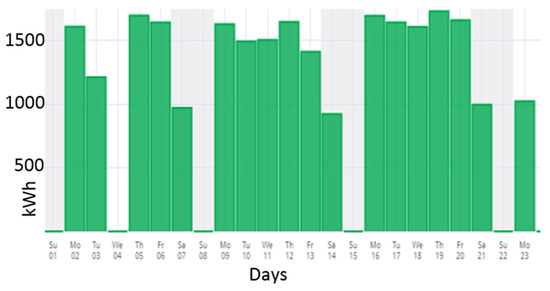
Figure 7.
The thermal energy consumption pattern of PTC buildings, Aras An Phiarsaigh, December 2013 [42].
The thermal energy consumption pattern of the PTC class not only depends on the outdoor temperature and modifications through a year, but it also depends on the attendance timetable of students/staff. For example, at nighttime, e.g., from 6:00 p.m. when there were few students, the boilers at TCD are switched off. This strategy was observed on the weekends and holidays, as shown in Figure 7. The actual daily heat consumption data were obtained from Cylon Active Energy Management online dataset [42].
Further assessment of the HM maps revealed that the location of the energy plant of the DH system at TCD is located beside an anchor load, i.e., Dining Hall (Figure 8), which is an optimized decision in terms of reducing heat losses when hot water circulates between the heating plant and the anchor load (Dining Hall). The shorter distance results in shorter piping, lower risk of repairing, lower water leakage risk, lower heat losses, lower thermal insulation, and consequently lower expenses. The closeness of heating plant/generator to anchor loads (consumer) is a key criterion that should be considered in land development in future urban planning. Determining the best location for energy generators from the perspective of energy efficiency in a DH system at the community/urban context is one of the important applications of heat energy maps.
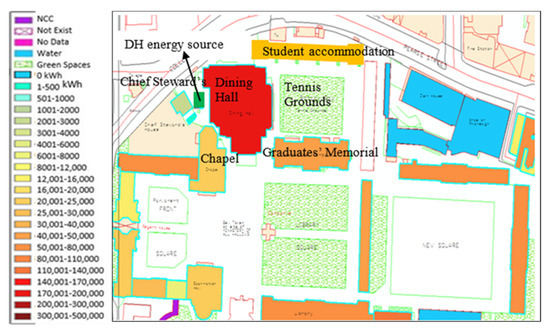
Figure 8.
Location of the anchor load and heating generator in the DH system.
According to the analyses of the heat maps of May, June, (Figure 9 and Figure 10), July (Figure 5), October (Figure 11), and the rest of the year (Figure 12), it can be concluded that if the DH system at TCD develops, an open space in the west of the Sports Center is the best location for a new DH station. Layout 1 in Figure 12 indicates the analysis applied to determine the optimal location. Based on the closeness to the anchor load (Sports Center) and the availability of open space, the location was determined.
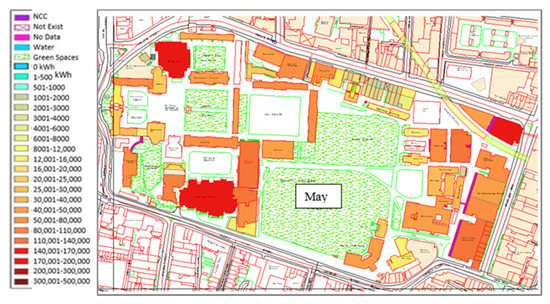
Figure 9.
Heat demand map of May.
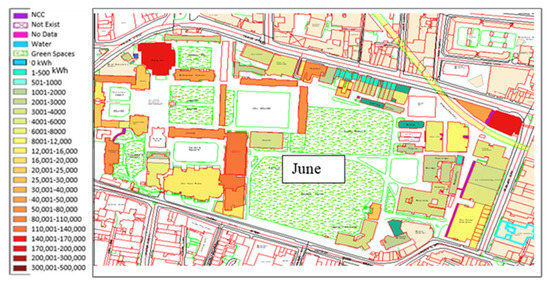
Figure 10.
Heat demand map of June.
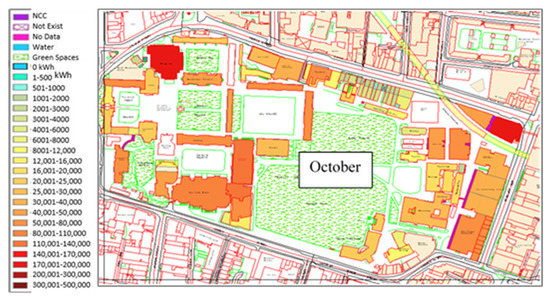
Figure 11.
Heat map of October.
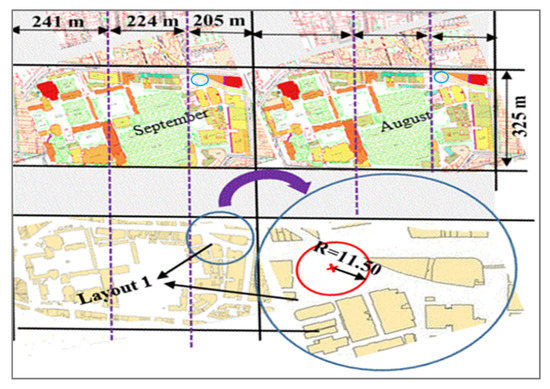
Figure 12.
Determining a location for a DH thermal station.
Based on the distance analysis presented in Layout 1 (Figure 12), the college map was divided into three sections with 241, 224, and 205 m intervals. The current DH system covers the first interval, i.e., 241 m in the west of the campus. The suggested new DH system can cover the rest of the campus with a maximum distance of 325 m, as shown in the figure. The new location is specified with a circle with an area of 415 m2.
The suggested new DH system with maximum distance of 325 m can service the buildings located in the southeast and east of the campus, such as the Parsons Building, Moyne Institute, Chemistry Building, Smurfit Institute, Panoz Institute, Hamilton Building, and Lloyd Building. Likewise, it can also serve another group of the buildings located in the north of the campus with a distance of 224 m. Samuel Beckett Theater, Aras An Phiarsaigh, and Simon Perry Building are examples of buildings in this group. In the case of connecting both DH systems (the existing plant station near Dining Hall and the recommended station near Sports Center), the maximum distance between them is approximately 480 m. Establishing the recommended new DH system instead of individual boilers can save a heat loss of 1679 MWh resulting from the daily boilers’ on/off strategy. Using the DHB tool, seven monthly heat demand maps of TCD were generated and are presented in Figure 13.
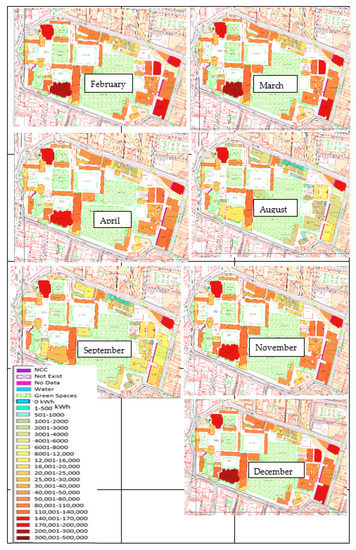
Figure 13.
The monthly fossil fuel heat map of TCD in 2012.
The amount of monthly thermal energy demand of TCD at the campus scale is presented in Table 4. The overall annual thermal demand of the campus was 31,361 MWh/yr. The lowest demand at the campus scale was in July, with nearly 1529 MWh, while the highest demand was in January with nearly 3945 MWh. The results show that the heat demand of TCD in January was approximately 2.5 times greater than that in July.
Table 4.
The monthly thermal energy demand at the campus level.
5. Conclusions
Thermal energy demand strongly depends on the building area, activity, and outdoor temperature. Modeling and visualization of heat demand of individual buildings and simultaneously at the neighborhood scale are fundamental to enhance the sustainability of a smart DHN. In this paper based on monthly thermal energy models (MTEMs) and 29 CIBSE TM46 energy benchmarks, an integrated methodology for monthly heat demand calculation and mapping for a university campus was developed. The generated heat maps share detailed information to smartly manage the DHN. Based on the developed DHB tool, the anchor and peak heat loads were calculated. Visualizing the location and size of heat demand, such as the maximum and minimum loads and their consumption patterns, are crucial for developing a DHN. According to the heat consumption patterns, two groups of buildings, including continual thermal consumers (CTC) and periodic thermal consumers (PTC) were identified. Discovering this detailed information is essential for managing a DHN more sustainably. The methodology can replicate in any urban context to assess the heat demand at both the individual building and community levels. This method paves the way toward sharing surplus thermal energy across the DHN. Future studies may focus on the sharing of heat energy between the community members using smart heat measurement technologies.
Author Contributions
Conceptualization, S.V. and S.M.; methodology, S.V.; software, S.V. and S.M.; validation, S.V., S.M. and K.H.; formal analysis, S.V. and S.M.; investigation, S.V.; resources, S.V. and K.H.; data curation, S.V.; writing—original draft preparation, S.V. and S.M.; writing—review and editing, S.M. and K.H.; visualization, S.V.; supervision, S.M.; project administration, S.V.; funding acquisition, S.V. All authors have read and agreed to the published version of the manuscript.
Funding
This research received no external funding.
Institutional Review Board Statement
Not applicable.
Informed Consent Statement
Not applicable.
Data Availability Statement
Data sharing is not applicable to this article.
Conflicts of Interest
The authors declare no conflict of interest.
References
- IEA. World Energy Outlook. 2020. Available online: https://www.iea.org/reports/world-energy-outlook-2020 (accessed on 12 July 2021).
- Pérez-Lombard, L.; Ortiz, J.; Pout, C. A review on buildings energy consumption information. Energy Build. 2008, 40, 394–398. [Google Scholar] [CrossRef]
- Tooke, T.R.; van der Laan, M.; Coops, N.C. Mapping demand for residential building thermal energy services using airborne LiDAR. Appl. Energy 2014, 127, 125–134. [Google Scholar] [CrossRef]
- International Renewable Energy Agency. Renewable Energy in District Heating and Cooling a Sector Roadmap for Remap; International Renewable Energy Agency: Abu Dhabi, United Arab Emirates, 2017. [Google Scholar]
- Nussbaumer, T.; Thalmann, S. Influence of system design on heat distribution costs in district heating. Energy 2016, 101, 496–505. [Google Scholar] [CrossRef]
- Lund, H.; Werner, S.; Wiltshire, R.; Svendsen, S.; Thorsen, J.E.; Hvelplund, F.; Mathiesen, B.V. 4th Generation District Heating (4GDH): Integrating smart thermal grids into future sustainable energy systems. Energy 2014, 68, 1–11. [Google Scholar] [CrossRef]
- Østergaard, D.; Svendsen, S. Space heating with ultra-low-temperature district heating—A case study of four single-family houses from the 1980s. Energy Procedia 2017, 116, 226–235. [Google Scholar] [CrossRef]
- Jansen, S.; Mohammadi, S.; Bokel, R. Developing a locally balanced energy system for an existing neighbourhood, using the ‘Smart Urban Isle’ approach. Sustain. Cities Soc. 2021, 64, 102496. [Google Scholar] [CrossRef]
- Buffa, S.; Cozzini, M.; D’Antoni, M.; Baratieri, M.; Fedrizzi, R. 5th generation district heating and cooling systems: A review of existing cases in Europe. Renew. Sustain. Energy Rev. 2019, 104, 504–522. [Google Scholar] [CrossRef]
- Boesten, S.; Ivens, W.; Dekker, S.C.; Eijdems, H. 5th generation district heating and cooling systems as a solution for renewable urban thermal energy supply. Adv. Geosci. 2019, 49, 129–136. [Google Scholar] [CrossRef] [Green Version]
- Lund, H.; Østergaard, P.A.; Nielsen, T.B.; Werner, S.; Thorsen, J.E.; Gudmundsson, O.; Arabkoohsar, A.; Mathiesen, B.V. Perspectives on fourth and fifth generation district heating. Energy 2021, 227, 120520. [Google Scholar] [CrossRef]
- Gartland, D. Dublin City Spatial Energy Demand Analysis; Codema in Association with Dublin City Council 2015; Codema: Dublin, Ireland, 2015. [Google Scholar]
- Connolly, D.; Lund, H.; Mathiesen, B.V.; Werner, S.; Möller, B.; Persson, U.; Boermans, T.; Trier, D.; Østergaard, P.A.; Nielsen, S. Heat roadmap Europe: Combining district heating with heat savings to decarbonise the EU energy system. Energy Policy 2014, 65, 475–489. [Google Scholar] [CrossRef]
- Möller, B.; Wiechers, E.; Persson, U.; Grundahl, L.; Connolly, D. Heat Roadmap Europe: Identifying local heat demand and supply areas with a European thermal atlas. Energy 2018, 158, 281–292. [Google Scholar] [CrossRef]
- David, A.; Mathiesen, B.V.; Averfalk, H.; Werner, S.; Lund, H. Heat Roadmap Europe: Large-scale electric heat pumps in district heating systems. Energies 2017, 10, 578. [Google Scholar] [CrossRef] [Green Version]
- Morvaj, B.; Evins, R.; Carmeliet, J. Optimising urban energy systems: Simultaneous system sizing, operation and district heating network layout. Energy 2016, 116, 619–636. [Google Scholar] [CrossRef]
- Wang, D.; Orehounig, K.; Carmeliet, J. Investigating the potential for district heating networks with locally integrated solar thermal energy supply. Energy Procedia 2017, 122, 1057–1062. [Google Scholar] [CrossRef]
- Törnros, T.; Resch, B.; Rupp, M.; Gündra, H. Geospatial analysis of the building heat demand and distribution losses in a district heating network. Int. J. Geo-Inf. 2016, 5, 219. [Google Scholar] [CrossRef] [Green Version]
- Chicherin, S.; Anvari-Moghaddam, A. Adjusting heat demands using the operational data of district heating systems. Energy 2021, 235, 121368. [Google Scholar] [CrossRef]
- Björnebo, L.; Spatari, S.; Gurian, P.L. A greenhouse gas abatement framework for investment in district heating. Appl. Energy 2018, 211, 1095–1105. [Google Scholar] [CrossRef]
- Arabkoohsar, A.; Alsagri, A.S. A new generation of district heating system with neighborhood-scale heat pumps and advanced pipes, a solution for future renewable-based energy systems. Energy 2020, 193, 116781. [Google Scholar] [CrossRef]
- Volkova, A.; Masatin, V.; Siirde, A. Methodology for evaluating the transition process dynamics towards 4th generation district heating networks. Energy 2018, 150, 253–261. [Google Scholar] [CrossRef]
- Jangsten, M.; Lindholm, T.; Dalenbäck, J.O. Analysis of operational data from a district cooling system and its connected buildings. Energy 2020, 203, 117844. [Google Scholar] [CrossRef]
- Dominkovic, D.F.; Stunjek, G.; Blanco, I.; Madsen, H.; Krajacic, G. Technical, economic and environmental optimization of district heating expansion in an urban agglomeration. Energy 2020, 197, 117243. [Google Scholar] [CrossRef]
- Dorotic, H.; Puksec, T.; Duic, N. Multi-objective optimization of district heating and cooling systems for a one-year time horizon. Energy 2019, 169, 319e28. [Google Scholar] [CrossRef]
- Kazagic, A.; Merzic, A.; Redzic, E.; Tresnjo, D. Optimization of modular district heating solution based on CHP and RES—Demonstration case of the Municipality of Visoko. Energy 2019, 181, 56–65. [Google Scholar] [CrossRef]
- Jebamalai, J.M.; Marlein, K.; Laverge, J. Influence of centralized and distributed thermal energy storage on district heating network design. Energy 2020, 202, 117689. [Google Scholar] [CrossRef]
- Junussova, L.; Zhuikov, A.; Matiushenko, A.; Chicherin, S.; Ilicheva, A. Assessing building energy efficiency with the help of specific heat demand characteristics: Boreal regions of Russia case study. E3S Web Conf. 2020, 208. [Google Scholar] [CrossRef]
- Harney, P.; Gartland, D.; Murphy, F. Determining the optimum low-temperature district heating network design for a secondary network supplying a low energy use apartment block in Ireland. Energy 2020, 192, 116595. [Google Scholar] [CrossRef]
- Fry, N.A. Building-level heat demand mapping of commercial-residential areas for simulated district heating assessments in Montana, Idaho, and Washington. Energy Build. 2021, 245, 111075. [Google Scholar] [CrossRef]
- Chartered Institution of Building Services Engineers. CIBSE TM46; Chartered Institution of Building Services Engineers: London, UK, 2008. [Google Scholar]
- Hanmer, C.; Shipworth, M.; Shipworth, D.; Carter, E. How household thermal routines shape UK home heating demand patterns. Energy Effic. 2019, 12, 5–17. [Google Scholar] [CrossRef] [Green Version]
- Franzoi, N.; Prada, A.; Verones, S.; Baggio, P. Enhancing PV self-consumption through energy communities in heating-dominated climates. Energies 2021, 14, 4165. [Google Scholar] [CrossRef]
- Mbiydzenyuy, G.; Nowaczyk, S.; Knutsson, H.; Vanhoudt, D.; Brage, J.; Calikus, E. Opportunities for machine learning in district heating. Appl. Sci. 2021, 11, 6112. [Google Scholar] [CrossRef]
- Steininger, P.; Gaderer, M.; Dawoud, B. Assessment of the annual transmission heat loss reduction of a refurbished existing building with an advanced solar selective thermal insulation system. Sustainability 2021, 13, 7336. [Google Scholar] [CrossRef]
- Manfren, M.; Nastasi, B.; Groppi, D.; Garcia, D.A. Open data and energy analytics—An analysis of essential information for energy system planning, design and operation. Energy 2020, 213, 118803. [Google Scholar] [CrossRef]
- Trinity College Dublin. About Trinity, History. 2016. Available online: http://www.tcd.ie/about/history/ (accessed on 20 May 2016).
- United Nations Environment Programme (UNEP); Copenhagen Centre on Energy Efficiency; UNHABITAT. District Energy in Cities; United Nations: New York, NY, USA, 2015. [Google Scholar]
- Vaisi, S.; Mohammadi, S.; Nastasi, B.; Javanroodi, K. A new generation of thermal energy benchmarks for university buildings. Energies 2020, 13, 6606. [Google Scholar] [CrossRef]
- Vaisi, S.; Pilla, F.; McCormack, S.J. Recommending a thermal energy benchmark based on CIBSE TM46 for typical college buildings and creating monthly energy models. Energy Build. 2018, 176, 296–309. [Google Scholar] [CrossRef]
- Estates and Facilities Department TCD. 2016. Available online: https://www.tcd.ie/Buildings/contactus.php.Cylon (accessed on 16 July 2018).
- Cylon Active Energy Management. Available online: https://cylonaem.com/energy/#v=1&t=9&c=0.1 (accessed on 11 March 2015).
Publisher’s Note: MDPI stays neutral with regard to jurisdictional claims in published maps and institutional affiliations. |
© 2021 by the authors. Licensee MDPI, Basel, Switzerland. This article is an open access article distributed under the terms and conditions of the Creative Commons Attribution (CC BY) license (https://creativecommons.org/licenses/by/4.0/).