Article

Simulation of Hydrogen-Air-Diluents Mixture Combustion in an Acceleration Tube with FlameFoam Solver

by
Mantas Povilaitis
* and
Justina Jaseliūnaitė
*
Laboratory of Nuclear Installation Safety, Lithuanian Energy Institute, Breslaujos Str. 3, LT-44403 Kaunas, Lithuania
*
Authors to whom correspondence should be addressed.
Energies 2021, 14(17), 5504; https://doi.org/10.3390/en14175504
Submission received: 5 August 2021 / Revised: 30 August 2021 / Accepted: 31 August 2021 / Published: 3 September 2021

Abstract

:
During a severe accident in a nuclear power plant, hydrogen can be generated, leading to risks of possible deflagration and containment integrity failure. To manage severe accidents, great experimental, analytical, and benchmarking efforts are being made to understand combustible gas distribution, deflagration, and detonation processes. In one of the benchmarks—SARNET H2—flame acceleration due to obstacle-induced turbulence was investigated in the ENACCEF facility. The turbulent combustion problem is overly complex because it involves coupling between fluid dynamics, mass/heat transfer, and chemistry. There are still unknowns in understanding the mechanisms of turbulent flame propagation, therefore many methods in interpreting combustion and turbulent speed are present. Based on SARNET H2 benchmark results, a two-dimensional computational fluid dynamics simulation of turbulent hydrogen flame propagation in the ENACCEF facility was performed. Four combustible mixtures with different diluents concentrations were considered—13% H2 and 0%/10%/20%/30% of diluents in air. The aim of this numerical simulation was to validate the custom-built turbulent combustion OpenFOAM solver based on the progress variable model—flameFoam. Furthermore, another objective was to perform parametric analysis in relation to turbulent speed correlations and turbulence models and interpret the k-ω SST model blending function F1 behavior during the combustion process. The obtained results show that in the simulated case all three turbulent speed correlations behave similarly and can be used to reproduce observable flame speed; also, the k-ε model provides more accurate results than the k-ω SST turbulence model. It is shown in the paper that the k-ω SST model misinterprets the sudden parameter gradients resulting from turbulent combustion.

1. Introduction

During a severe accident, the integrity of the nuclear power plant’s containment shell can be damaged, allowing radioactive materials to enter the environment [1]. The greatest threat is posed by a possible burning or even an explosion of hydrogen. Hydrogen itself can be formed by oxidation of overheated fuel, by the interaction of molten core and concrete, oxidation of metal components, and in other ways. Once combustion in the containment begins, it cannot be controlled until all the hydrogen has been consumed [2].
International research and benchmarks are carried out due to the high risk posed by hydrogen combustion. One of them was the SARNET2 (Severe Accident Research NETwork of excellence 2) project [3], during which several experiments were performed in the ENACCEF facility, among them experiments with different hydrogen-air-steam concentrations [3]. Benchmark exercises aimed to study the flame propagation and assess the ability of numerical codes to predict the effect of steam on the hydrogen premixed flame propagation as well as to evaluate the effects of turbulence.
Combustion can be modeled in several ways, with simulation of chemical processes or by omitting them and using various correlations based on phenomenology. In the first case, the combustion progress is based on chemical reactions, their rate and heat release, but modeling is challenged by the small timescales of chemical reactions and complexity resulting from the intermediate and multistage reactions, which significantly increases computational cost and complicates the process. As an alternative to chemistry, the second method can be used, even with the assumptions that do not include chemical combustion reactions; however, an accurate and convergent solution can still be expected.
Premixed combustion can be modeled using a large range of approaches, for example, eddy break up, Bray-Moss-Libby model, flame surface density, probability density functions, G-equation, renormalization group theory, Zimont’s model, etc. All of them must evaluate the basic features of turbulent premixed flames, such as wrinkling and stretching [4].
In the context of nuclear safety, practical considerations require affordable simulation costs. However, detailed modeling of turbulence and combustion chemistry is challenged by a large scale of containment volume and possible long timeframes. Therefore, it is customary to use RANS (Reynolds-averaged Navier-Stokes) turbulence treatment and simplified combustion modeling. These approaches require affordable simulation resources, and have been shown to be able to provide sufficiently accurate results in the studied conditions.
However, while being accessible, approaches using RANS and simplified combustion treatment are inherently limited. Averaged turbulence characteristics and parametrized flame dynamics is not suitable for all and every modeled situation. Therefore, these approaches need to be extensively validated for the appropriate applications to maintain an adequate level of confidence.
Significant effort has been devoted to the development and validation of the approaches based on RANS and turbulent flame speed closures in numerous international benchmarks dedicated to the hydrogen combustion in the severe accident conditions—e.g., European Union framework programme project SARNET2 [3], Nuclear Energy Agency International Standard Problem ISP-49 [5], or ETSON-MITHYGENE benchmark [6]. When comparing numerical predictions produced during these benchmarks, clear maturing of modeling and improvement of result quality, including in blind cases, can be seen with each subsequent benchmark. However, benchmark results are scarcely published in more detail, leaving an obtained level of validation somewhat ambiguous, while at the same time propagating use of the said models in industry applications.
Well-known examples of tools employing the turbulent flame speed closure approach for simplified combustion modeling are specially designed closed-source CFD tools like GASFLOW-MPI [7,8,9,10,11], or FLACS [12,13], which is widely applied for explosion simulations in various process industries, not only nuclear, as well as numerous lesser known or newer solutions, including open-source ones like P2REMICS [14]. In the discussed benchmarks along with these specialty CFD codes, a significant number of participants also use more general CFD codes (e.g., ANSYS CFX and FLUENT) and implement combustion models in-house using user-defined functions.
However, proprietary solutions are conditional on licensing, and in-house solutions usually stay private, hindering wider development and validation of practically relevant simulation approaches. In an effort to provide and adequately validate an equivalent fully open-source solution, a custom turbulent premixed combustion OpenFOAM solver—flameFoam (https://github.com/flameFoam/flameFoam accessed on 2 September 2021)—has been developed and, in addition to open and blind validation in current benchmark activities, is being retroactively validated on already available experimental data. This paper presents the numerical simulation of the ENACCEF2 facility experiments from the SARNET2 benchmark with the aim to demonstrate the validity of the simplified approach implemented in flameFoam for the given severe accident-related conditions in the acceleration tube. Furthermore, there is still no consensus on which turbulence model and turbulence speed correlation are most suited for the turbulent combustion, as it is a complex process that requires evaluation of the model used. Therefore, additional study will help to form a better view of the specific modeling situation.

2. Methodology

2.1. FlameFoam Solver

FlameFoam is a transient solver for a compressible, turbulent flow of premixed combustible gas. It is created using an open-source toolbox—OpenFOAM [15]—which uses the finite volume method for evaluating partial differential equations. FlameFoam solver basis is buoyantPimpleFoam, rhoPimpleFoam and chtMultiRegionFoam solvers. None of the existing solvers in OpenFOAM for combustion are based on a progress variable and turbulent flame speed closure approach; some of them are based on chemical kinetics. The closest to our solver is XiFoam, which is based on the regress variable and flame wrinkling factor.
The model employs Navier-Stokes equations for mass, momentum, and energy conservation, which are given below, respectively:
ρ t + Δ · ( ρ U ) = 0 ,
ρ U t + Δ · ( ρ U × U ) = · τ e f f p + ρ g ,
ρ h t + Δ · ( ρ U h ) + ρ K t + Δ · ( ρ U K ) = p t + · ( α e f f h ) + ρ ( g · U ) + S h ( S c )
The combustion process is characterized by a progress variable (c = 1 in the burned gas and c = 0 in the unburned gas):
c = Y 0 H 2 Y H 2 Y 0 H 2 Y H 2 ,
Progress variable equation:
ρ c t + Δ · ( ρ U c ) = · ( μ E f f S c T c ) + S c ,
The latter equation is closed with the source term, which is defined according to the turbulent flame speed closure combustion model [16]:
S c = ρ u S T | c | ,
Turbulent flame speed is evaluated by three different correlations, Zimont [16]:
S T = A ( u ) 3 4 S L α u 1 4 ( l t Z ) 1 4 ,
l t Z = C D u 3 ε ,
Bradley [17]:
S T = u 0.88 ( K a   L e ) 0.3 ,
and Bray [18]:
S T = 0.875 K a 0.392 u ,
where:
u = ( 2 3 k ) 1 2 .
Karlovitz stretch factor [17]:
K a = 0.157 ( u S L ) 2 R e T 1 2 ,
R e T = u l t B ν ,
l t B = ( 3 2 ) 3 2 u 3 ε .
Laminar flame speed is calculated using Malet’s correlation [19]:
S L = S L 0 ( 1 X H 2 0 ) 4 ( T T r e f ) 2.2 ( p p r e f ) 0.5 .
For numerical simulation the k-ε and k-ω SST turbulence models were used. The latter model is the most advanced model, which demonstrates the best results under difficult flow conditions. k-ω SST uses a blending function that activates the k-ω model near the walls and the k-ε model for the potential flow.

2.2. The ENACCEF Facility

The ENACCEF facility [3] consists of two sections, the acceleration tube, which is 3.3 m long and 154 mm in diameter, and the dome, which is 1.9 m long and 726 mm in diameter (Figure 1). Nine annular obstacles are continuously installed in the acceleration tube. They are characterized by the blockage ratio:
B R = 1 ( d D ) 2
In the simulated cases, BR is equal to 0.63. The first obstacle is located at 0.638 m from the ignition point; further obstacles are spaced 0.154 m apart, their width being 2 mm. During the experiment, the combustible mixture is ignited at 138 mm from the bottom of the facility using two thin tungsten electrodes connected to a high voltage source. The flame front measurements were taken at 16 locations, while pressure was measured at 9 locations to observe the flame acceleration phenomenon.

2.3. Initial and Boundary Conditions

The initial conditions were set according to the experiment, and they are presented in Table 1. The initial concentration of diluents in the mixture determines its physical properties. Thermophysical properties of the mixtures were calculated using the Cantera tool, which is used for solving chemical kinetics, thermodynamics, and transport processes problems. The Lewis number for hydrogen-air mixtures of 10–13% H2 concentration varies from 0.34 to 0.42.
The initial turbulence intensity was assumed to be negligibly low; therefore, the initial turbulence parameters are chosen as extremely low values. Standard OpenFOAM wall functions for turbulence parameters were used (Table 2).
The facility is not vented during the experiment; therefore, a closed system was modeled, and no inlets or outlets were present. An adiabatic boundary condition at walls was used for the temperature field and a no-slip boundary condition for velocity field. The progress variable had zero gradient boundary conditions.
Combustion was initialized by setting the progress variable value to 1 in the semicircle of 2 cm radius at the ignition location. Initially, the flame propagates in the laminar and quasilaminar regimes, which are not yet accurately modeled by flameFoam, since constant laminar velocity is assumed. However, the impact of this discrepancy is expected to be limited to a shift in time of the turbulent regime onset; therefore, it should not significantly affect vertical flame profiles, which are dominated by turbulent flame propagation. When comparing pressure evolutions in time, they are shifted so that t = 0 s would correspond to the flame passing of the first obstacle, so that the less accurate initial transient would not distort results of turbulent combustion.
The courant number was selected to be lower than 0.35 to ensure the adequacy of the modeling. The solutions were considered to be converged when the residuals of pressure reached a value below 10−10 and for velocity, turbulence parameters and enthalpy at a value below 10−9.
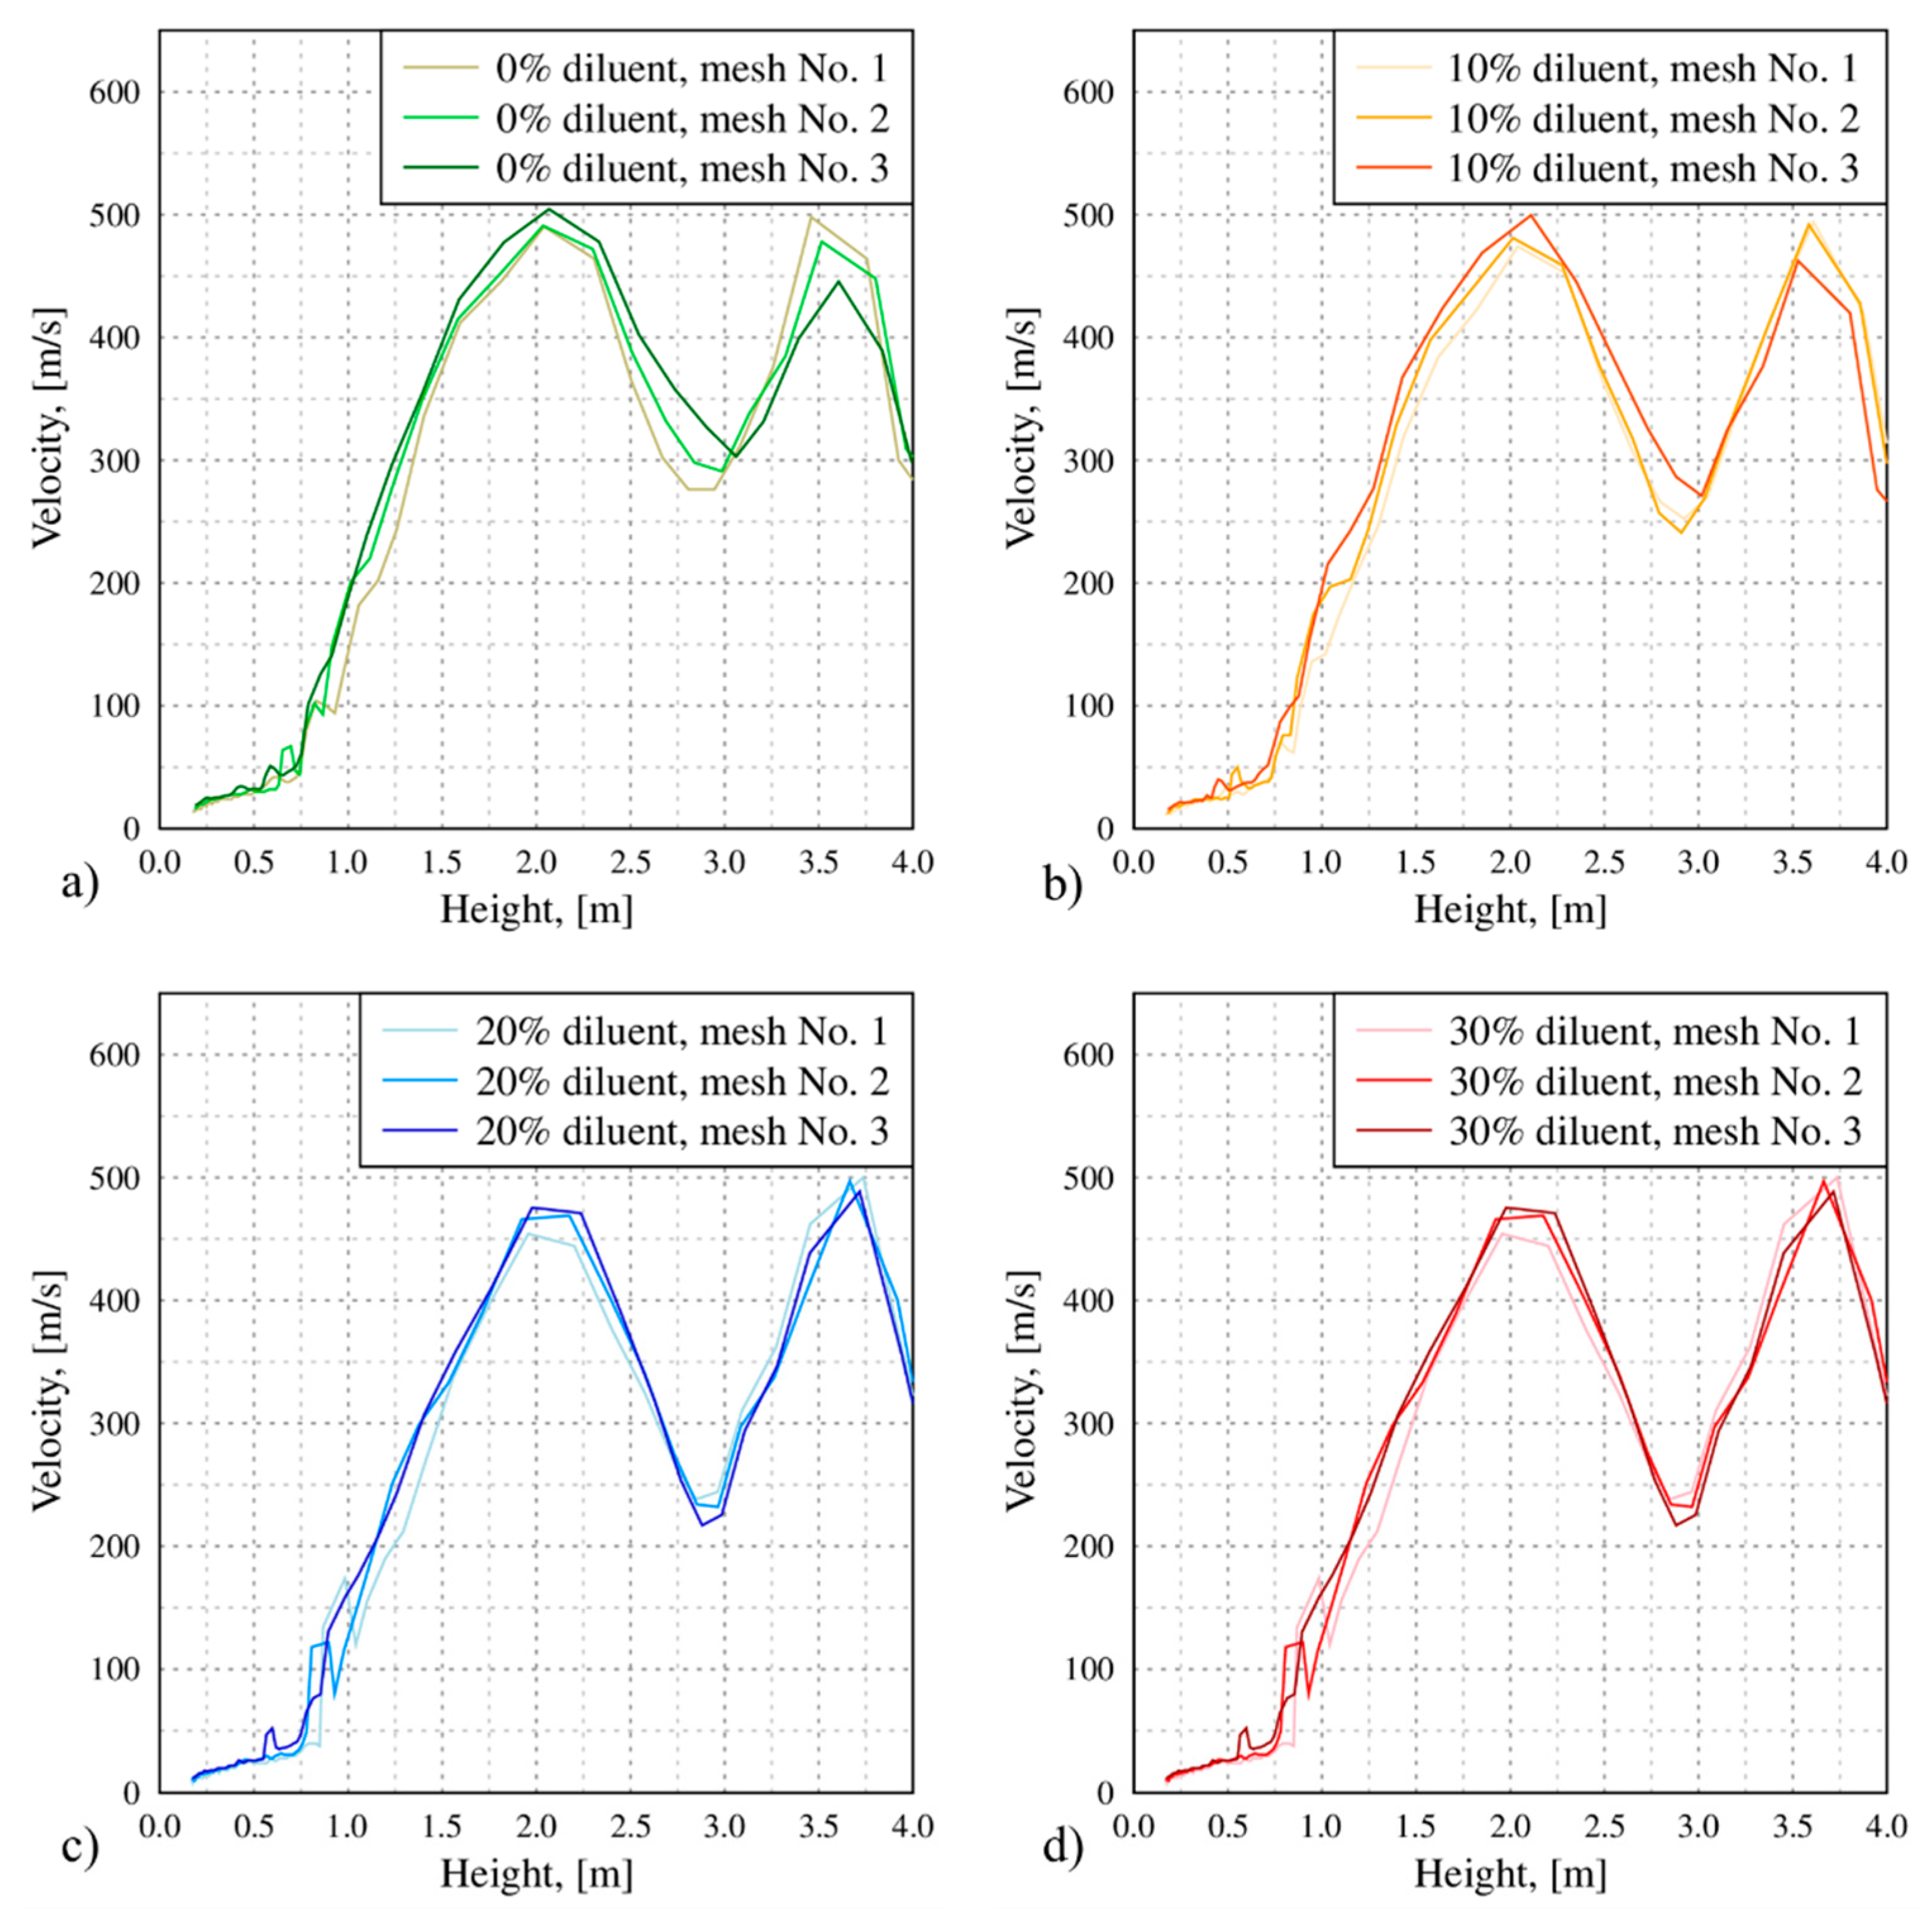
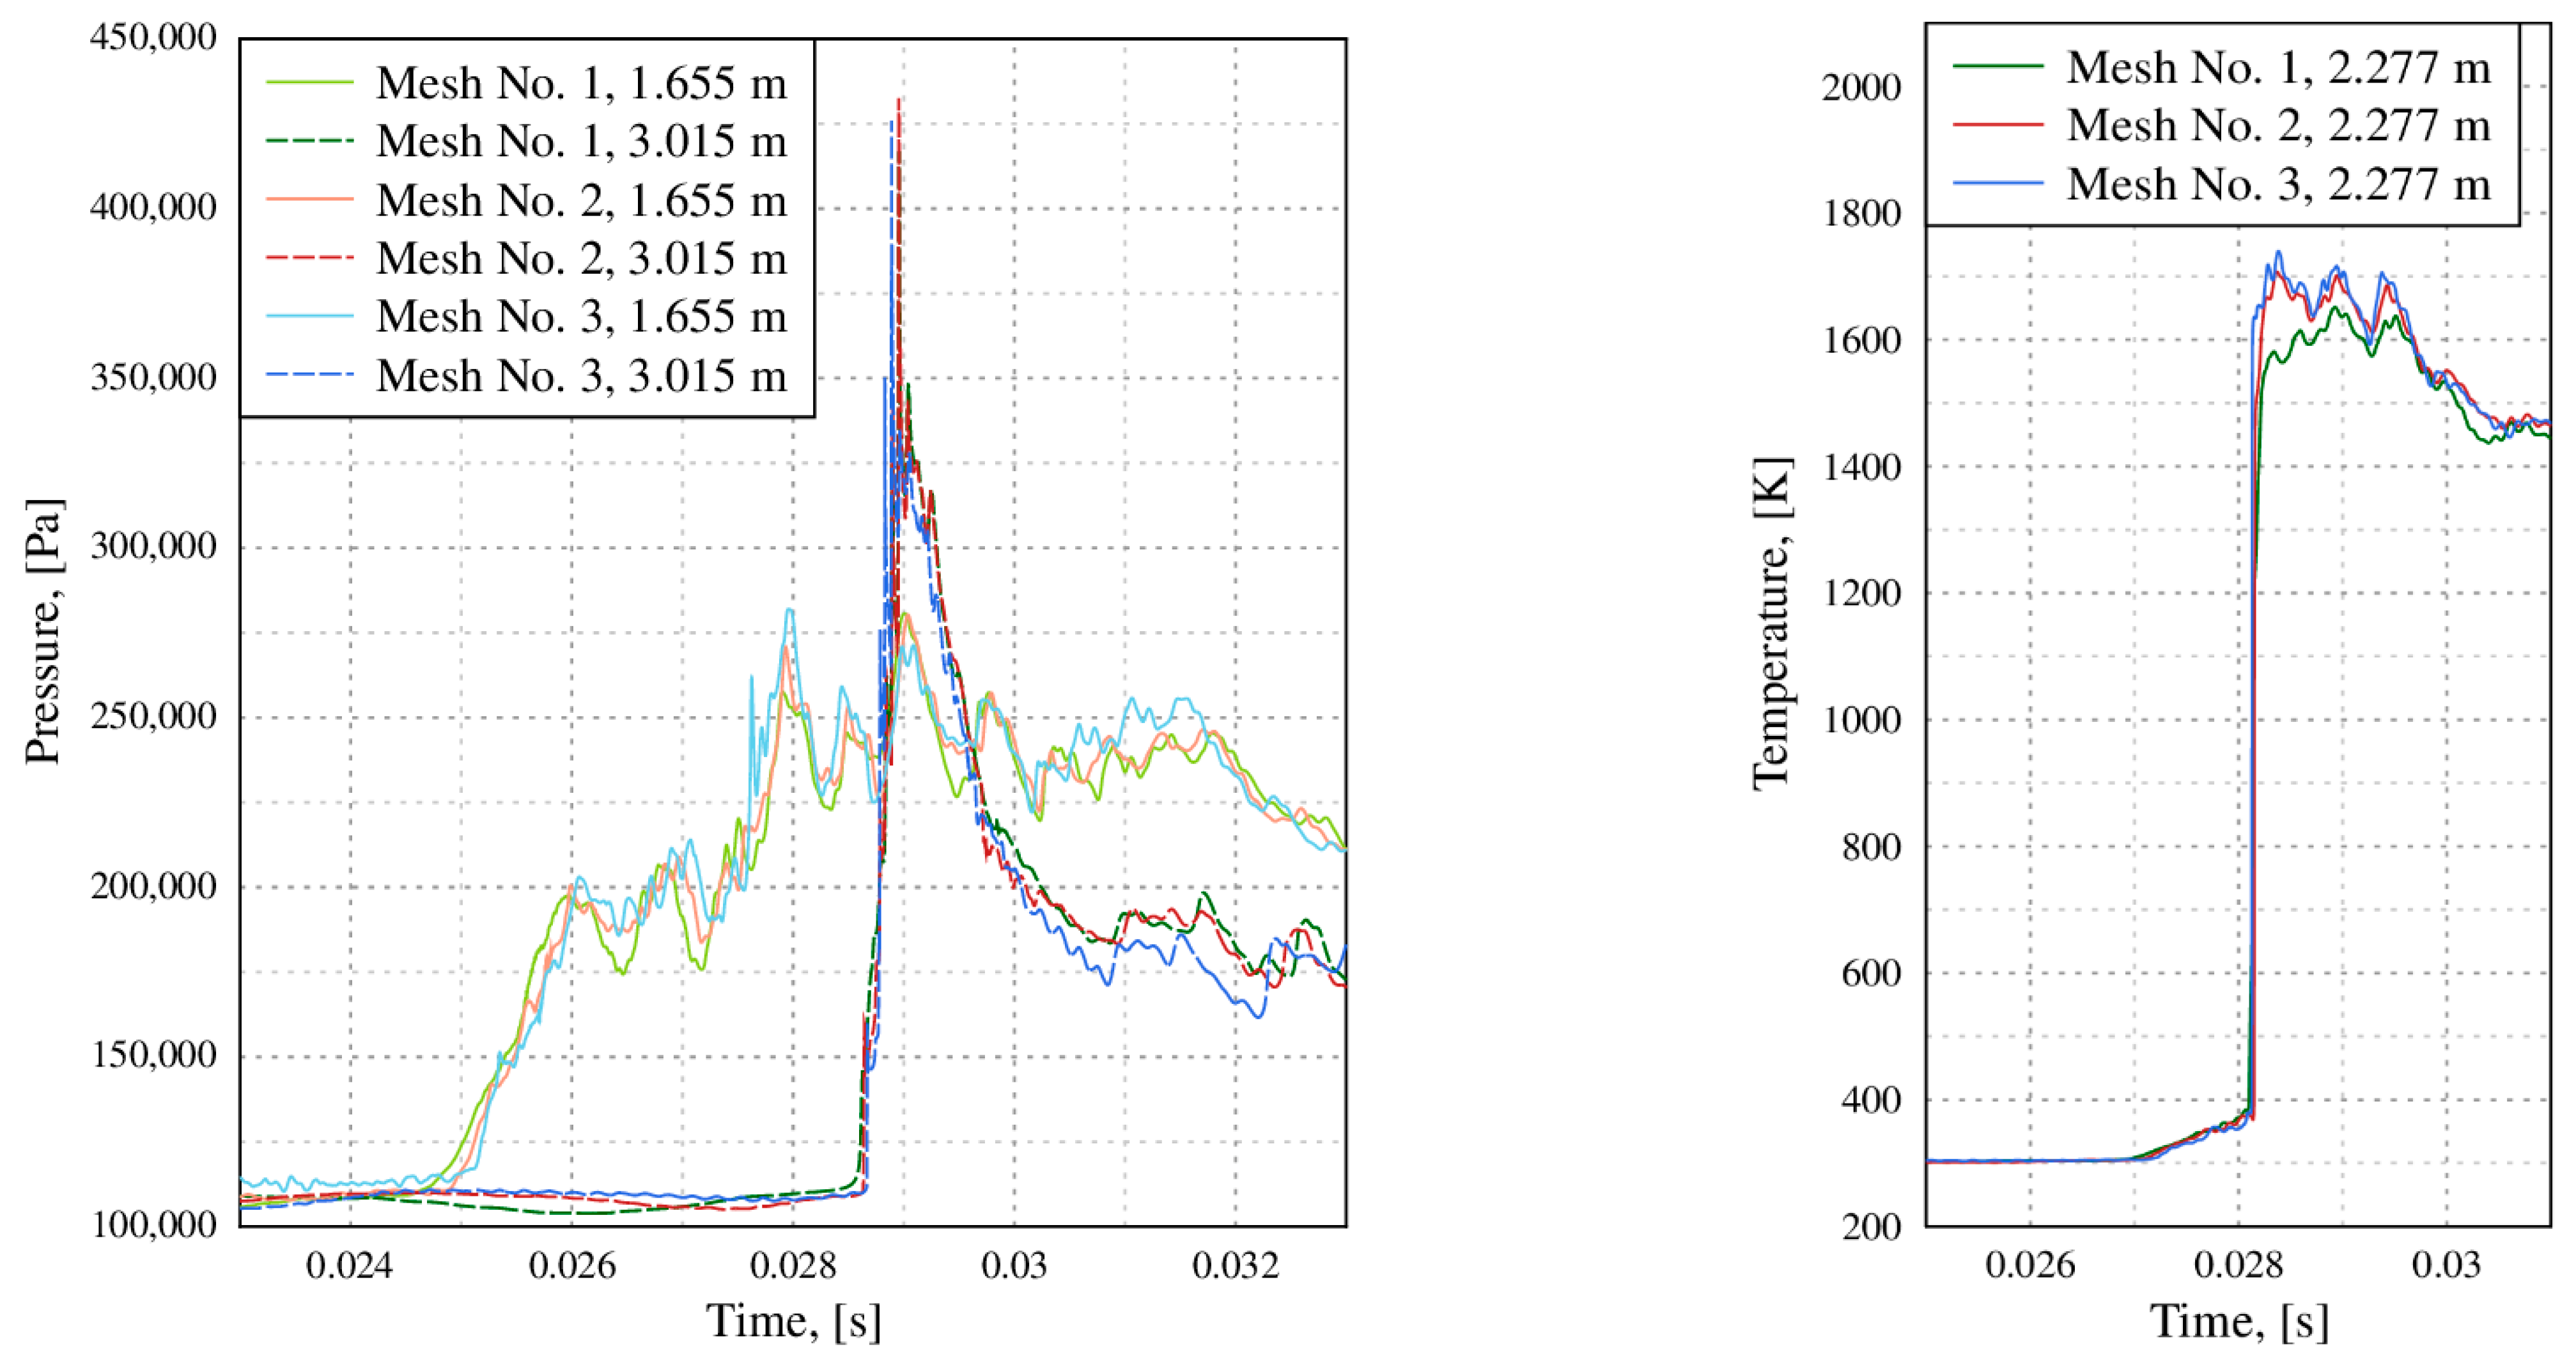
Three different meshes were selected for the analysis. The meshes are structured and consist of cells with uniform edge lengths. They were prepared according to the best practice guidelines [20]. One of them had a 2 mm cell size and 218,419 cells (see Figure 2a), another a 1 mm cell size and 877,069 cells (see Figure 2b), and the last one, 0.5 mm and 351,1676 cells (see Figure 2c). Investigation of different grids was made comparing the flame speed of the same diluent concentration mixtures. Vertical flame velocity profiles obtained with different meshes are shown in Figure 3. Presented flame velocity is the integral parameter obtained from the flame arrival times versus the facility height. It results from a number of parameters—laminar and turbulent flame velocities, turbulence parameters, and flow field in the facility, and a discrepancy in any of them could result in different vertical profiles. However, to also show low grid sensitivity of specific parameters during the whole transient, Figure 4 also presents temperature and pressure evolutions at selected test points in the 0% diluent case. Results of meshes No. 2 and No. 3 are very similar for all selected parameters. Results of mesh No 1. are also similar, except for a slightly lower maximal temperature, which means that the result sensitivity to twice refinement is low, and the mesh No. 2 is accurate enough to capture the same result.

3. Results and Discussion

3.1. Turbulence Models

Two turbulence models of the Reynolds averaged Navier-Stokes equations (RANS)—k-ε and k-ω SST—were used. Although the latter is considered one of the most advanced models, in this case, it does not correctly evaluate the speed after the flame front reaches a height of 2 m, but until then the coincidence with the experimental results is great (see Figure 5). k-ε is the most suitable for modeling the potential flow and does not fully consider the influence of the walls. Nevertheless, it managed to estimate the flame speed sufficiently well. The k-ε model slightly overestimates the flame speed from the beginning to a height of 2.2 m, approximately until the end of the obstacles. This is mainly due to the k-ε model coefficients which are empirically derived and are appropriate for fully turbulent flows, thus developing flow, where complex interaction between flame front and obstacles as well as adverse pressure gradients are observed, is predicted erroneously [21]. Furthermore, other studies show that k-ε does not achieve a good agreement with the experimental data in a complex reacting flow [22], whereas Eriksson [23] showed that in the considered case that the best prediction of turbulent combustion is obtained by using k-ω and k-ω SST models. However, there is also a study claiming that the k-ε models predict experiment well, while both standard k-ω and SST deviate considerably from the experimental data [24].
Performed simulations predict an increase of the flame velocity above the 3 m height; meanwhile, experimental data show no significant rise. This is due to the partial flame quenching at the tube exit to the dome, which happened under high turbulence conditions after the flame experienced an abrupt increase of the facility diameter. FlameFoam is not yet able to model the quenching process; consequently, the simulated flame speed rises due to the generated turbulence.
The k-ω SST model uses a blending function, F1, which activates the k-ω model near the wall (F1 = 1) and the k-ε in the free steam (F1 = 0). The k-ε model is less sensitive to free steam conditions [25]. The difference between this formulation and the original k-ω model is the additional member of the transverse diffusion in the ω equation and the different modeling constants. Model parameters are also blended using the F1 function, k-ω formulation multiplied by the F1 function, and values from the k-ε model multiplied by (1-F1).
The k-ω SST model also modifies the viscosity function of turbulent eddies to improve the flow separation prediction. In general, two-equation models such as k-ε and k-ω underestimate the effect of viscous-non-viscous flow interactions. This shortcoming is caused by the effects of turbulent stress transmission [25]. To improve modeling in the boundary layer, the second merging function is used-F2.
Figure 6 represents the behavior of the k-ω SST model F1 function, progress variable, velocity, and turbulent kinetic energy. In the beginning, at 0.025 s, the flame front was at 0.98 m, then at 0.028 s-~1.35 m, 0.03 s-1.69 m, 0.032 s-2.31 m. The last three mentioned moments show a sharp increase of velocity and turbulent kinetic energy. When the flame front passes by the obstacles, between the front and the tip of the obstacles acceleration zones are formed with locally increased turbulent kinetic energy.
Till the 0.032 s, the F1 criterion distribution remains similar to the initial, that is the value of F1 criterion is equal to 1 near the walls. It can be stated that the modeling is adequate so far. The results up to a height of 2 m correspond to the experimental ones in the k-ω SST case. However, after 0.032 s, F1 = 1 covers almost the entire channel. Consequentially, this region of the flow is then solved using the k-ω turbulence model, which is designed to simulate the boundary layer, resulting in the underestimation of velocity after the flame front passes 2 m height. The k-ω regime should be used in the boundary layer only. The flow is characterized by uneven local velocities due to varied viscosity, sudden local acceleration zones ahead of the flame front and at the tips of obstacles (mentioned earlier at 0.04 s), giving rise to misinterpretation of the employed turbulence model. It can be concluded that the k-ω SST turbulence model erroneously estimates the steep parameter gradients resulting from turbulent combustion.

3.2. Turbulent Flame Speed Correlations

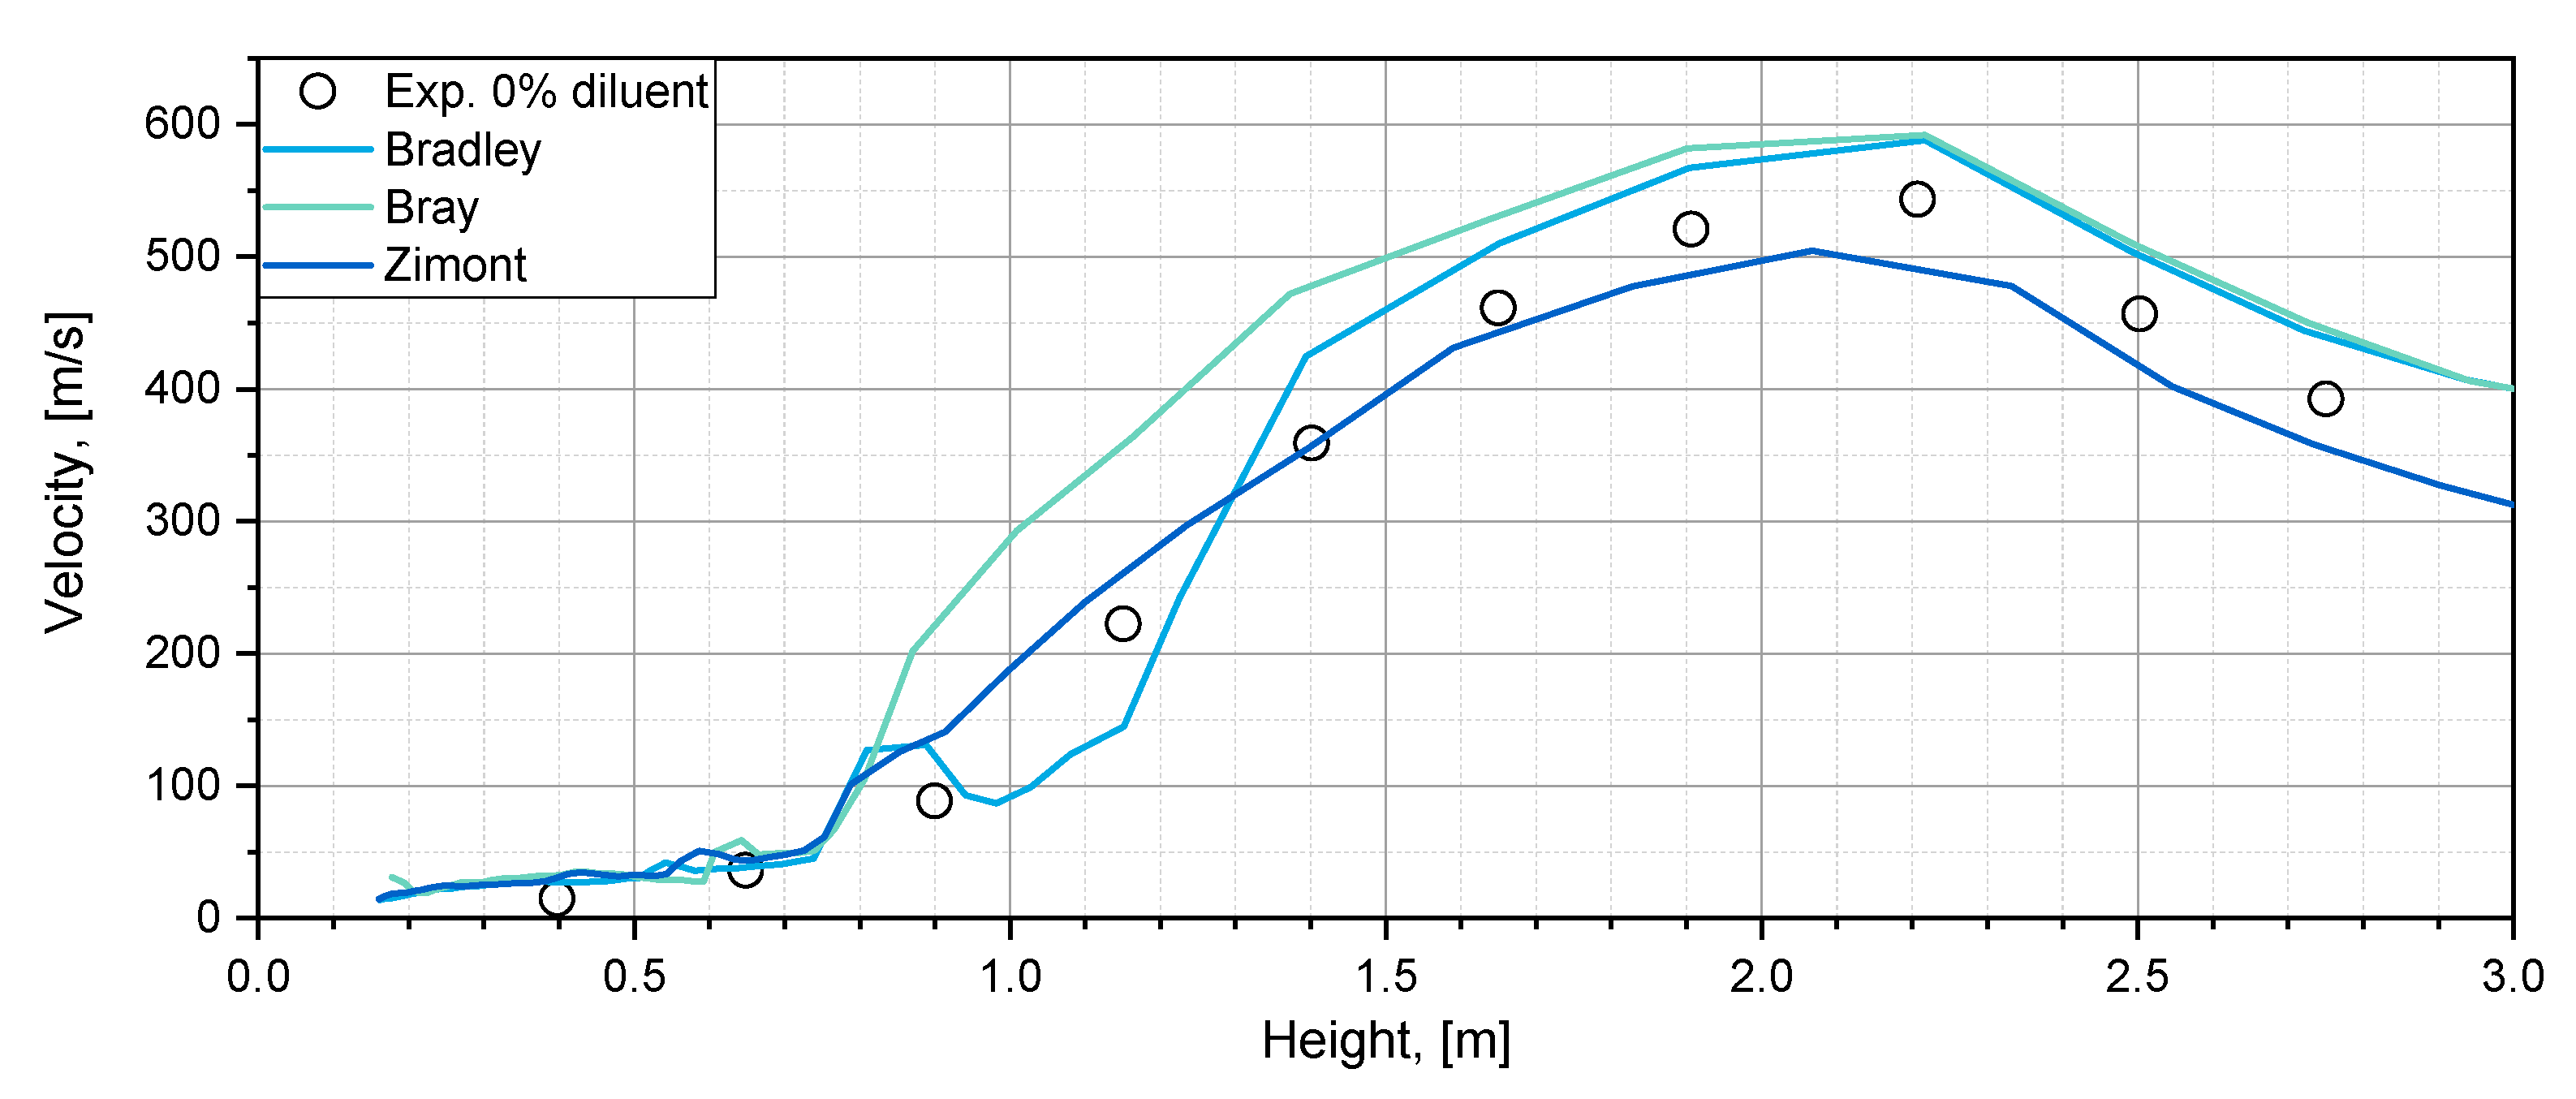
The influence of turbulent flame speed correlation is shown in Figure 7 using the k-ε model. Modeling results with the Bray correlation overestimates velocity in the acceleration phase. Bradley and Zimont correlations show similar accuracy; however, Bradley correlation overestimates velocity, while Zimont underestimates it. Higher velocities are associated with more pronounced von Karman eddies (Bray correlation) while lower speed is associated with weaker von Karman eddies (Zimont correlation). Although the Zimont correlation is one of the most widely used and well known, in this case, it does not provide more accurate results than the Bradley correlation. The Bradley correlation manages to correctly predict height of the maximum velocity. Also, from the safety point of view, it is preferable to slightly overestimate velocity values than to underestimate them.

3.3. Concentration of Diluents

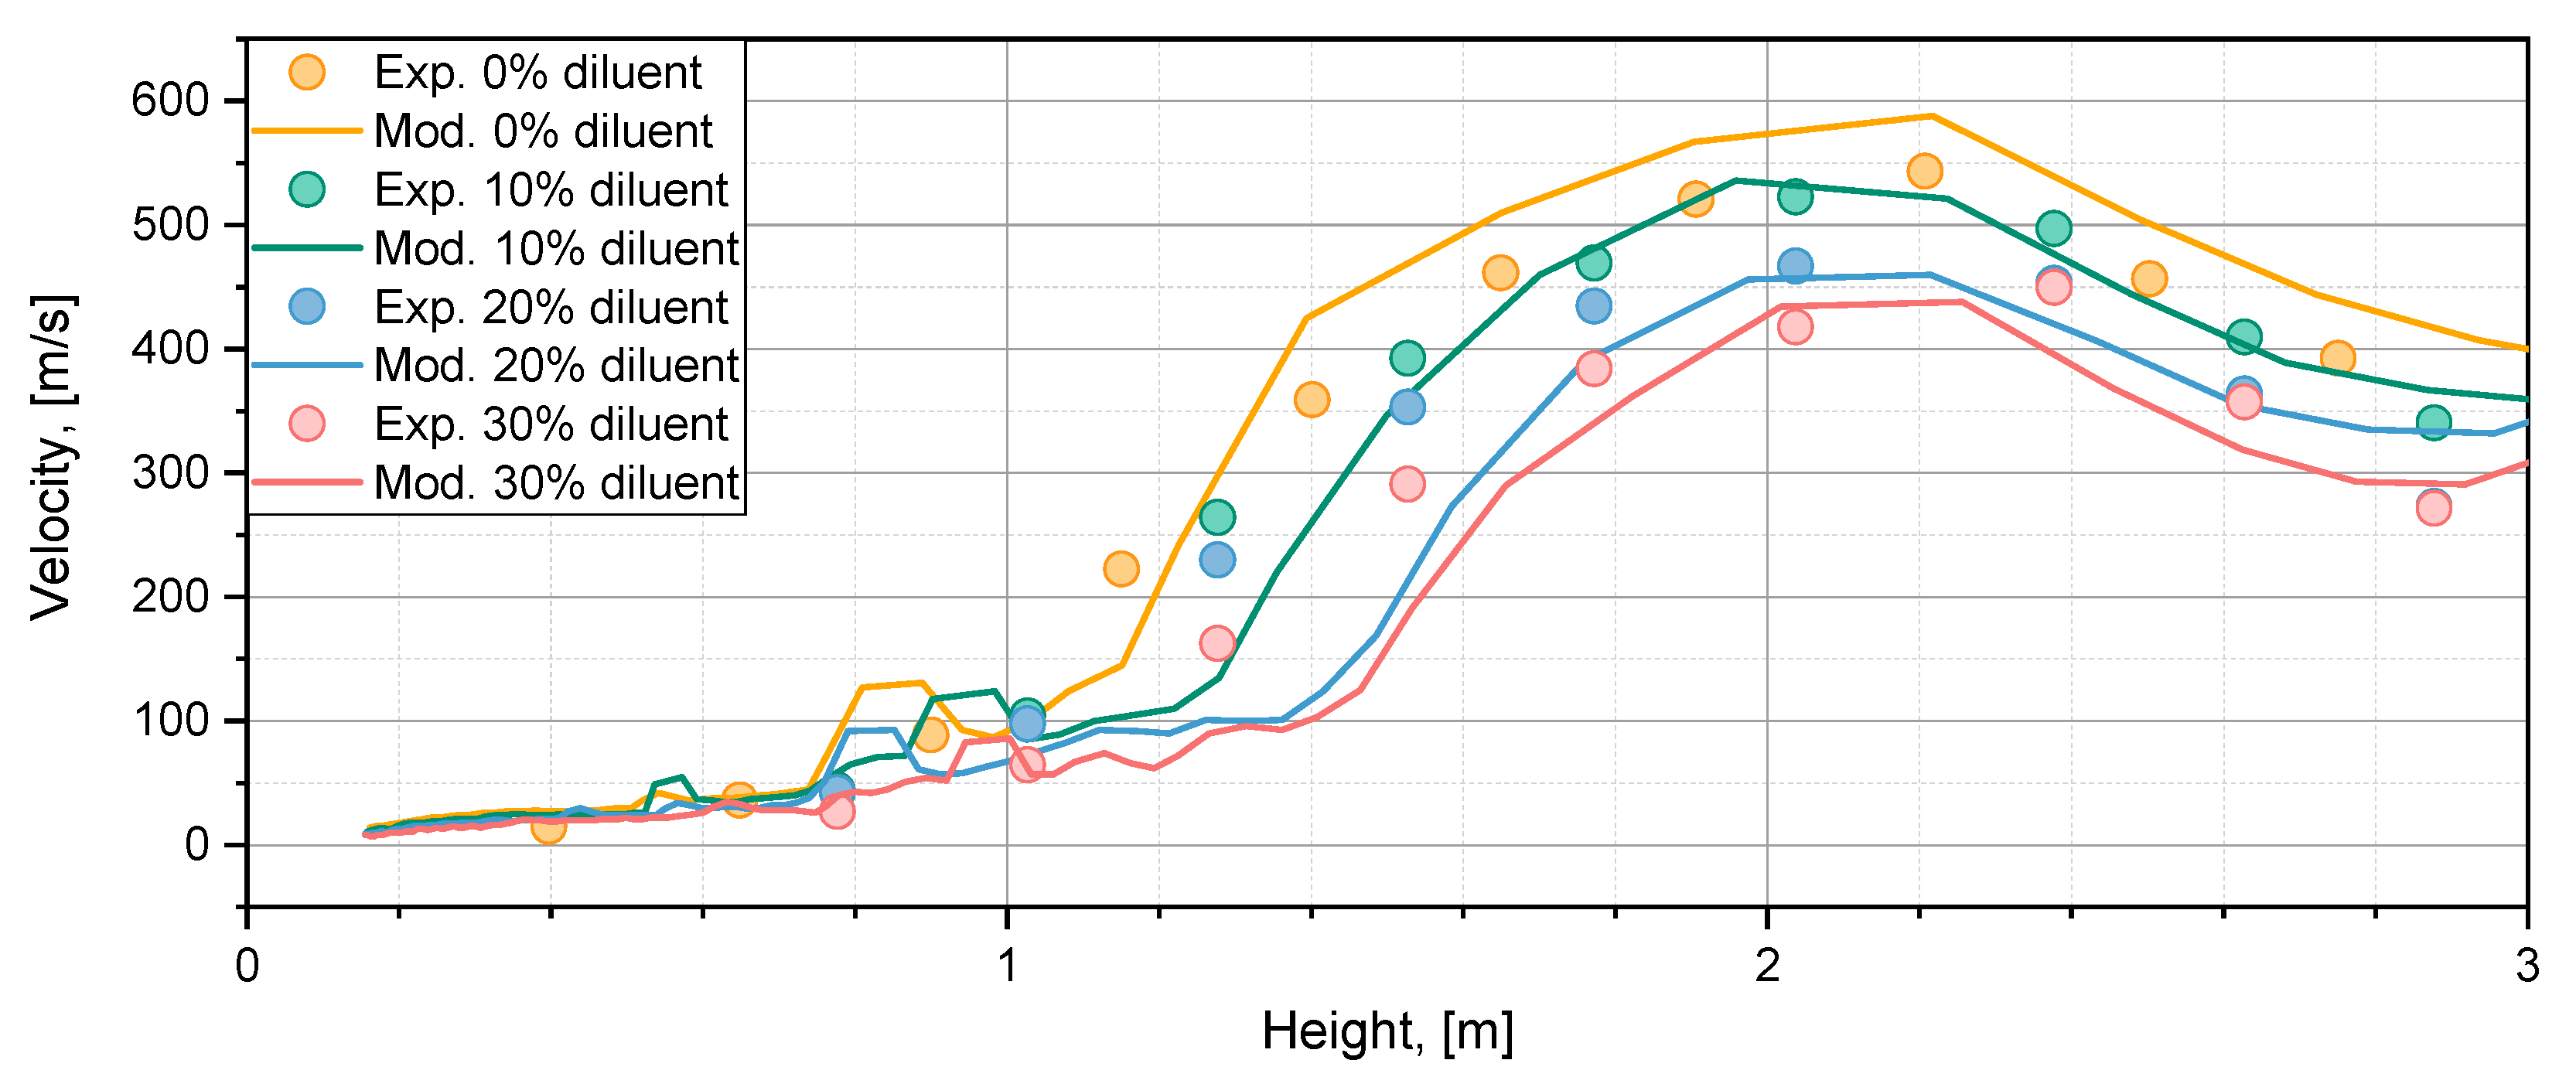
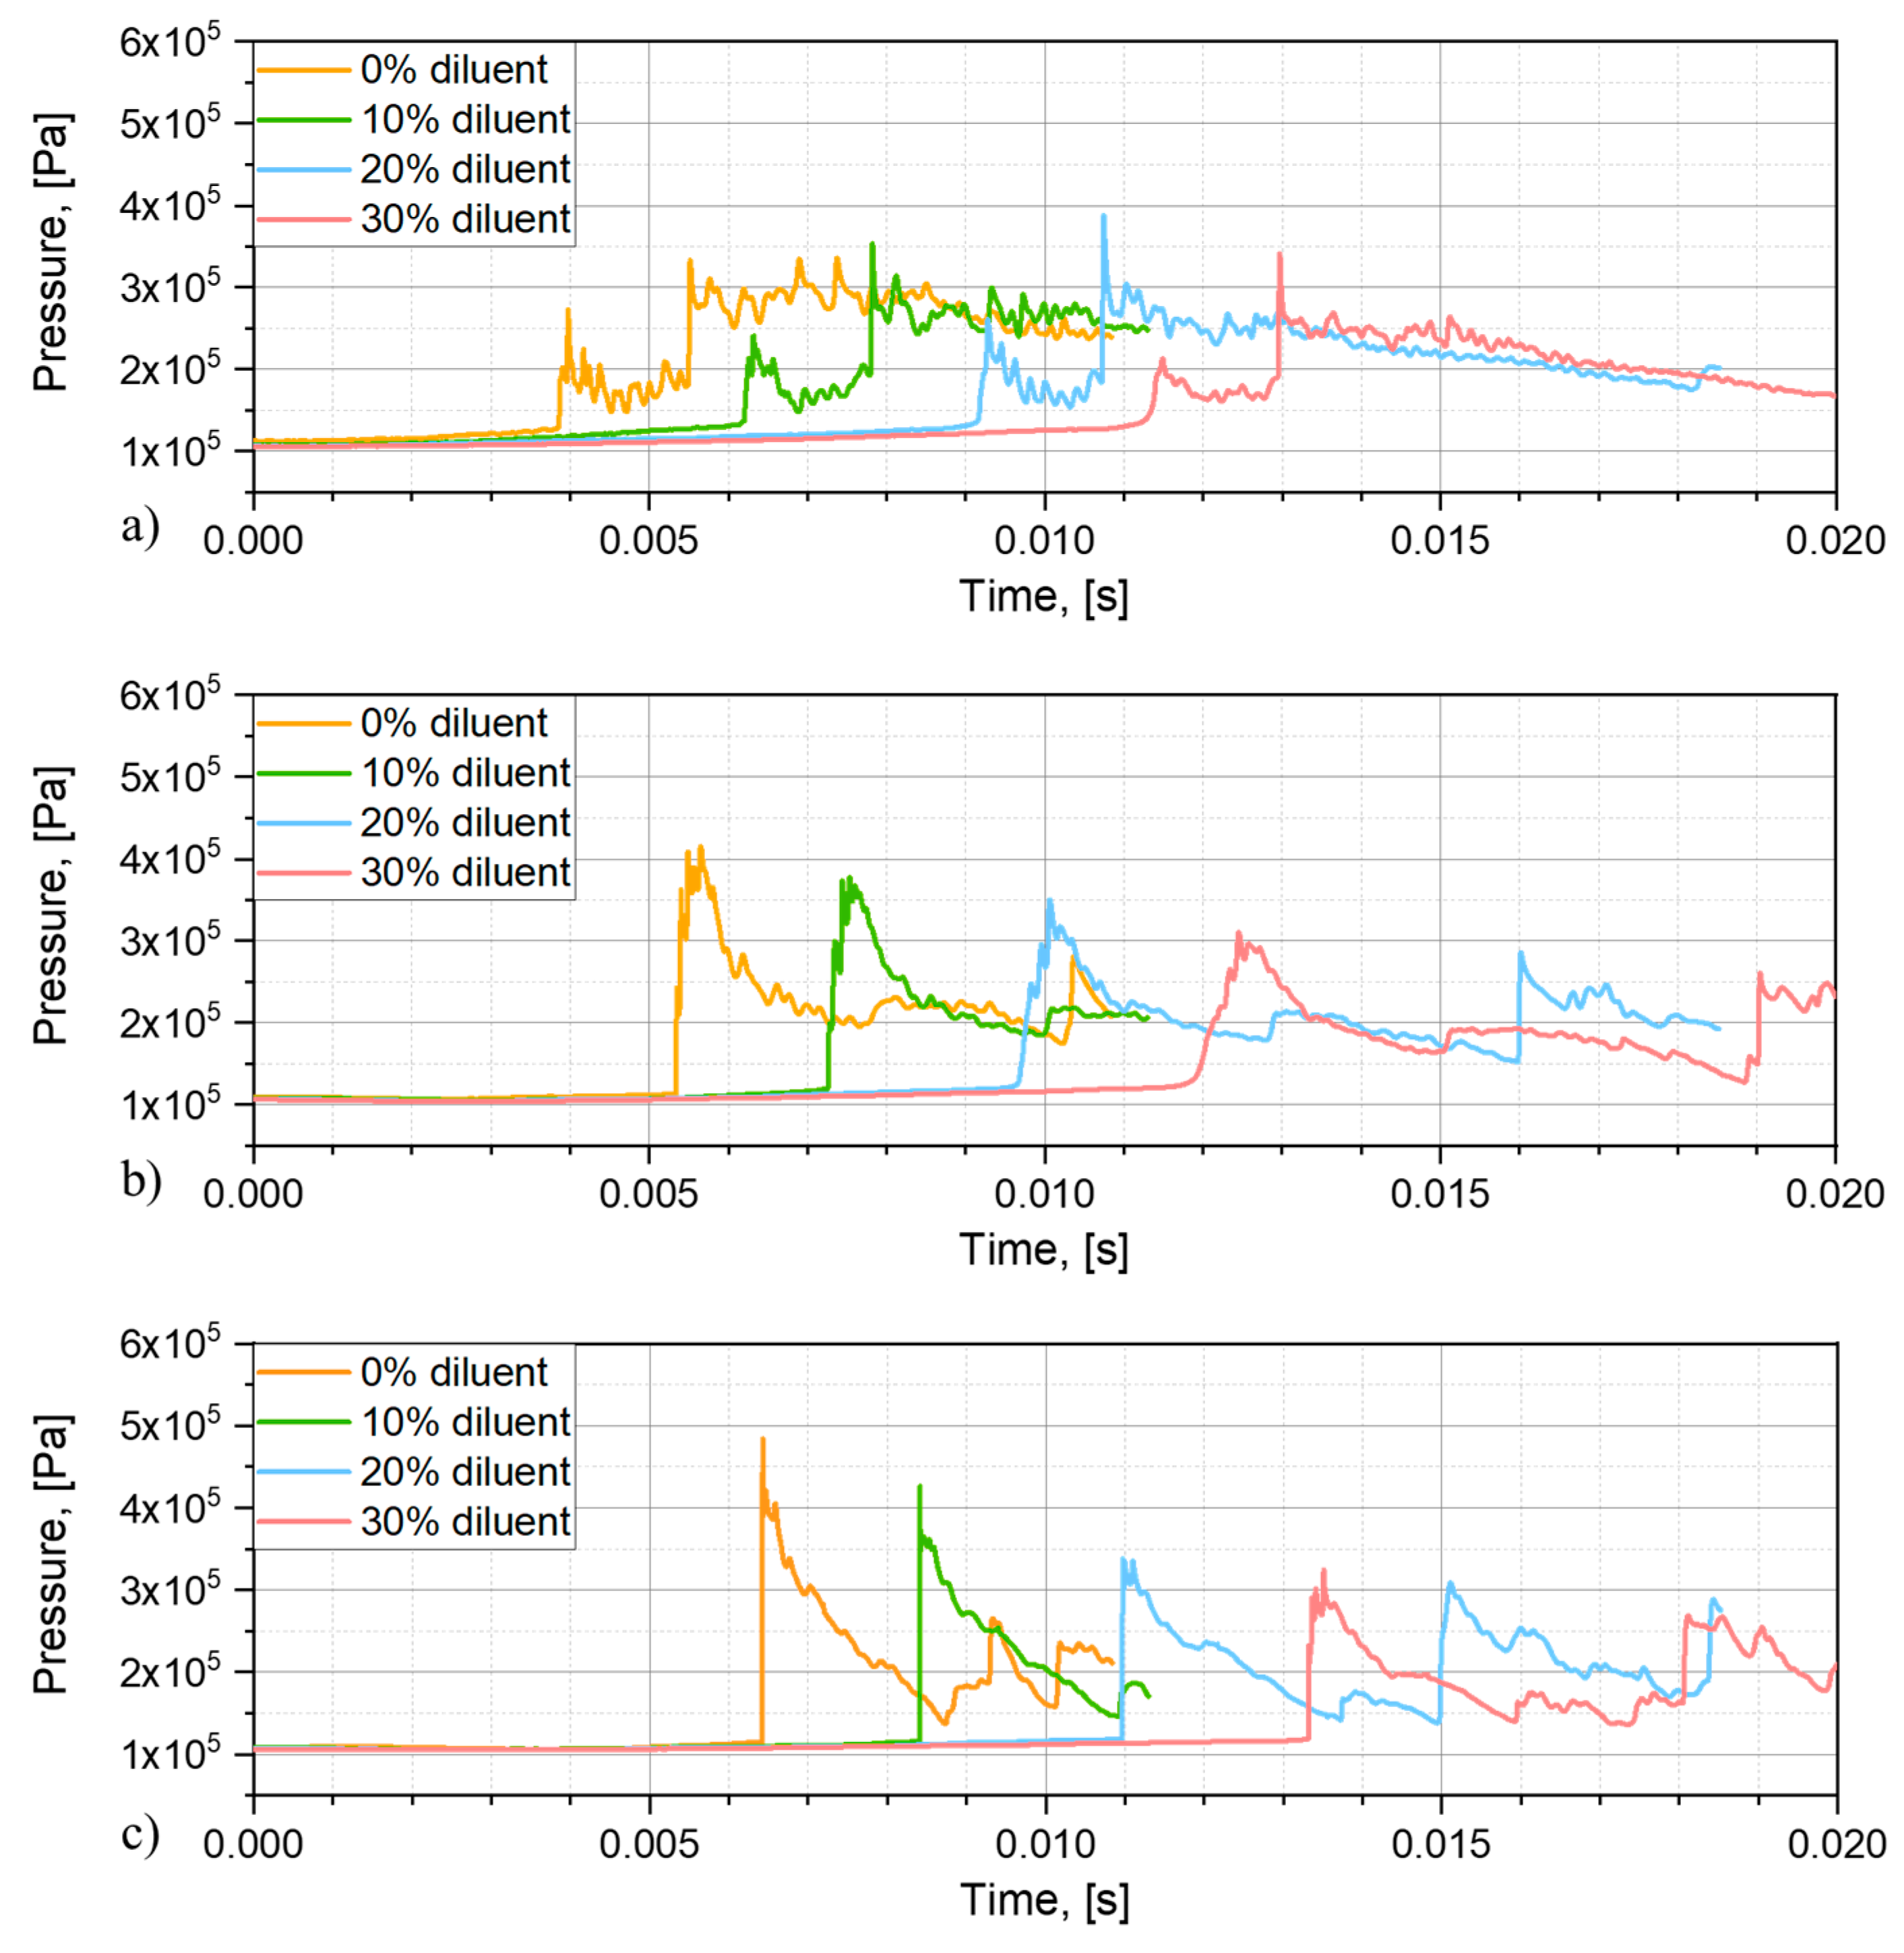
Figure 8 and Figure 9 present the turbulent flame speed propagation velocity results and the pressure evolution at different facility heights obtained with different gas compositions, respectively. Pressure results are shifted in time so that t = 0 s is when the flame passes the first obstacle. This is done to have a more clear comparison by setting the time according to transition to turbulent combustion. As the part of the diluent in the mixture increases, the rate of hydrogen combustion decreases, and the flame reaches the maximum value of velocity later. Consequently, the pressure during hydrogen combustion rises more slowly, and the maximum pressure value reached is lower. Generated pressure waves travel from the flame surface towards the facility end, where they are reflected and travel backwards. With increasing diluent fraction, pressure peaks are decreasing due to lower flame velocities.
Overall, modeling results under-predict flame velocities during the acceleration phase behind the first obstacles, where the transition to turbulent regime takes place. At higher heights, where turbulence is more intense after several more obstacles and the turbulent combustion regime—simulated by flameFoam—dominates, velocities are predicted with good accuracy. Deceleration phase behind the obstacles is predicted with decreasing accuracy due to decaying turbulence and missing quenching modeling in the solver.

4. Conclusions

An experiment of upwards flame propagation in a homogenous 13% hydrogen, 0%/10%/20%/30% steam and air mixture was simulated using a custom-built, open-source turbulent premixed combustion solver, flameFoam. In the experiment, turbulence was generated and the flame was accelerated due to obstacles.
Analysis of the turbulence model shows that the best fit was obtained using the k-ε model, while the k-ω SST model under-predicted the turbulence effect on flame propagation when the flow is fully developed. It is likely that k-ω SST would also show adequate results if the F1 criterion was properly evaluated. Different turbulent flame speed correlations—Bray, Bradley, and Zimont, perform very similarly. The overall results show that flameFoam solver was able to predict the turbulent flame propagation in the acceleration tube part of the facility after selecting appropriate parameters. It was not able to predict partial quenching, which took place after the flame exited from the tube into the dome. To enable prediction of this regime, a specific model needs to be implemented in flameFoam.

Author Contributions

Conceptualization, M.P.; methodology, M.P. and J.J.; software, M.P. and J.J.; validation, M.P. and J.J.; formal analysis, M.P. and J.J.; investigation, M.P. and J.J.; writing—original draft preparation, J.J.; writing—review and editing, M.P. and J.J.; visualization, J.J.; supervision, M.P. All authors have read and agreed to the published version of the manuscript.

Funding

This research received no external funding.

Institutional Review Board Statement

Not applicable.

Informed Consent Statement

Not applicable.

Data Availability Statement

Not applicable.

Conflicts of Interest

The authors declare no conflict of interest.

Nomenclature

A Zimont correlation constant
B R blockage ratio
C D turbulent length scale constant
c combustion progress variable
D acceleration tube inner diameter
d obstacle diameter
g gravitational acceleration
h enthalpy
K kinetic energy
k turbulent kinetic energy
l t B turbulent length scale used in Bradley and Bray correlations
l t Z turbulent length scale used in Zimont correlation
p pressure
p r e f reference pressure
S c combustion source
S h enthalpy source
S L laminar burning velocity
S L 0 reference laminar burning velocity
S T turbulent burning velocity
S c T turbulent Schmidt number
T temperature
T r e f reference temperature
t time
U velocity
u RMS of turbulent velocity fluctuation
Y 0 H 2 initial hydrogen mass fraction
Y H 2 hydrogen mass fraction
Y H 2 final hydrogen mass fraction
X H 2 O initial steam volume fraction
K a Karlovitz stretch factor
L e Lewis number
R e T turbulent Reynolds number
α e f f effective thermal diffusivity
α u molecular thermal diffusivity of fresh mixture
ε turbulent dissipation rate
μ e f f effective dynamic viscosity
ν molecular kinematic viscosity
ν t turbulent kinematic viscosity
ω specific turbulent dissipation rate
ρ mixture density
ρ u fresh mixture density
τ e f f shear stress

References

  1. Punetha, M.; Yadav, M.K.; Khandekar, S.; Sharma, P.K.; Ganju, S. Intrinsic transport and combustion issues of steam-air-hydrogen mixtures in nuclear containments. Int. J. Hydrog. Energy 2020, 45, 3340–3371. [Google Scholar] [CrossRef]
  2. International Atomic Energy Agency. Design of Reactor Containment Systems for Nuclear Power Plants; Safety Standards Series No. NS-G-1.10; IAEA: Vienna, Austria, 2004. [Google Scholar]
  3. Bentaib, A.; Bleyer, A.; Meynet, N.; Chaumeix, N.; Schramm, B.; Höhne, M.; Kostka, P.; Movahed, M.; Worapittayaporn, S.; Brähler, T.; et al. SARNET hydrogen deflagration benchmarks: Main outcomes and conclusions. Ann. Nucl. Energy 2014, 74, 143–152. [Google Scholar] [CrossRef]
  4. Giusti, A.; Mastorakos, E. Turbulent combustion modelling and experiments: Recent trends and developments. Flow Turbul. Combust. 2019, 103, 847–869. [Google Scholar] [CrossRef] [Green Version]
  5. Kotchurko, A. International Standard Problem ISP-49 on Hydrogen Deflagration; Final Report NEA/CSNI/R(2011)9; OECD: Paris, France, 2012. [Google Scholar]
  6. Bentaib, A.; Chaumeix, N.; Grosseuvres, R.; Bleyer, A.; Gastaldo, L.; Maas, L.; Jallais, S.; Vyazmina, E.; Kudriakov, S.; Studer, E.; et al. ETSON-MITHYGENE benchmark on simulations of upward flame propagation experiment in the ENACCEF2 experimental facility. In Proceedings of the International Topical Meeting on Nuclear Reactor Thermal Hydraulics, Operation and Safety, Qingdao, China, 14–18 October 2018. [Google Scholar]
  7. Xiao, J.; Travis, J.R.; Kuznetsov, M. Numerical investigations of heat losses to confinement structures from hydrogen-air turbulent flames in ENACCEF facility. Int. J. Hydrog. Energy 2015, 40, 13106–13120. [Google Scholar] [CrossRef]
  8. Xiao, J.; Breitung, W.; Kuznetsov, M.; Zhang, H.; Travis, J.R.; Redlinger, R.; Jordan, T. GASFLOW-MPI: A new 3-D parallel all-speed CFD code for turbulent dispersion and combustion simulations: Part I: Models, verification and validation. Int. J. Hydrog. Energy 2017, 42, 8346–8368. [Google Scholar] [CrossRef]
  9. Zhang, H.; Li, Y.; Xiao, J.; Jordan, T. Detached Eddy Simulation of hydrogen turbulent dispersion in nuclear containment compartment using GASFLOW-MPI. Int. J. Hydrog. Energy 2018, 29, 13659–13675. [Google Scholar] [CrossRef]
  10. Li, Y.; Xiao, J.; Zhang, H.; Breitung, W.; Travis, J.; Kuznetsov, M.; Jordan, T. Numerical analysis of hydrogen release, dispersion and combustion in a tunnel with fuel cell vehicles using all-speed CFD code GASFLOW-MPI. Int. J. Hydrog. Energy 2021, 23, 12474–12486. [Google Scholar] [CrossRef]
  11. Zhao, H.; Luo, X.; Zhang, R.; Lyu, X.; Yin, H.; Kang, Z. Analysis on hydrogen risk under LOCA in marine nuclear reactor. Exp. Comput. Multiph. Flow 2021, 1–6. [Google Scholar] [CrossRef]
  12. Lucas, M.; Skjold, T.; Hisken, H. Computational fluid dynamics simulations of hydrogen releases and vented deflagrations in large enclosures. J. Loss Prev. Process Ind. 2020, 63, 103999. [Google Scholar] [CrossRef]
  13. Lucas, M.; Atanga, G.; Hisken, H.; Mauri, L.; Skjold, T. Simulating vented hydrogen deflagrations: Improved modelling in the CFD tool FLACS-hydrogen. Int. J. Hydrog. Energy 2021, 23, 12464–12473. [Google Scholar] [CrossRef]
  14. Gastaldo, L.; Babik, F.; Duval, F.; Lapuerta, C.; Latché, J.C. Simulation of accelerated deflagration using the P2REMICS software. In Proceedings of the International Topical Meeting on Nuclear Reactor Thermal Hydraulics, Xi’an, China, 3–8 September 2017. [Google Scholar]
  15. Weller, H.G.; Tabor, G.; Jasak, H.; Fureby, C. A tensorial approach to computational continuum mechanics using object-oriented techniques. Comput. Phys. 1998, 12, 620–631. [Google Scholar] [CrossRef]
  16. Zimont, V.; Polifke, W.; Bettelini, M.; Weisenstein, W. An efficient computational model for premixed turbulent combustion at high Reynolds numbers based on a turbulent flame speed closure. J. Eng. Gas Turbine Power 1998, 120, 526–532. [Google Scholar] [CrossRef]
  17. Bradley, D.; Lau, A.K.C.; Lawes, M.; Smith, F.T. Flame stretch rate as a determinant of turbulent burning velocity. Philos. Trans. A Math. Phys. Eng. Sci. 1992, 338, 359–387. [Google Scholar]
  18. Bray, K.N.C. Studies of the turbulent burning velocity. Proc. R. Soc. A 1990, 431, 315–335. [Google Scholar]
  19. Malet, F. Etude Expérimentale et Numérique de la Propagation de Flammes Prémélangées Turbulentes Dans une Atmosphère Pauvre en Hydrogène et Humide. Ph.D. Thesis, L’Universite D’Orleans, Orléans, France, 2005. [Google Scholar]
  20. Mahaffy, J.; Chung, B.; Song, C.; Dubois, F.; Graffard, E.; Ducros, F.; Heitsch, M.; Scheuerer, M.; Henriksson, M.; Komen, E.; et al. Best Practice Guidelines for the Use of CFD in Nuclear Reactor Safety Applications; Organization for Economic Co-Operation and Development: Paris, France, 2007. [Google Scholar]
  21. Menter, F. Two-equation eddy-viscosity turbulence models for engineering applications. AIAA J. 1994, 32, 1598–1605. [Google Scholar] [CrossRef] [Green Version]
  22. Li, J.; Chou, S.K.; Yang, W.M.; Li, Z.W. Experimental and numerical study of the wall temperature of cylindrical micro combustors. J. Micromech. Microeng. 2008, 19, 015019. [Google Scholar] [CrossRef]
  23. Eriksson, P. The Zimont TFC model applied to premixed bluff body stabilized combustion using four different RANS turbulence models. Turbo Expo Power Land Sea Air 2007, 47918, 353–361. [Google Scholar]
  24. Akhtar, S.; Kurnia, J.C.; Shamim, T. A three-dimensional computational model of H2–air premixed combustion in non-circular micro-channels for a thermo-photovoltaic (TPV) application. Appl. Energy 2015, 152, 47–57. [Google Scholar] [CrossRef]
  25. Cebedi, T. Analysis of Turbulent Flows with Computer Programs; Butterworth-Heinemman: Oxford, UK, 2013. [Google Scholar]
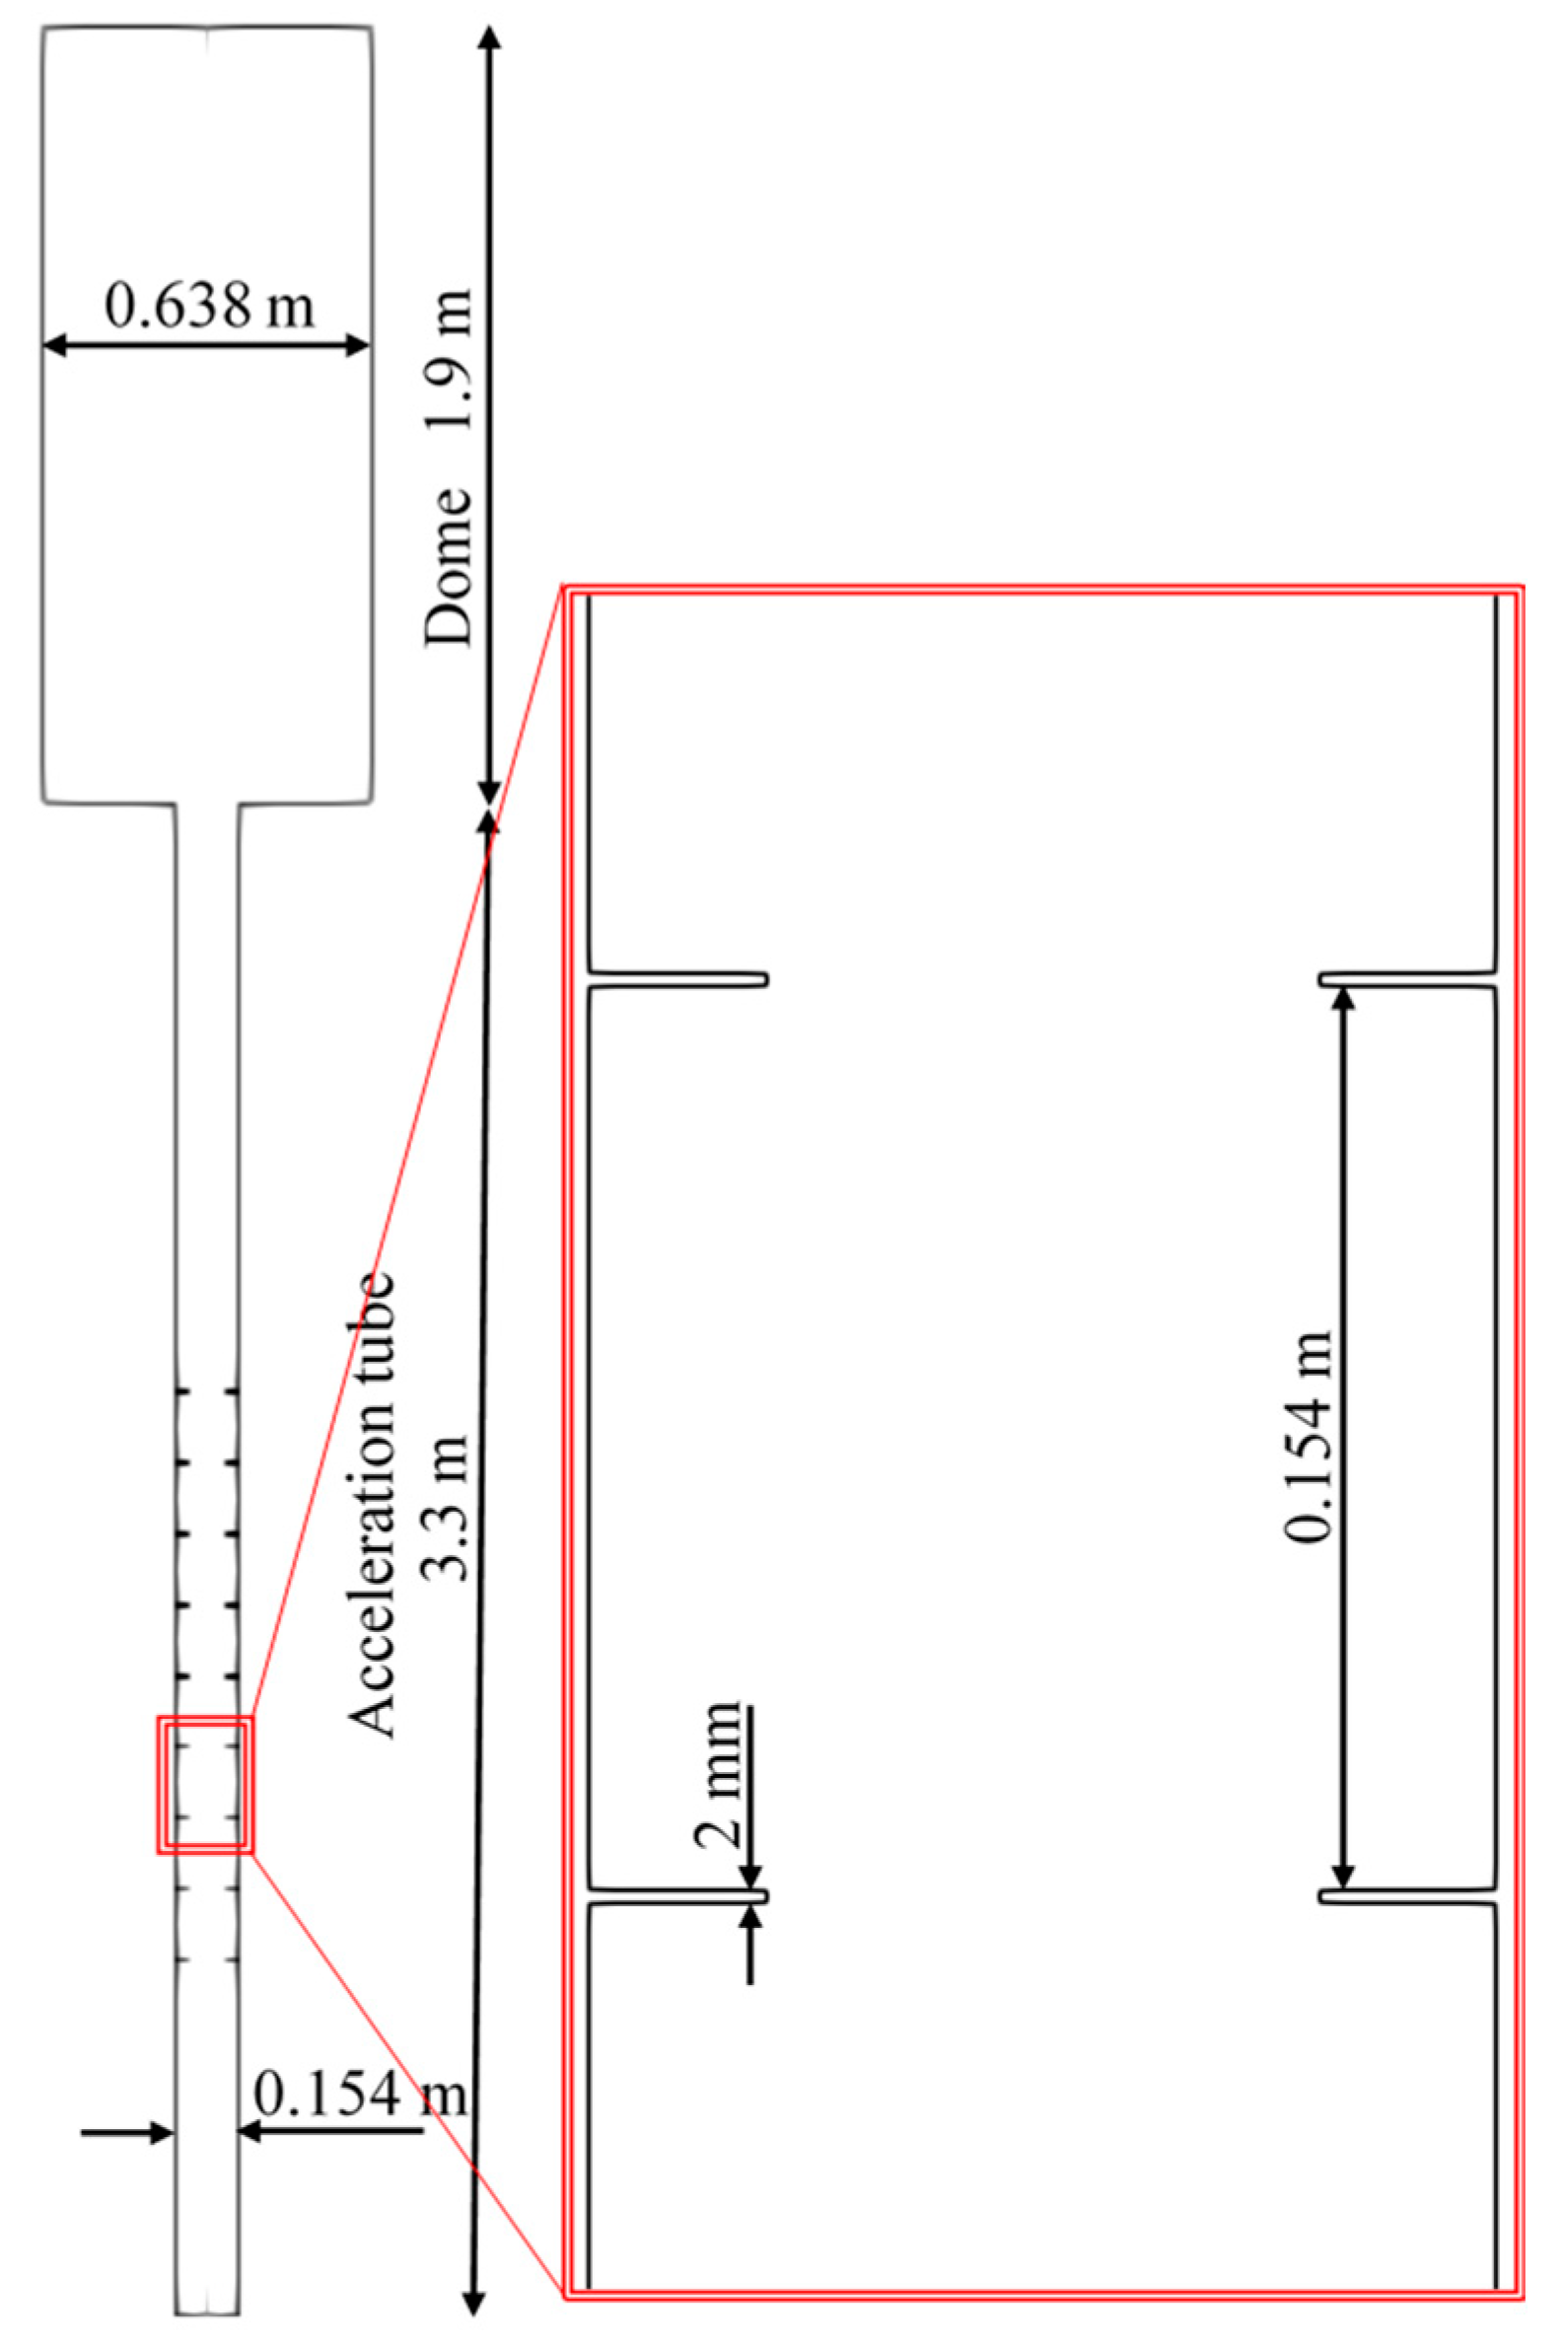
Figure 1. The scheme of the ENACCEF facility.
Energies 14 05504 g001
Figure 2. Part of the grid (a) mesh No. 1, (b) mesh No. 2, (c) mesh No. 3.
Energies 14 05504 g002
Figure 3. Comparison of meshes (a) 0% diluents, (b) 10% diluents, (c) 20% diluents, (d) 30% diluents (Zimont correlation).
Energies 14 05504 g003
Figure 4. Comparison of pressure and temperature evolutions with different meshes in selected points (0% diluents, Zimont correlation).
Energies 14 05504 g004
Figure 5. Comparison of turbulence models (Bradley correlation).
Energies 14 05504 g005
Figure 6. F1 function, progress variable, velocity, and turbulent kinetic energy fields (Bradley correlation, 0% diluents).
Energies 14 05504 g006
Figure 7. Comparison of velocity profiles obtained with different turbulent combustion correlations (k-ε case).
Energies 14 05504 g007
Figure 8. Comparison of velocity profiles for different mixtures (Bradley correlation) (experimental data [3] uncertainties not shown; they are of the mm/s order and would be indiscernible in the figure).
Energies 14 05504 g008
Figure 9. Calculated pressure evolutions at (a) 0.665 m, (b) 2.277 m, (c) 3.015 m.
Energies 14 05504 g009
Table 1. Initial data.
Initial Conditions
Pressurep105 Pa
TemperatureT263.15 K
Initial hydrogen volume fraction XH20.13
Initial H2O volume fractionXH2O0/0.1/0.2/0.3
Model Constants
Zimont constantA0.52
Turbulent Scmidt numberScT0.9
Lewis numberLe0.4
Table 2. Used wall functions.
ParameterOpenFOAM Wall FunctionDetails
kkqRWallFunctionZero gradient wrapper
εepsilonWallFunctionViscous and inertial sublayer expressions depending on y+
ωomegaWallFunctionViscous and inertial sublayer expressions depending on y+
νtnutkWallFunctionViscous and inertial sublayer expressions depending on y+, based on k
Publisher’s Note: MDPI stays neutral with regard to jurisdictional claims in published maps and institutional affiliations.