Article

A New Evaluation Method of Shale Oil Sweet Spots in Chinese Lacustrine Basin and Its Application

1
Research Institute of Exploration and Development, PetroChina Huabei Oilfield Company, Renqiu 062552, China
2
School of Geosciences, China University of Petroleum (East China), Qingdao 266580, China
3
Shandong Provincial Key Laboratory of Deep Oil and Gas, Qingdao 266580, China
*
Author to whom correspondence should be addressed.
Energies 2021, 14(17), 5519; https://doi.org/10.3390/en14175519
Submission received: 28 July 2021 / Revised: 16 August 2021 / Accepted: 25 August 2021 / Published: 3 September 2021

Abstract

:
Compared with the marine shale from North America, Chinese lacustrine basins have more complex geological and reservoir conditions, which makes the selection of sweet spot intervals in the shale oil reservoir particularly difficult. It is thus crucial to accurately predict the shale oil sweet spots for effective exploration and development of shale oil in a lacustrine basin. In this paper, we propose an innovative evaluation method of shale oil sweet spots, which considers five primary parameters (i.e., total oil content, movable oil ratio, reservoir pressure coefficient, permeability, and rock brittleness index) to construct a comprehensive weighting factor, which is used to quantitatively identify a favorable shale oil reservoir. This method firstly constructs an evaluation function for each of the parameters, and then calculates a comprehensive weighting factor to determine the shale oil sweet spot. Statistical results show that the oil production of formation testing intervals have a good positive correlation with the average value of the comprehensive weighting factor of the intervals, which verifies the feasibility of the method. Based on this method, one of the key exploratory wells, Qiang21 in the Raoyang Sag of Bohai Bay basin, was selected as a case study and was determined to be a sweet spot interval of the shale oil reservoir in the upper third member of the Shahejie Formation. This study provides a new way to obtain a favorable exploration interval of shale oil reservoirs and serves shale oil development.

1. Introduction

As a promising alternative to conventional petroleum resources, shale oil has received a lot of attention in recent years [1,2,3,4]. However, the exploration and development of shale oil is still at a relatively early stage due to the extremely great challenge of shale oil recovery [5]. Shale oil refers to the petroleum that occurs in the shale-dominated strata in a free, dissolved, or adsorbed state, of which free and adsorbed oil are the two main constituents [6,7,8]. Shale oil is the accumulation of residual hydrocarbons in organic-rich shales or juxtaposed (overlying, underlying, or embedded) organic-lean lithofacies after crude oil is expelled from source rocks, which contributes to conventional oil reserves [9,10]. Usually, shale oil underwent a primary migration over a short distance, or even underwent no migration, within the shale reservoir. Compared with the shale oil in North America, which is mainly derived from marine strata [9,11], China’s shale oil mainly comes from the mudstone–shale strata in lacustrine basins, such as the Cretaceous Qingshankou Formation in the Songliao Basin, the Triassic Yanchang Formation in the Ordos Basin, the Paleogene Shahejie Formation in the Bohai Bay Basin, and the Permian Lucaogou Formation in the Junggar Basin, among others. [12,13,14]. Lacustrine shales have the characteristics of strong anisotropy, high clay mineral content, low maturity, poor flowability of crude oil, complicated geological conditions, multiple sedimentary facies, etc. [15,16], which make the selection of sweet spot intervals of the shale oil reservoir particularly difficult. Therefore, in the process of the exploration and development of shale oil, the main challenge and research focus is to accurately predict where shale oil sweet spots develop.
Previously, several methods have been developed to evaluate shale oil sweet spots, such as the comprehensive information superposition method, seismic method, and comprehensive evaluation index method. The comprehensive information superposition method is commonly used, which considers the differences in geological conditions from different regions and selects several parameters, including the abundance and maturity of organic matter, oil content, mobility of oil, lithofacies, natural fractures, brittle mineral content, reservoir pressure, and shale thickness, to determine the final favorable area for shale oil (i.e., sweet spot) by superposing multiple geological parameters [8,17,18]. This method is suitable for an early shale oil exploration and to obtain an exploration prospect area. The seismic method usually includes the inversion prediction of total organic carbon (TOC) content, shale facies, low-dip fracture density, and rock brittleness [19]. This method predicts the distribution of shale oil sweet spots by constructing a seismic characterization model, but the vertical accuracy is not sufficient. The comprehensive evaluation index method considers the weight of each parameter [18,20,21], but the shale oil enrichment area often contains a high content of clay minerals and organic matter, which leads to a low brittleness for shale [22]. As a result, geological and engineering sweet spots cannot achieve the best match, which increases the difficulty of selecting a shale oil sweet spot.
In this paper, we propose an innovative evaluation method for determining shale oil sweet spots, which considers five primary parameters (i.e., total oil content, movable oil ratio, reservoir pressure coefficient, permeability, and rock brittleness index) to construct a comprehensive weighting factor, and which quantitatively evaluates favorable shale oil reservoirs. Based on this method, one of the key exploratory wells from Raoyang Sag of Bohai Bay basin was investigated and determined to be a sweet spot interval of the shale oil reservoir in the upper third member of the Shahejie Formation. This study provides an effective way to obtain a favorable exploration interval of a shale oil reservoir.

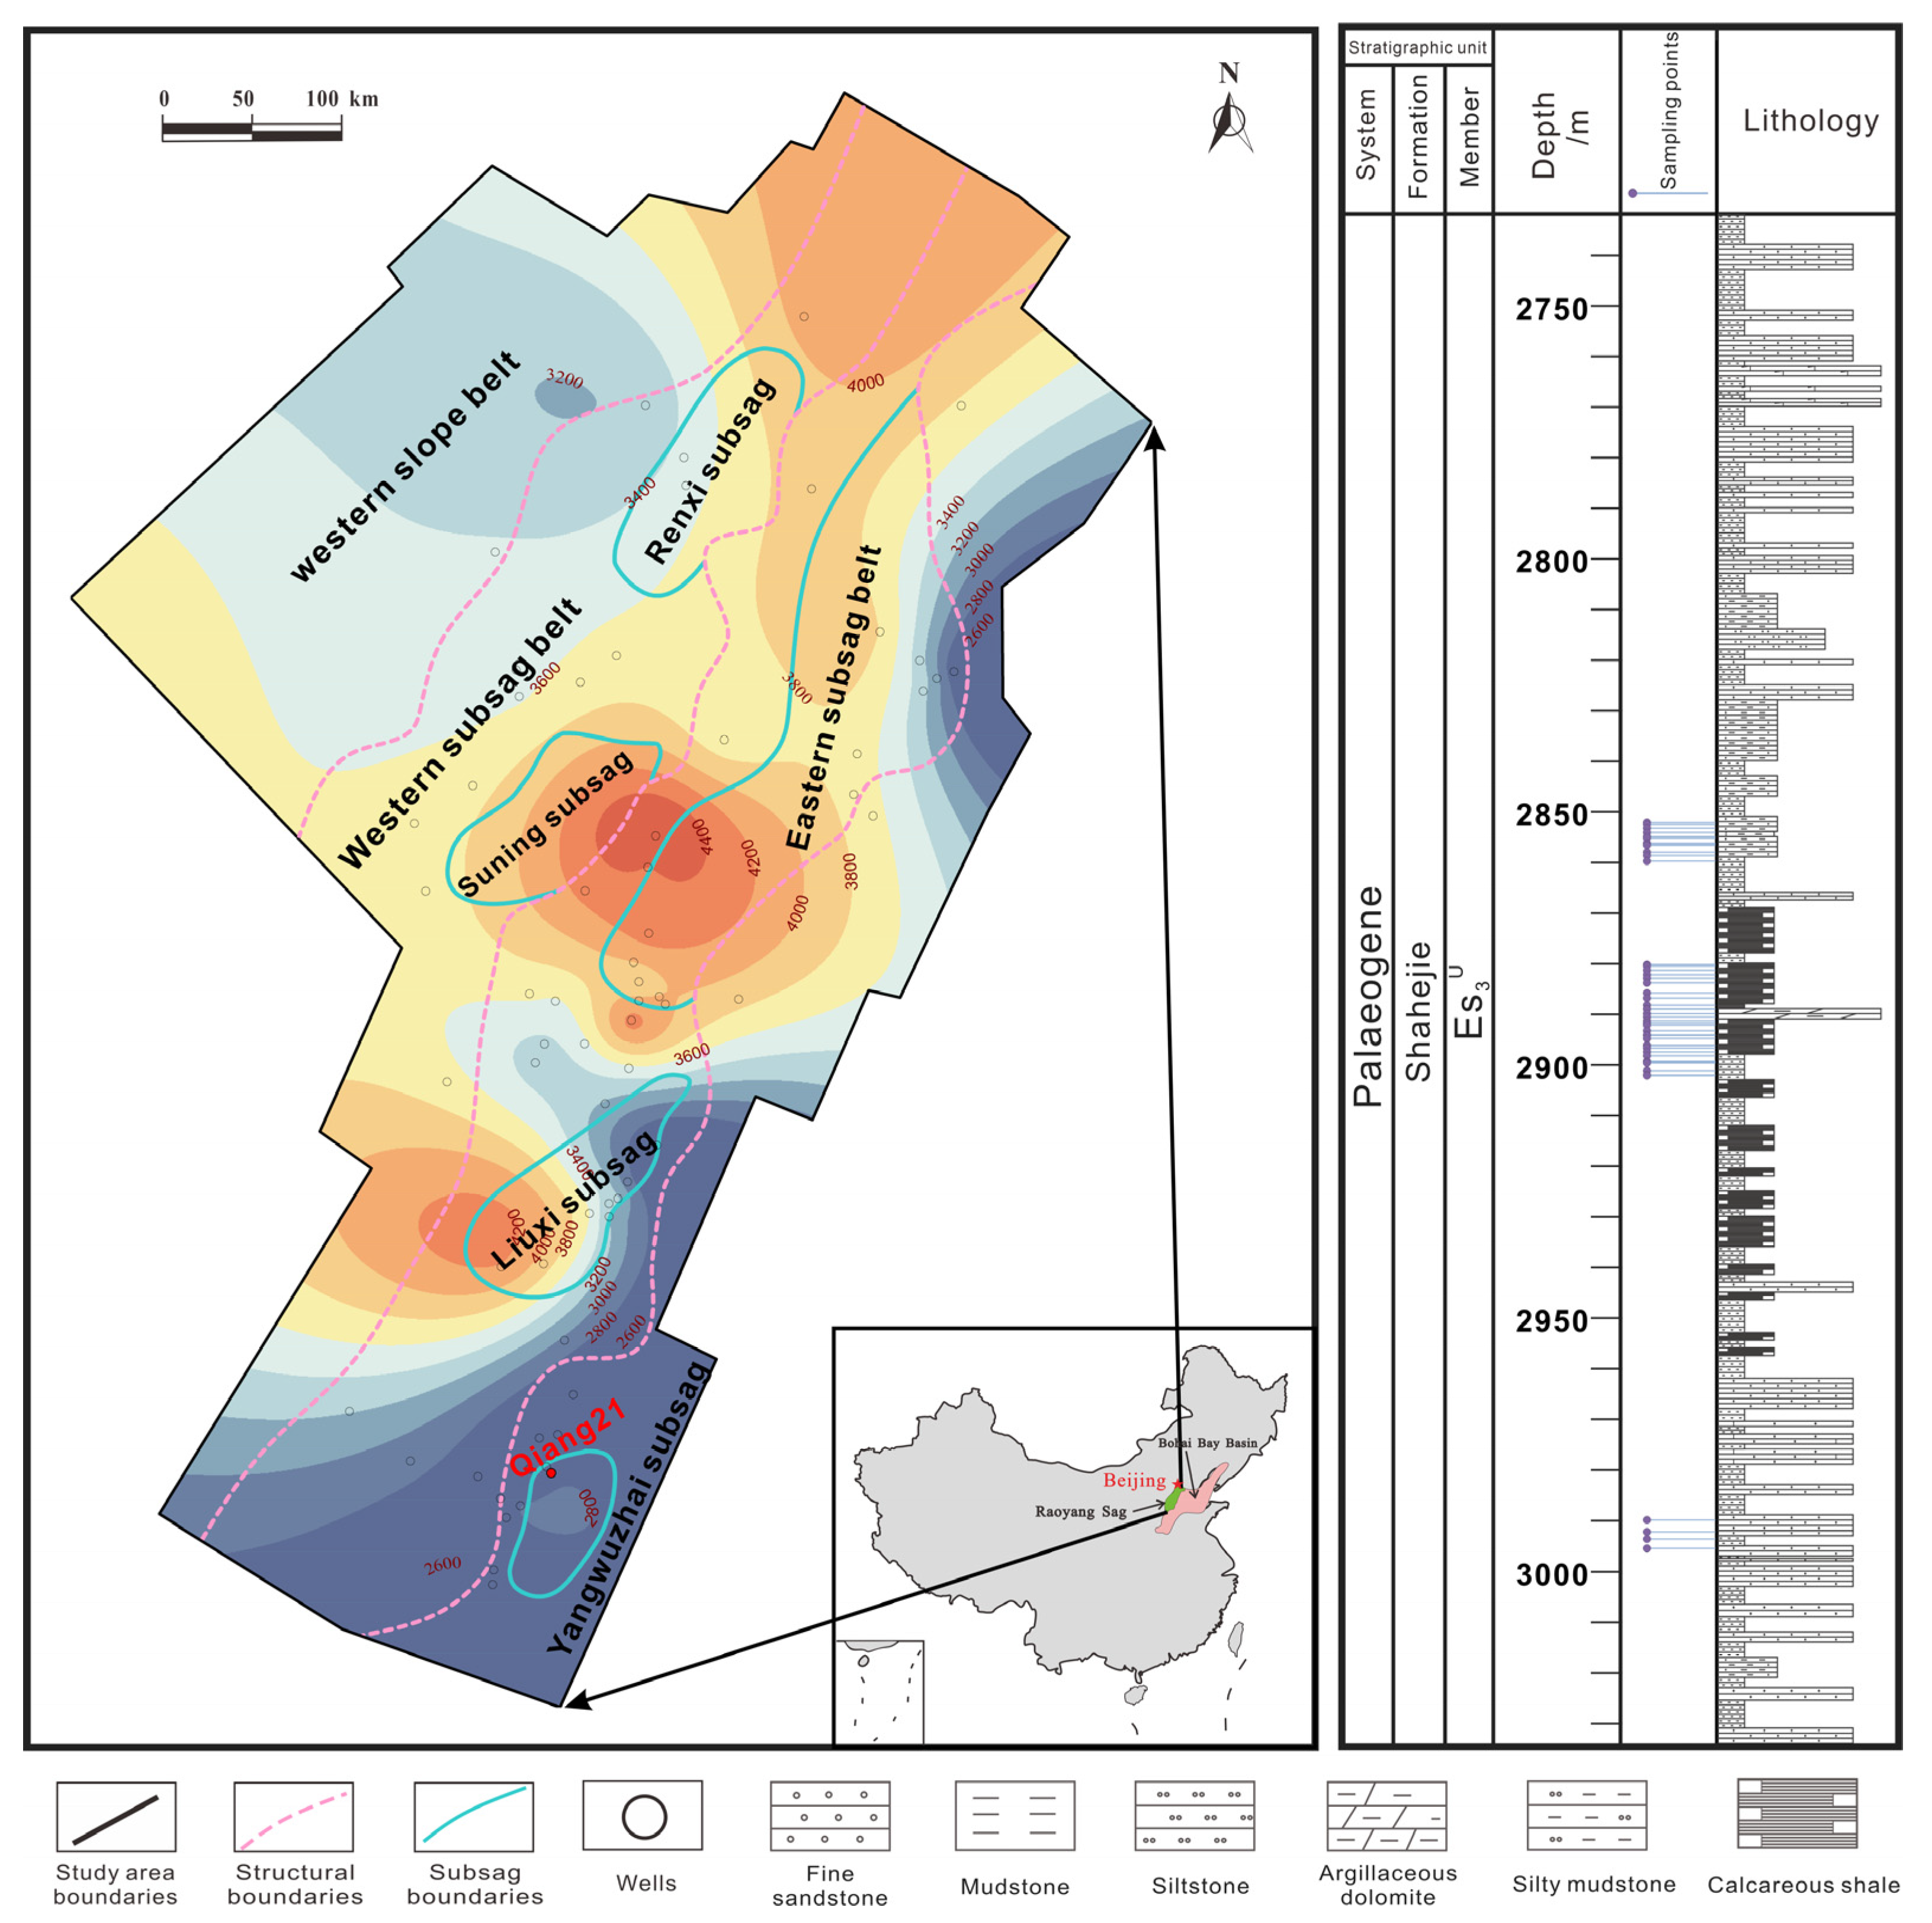
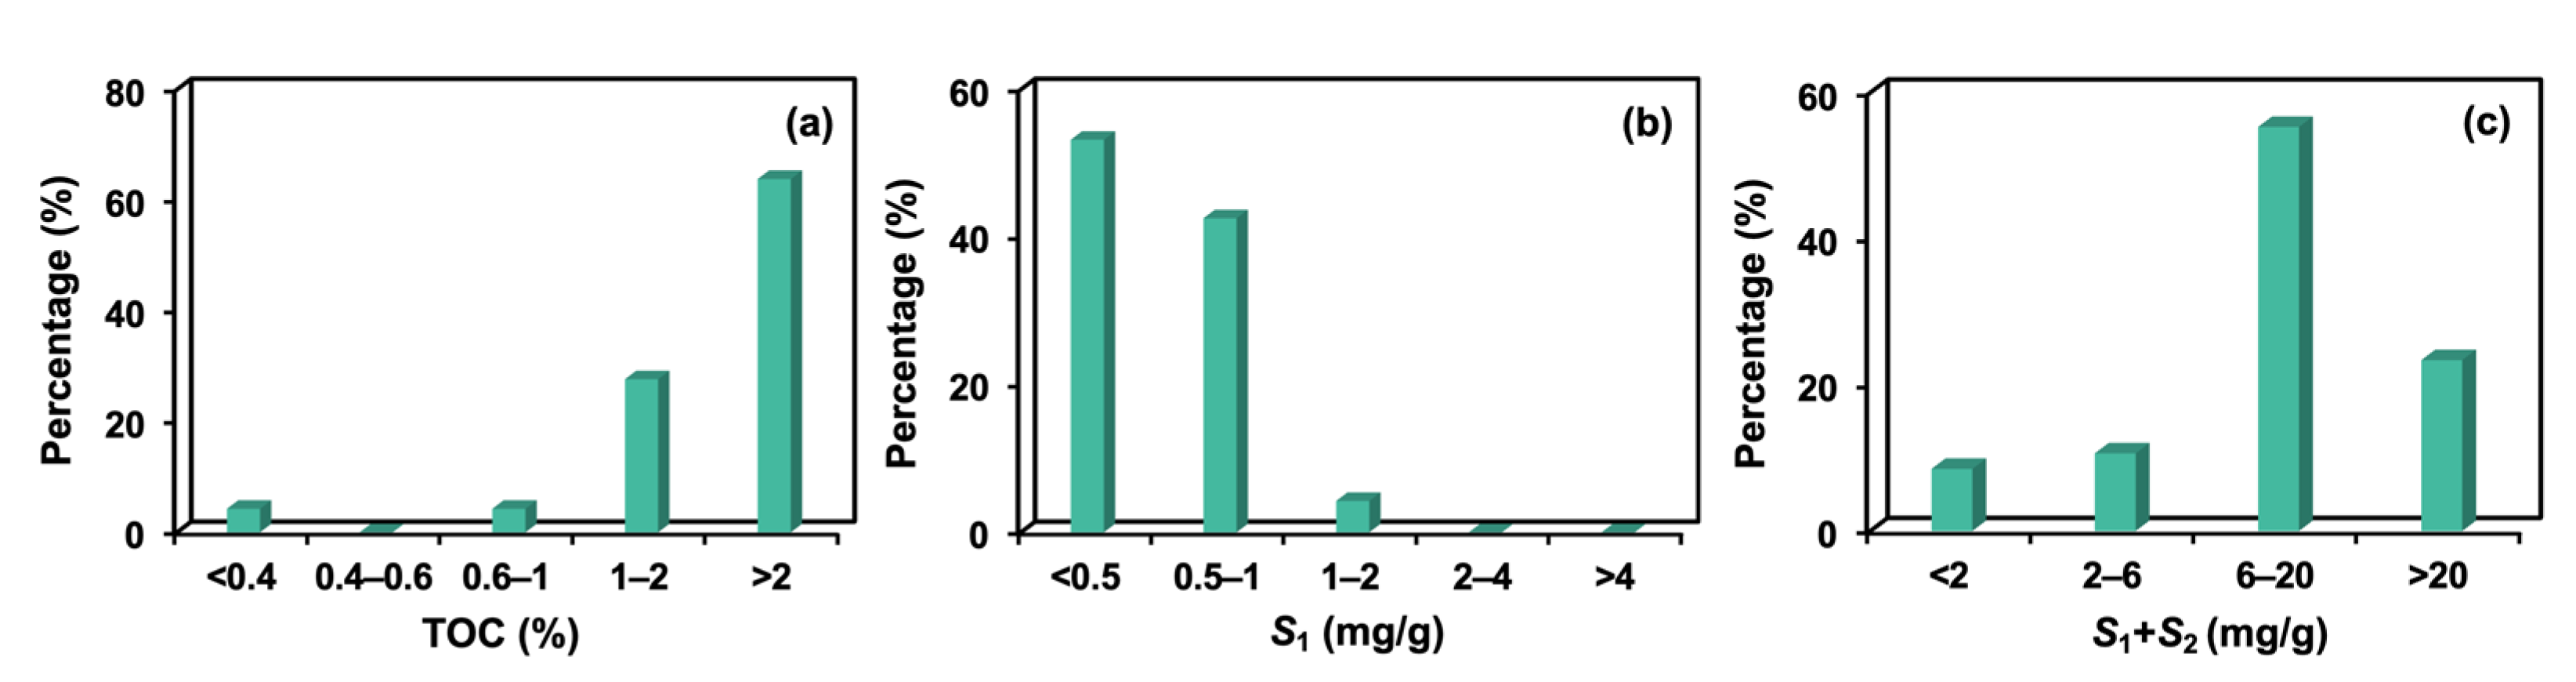
2. Geological Settings

The Raoyang Sag is a secondary structural unit in the central Jizhong Depression of the Bohai Bay Basin (Figure 1), and covers an area of about 5280 km2 [23,24]. The Sag is one of the most promising shale oil accumulation and development areas in the Jizhong Depression. There are two sets of main source rocks in the Lower first member of the Shahejie Formation (Es1L) and the upper third member of the Shahejie Formation (Es3U) in the Sag, which are main sources for the formation of shale oil. After more than 40 years of exploration and development in the Raoyang Sag, oil shows have been commonly encountered in shale formations. Among them, more than 200 wells in the shale strata in the Es1L and Es3U have presented oil shows.
In this study, a key exploratory well, Qiang21, was primarily studied to determine favorable intervals of shale oil sweet spots. A total of 48 samples located at the Es3U were obtained from the well. Based on the basic measurements of organic geochemistry, they show that: (a) the total organic carbon (TOC) content ranges from 0.112 to 5.536% (mean 2.320%); (2) S1 content is the pyrolysis hydrocarbon content obtained from Rock–Eval measurement at 573.15K and varies from 0.01 to 1.35 mg/g (mean 0.48 mg/g); and (3) the production index (S1/(S1 + S2), where S2 is Rock–Eval measured kerogen yield) has a range of 0.17–41.13 mg/g (mean 15.12 mg/g). Overall, studied shales belong to good source rocks and are favorable to shale oil enrichment (Figure 2). Inorganic mineral components of shales are composed of clay minerals, quartz, and calcite, with weight percentages of 37.9 wt.%, 18.7 wt.%, and 17.9 wt.%, respectively. Shales contain a small amount of aragonite (avg. 10.4 wt.%) and iron-dolomite (avg. 6.8 wt.%). For clay minerals, illite and illite/smectite mixed layers are the main clay fractions (Figure 3).

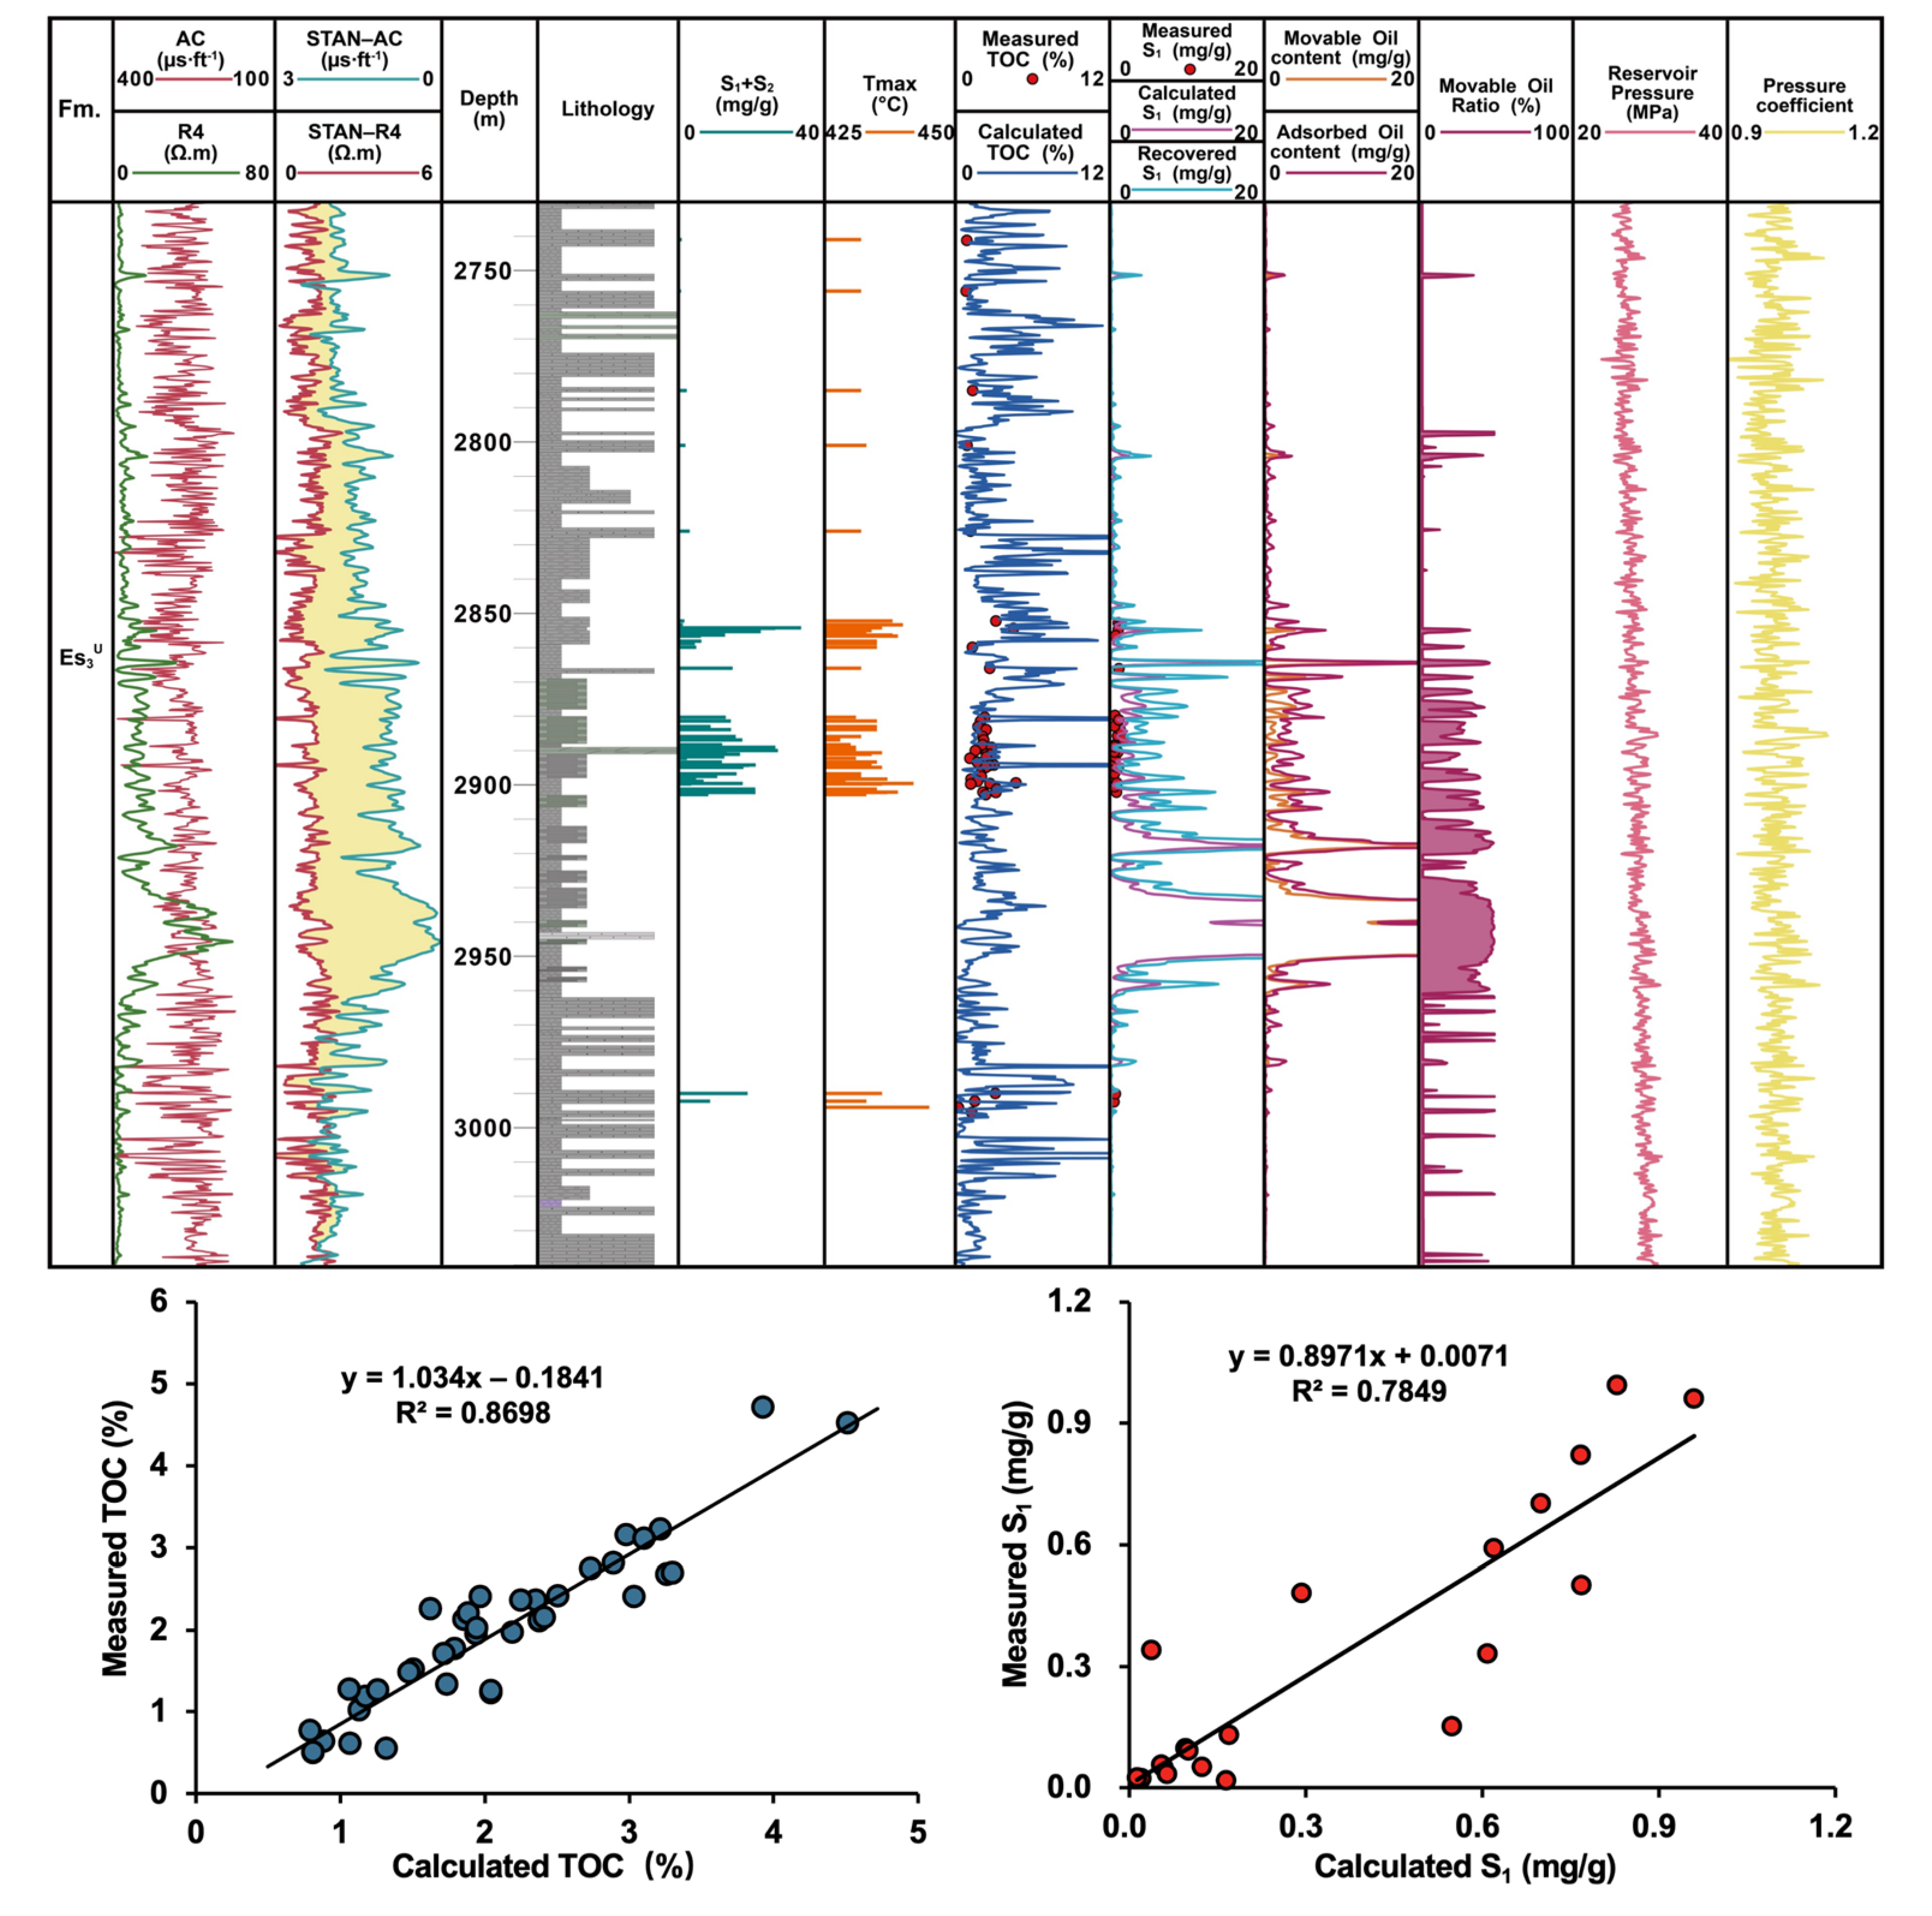
3. Determination of Primary Parameters

A comprehensive sweet spot of shale oil is a superposition of geological and engineering sweet spots. However, due to the inconsistency between various types of sweet spots, it is difficult to quantitatively determine the comprehensive sweet spot for shale oil recovery. It is necessary to select primary parameters to characterize the various sweet spots. Geological sweet spots mainly include good oiliness, strong mobility of oil, and high permeability, which can be expressed by the four parameters of oil content, movable oil ratio, pressure coefficient of reservoir fluid, and shale permeability. The engineering sweet spot mainly focuses on the evaluation of fracturing performance of rock, which can be reflected by a brittleness index.

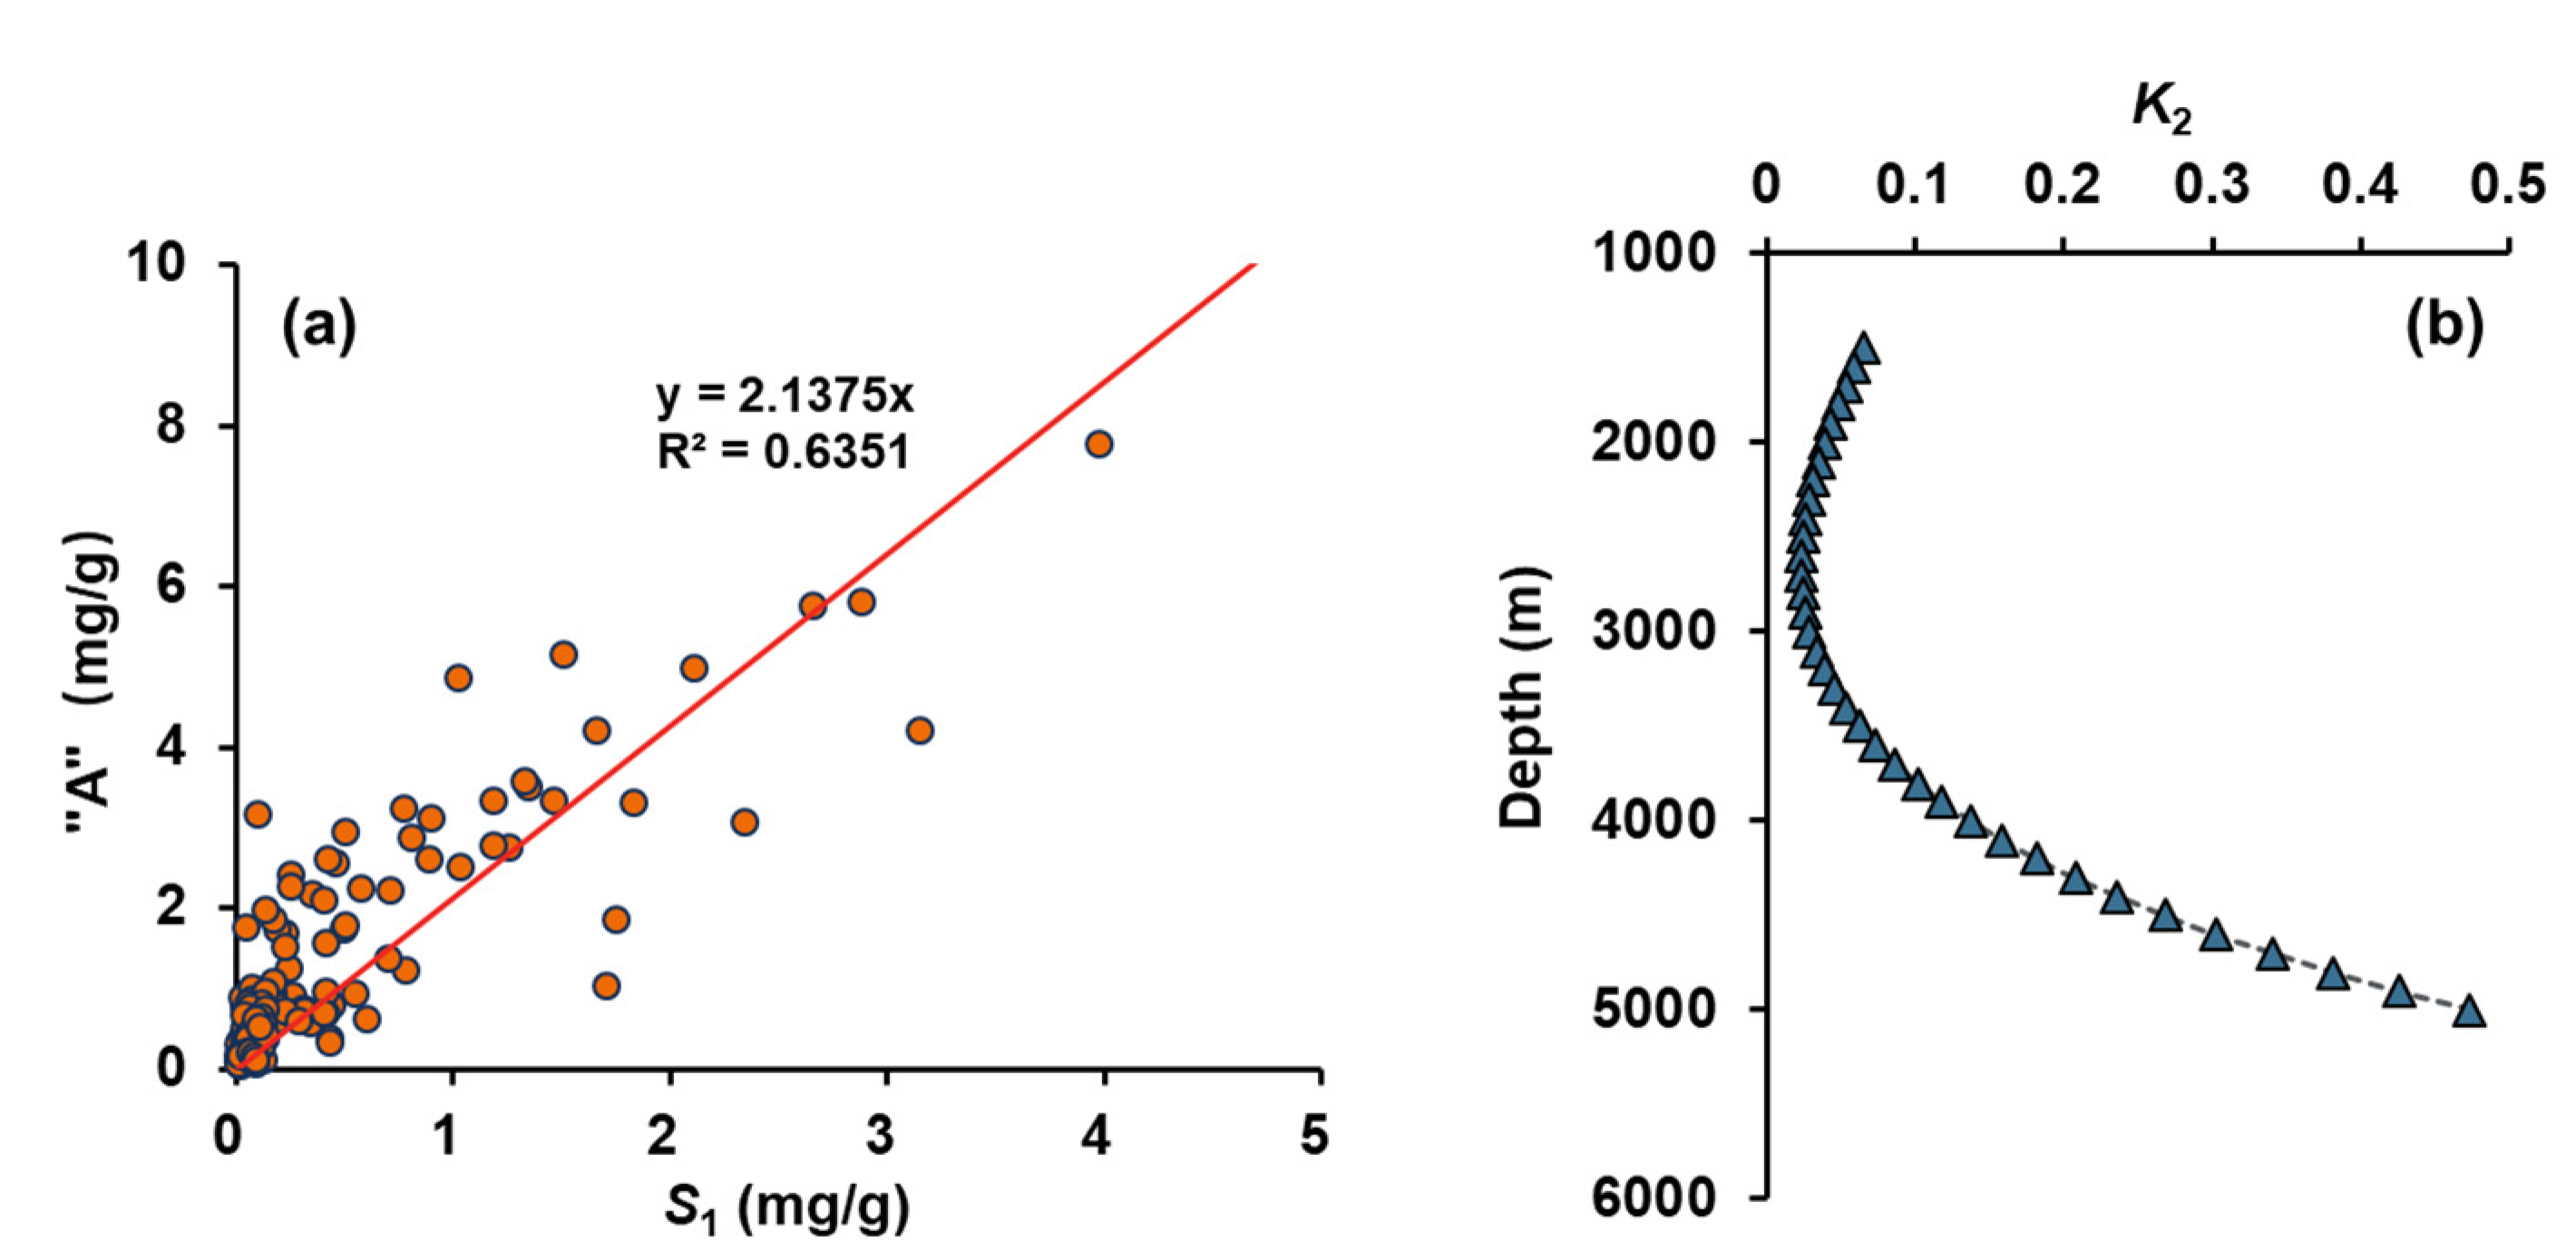
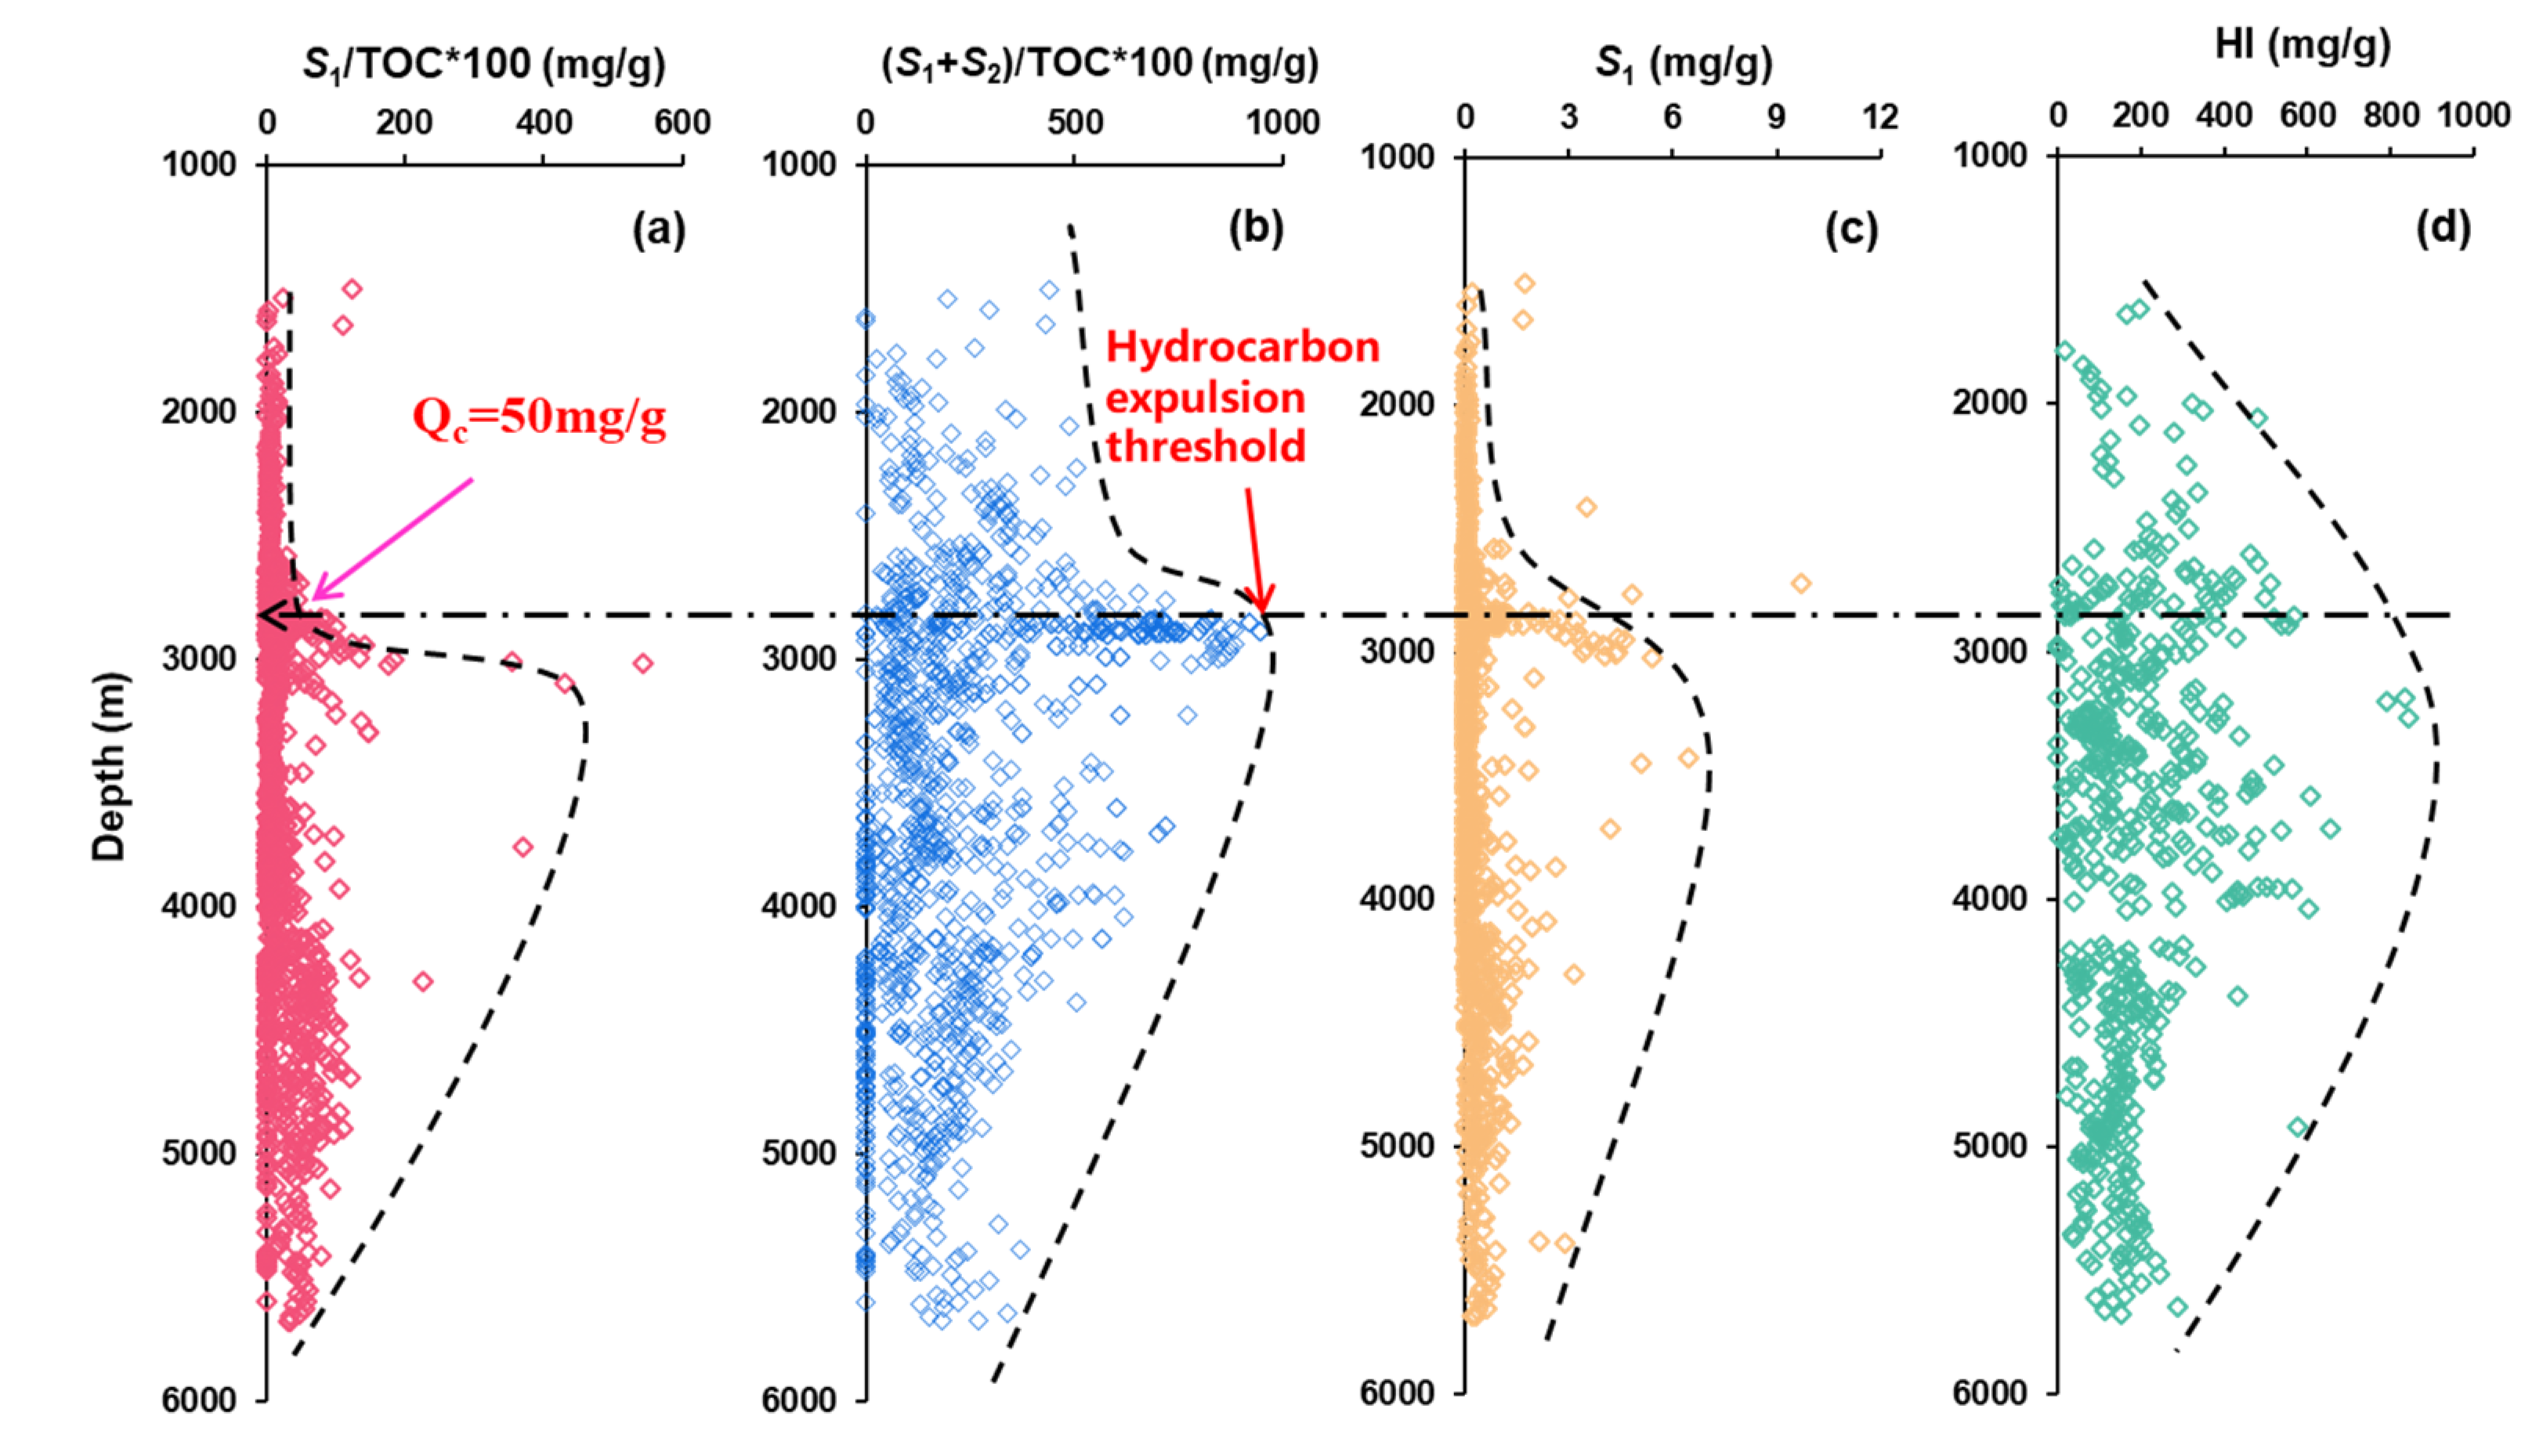
3.1. Shale Oil Content

Total oil content in shale can directly characterize the degree of shale oil enrichment, and is a direct manifestation of the abundance of shale oil resources. There are two parameters that can be used to reflect shale oil content, which are pyrolysis hydrocarbon (S1) and chloroform bitumen “A”. The former is obtained by the rock pyrolysis analyzer (Rock–Eval); the latter can be obtained by the chloroform extraction method [25,26,27]. It should be noted that the pyrolysis hydrocarbon (S1) is obtained when the heating temperature does not exceed 573.15K in a Rock–Eval experiment and is the result of a loss of light and heavy hydrocarbons. Thus, it needs to be restored to be able to evaluate the resource abundance of shale oil. However, chloroform bitumen “A” includes pyrolysis hydrocarbon S1 and some heavy components. According to the relationship of chloroform bitumen “A” with S1 (Figure 4a), the recovery coefficient (K1) of heavy hydrocarbons can be obtained. This was determined to be about 2.1 in this study. Thus, the corrected S1 value ( S 1 ) after the recovery of the heavy components can be calculated as:
S 1 = K 1 S 1
where S 1 is the corrected S1 value with a heavy hydrocarbon recovery, mg/g, and K1 is the recovery coefficient of heavy hydrocarbons, dimensionless.
Based on the recovery of heavy hydrocarbons, the relationship between the ratio of C5–14 to C14+ and the thermal maturity (Ro) of shale is determined according to the experimental data from the thermal simulation analysis of hydrocarbon generation. Further, according to the relationship between burial depth and Ro of shale, the recovery coefficient (1 + K2) of light hydrocarbon can be determined at different burial depths (Figure 4b), and the total oil content after the recovery of light hydrocarbons can be obtained, which is expressed as:
S 1 = ( 1 + K 2 ) × S 1
where S 1 is the total oil content, mg/g, and 1 + K2 is the recovery coefficient of light hydrocarbons, dimensionless.
According to the above analysis, the burial depth of the shale oil reservoir should be an important parameter. However, we did not choose burial depth as one of the main geological parameters, mainly because burial depth is closely related to thermal maturity (Ro) and influences the shale oil content. Thus, the burial depth has been indirectly considered in the proposed evaluation method.
Due to the constraints of analysis cost, and especially the limited number of shale samples that can be provided, it is difficult to continuously describe the organic heterogeneity of shales with measured data. The characteristics of organic matter and oiliness have obvious effects on many logging responses (acoustic wave, resistivity, neutron, density, gamma, etc.) [20,28], and the logging data are characterized by continuity and high resolution. This makes it possible to use logging data to evaluate the organic heterogeneity of the shale reservoir. The most commonly used prediction method in the industry is the ΔLogR method, which can continuously predict the two important parameters of total organic carbon (TOC) and S1 in shales based on logging curves of acoustic wave and resistivity [28,29]. In this study, the S1 and TOC values of shales in the Well Qiang21 were determined as linear functions of ΔLogR. Calculated results are presented in Figure 5. From the figure, it can be seen that there is a good match between calculated and measured results. Further, total oil content can be obtained. It can be seen that oil content is relatively high at the depth of 2926–2955 m, where a shale oil-rich interval exists.

3.2. Movable Oil Ratio and Reservoir Pressure Coefficient

In addition to considering the degree of oil resource enrichment, the mobility of shale oil is also closely related to productivity [30]. The mobility of shale oil mainly includes the two aspects of flow potential and flow capacity of oil, which is similar to the mobility of water [31]. Flow potential is characterized by the movable oil ratio. The higher the movable ratio of shale oil, the more favorable it may be for shale oil extraction. Flow capacity is characterized by the pressure coefficient of reservoir fluid. Abnormally high pressure (i.e., overpressure) can provide sufficient elastic energy for shale oil seepage through the reservoir [32].

3.2.1. Movable Oil Ratio

Theoretically, total oil content includes two parts: movable oil and bound oil, of which the movable oil is composed of the free hydrocarbons in the measured S1 and the recovered light hydrocarbons, and the bound oil includes the adsorbed hydrocarbons in the measured S1 and the recovered heavy hydrocarbons. The key is to determine the adsorbed and free oil contents in S1. Jarvie showed that the ratio of S1 to TOC can be used to characterize the lower limit of shale adsorbed hydrocarbons [9], so it can be used to evaluate the adsorbed and free amounts of shale oil. Determination of these values was based on the understanding that oil begins expulsing from organic matter as the shale reservoir submerges down to the hydrocarbon expulsion threshold depth during burial history; that is, oil achieves a saturated sorption on the organic matter and begins migrating into various pores at the hydrocarbon expulsion threshold. In this study, several relationships of burial depth with S1/TOC, (S1 + S2)/TOC, S1, and hydrogen index (HI) were obtained, respectively, as shown in Figure 6. It can be seen that the depth of the hydrocarbon expulsion threshold occurs at around 2850 m, which means that hydrocarbons begin to expel and the shale has the maximum adsorbed oil content at this depth. It can be determined that if the saturated adsorption oil content (Qc) of shales is equal to about 50 mg/g, then the adsorbed oil amount in S1 is equal to the product of TOC multiplied by Qc. Therefore, the amounts of bound and movable oil and the ratio of movable oil are obtained as:
Q b = TOC × Q c + ( K 1 1 ) × S 1
Q m = S 1 Q b
R m = 100 × Q m Q b + Q m
where Qb is the bound oil content, mg/g; Qc is the saturated adsorption oil content, mg/g; Qm is the movable oil content, mg/g; and Rm is the movable oil ratio, %.
Calculated results were presented in Figure 5. It can be seen that shale oil has a high mobility and movable ratio, with an average movable ratio of about 35% in the depth section of 2926–2955 m, where a shale oil-rich interval is also found.

3.2.2. Pressure Coefficient of Reservoir Fluid

There are many logging methods predicting reservoir fluid pressure, mainly including: (a) the equivalent depth method and Eaton method, based on undercompaction theory, (b) the effective stress method and Bowers method, based on rock mechanics theory, and (c) the empirical statistical method [33,34,35,36,37,38]. Among them, the Eaton method is an effective method of reservoir pressure prediction based on acoustic logging data, rock density logging data, and vertical effective stress of the rock. In addition, the method is based on the actual measured reservoir pressure [33,34].
In the study area, reservoir fluid pressure was divided into four classes according to the pressure coefficient: atmospheric pressure (0.9–1.1), weak overpressure (1.1–1.2), medium overpressure (1.2–1.5), and strong overpressure (>1.5). The reservoir fluid pressure at a certain depth is predicted by an Eaton equation (Equation (6)) combined with a normal compaction trend line. The Eaton index in the equation is obtained from the measured reservoir pressure data and is expressed as Equation (7). After determining the Eaton index and normal compaction trend line, reservoir fluid pressure can be calculated by Equation (6). Several main equations are as follows:
P p = P 0 ( P 0 P n ) × ( A C n A C ) c
c = l n ( P 0 P p P 0 P n ) l n ( A C n A C )
where Pp is the reservoir fluid pressure, MPa; P0 is the overburden pressure, MPa; Pn is the hydrostatic column pressure, MPa; ACn is the sonic differential time on the normal compaction trend line, μs/ft; AC is the logging data of sonic differential time, μs/ft; and c is the Eaton index.
According to the result of reservoir pressure, the pressure coefficient (σp) can be obtained as:
σ p = P p P n
Calculated results were presented in Figure 5. Overall, the reservoir pressure rank belongs to atmospheric pressure with a reservoir coefficient of 0.9–1.1. Moreover, reservoir pressure has an increasing trend with the increase in burial depth.

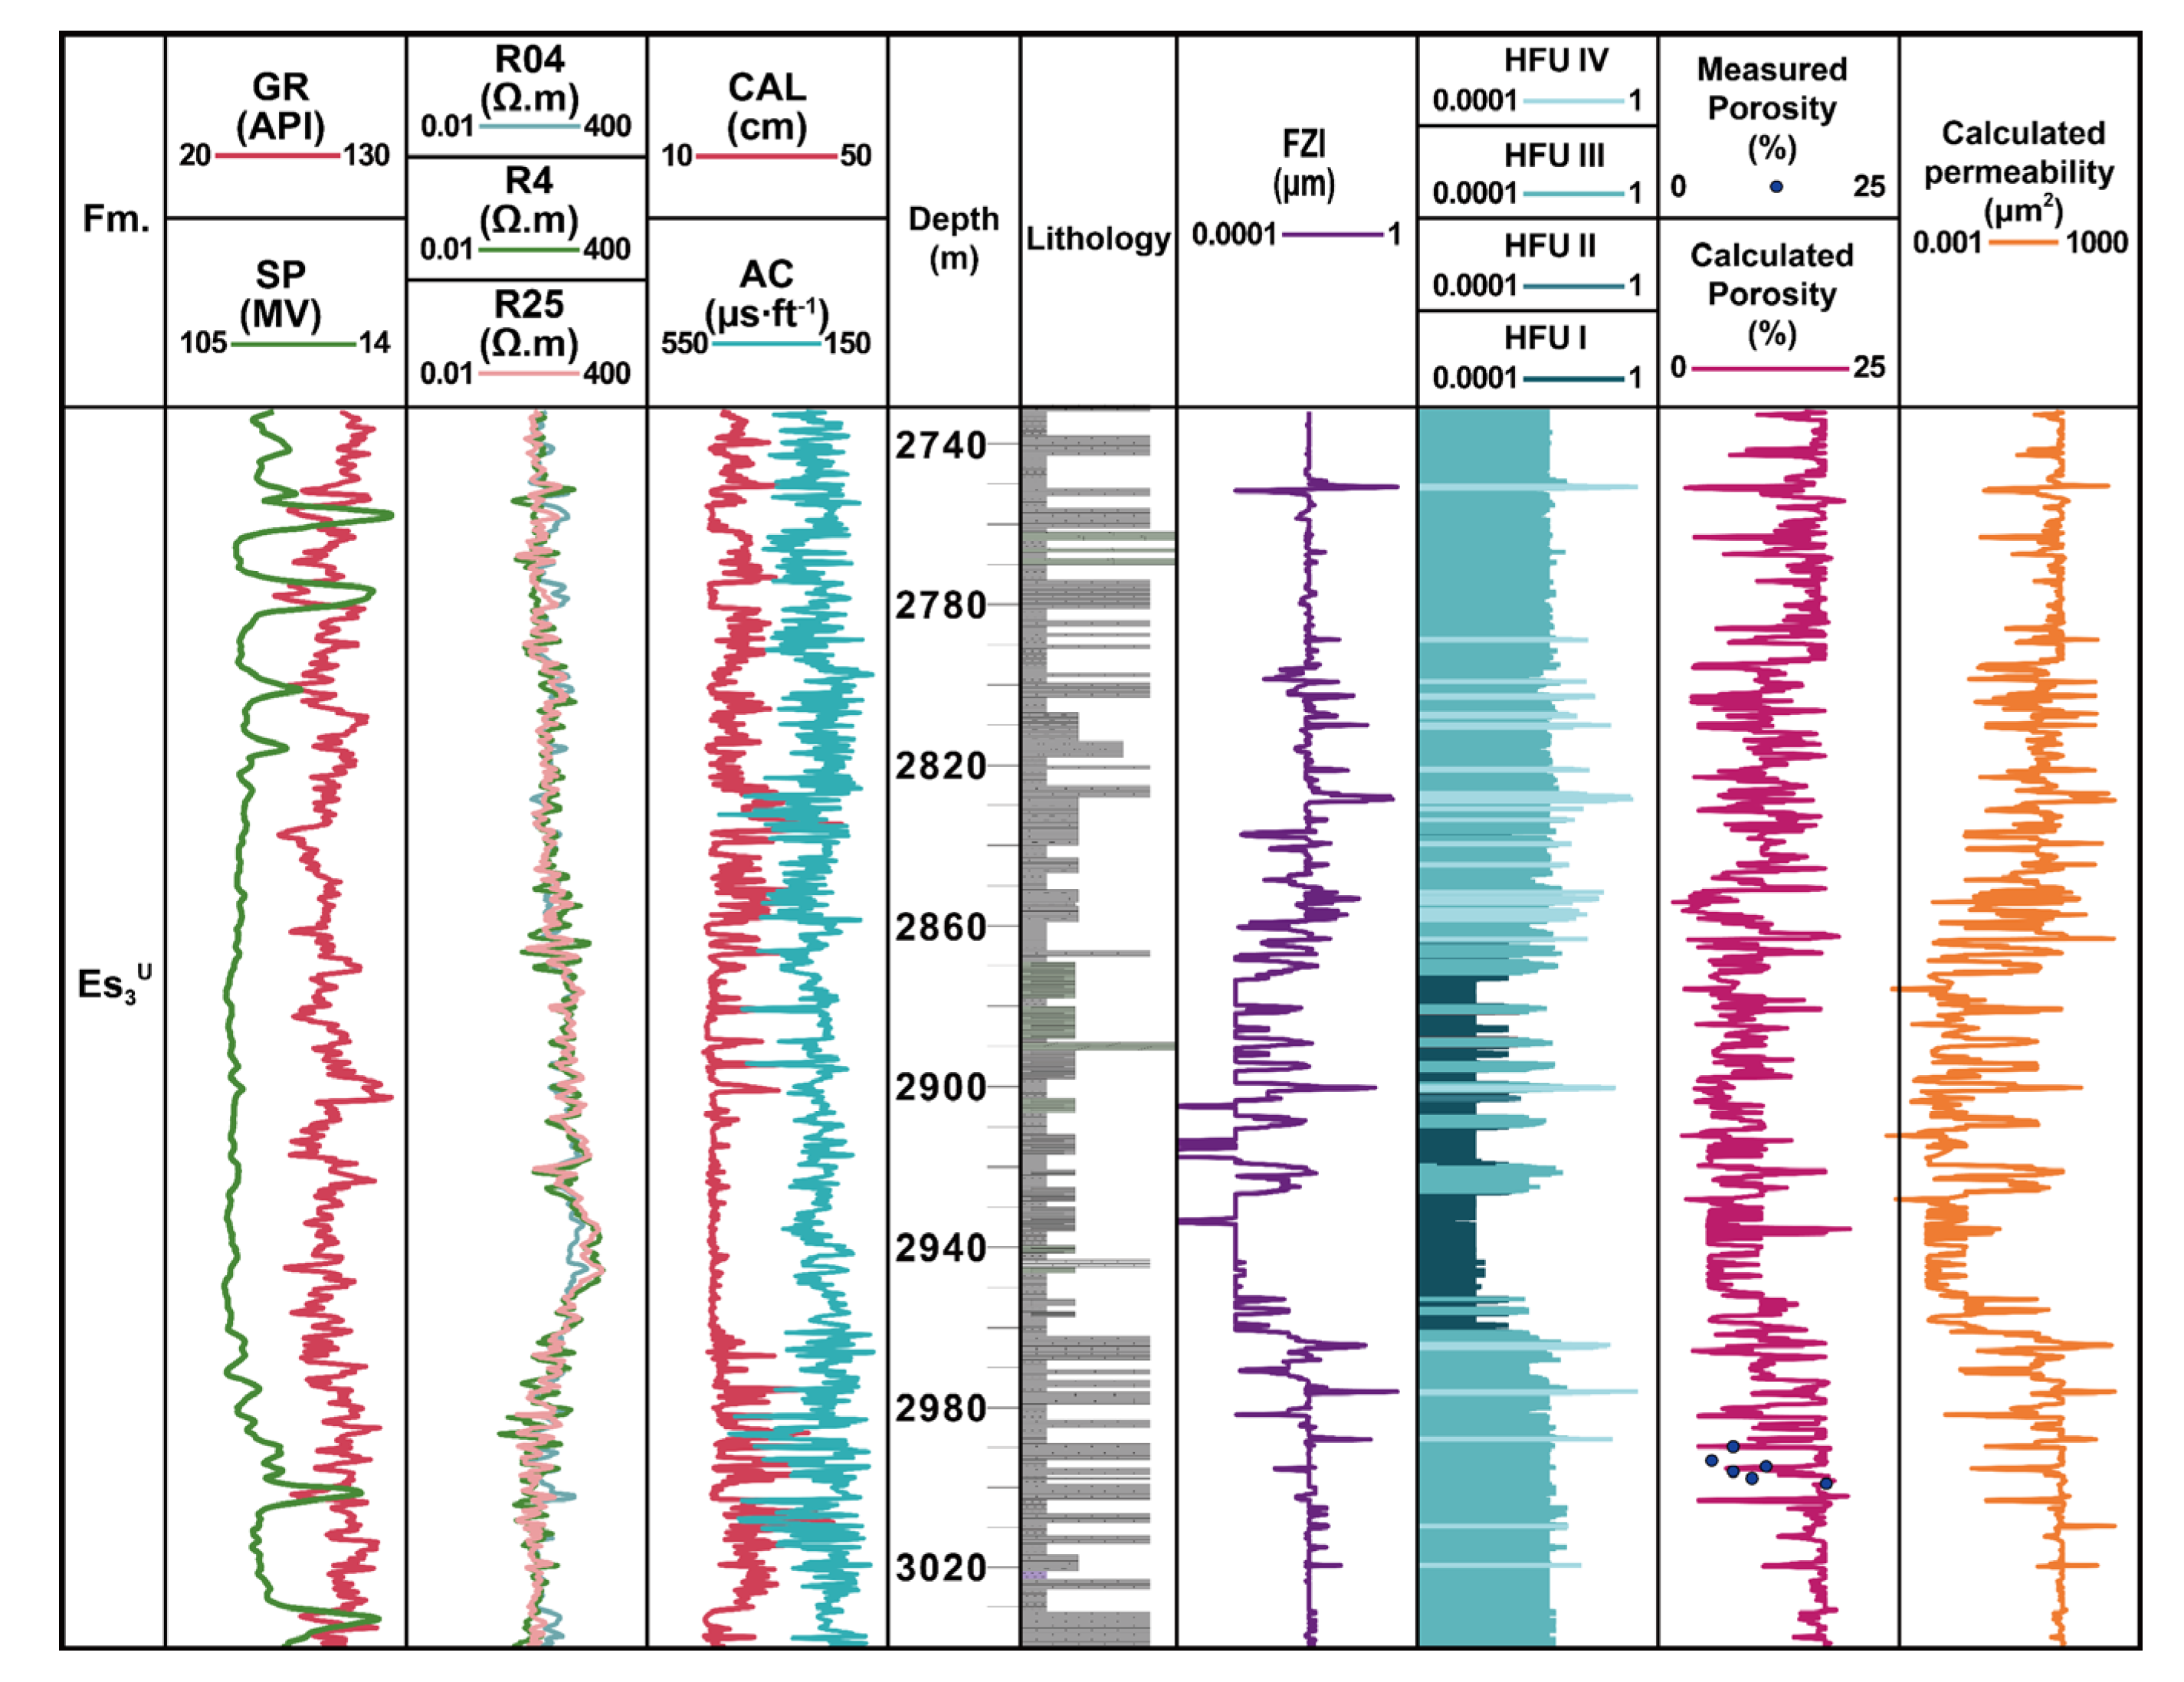
3.3. Shale Permeability

Previous studies found that the production of shale oil is positively correlated with the physical properties of the reservoir [39,40]. The better the physical properties, the higher the production. One of the key parameters that characterizes the physical properties of the reservoir is permeability. Permeability is one of the important parameters for reservoir evaluation. It is not only related to porosity, but also closely related to the pore structure of the rock. The view that the higher the porosity is, the better the permeability is has been guiding the production of medium-high porosity/permeability reservoirs [5,41]. However, as the porosity decreases, the relationship between porosity and permeability becomes more complicated. When the reservoir has low porosity and low permeability, the difference in permeability reaches nearly 4 orders of magnitude under similar porosity situations [42]. Usually, reservoir porosity is relatively easily obtained by logging evaluation. However, due to the complexity of shale oil reservoir permeability, the relationship of porosity with permeability as established by traditional methods is not effective. Hearn et al. [43] proposed the concept of hydraulic flow unit (HFU), that is, different hydraulic flow units have varied petrophysical characteristics. The proposal of hydraulic flow unit effectively solves the complexity of shale oil reservoir porosity and permeability. Porosity and permeability of the reservoir have a good correlation for the same HFU, and the relationships of porosity with permeability in different HFUs are established in this study. Based on the porosity-permeability relationships, shale permeability can be predicted [44,45,46]. The calculation method is expressed as follows:
F Z I = R Q I P M R
R Q I = 0.0314 K ϕ
P M R = ϕ 1 ϕ × 100 %
where FZI is the flow zone index, 10−6 μm2; RQI is the reservoir quality index; K is the permeability, mD; ϕ is the porosity, %; and PMR is the normalized porosity, dimensionless.
According to the above method, this study divided the shale reservoirs of Raoyang Sag into 4 types of HFU based on the cumulative density distribution of the reservoir flow zone index (FZI) (Figure 7a). For each of the HFUs, there is a good correlation between porosity and permeability (Figure 7b). Based on the BP neural network method, the relationships of logging data with FZI and porosity are established to predict shale oil reservoir permeability (Figure 7c,d). Calculated results are shown in Figure 8. It can be seen that there is a low value interval located at 2870–2960 m, where shale has low porosity and permeability.

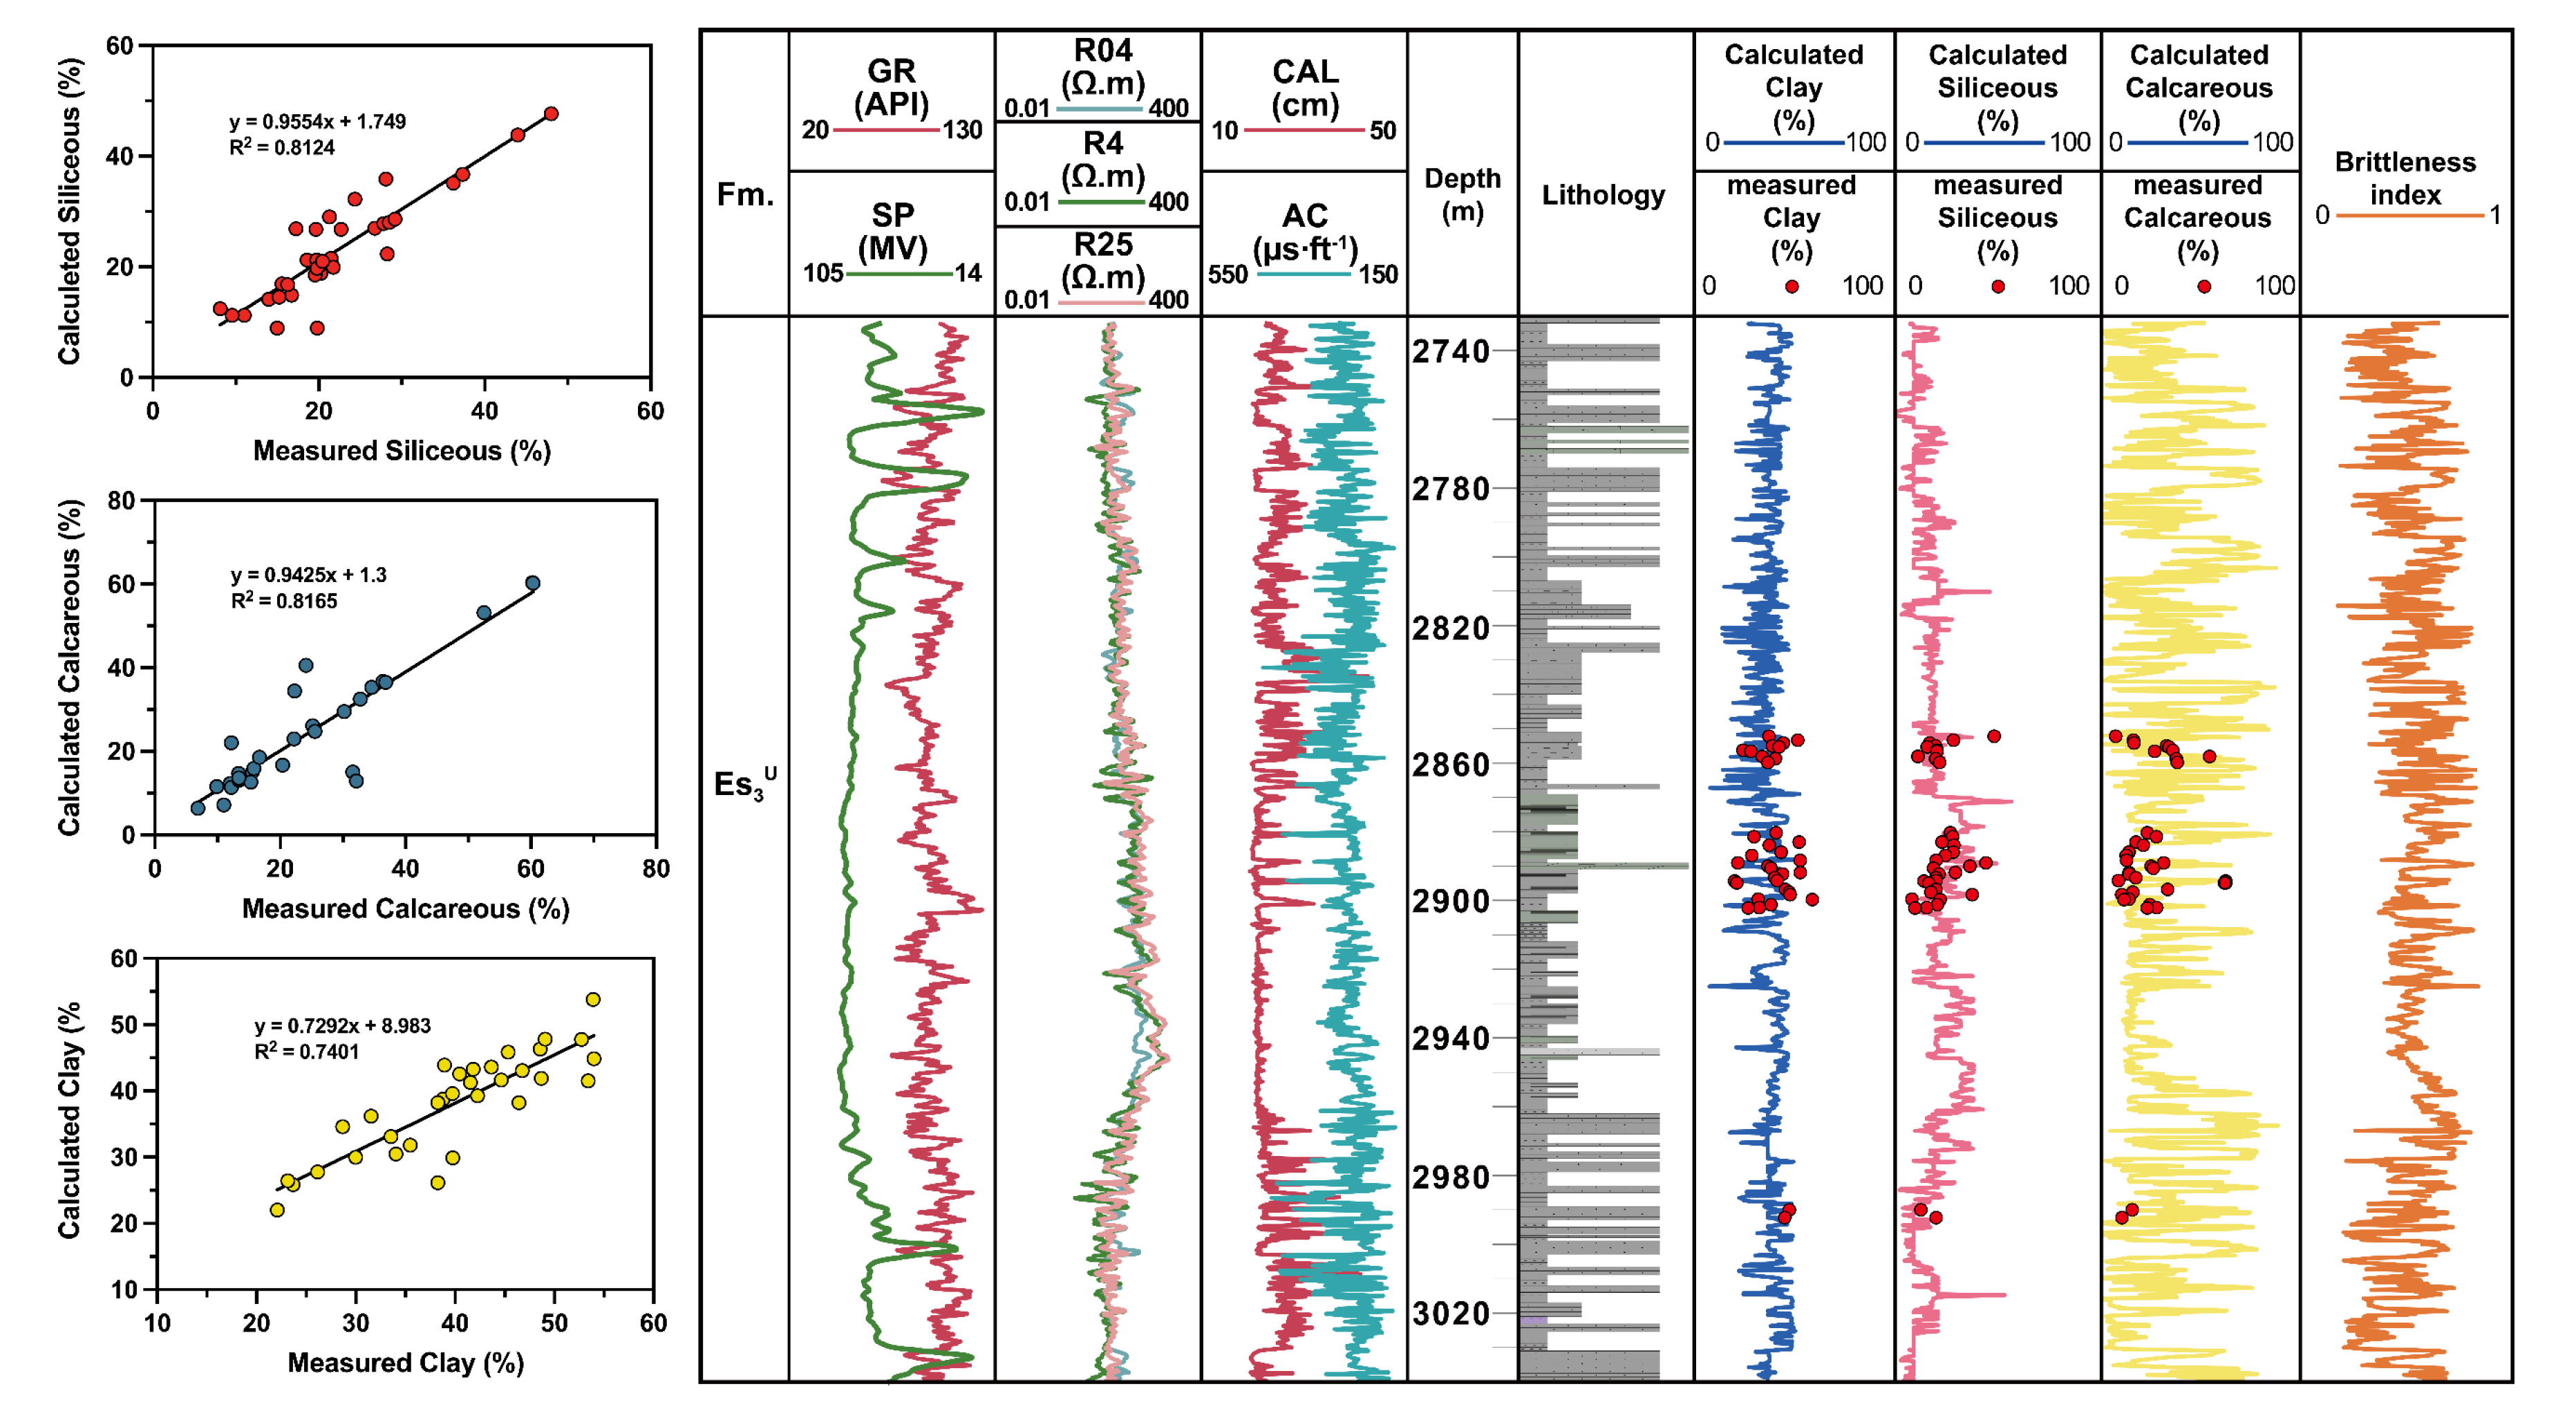
3.4. Brittleness Index

The brittleness of the shale reservoir is one of the key parameters of shale oil development and determines the fracturability of shale oil reservoirs. The brittleness index of rock is closely related to shale’s hydraulic fracturing, which directly affects the seepage channels of shale oil. The existence of a large number of brittle minerals is the reason why rock can obtain high-yield oil flow through fracturing fractures [17,47]. An area with a high brittleness index is called an engineering sweet spot.
Evaluation of rock brittleness is mainly performed by calculating the brittleness index based on mineral compositions, or by calculating Young’s modulus and Poisson’s ratio based on rock mechanics data. In this paper, the brittleness index is used to characterize the rock brittleness of the shale reservoir in the study area. The inorganic mineral composition of shale is simplified into three parts: clay minerals, felsic minerals (quartz and feldspar), and calcareous minerals (calcite and dolomite). Based on the measured and logging data, the BP neural network method was used to establish prediction models for clay minerals, felsic minerals, and calcareous minerals, respectively. It should be noted that most studies in the past have neglected the influence of organic matter content on rock brittleness, however, as a rock component, the mechanical properties of organic matter are quite different from those of inorganic minerals [22]. Therefore, this research carried out the calculation of brittleness index considering the TOC content, and the expression was written as:
B = C 1 + C 2 C TOC + C 1 + C 2 + C 3
where B is the rock brittleness index, dimensionless; C1 is the felsic mineral content, %; C2 is the calcareous mineral content, %; CTOC is the TOC content, %; and C3 is the content of clay minerals, %.
As shown in Figure 9, continuous inorganic minerals in the shale interval were predicted by the BP neural network method. There is a good match between the calculated and the measured result. Based on organic and inorganic compositions, the brittleness index of shales and their distribution in the well Qiang21 were calculated. Overall, there is a good brittleness in the studied shales. The brittleness index of shales varies from 0.147 to 0.829, with an average value of 0.514.

4. Determination of Comprehensive Sweet Spots

4.1. Calculation of Comprehensive Weighting Factor

Taking into account the entire study interval/area, the five primary parameters are normalized. The oil content and brittleness index are linearly normalized with the maximum value, the permeability is normalized by the logarithmic range, and evaluation values of the movable oil ratio and pressure coefficient can be used directly. They can be mathematically expressed as:
U 1 = S 1 S 1 max
U 2 = S m S 1
U 3 = f
U 4 = l g k l g k min l g k max l g k min
U 5 = B B max
where U1 is the weighting factor of oil content, dimensionless; S 1 is the shale oil content after the recovery of light and heavy hydrocarbons, mg/g; S 1 max is the maximum shale oil content in the study area, mg/g; U2 is the weighting factor of the movable oil ratio, dimensionless; Sm is the movable content of shale oil, mg/g; U3 is the weighting factor of the pressure coefficient of reservoir fluid, dimensionless; f is the pressure coefficient of reservoir fluid, dimensionless; U4 is the weighting factor of permeability, dimensionless; lgk is the logarithm of shale permeability, mD; lgkmax is the maximum logarithm of the shale permeability in the study area, mD; lgkmin is the minimum logarithm of the shale permeability in the study area, mD; U5 is the weighting factor of the shale brittleness index, dimensionless; B is the shale brittleness index, dimensionless; and Bmax is the maximum value of the shale brittleness index in the study area, dimensionless.
In order to quantitatively determine the comprehensive shale oil sweet spot, the weighting factors of five primary parameters are multiplied together, and then the order of magnitude is enhanced by 1000 times to obtain the final comprehensive weighting factor U, which is expressed as:
U = U 1 × U 2 × U 3 × U 4 × U 5 × 1000
According to the vertical distribution of comprehensive weighting factors, the shale oil comprehensive sweet spot can be found.

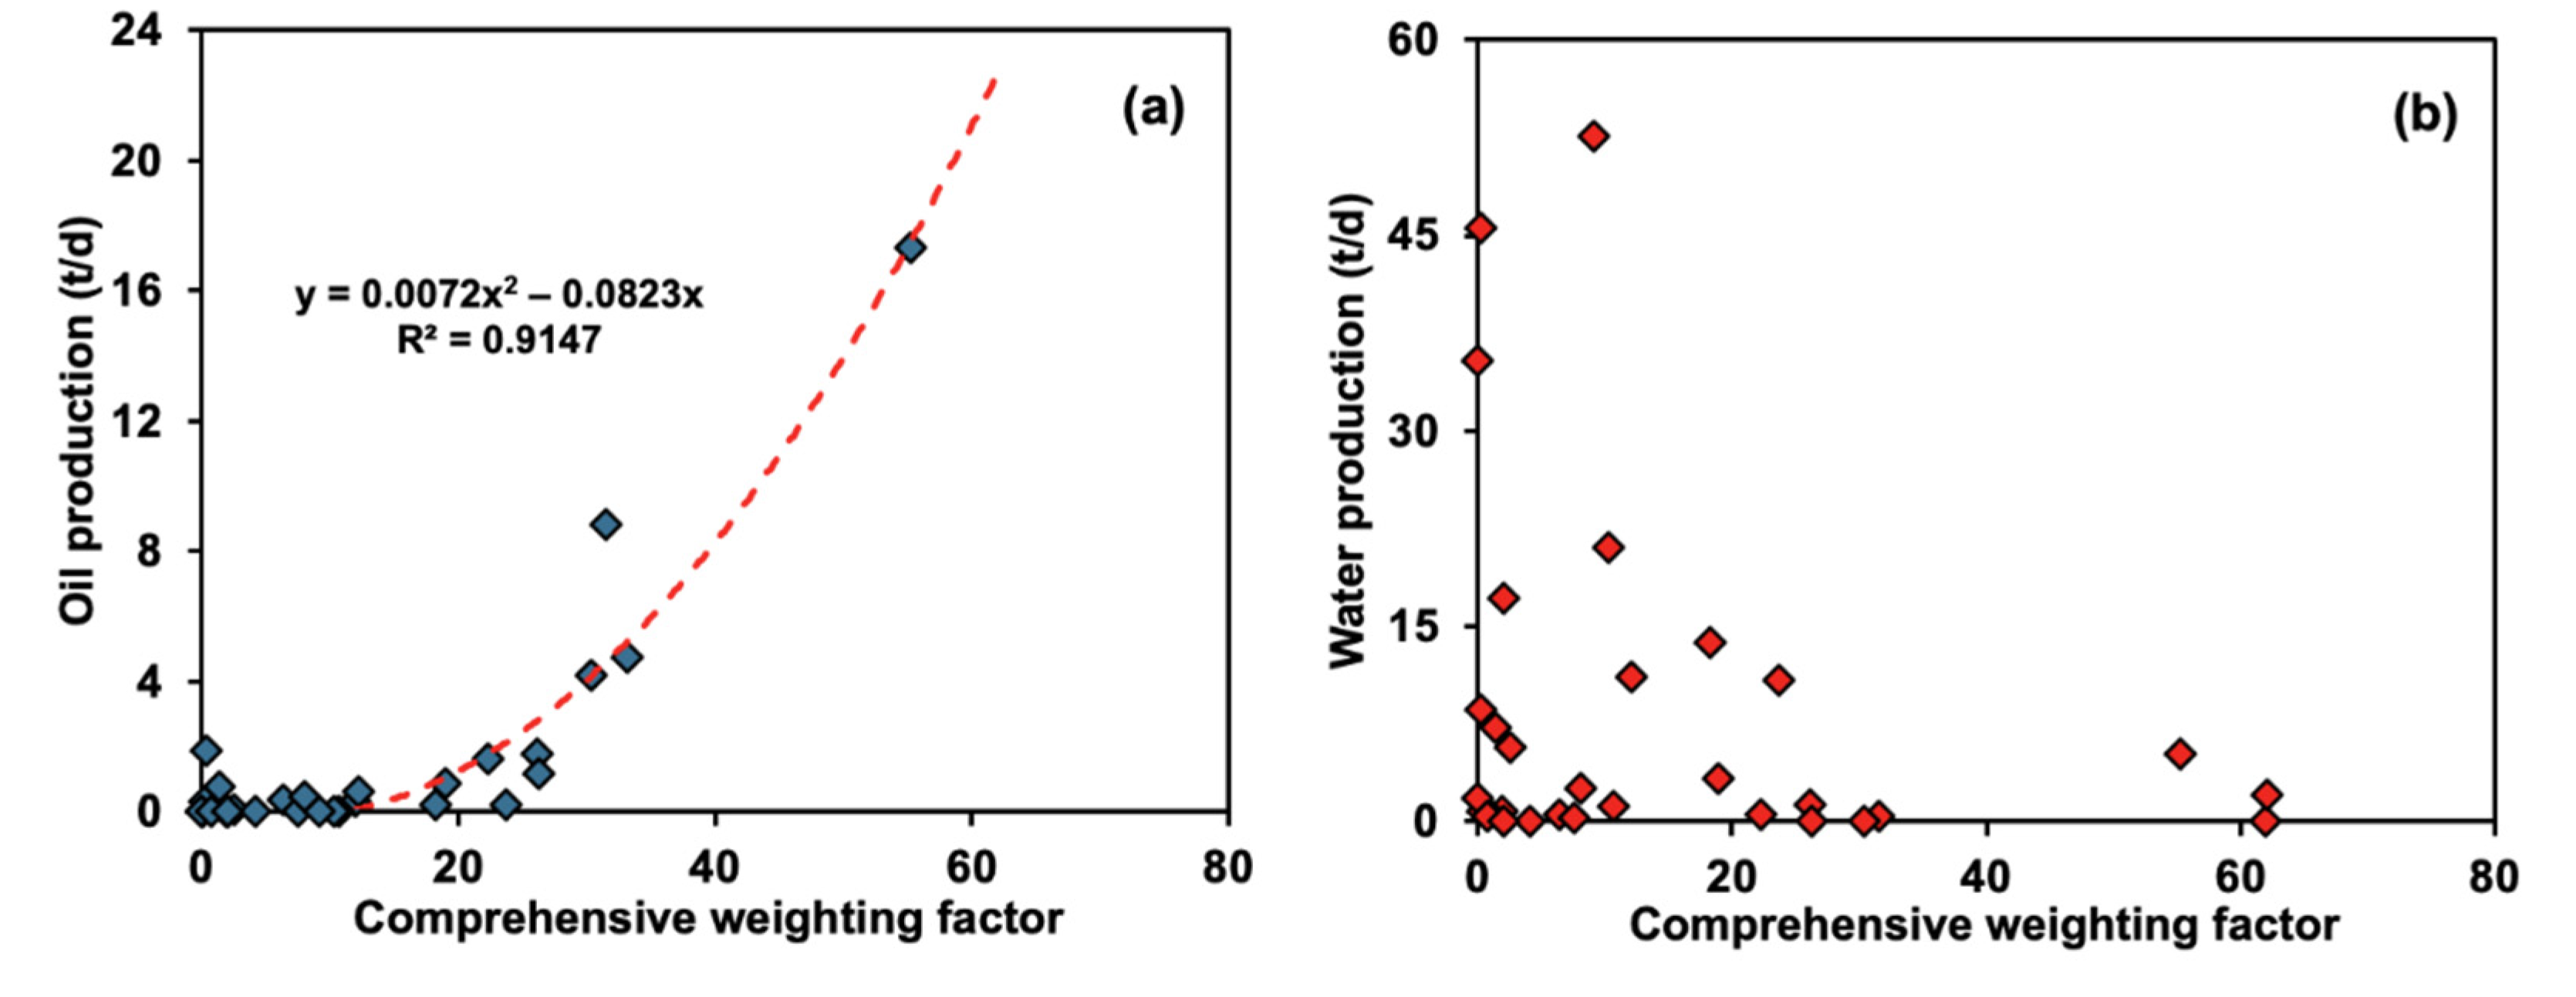
4.2. Comprehensive Evaluation Results

According to statistical results from some exploration wells in the study area, it can be seen that initial production of shale oil will increase with an increasing comprehensive weighting factor, especially when the comprehensive weight factor is larger than about 20 (Figure 10). Correspondingly, there is a decrease in the water production with an increasing comprehensive weighting factor. Based on the results calculated by Equation (18), the sweet spot of shale oil was determined. The average comprehensive weighting factor of the interval 2926–2955 m is 65.7, which is a favorable interval for shale oil development (Figure 11). The shale reservoir, within this interval, has a relatively high oil content, a high mobility ratio, and a high brittleness index, which are favorable factors for shale oil extraction; however, the shale has a normal formation pressure coefficient and relatively poor physical properties, which may increase the difficulty in fracturing simulation of the shale reservoir and mining the shale oil. It is important to note that we consider the shale strata as a whole, and whether it is an interlayer or a pure shale interval, all are regarded as part of the shale strata.
Structurally, Well Qiang21 is located at the edge of the Yangwuzhai Sag (see Figure 1), with a shallow burial depth interval of 2732.3–3035.0 m for the upper third number of the Shahejie Formation. This causes poor physical properties of the shale oil. As shown in Figure 12, as the depth increases, the viscosity and density of shale oil changes significantly. When the depth is greater than 3500 m, the viscosity and density decrease sharply. Relatively, the interval from 2732.3 to 3035.0 m in the Qing21 well has a high viscosity and density, which is not favorable for shale oil seepage. In addition, shale oil contains a high colloidal constituent and low saturated and aromatic hydrocarbons at the studied interval (Figure 13). Usually, saturated and aromatic hydrocarbons have strong flowability, while colloidal is composed by heavier hydrocarbons and has poor flowability. Therefore, shale oil extraction will present a great challenge for the Qiang21 well.

5. Conclusions

This paper presented a new method to quantitatively evaluate the shale oil sweet spot. A comprehensive sweet spot of shale oil is a superposition of geological and engineering sweet spots. The former can be expressed using the four parameters of oil content, movable oil ratio, pressure coefficient of reservoir fluid, and shale permeability; the latter can be reflected by a brittleness index. Based on these five primary parameters, a comprehensive weighting factor was established to quantitatively evaluate favorable shale oil reservoirs. A detailed methodology for calculating the comprehensive weighting factor and various primary parameters was provided.
The proposed method was applied to one key exploratory well (Qiang21) from Raoyang Sag of Bohai Bay basin, China. A sweet spot interval of the shale oil reservoir in the upper third member of the Shahejie Formation was determined at 2926–2955 m, where the interval has high oil content, a high mobility ratio, and a high brittleness index, which are favorable factors for shale oil extraction. However, the shale reservoir also has a normal formation pressure coefficient and relatively poor physical properties, which may increase the difficulty of fracturing the shale reservoir and mining the shale oil. Overall, the parameters of oil content and mobility ratio provide the main contributions to the comprehensive weighting factor.
The interval of 2732.3–3035.0 m in the Qiang21 well has a high viscosity, high density, high colloidal constituent, and low saturated and aromatic hydrocarbons, which are not favorable for shale oil seepage. Thus, shale oil extraction will present a great challenge for the Qiang21 well.

Author Contributions

Conceptualization, J.L.; methodology, J.L., Y.W. and R.Z.; investigation, H.G., B.L. and X.L. (Xiwei Li); writing—original draft preparation, X.L. (Xiaodong Li), K.C., P.L. and J.L.; writing—review and editing, H.W., L.Z. and J.L. All authors have read and agreed to the published version of the manuscript.

Funding

This work was supported by the National Natural Science Foundation (grant nos. 41972123 and 41922015).

Institutional Review Board Statement

Not applicable.

Informed Consent Statement

Not applicable.

Data Availability Statement

The study did not report any data.

Conflicts of Interest

The authors declare no conflict of interest. The funders had no role in the design of the study, in the collection, analyses, or interpretation of data, in the writing of the manuscript, or in the decision to publish the results.

References

  1. Tunstall, T. Iterative bass model forecasts for unconventional oil production in the Eagle Ford shale. Energy 2015, 93, 580–588. [Google Scholar] [CrossRef]
  2. Misch, D.; Gross, D.; Mahlstedt, N.; Makogon, V.; Sachsenhofer, R.F. Shale gas/shale oil potential of Upper Visean Black Shales in the Dniepr-Donets Basin (Ukraine). Mar. Pet. Geol. 2016, 75, 203–219. [Google Scholar] [CrossRef]
  3. Liu, C.; Wang, Z.; Guo, Z.; Hong, W.; Dun, C.; Zhang, X.; Li, B.; Wu, L. Enrichment and distribution of shale oil in the Cretaceous Qingshankou Formation, Songliao Basin, Northeast China. Mar. Pet. Geol. 2017, 86, 751–770. [Google Scholar] [CrossRef]
  4. Zhao, Y.; Jin, Z. Hydrocarbon mixture phase behavior in multi-scale systems in relation to shale oil recovery: The effect of pore size distributions. Fuel 2021, 291, 120141. [Google Scholar] [CrossRef]
  5. Feng, Q.; Xu, S.; Xing, X.; Zhang, W.; Wang, S. Advances and challenges in shale oil development: A critical review. Adv. Geo-Energy Res. 2020, 4, 406–418. [Google Scholar] [CrossRef]
  6. Hackley, P.C.; Cardott, B.J. Application of organic petrography in North American shale petroleum systems: A review. Int. J. Coal Geol. 2016, 163, 8–51. [Google Scholar] [CrossRef] [Green Version]
  7. Li, J.; Zhang, P.; Lu, S.; Xue, H.; Zhang, P.; Ma, F. Microstructural characterization of the clay-rich oil shales by nuclear magnetic resonance (NMR). J. Nanosci. Nanotechnol. 2017, 17, 7026–7034. [Google Scholar] [CrossRef]
  8. Yang, Z.; Zou, C.; Wu, S.; Lin, S.; Pan, S.; Niu, X.; Meng, G.; Tang, Z.; Li, G.; Zhao, J.; et al. Formation, distribution and resource potential of the “sweet areas (sections)” of continental shale oil in China. Mar. Pet. Geol. 2019, 102, 48–60. [Google Scholar]
  9. Jarvie, D.M. Shale resource systems for oil and gas: Part 2—Shale oil resource systems. AAPG Mem. 2012, 97, 89–119. [Google Scholar]
  10. Hu, T.; Pang, X.; Jiang, F.; Wang, Q.; Liu, X.; Wang, Z.; Jiang, S.; Wu, G.; Li, C.; Xu, T.; et al. Movable oil content evaluation of lacustrine organic-rich shales: Methods and a novel quantitative evaluation model. Earth Sci. Rev. 2021, 214, 103545. [Google Scholar] [CrossRef]
  11. Piane, C.D.; Almqvist, B.; Macrae, C.M.; Torpy, A.; Mory, A.J.; Dewhurst, D.N. Texture and diagenesis of Ordovician shale from the Canning Basin, Western Australia: Implications for elastic anisotropy and geomechanical properties. Mar. Pet. Geol. 2015, 59, 56–71. [Google Scholar] [CrossRef]
  12. Yang, Z.; Yang, L.; Tao, S.; Cui, J.; Wu, S.; Lin, S.; Pan, S. Formation conditions and “sweet spot” evaluation of tight oil and shale oil. Pet. Explor. Dev. 2015, 42, 555–565. [Google Scholar]
  13. Yin, J.; Hao, F.; Wang, Z.; Chen, X.; Zou, H. Lacustrine conditions control on the distribution of organic-rich source rocks: An instance analysis of the lower 1st member of the Shahejie Formation in the Raoyang Sag, Bohai Bay Basin. J. Nat. Gas Sci. Eng. 2020, 78, 103320. [Google Scholar] [CrossRef]
  14. Liu, Y.; Zeng, J.; Yang, G.; Jia, W.; Liu, S.; Kong, X.; Li, S. An innovative method for the characterization of oil content in lacustrine shale-oil systems: A case study from the middle Permian Lucaogou Formation in the Jimusaer sag, Junggar basin. Mar. Pet. Geol. 2021, 130, 105112. [Google Scholar] [CrossRef]
  15. Falk, K.; Coasne, B.; Pellenq, R.; Ulm, F.J.; Bocquet, L. Subcontinuum mass transport of condensed hydrocarbons in nanoporous media. Nat. Commun. 2015, 6, 6949. [Google Scholar] [CrossRef] [Green Version]
  16. Li, J.; Lu, S.; Xie, L.; Zhang, J.; Xue, H.; Zhang, P.; Tian, S. Modeling of hydrocarbon adsorption on continental oil shale: A case study on n-alkane. Fuel 2017, 206, 603–613. [Google Scholar] [CrossRef]
  17. Zou, C.; Yang, Z.; Cui, J.; Zhu, R.; Hou, L.; Tao, S.; Yuan, X.; Wu, S.; Lin, S.; Wang, L.; et al. Formation mechanism, geological characteristics and development strategy of nonmarine shale oil in China. Pet. Explor. Dev. 2013, 40, 14–26. [Google Scholar] [CrossRef]
  18. Zhou, L.; Zhao, X.; Chai, G.; Jiang, W.; Pu, X.; Wang, X.; Han, W.; Guan, Q.; Feng, J.; Liu, X. Key exploration & development technologies and engineering practice of continental shale oil: A case study of Member 2 of Paleogene Kongdian Formation in Cangdong Sag, Bohai Bay Basin, East China. Pet. Explor. Dev. 2020, 47, 1059–1066. [Google Scholar]
  19. Gao, Q.; Tan, M.; Zhang, Y.; Song, L.; Wei, X.; Zhang, M.; Zhang, P. Well-seismic joint technology for quantitative evaluation of “sweet spot” in continental shale oil: A case study of Lower Es3 Member of Luojia area in Jiyang Depression. Pet. Geol. Recovery Effic. 2019, 26, 165–173. [Google Scholar]
  20. Li, J.; Wang, M.; Lu, S.; Chen, G.; Tian, W.; Jiang, C.; Li, Z. A new method for predicting sweet spots of shale oil using conventional well logs. Mar. Pet. Geol. 2020, 113, 104097. [Google Scholar] [CrossRef]
  21. Zhang, J.; Xu, X.; Bai, J.; Liu, W.; Chen, S.; Liu, C.; Li, Y. Enrichment and exploration of deep lacustrine shale oil in the first Member of Cretaceous Qingshankou Formation, southern Songliao Basin, NE China. Pet. Explor. Dev. 2020, 47, 637–652. [Google Scholar] [CrossRef]
  22. Li, J.; Lu, S.; Xue, H.; Xie, L.; Zhang, P. Quantitative evaluation on the elastic property of oil-bearing mudstone/shale from a Chinese continental basin. Energy Explor. Exploit. 2015, 33, 851–868. [Google Scholar] [CrossRef] [Green Version]
  23. Mao, L.; Xiao, A.; Zhang, H.; Wu, Z.; Yi, L.; Wu, L.; Zhao, X. Structural patterns of the late Mesozoic crustal detachment system in the Raoyang Sag, Bohai Bay Basin, eastern China: New insights from 3D seismic data. Mar. Pet. Geol. 2017, 84, 215–224. [Google Scholar] [CrossRef]
  24. Chen, F.; Zheng, Q.; Lu, S.; Ding, X.; Ju, Y.; Zhao, H. Classification of the tight oil reservoir storage space in the Raoyang Sag of the Jizhong Depression in the Bohai Bay Basin, China. Energy Sci. Eng. 2019, 8, 74–88. [Google Scholar] [CrossRef]
  25. Lu, S.; Huang, W.; Chen, F.; Li, J.; Wang, M.; Xue, H.; Wang, W.; Cai, X. Classification and evaluation criteria of shale oil and gas resources: Discussion and application. Pet. Explor. Dev. 2012, 39, 268–276. [Google Scholar] [CrossRef]
  26. Curiale, J.A.; Curtis, J.B. Organic geochemical applications to the exploration for source-rock reservoirs-A review. J. Unconv. Oil Gas Resour. 2016, 13, 1–31. [Google Scholar] [CrossRef]
  27. Liu, B.; Bai, L.; Chi, Y.; Jia, R.; Fu, X.; Yang, L. Geochemical characterization and quantitative evaluation of shale oil reservoir by two-dimensional nuclear magnetic resonance and quantitative grain fluorescence on extract: A case study from the Qingshankou Formation in Southern Songliao Basin, northeast China. Mar. Pet. Geol. 2019, 109, 561–573. [Google Scholar]
  28. Passey, Q.R.; Creaney, S.; Kulla, J.B.; Moretti, F.J.; Stroud, J.D. A practical model for organic richness from porosity and resistivity logs. AAPG Bull. 1990, 74, 1777–1794. [Google Scholar]
  29. Huang, W.; Deng, S.; Lu, S.; Yu, L.; Hu, S.; Zhang, J. Shale organic heterogeneity evaluation method and its application to shale oil resource evaluation—A case study from Qingshankou Formation, southern Songliao Basin. Oil Gas Geol. 2014, 35, 704–711. [Google Scholar]
  30. Li, J.; Lu, S.; Cai, J.; Zhang, P.; Xue, H.; Zhao, X. Adsorbed and free oil in lacustrine nanoporous shale: A theoretical model and a case study. Energy Fuels 2018, 32, 12247–12258. [Google Scholar]
  31. Li, J.; Wang, S.; Lu, S.; Zhang, P.; Cai, J.; Zhao, J.; Li, W. Microdistribution and mobility of water in gas shale: A theoretical and experimental study. Mar. Pet. Geol. 2019, 102, 496–507. [Google Scholar] [CrossRef]
  32. Zhang, L.; Bao, Y.; Li, J.; Li, Z.; Zhu, R.; Zhang, J. Movability of lacustrine shale oil: A case study of Dongying Sag, Jiyang Depression, Bohai Bay Basin. Pet. Explor. Dev. 2014, 41, 641–649. [Google Scholar] [CrossRef]
  33. Eaton, B.A. The effect of overburden stress on geopressure prediction from well logs. J. Pet. Technol. 1972, 24, 929–934. [Google Scholar] [CrossRef]
  34. Eaton, B.A. The equation for geopressure prediction from well logs. In Proceedings of the Fall Meeting of the Society of Petroleum Engineers of AIME, Dallas, TX, USA, 28 September–1 October 1975. [Google Scholar]
  35. Gurevich, A.E.; Chilingar, G.V.; Aminzadeh, F. Origin of the formation fluid pressure distribution and ways of improving pressure prediction methods. J. Pet. Sci. Eng. 1994, 12, 67–77. [Google Scholar] [CrossRef]
  36. Bowers, G.L. Pore pressure estimation from velocity data: Accounting for overpressure mechanisms besides undercompaction. SPE Drill. Complet. 1995, 10, 89–95. [Google Scholar] [CrossRef]
  37. Liu, L.; Shen, G.; Wang, Z.; Yang, H.; Han, H.; Cheng, Y. Abnormal formation velocities and applications to pore pressure prediction. J. Appl. Geophys. 2018, 153, 1–6. [Google Scholar] [CrossRef]
  38. Liu, H.; Wang, Y.; Jiang, Y.; Yuan, F.; Chen, K.; Guo, Z. Quantification models of overpressuring in Paleogene source rocks of the Raoyang Depression, Bohai Bay Basin, China. Mar. Pet. Geol. 2019, 109, 607–622. [Google Scholar] [CrossRef]
  39. Du, F.; Huang, J.; Chai, Z.; Killough, J. Effect of vertical heterogeneity and nano-confinement on the recovery performance of oil-rich shale reservoir. Fuel 2020, 267, 117199. [Google Scholar] [CrossRef]
  40. Goral, J.; Panja, P.; Deo, M.; Andrew, M.; Linden, S.; Schwarz, J.O.; Wiegmann, A. Confinement effect on porosity and permeability of shales. Sci. Rep. 2020, 10, 49. [Google Scholar] [CrossRef] [Green Version]
  41. Li, L.; Hao, Y.; Lv, Y.; Wang, C.; Yao, C.; Zhao, Q.; Xiao, P. Experimental investigation on low-velocity seepage characteristics and influencing factors in a shale oil reservoir. J. Pet. Sci. Eng. 2020, 195, 107732. [Google Scholar] [CrossRef]
  42. Shao, W.; Xie, J.; Chi, X.; Li, J.; Wu, S.; Xiao, F. On the relation of porosity and permeability in low porosity and low permeability rock. Well Logging Technol. 2013, 37, 149–153. [Google Scholar]
  43. Hearn, C.L.; Ebanks, W.J.; Tye, R.S.; Ranganathan, V. Geological Factors Influencing Reservoir Performance of the Hartzog Draw Field, Wyoming. J. Pet. Technol. 1984, 36, 1335–1344. [Google Scholar] [CrossRef]
  44. Nooruddin, H.A.; Hossain, M.E. Modified Kozeny-Carmen correlation for enhanced hydraulic flow unit characterization. J. Pet. Sci. Eng. 2011, 80, 107–115. [Google Scholar] [CrossRef]
  45. Ghiasi-Freez, J.; Kadkhodaie-Ilkhchi, A.; Ziaii, M. Improving the accuracy of flow units prediction through two committee machine models: An example from the South Pars Gas Field, Persian Gulf Basin, Iran. Comput. Geosci. 2012, 46, 10–23. [Google Scholar] [CrossRef]
  46. Zhang, P.; Lu, S.; Li, J.; Zhang, J.; Xue, H.; Chen, C. Permeability evaluation on oil-window shale based on hydraulic flow unit: A new approach. Adv. Geo-Energy Res. 2018, 2, 1–13. [Google Scholar] [CrossRef] [Green Version]
  47. Bowker, K.A. Barnett Shale gas production, Fort Worth Basin: Issues and discussion. AAPG Bull. 2007, 91, 523–533. [Google Scholar] [CrossRef]
Figure 1. Locations of the study area and the key wells.
Energies 14 05519 g001
Figure 2. Organic geochemical characteristics of shales in Well Qiang21. (a) Total organic carbon (TOC) content distribution; (b) S1 content distribution; (c) S1 + S2 content distribution.
Energies 14 05519 g002
Figure 3. Petrological characteristics of shales in Well Qiang21. (a) Inorganic mineral components, (b) clay compositions.
Energies 14 05519 g003
Figure 4. Relationships of chloroform bitumen “A” with S1 (a), and burial depth with K2 (b).
Energies 14 05519 g004
Figure 5. Evaluation results of organic geochemistry and pressure coefficient of shale reservoir and mobility of shale oil.
Energies 14 05519 g005
Figure 6. Evolution profile of hydrocarbon generation in shale. (a) A relationship of S1/TOC with depth; (b) a relationship of (S1+S2)/TOC with depth; (c) a relationship of S1 content with depth; (d) a relationship of HI index with depth.
Energies 14 05519 g006
Figure 7. Division of hydraulic flow unit (a), relationship of porosity with permeability in each hydraulic flow unit (b), verification of calculated FZI and porosity values (c,d).
Energies 14 05519 g007
Figure 8. Calculated results of porosity and permeability of the shale reservoir.
Energies 14 05519 g008
Figure 9. Calculated results of inorganic components and brittleness.
Energies 14 05519 g009
Figure 10. Relationships of initial oil (a) and water (b) production with the comprehensive weighting factor.
Energies 14 05519 g010
Figure 11. Distribution of the comprehensive weight factor.
Energies 14 05519 g011
Figure 12. Relationships of density (a) and viscosity (b) of oil with burial depth.
Energies 14 05519 g012
Figure 13. Relationships of shale oil compositions—(a) saturated hydrocarbon, (b) aromatic hydrocarbon, (c) colloid, (d) asphaltene—with burial depth.
Energies 14 05519 g013
Publisher’s Note: MDPI stays neutral with regard to jurisdictional claims in published maps and institutional affiliations.

