Abstract
Post-production waste generated in the brewing industry was used to analyze the possibility of Cd(II) ion recovery in biosorption processes. Brewer’s grains (BG), which are waste products from beer manufacturing processes, are a promising material that can be reused for biosorption. The biomass contains appropriate functional groups from fats, proteins, raw fibers, amino acids, carbohydrates and starch, showing a strong affinity for binding metal ions and their removal from wastewater. The biosorbent material was characterized by several research methods, such as particle size distribution, elemental composition and mapping using SEM-EDX analysis, specific surface area and pore volume (BET, BJH), thermogravimetry, electrokinetic zeta potential, SEM morphology and FT-IR spectrometry. Initial and equilibrium pH, adsorbent dosage, initial metal concentration and contact time were parameters examined in the research. The highest biosorption efficiency was obtained at a level of 93.9%. Kinetics analysis of the processes and sorption isotherms were also carried out. Based on the conducted experiments, it was found that this material has binding properties in relation to Cd(II) ions and can be used for wastewater treatment purposes, being a low-cost biosorbent. This research studies are in line with current global trends of circular and sustainable economies.
1. Introduction
Cadmium (Cd) is one of the most toxic and harmful metals. It exists naturally in water, air, soils and foodstuffs. The most common forms of the metal are pure cadmium oxide (87.5% Cd), cadmium sulfide (77.6% Cd), otavite, cadmium carbonate (61.5% Cd) and greenockite (CdS). Cadmium is released into the environment as a result of many industrial processes, such as production of alloy, cadmium-nickel batteries, pesticides, fertilizers, plastics, pigments and dyes, smelting, electroplating, mining, refining and textile operations [1,2,3]. Cadmium has toxic properties in relation to living organisms and is a problem for the environment and food chain when it is present in excess amounts. The World Health Organisation recommends the maximum contaminant level (MCL) of Cd(II) in drinking water at up to 0.005 mg/L [4].
The brewing industry occupies a strategic economic position in the global economy and is open to technological development and scientific progress. In 2019, global beer production amounted to approximately 1.91 billion hectoliters [4]. The following countries are the leading producers in the world (in million liters in 2017): China (39.788), USA (21.775), Brazil (14.000), Mexico (11.000), Germany (9.301), Russia (7.440), Japan (5.247), Great Britain (4.405), Vietnam (4.375), Poland (4.050). Beer is ranked fifth in the ranking of the most consumed beverages in the world after tea, carbonated drinks, milk and coffee, with an average consumption of 23 L per person per year [5,6,7].
Increasing production in the brewing industry also brings with it millions of tons of waste, which is both an ecological and economic problem. Huge amounts of brewer’s grains (BG) each year lead to environmental degradation, but also to the loss of valuable material that could be used as animal feed, fuel, raw material for methane production and many other purposes. Due to its valuable composition, one of the directions of reuse may be the extraction of ingredients such as amino acids, fats, proteins, polysaccharides, fiber, enzymes, vitamins, flavor compounds or phytochemicals, which can be reused as functional ingredients in food or pharmacological production [8]. Another alternative solution may be the use of brewer’s grains (BG) to treat wastewater from heavy metals and other toxic pollutants through adsorption processes. Due to the presence of many functional groups (e.g., carboxyl, amide, amine, etc.), it is possible to bind metal ions in chemical and physical reactions. The biosorption process is one of the most promising and alternative techniques because of its low operating costs, mainly due to the use of cheap biowaste, the ease of obtaining materials, minimizing significant amounts of waste and high efficiency in removing metal ions from wastewater. The costs of water treatment by adsorption are difficult to determine as they depend on many factors. However, it can be assumed that they are in the range of about USD 5–200 per m3 and are significantly lower compared to other commercial methods of metal removal from wastewater of about 10– USD 450 per m3) [9]. In 2018, beer production in Poland amounted to approx. 40.93 million hectoliters [10]. Assuming that per 100 hectoliters of beer produced, there is an average of approx. 15–19 kg of the by-product in the form of brewer’s grains (BG) with a dry matter content in the range of 35–40% [11], it can be estimated that in 2018, from 6.139 to 7776.7 tons of this waste were generated in Poland. Such amounts can be considered significant, which offers the possibility of their potential use in biosorptive processes for removing metals from wastewater.
The aim of this study was to determine the efficiency of the biosorption process of post-production waste in the form of brewer’s grains in relation to Cd(II) ions. In addition, the purpose was also to characterize the physicochemical properties of the biosorbent using selected analytical methods as well as to study sorption kinetics, equilibrium and isotherms.
2. Experimental Procedure
2.1. Materials and Methods
2.1.1. Brewer’s Grains Preparation
In this study, samples of the brewer’s grains (BG) (Figure 1) were obtained as a result of a beer production process in the brewing industry in a Polish factory (Greater Poland voivodeship). The brewing effluents collected from the production process were wet biomass; therefore, they were dried in a laboratory dryer (BINDER Gmbh, Tuttlingen, Germany) at a temperature of 60 °C to constant weight and then placed in polyethylene containers and cooled in a desiccator. Then, the dried BG were ground and screened through a sieve in order to select grains with a diameter less than 0.212 mm. The samples prepared in this way were used for analyses. All chemical compounds used in the study were pure for analysis. Distilled water was used in the research.
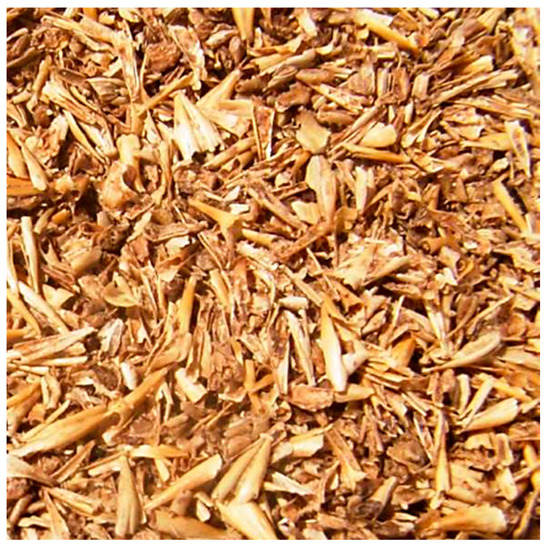
Figure 1.
Sample of brewer’s grains.
2.1.2. Brewer’s Grains Characterization
Particles of brewer’s grains (BG) with a diameter less than 0.212 mm were used in these studies. At the beginning, the physicochemical properties of the biomass were analyzed with the use of selected analytical techniques such as particle size distribution, elemental composition and mapping using SEM-EDS analysis, electrokinetic zeta potential, specific surface area and pore diameter (BET adsorption isotherms), pore volume and pore volume distribution (BJH), thermogravimetry (TGA, DTG), SEM morphology, and FT-IR analysis. The detailed description of the methods are presented as supplementary material (SM Methods).
2.1.3. Biosorption Process of Cd(II) ions
The efficiency of the Cd(II) biosorption process on brewer’s grains (BG) was determined by shaking at room temperature (23 ± 1 °C). A standard solution (Cd2+, 1 g/L, Sigma-Aldrich) was used in the experiments. Biosorbent samples (1–50 g/L) and a Cd(II) stock solution at a concentration of 10 mg/L (volume of the solutions V = 20 mL) and at an initial pH 2–5 were placed in conical flasks and shaken at rotational speed 200 rpm for 60 min until equilibrium was reached. NaOH and HCl solutions (both 0.1 M) were used to adjust the pH of the Cd(II) stock solutions. After the biosorption processes, the solutions were centrifuged for 15 min (4000 rpm) for phase separation. The concentration of cadmium(II) ions in the solutions after biosorption was analyzed using an atomic absorption spectrophotometer SpectrAA 800 (F-AAS, at a wavelength λ = 228.8 nm for cadmium, Varian, Palo Alto, USA). The measurements were repeated three times at room temperature (23 ± 1 °C) and normal pressure and the results are presented as mean values of all measurements. Measurement errors were calculated, and confidence intervals are presented in tables and figures. The biosorption efficiency A (%) and the biosorption capacity qe (mg/g) were calculated on the basis of Equations (1) and (2):
where: C0 and Ce (mg/L) are initial and equilibrium metal ion concentrations, respectively, and V (L) is the volume of solution and m (g)—mass of BG.
Kinetics and isotherms were studied using pseudo-first-order and pseudo-second-order, Langmuir and Freundlich models according to Equations (3)–(6).
where qt (mg/g) is the amount of Cd(II) ions adsorbed at any time t (min.), qe (mg/g) is the maximum amount of Cd(II) ions adsorbed per mass of BG at equilibrium, k1 (1/min) is the rate constant of pseudo-first-order adsorption, k2 (g/(mg·min.)) is the rate constant of pseudo-second-order adsorption, qmax (mg/g) is the maximum adsorption capacity, KL is the Langmuir constant, Ce (mg/L) is the equilibrium concentration after the adsorption process, KF is the Freundlich constant and 1/n is the intensity of adsorption.
3. Results and Discussion
3.1. The Process of Beer Production and Post-Production Brewer’s Grains
Four main raw materials are used in the production of beer: water, barley malt, hops and yeast. Water is necessary primarily for the malting of barley, mashing of malt and production of malt wort, but also for cooling processes, in the boiler room and for washing equipment and packaging. The quality of water in brewing should be appropriate, hence it is subjected to treatment processes. Water quality requirements are specified in the Regulation of the Minister of Health on the quality of water intended for human consumption [12]. The general scheme of beer production is shown in Figure 2. Initially, wort is produced in many different processes. First, malt is ground mechanically to allow enzymes to break down insoluble substances into soluble compounds. The next and most important stage of wort production is mashing, in which insoluble malt components (cellulose, starch) at an optimal temperature and under influence of enzymes pass into the aqueous solution, creating a soluble extract in the form of minerals, proteins and sugars. Then, in the wort filtration process, solids are separated into so-called brewing waste or spent grains. During the boiling of wort, resins and essential oils are released from hops, protein-tannic compounds are precipitated, enzymes are decomposed and the wort becomes acidic and colored. Hops and hot sludge in the settling vat are removed from the hop wort followed by cooling and aeration. In the fermentation process, sugars are converted by yeast enzymes into C2H5OH and CO2. In the last stage of fermentation, maturing and conditioning at low temperatures take place, in which yeast cells draw energy from the decomposition of spare substances still present in the wort. The yeast flocculates and sinks to the bottom of the tank. At this stage, the taste of the beer is finally achieved. At the end, beer is filtered to remove particles that could cause turbidity. The finished beer is poured into bottles or cans and sold [8].
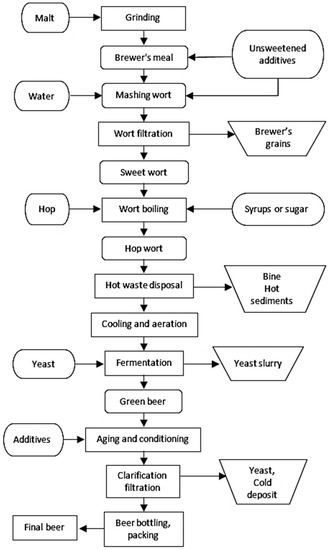
Figure 2.
General scheme of beer production.
The amount of brewer’s grains produced is difficult to estimate. Producers keep their data secret because for the protection of intellectual property and the fear of inspection by organizations responsible for waste management. On the other hand, production processes are varied, and depend on technologies used and the size of brewery. Based on the literature, it is assumed that an average of 15–19 kg of by-product in the form of brewer’s grains with a dry matter content of approx. 35–40% is produced per 100 hl of produced beer [11,13].
3.2. Characterization of the Biosorbent
Pursuant to the Act on Waste and the Regulation of the Polish Minister of Environment on waste recovery outside of installations and devices, the brewer’s grains are classified as waste with the code 02 07 80 and are defined as bagasse, post fermentation must sediments (trub) and decoctions [14,15]. The brewing waste is brown or light brown in color and has a characteristic grain or bread aroma. Moist biomass contains approx. 18–23% of dry matter consisting mainly of barley, barley malt, wheat, rice, maize and hops. The most important nutrients are proteins, fats, crude fibers, crude ash, starch, carbohydrates, phosphorus, calcium, lysine, methionine, potassium, sodium, magnesium, B vitamins and others depending on the origin of the biomass. It is estimated that the total amount of nutrients is approx. 66% of dry matter, starch and sugars-approx. 14% of dry matter and protein substances-approx. 26% of dry matter. According to the Regulation of the Polish Minister of Environment on waste recovery outside of installations and devices, the method of recovering brewer’s grains (BG) as waste is the R14 recovery process, stating that the waste can be used for ‘feeding animals-in accordance with the rules of feeding individual species’ [16]. Feeding livestock with BG waste has many benefits, such as elimination of costs related to storage and disposal, nutritional components having a good effect on health and condition of animals, as well as lower costs of feeding animals compared to the use of commercial feed. There are also other applications, such as use as a raw material for the production of various feeds, the use of modified BG for the production of edible mushrooms, the use as biomass for gasification processes in the production of methane in biogas plants and the use as an additive to fossil fuels in power plants as well as processing into solid fuel (briquettes, pellets) [13]. Another alternative application of post-production BG may be the removal of heavy metals from aqueous solutions in biosorption processes.
In preliminary experiments, BG waste was characterized in terms of physical and chemical properties using a number of methods. The analysis of particle size distribution using a laser diffraction method showed the presence of one peak with a particle size of 67.8 nm (Figure S1). The strength of the material and the rate of hydration are properties that depend on particle size distribution. Moreover, this parameter serves as an important indicator of particle quality and performance in many different processes. It should be noted that the laser diffraction method has limitations, in that only particles capable of being suspended in solution can be analyzed. Due to the complexity and nature of the BG mixture, the larger and heavier particles fall to the bottom of the solution. Smaller particles are able to dissolve faster in solution and form a more stable suspension compared to larger ones. Therefore, it was possible to measure only particles suspended in the solution. Based on the results, it can be stated that the BG particles are not homogeneous. In accordance with the literature data, as the biosorbent particle size decreased, the surface area of particles and the number of active sites on the sorbent increased, which resulted in an increase in cadmium ion removal efficiency [17,18]. Hence, it is suggested to use biosorbent fractions with the smallest particle size in experiments.
Elemental analysis was carried out using the SEM-EDS method and the results are presented in Figure 3 and Table 1. The biomass mainly contained elements, such as: O, C, P, Mg, Si, Ca, K, Na, S and oxides: CO2, P2O5, MgO, SiO2, CaO, K2O, Na2O, SO3. The content of oxides was not the result of direct measurements, but the result of stoichiometric calculations based on the estimation in the EDS microanalyzer. The measurement in this method was carried out pointwise on the surface of the biomass sample. Therefore, the content of elements and their amounts may slightly differ in different places of the sample due to complexity of the BG mixture and its inhomogeneity.
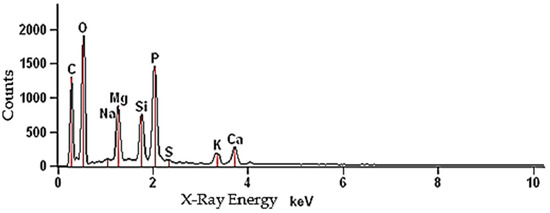
Figure 3.
The EDS spectrum of brewer’s grains.

Table 1.
Elemental composition of BG waste (EDS microanalyser).
As a result of BET analysis, specific surface area (4.218 m2/g), pore volume (0.0046 cm3/g) and pore diameter (4.386 nm) were determined (Figure 4, Figure 5 and Figure 6). The BET adsorption isotherm, which depends on the pore size and the intensity of adsorbent-adsorbate interaction, slightly resembles the type III isotherm in that it is slightly convex towards the pressure axis. The isotherm indicates cooperative adsorption, which indicates that previously adsorbed molecules can contribute to increasing the adsorption efficiency of other free molecules. On the other hand, low adsorption efficiency may occur in the case of low relative pressure and weak interaction at the adsorbent-adsorbate interface. In any case, the isotherm becomes convex into the pressure axis in a situation where, after a single adsorption, the interaction between adsorbent and adsorbate promotes adsorption of further metal ions [19].
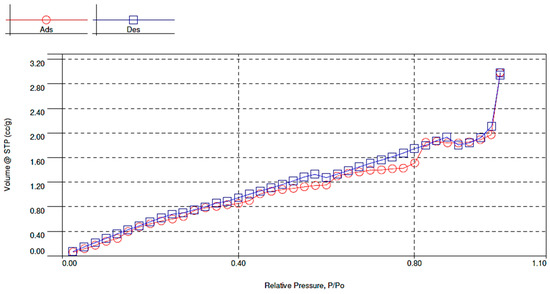
Figure 4.
Linear form of the BET adsorption and desorption isotherm of brewer’s grains.
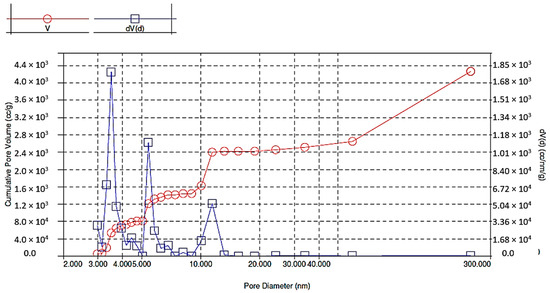
Figure 5.
Pore size distribution in brewer’s grains during adsorption.
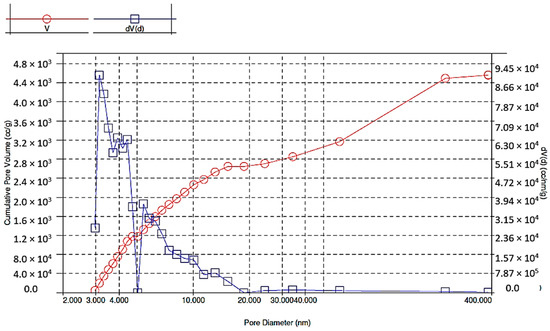
Figure 6.
Pore size distribution in brewer’s grains during desorption.
Thermogravimetric analysis was carried out at a temperature ranging from 29 to 600 °C (Figure 7). As a result of these measurements, a gradual loss of weight of the biomass material with increasing temperature was observed. The first phase of decomposition of the BG pomace occurred in the temperature range from 30 to 120 °C, and the second in the range of about 180–500 °C, as shown by the TGA and DTG curves. In the first stage there was a slight decrease in weight equal to approx. 1.8%, which may have resulted from evaporation of adsorbed water from the pomace sample. In the next phase, greater weight loss (about 38%) was observed, which was a consequence of the pyrolysis process and the evaporation of most of the volatile substances (e.g., CO2). At a temperature of 355 °C, the spectrum shows a very intense peak (DTG) that relates to the breakdown of lipids, carbohydrates and proteins. Similar research results have been published in the literature [20,21].
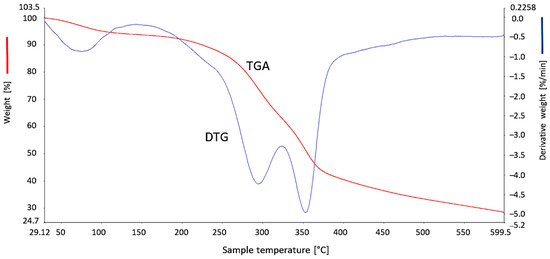
Figure 7.
Thermogravimetric curves of brewer’s grains.
The analysis of electrokinetic zeta potential was carried out by combining electrophoresis and measuring the velocity of particles in liquid with red laser (λ = 633 nm) based on the Doppler effect (LDV). Determining this parameter is important for many industrial activities, including wastewater treatment in terms of environmental protection. It makes it possible to determine the influence of surface charge on the metal ion sorption process and to estimate its efficiency [22]. According to the literature, aqueous slurry is more stable at higher zeta potential values, as electrostatically charged particles repel each other, overcoming the tendency to aggregate and agglomerate [23,24]. These studies showed that pH values had an influence on the surface charge, which gradually decreased from −3.01 mV (pH 2.01) to −32.1 mV (pH 6.93) (Figure 8). The isoelectric point (IEP) is set at the zero point (no electrical charge) and represents the equilibrium balance between negative and positive ions (the system is the least stable). At the IEP point, the particles of the suspension are characterized by the lowest solubility, viscosity and osmotic pressure. In this analysis, the electrostatic charge did not reach the isoelectric point (IEP) and took only negative values below the IEP. This means that there is an advantage of positively charged particles over negatively charged ones on the biomass surface in the pH range from 2.0 to 7.0.
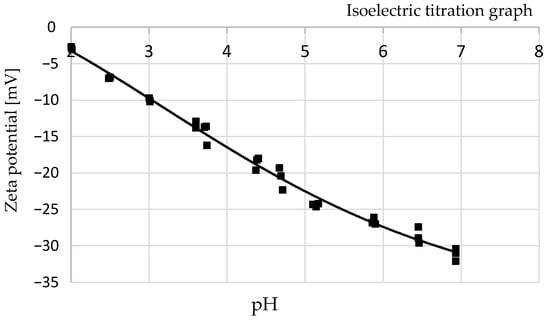
Figure 8.
The change in zeta potential with equilibrium pH.
Brewer’s grains were analyzed using SEM morphology and images are shown in Figure 9A,B. Generally speaking, the brewer’s grains consist of particles of varying size, including larger, elongated particles and smaller spherical particles placed between them. Shape irregularities occur with both smaller and larger particles. The structure is not homogeneous, and developed flat surfaces are visible. Some particles have a fibrous structure, suggesting they are derived from the same barley grains or embryonic tissue. The remaining particles are covered with small spherical projections that represent the characteristic formations on the outer cells of the seed coat. The visible spherical material is less cohesive, has a looser structure, and the particles are not densely packed. Such particles have uneven surfaces and edges and can chip off easily. A similar structure to this biomass was described by other authors [25,26,27,28,29,30].
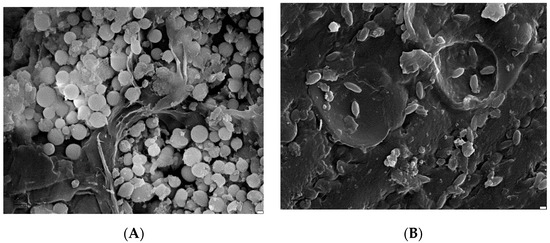
Figure 9.
SEM images of BG residues: (A) magn.: ×10,000, scale bar: 2 μm, (B) ×10,000, 2 μm.
3.3. FT-IR Analysis
FT-IR measurements of brewer’s grain residues before and after the sorption process were carried out and Figure 10 shows the spectra. The following experimental conditions were used to examine the samples: BG dose 25 g/L, initial concentration of Cd(II) ions 10 mg/L, initial pH 4, T = 23 ± 1 °C, contact time 60 min. The description of the FT-IR peaks is presented in Table 2. The spectra were analysed before and after the biosorption process in terms of differences in shape, intensity of bands, frequency and possible interaction of functional groups with Cd(II) ions. Figure 10 shows that after the sorption process, the intensity of the bands shifted towards lower transmittance values, and their location remained at the same wavelengths or was slightly shifted. These changes can be identified as follows: 3284.83 (shift to 3289.81 cm−1), 2923.72 (shift to 2919.92 cm−1), 2852.02 (shift to 2851.84 cm−1), 1643.84 (shift to 1633.69 cm−1), 1515.88 (shift to 1539.91 cm−1), 1428.13 (shift to 1427.82 cm−1), 1032.92 (shift to 1032.7 cm−1). The occurring phenomena of peak shifts can be explained by the interaction and bonding of Cd(II) ions with functional groups of compounds present in BG residues, probably due to the process of ion exchange. This shifting could occur due to the formation of a bond between Cd2+ with oxygen and nitrogen.
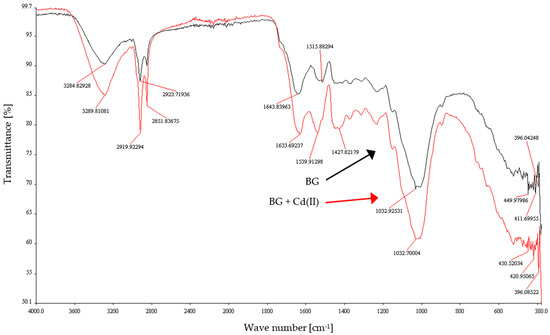
Figure 10.
FT-IR spectrum of BG residues before and after Cd(II) ions adsorption.
Table 2.
FT-IR peaks of BG residues.
During the biosorption process with BG sorbent, the mechanism of ion exchange between Cd(II) ions and various metal cations (e.g., Mg2+, Ca2+) probably took place. The presence of various metal cations was determined by the SEM-EDS method (Table 2). It is assumed that ion exchange between protons or ionizable cations on the surface of the biosorbent participated in binding of Cd(II) ions at initial pH 4.0.
Zeta potential studies showed that BG particles contained a lot of negative charges on their surface (Figure 8). It is therefore possible to assume that electrostatic attraction could also occur during the biosorption of Cd(II) ions. In these studies, at initial pH 4.0, the BG sorbent had the highest sorption capacity, where zeta potential ranging from −16 to −17 mV was observed. This phenomenon could have been a consequence of the presence of a greater number of localized electrons, which could attract more Cd(II) ions on the BG surface [31].
According to this research, the probable mechanism of Cd(II) biosorption can be explained by ion exchange reactions based on the Equations (7)–(9):
where: BGm is the brewer’s grains residues matrix.
It should be mentioned that high sorption efficiency of Cd(II) ions at the level of at least 90% was observed in this study under various experimental conditions. Chemical properties of cadmium, which facilitate the attraction of the sorbent to active sites, promote satisfactory results. Additionally, the electronegativity constant (Pauling’s) of Cd(II) is 1.69, which is responsible for electrostatic attraction [32]. High sorption capacity of Cd(II) may be also influenced by such factors as first hydrolysis constant pKH 10.1 (negative logarithm of hydrolysis constant), ionic radius of Cd2+ (1.54 Å) and ionization energy (207 kcal/g/mol). These parameters favor easier sorption on the brewer’s grains surface [33].
3.4. Biosorption Process of Cd(II) Ions
3.4.1. Impact of Adsorbent Dosage
The impact of BG dosage on biosorption efficiency of Cd(II) ions was investigated and Figure 11 shows the results. The ffollowing conditions were used during the research: initial concentration of Cd(II) ions 10.0 mg/L, pH 2–5, agitation speed 200 rpm, T = 23 ± 1 °C, contact time 60 min. In general, increasing sorbent dosage up to 50 g/L increased the biosorption efficiency. The results clearly show that maximum sorption was reported at a dose of 10 g/L (93.9%, initial pH 4) and the lowest efficiency was reported at the initial pH 2. Further increasing the BG dose was not necessary as no further improvement was observed, and optimization of the process was achieved. Besides, biosorption capacity decreased from 8.4 mg/g (dose 1 g/L, pH 5) to 0.04 mg/g (dose 50 g/L, pH 2) (Figure 11B). The parameter was the highest at the smallest doses (1 g/L), while Cd(II) removal (%) was the lowest, which means that the saturation value was reached. This phenomenon can be attributed to the increased surface area of the BG biosorbent, availability of more sorption sites, and it may result from completed interactions of some factors. The decrease in biosorption capacity in the subsequent reactions can be attributed to aggregation or overlapping of active sites, resulting in a reduction in the total surface area of the biosorbent. The results obtained in this way can be explained by the fact that biosorption capacity depends on both the concentration of adsorbed Cd(II) ions and biomass dosage [36,37].
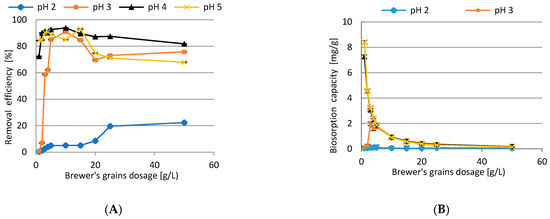
Figure 11.
The impact of BG dosage on biosorption efficiency (A) and biosorption capacity (B) of Cd(II) ions.
3.4.2. Impact of Initial Concentration of Cd(II)
Biosorption behavior under different initial concentration of Cd(II) ions was studied and the results are presented in Figure 12. After analyzing previous research results, it was decided to apply the following experimental conditions: initial concentration of Cd(II) ions (2.5–50 mg/L), adsorbent dosages 1–50 g/L, initial pH 4, contact time 60 min, rotation speed 200 rpm, T = 23 ± 1 °C. An increase in adsorption efficiency was observed in the case of initial concentrations of 1 mg/L and 50 mg/L. In other cases, there was no upward or downward trend, and the results remained stable. The highest removal equal to 93.43% was achieved for the biomass dosage of 10 g/L and initial concentration of 10 mg/L.
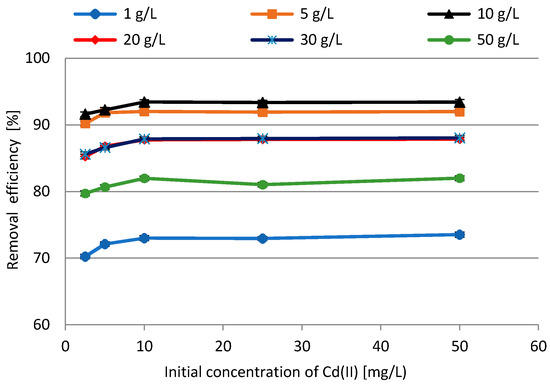
Figure 12.
The impact of initial concentration of Cd(II) ions on BG residues removal efficiency.
3.4.3. Analysis of pH Profile
The influence of initial pH on the efficiency of the process was investigated and the results are presented in Figure 13. The applied conditions of the experiments were as follows: initial concentration of Cd(II) ions 10.0 mg/L, BG dosage 1.0–50 g/L, pH range of 2–5, contact time 60 min, rotation speed 200 rpm, T = 23 ± 1 °C. After analysis of the results, it was found that the best performance was obtained at pH 4.0. Maximum sorption was observed for the following biosorbent doses: 1 g/L (84.2%, initial pH 5), 2 g/L (89.99%, pH 4), 3 g/L (91.35%, pH 4), 4 g/L (90.86%, pH 5), 5 g/L (92.62%, pH 4), 10 g/L (93.87%, pH 4), 15 g/L (93%, pH 5), 20 g/L (87.2%, pH 4), 25 g/L (87.47%, pH 4), 50 g/L (81.82%, pH 4). In all cases an increase at pH 2 and 3, and a decrease in adsorption at pH 5 were demonstrated. At pH 2 the formation of cadmium chloride probably occurred, which may make adsorption more difficult. The adsorbent dosage of 1.0 g/L revealed the lowest efficiency. As seen in Figure 13B, the highest biosorption capacity was observed as follows: 8.4 mg/g (1 g/L sorbent dosage, pH 5), 4.56 mg/g (2 g/L, pH 5), 3.22 mg/g (3 g/L, pH 5), 2.37 mg/g (4 g/L, pH 5), 1.87 mg/g (5 g/L, pH 5), 0.93 mg/g (10 g/L, pH 4), 0.59 mg/g (15 g/L, pH 4), 0.43 mg/g (20 g/L, pH 4), 0.35 mg/g (25 g/L, pH 4), 0.16 mg/g (50 g/L, pH 4). On the basis of the obtained results, the relationship between equilibrium pH and the highest biosorption efficiency obtained at initial pH 4.0 was investigated. It was shown that equilibrium pH increased to pH 6.4–7.3. Hence, a change in pH after the sorption processes in the examined systems was noticeable. To conclude, the highest adsorption efficiency was observed with the biosorbent dose of 10 g/L at initial pH 4.
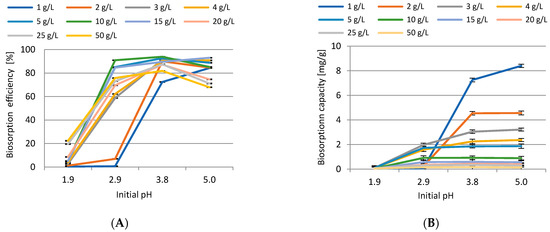
Figure 13.
The impact of initial pH on removal efficiency (A) and biosorption capacity (B) of Cd(II) ions.
The cation exchange mechanism took place during binding of Cd2+ ions in an aqueous solution. The surface of brewer’s grains and functional groups could be protonated with a large number of H+ ions. As a consequence, the number of negatively charged active centers decreased, and the number of positively charged centers increased. In an aqueous solution, Cd2+ ions compete with H+ ions which, through electrostatic repulsion, interfere with adsorption of positively charged Cd2+ ions. As the pH increased to 3–4, the surface of the brewer’s grains became more negatively electrostatically charged. There was a deprotonation of acid groups and initiation of ion exchange by increasing electrostatic affinity, which influenced the binding of more Cd2+ ions. Based on the literature, in the pH range of 2–5, Cd exists in the ionic form, while at a higher alkaline pH, Cd precipitates as hydroxides. Therefore, in these studies, the maximum sorption efficiency was obtained at pH 4. At pH 5, a decrease in sorption was observed, which could result from the competition of hydroxyl ions in active sites. Other forms of cadmium, such as Cd(OH)+ and Cd(OH)2, can interfere and slow down the sorption process. The influence of many factors (including pH) on Cd(II) sorption mechanism has been presented in the literature [38].
3.4.4. Studies of Contact Time
The influence of contact time on biosorption was investigated, and the results are presented in Figure 14. Our previous research helped to establish the following optimal experimental conditions: initial concentration of Cd(II) 10 mg/L, initial pH 4.0, BG dosage 10 g/L, rotation speed 200 rpm, T = 23 ± 1 °C. Based on the results it was shown that the best biosorption efficiency was noticed within the first 5–10 min, and no changes up to 60 min were observed. Thus, there was no need to carry out further experiments on longer times of the process. After 10 min. the sorption efficiency was 93.34% and remained at this level.
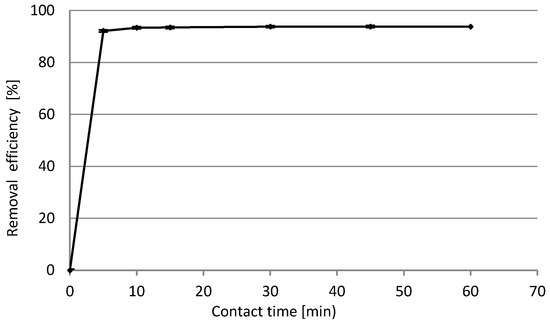
Figure 14.
The impact of contact time on the Cd(II) ions biosorption efficiency.
3.4.5. Pseudo-First-Order and Pseudo-Second-Order Kinetic Models
The kinetics analysis of the biosorption of Cd(II) ions onto BG residues was performed. Pseudo-first-order and pseudo-second order models were used for calculations. The model parameters were estimated and the results are shown in Table 3 and Figures S2 and S3 (Supplementary Material). The biosorption process was very quick, and equilibrium was achieved after 5–10 min. In the case of the pseudo-second reaction model the correlation coefficient was R2 = 0.999, which means that the biosorption process better fits the kinetic model indicating possible ion exchange and sharing of electrons between cadmium ions and BG surface [39]. It is assumed that biosorption may be the rate-limiting step in the process. Such parameters as contact time, initial and equilibrium concentration of Cd(II) were experimental variables. As brewer’s grain particle sizes increased, K1 values decreased. During biosorption diffusion probably occurred, and ion exchange appeared in the process. Cd(II) ions could be attracted by the active sites of the BG waste surface, which was related to an increase in coordination number with the surface. The effect was the phenomenon of adhesion to the biosorbent surface and the formation of chemical bonds [40].
Table 3.
Parameters of pseudo-first-order and the pseudo-second-order rate equations.
3.4.6. Isothermal Studies
The analysis of Langmuir and Freundlich isotherms were performed in relation to biosorption of Cd(II) using the BG biosorbent. The isotherm parameters were calculated and are presented in Table 4 and Figures S4–S13 (supplementary material). Based on the data, it can be assumed that the Freundlich model better describes the biosorption process. Other investigators, such as Khajavian et al. [41], Kaparapu and Prasad [42], and Naeem et al. [43], reported that the biosorption processes fits the Freundlich model better than the Langmuir model. The R2 coefficient, related to dimension separation factor or the equilibrium parameter, determines whether the biosorption system is favorable or unfavorable. The RL parameter determines the shape of isotherms in the following way: irreversible (RL = 0), favorable (0 < RL < 1), linear (RL = 1), unfavorable (RL > 1). In the present study, the obtained data were in the range of 0 < RL < 1, which translates into favorable biosorption for the removal of Cd(II) ions [40]. The Langmuir equation contains the KL parameter, which is the energy constant related to biosorbent and the binding energy of a solute as well as biosorption heat. It defines the interaction between adsorbate and sorbent surface, and the higher the values of the KL parameter, the stronger interaction between them [44]. The Freundlich isotherm is associated with the relationship between the concentration of metal ions dissolved in a liquid at equilibrium (Ce) and the concentration of dissolved ions on the surface of a biosorbent (qe). The determined isotherm parameters (Kf-biomass sorption capacity index, n-sorption intensity index) indicate the ease of separation of Cd(II) ions in the solution and biosorption on BG. In this research, the highest biosorption efficiency was 93.9% (initial pH 4.0, biosorbent dosage 10 g/L, initial concentration of Cd(II) 10 mg/L, contact time 60 min, agitation speed 200 rpm, T = 23 ± 1 °C). A comparison of biosorption capacity of BG for the removal of Cd(II) ions with different adsorbents is presented in Table 5, where qmax of BG is comparable or even greater than that of various adsorbents published in the literature.
Table 4.
Langmuir and Freundlich isotherm parameters for biosorption of Cd(II) using BG residues.
Table 5.
A comparison of biosorption capacity of BG for the removal of Cd(II) ions with different adsorbents in the literature.
4. Conclusions
Brewer’s grains obtained during processing in the brewing industry were examined for the removal of Cd(II) ions from aqueous solutions. The physicochemical properties of the biosorbent material were determined using several analytical methods. Biosorbent dosage, initial concentration of Cd(II) ions, initial pH and contact time were factors examined in terms of their influence on biosorption. The results revealed that the maximum biosorption efficiency was equal to 93.9% under the following conditions: initial pH 4.0, biosorbent dosage 10 g/L, initial concentration of Cd(II) 10 mg/L, contact time 60 min, rotation speed 200 rpm, T = 23 ± 1 °C. In general, the average process efficiency was above 80% under different experimental conditions. The possible biosorption mechanism may involve ion exchange and electrostatic attraction. The FT-IR analysis revealed slight shifts of peaks and changes in the intensity of bands, which can indicate Cd(II) ion binding by various functional groups. The kinetics analysis showed that the pseudo-second order kinetic model and the Freundlich model fit the experimental data better.
In conclusion, it is assumed that post-production brewer’s grains are capable of removing Cd(II) ions with high efficiency. These results may be an opportunity for industrial use of brewer’s grains to remove heavy metals as well as improve water quality, which is in line with current global trends in sustainable development and the circular economy.
Supplementary Materials
The following are available online at https://www.mdpi.com/article/10.3390/en14175543/s1. Figure S1: Particle size distribution of brewer’s grains, Figure S2: Pseudo-first-order isotherm for adsorption of Cd(II) ions with brewer’s grains, Figure S3: Pseudo-second-order isotherm for adsorption of Cd(II) ions with brewer’s grains, Figure S4: Langmuir kinetic isotherm for the biosorption of Cd(II) with brewer’s grains (BG dosage 1 g/L), Figure S5: Langmuir kinetic isotherm for the biosorption of Cd(II) with brewer’s grains (BG dosage 5 g/L), Figure S6: Langmuir kinetic isotherm for the biosorption of Cd(II) with brewer’s grains (BG dosage 10 g/L), Figure S7: Langmuir kinetic isotherm for the biosorption of Cd(II) with brewer’s grains (BG dosage 30 g/L), Figure S8: Langmuir kinetic isotherm for the biosorption of Cd(II) with brewer’s grains (BG dosage 50 g/L), Figure S9: Freundlich kinetic isotherm for the biosorption of Cd(II) with brewer’s grains (BG dosage 1 g/L), Figure S10: Freundlich kinetic isotherm for the biosorption of Cd(II) with brewer’s grains (BG dosage 5 g/L), Figure S11: Freundlich kinetic isotherm for the biosorption of Cd(II) with brewer’s grains (BG dosage 10 g/L), Figure S12: Freundlich kinetic isotherm for the biosorption of Cd(II) with brewer’s grains (BG dosage 30 g/L), Figure S13: Freundlich kinetic isotherm for the biosorption of Cd(II) with brewer’s grains (BG dosage 50 g/L).
Author Contributions
Conceptualization, T.K.; methodology, T.K.; validation, T.K.; formal analysis, T.K.; investigation, T.K. and J.W.; resources, T.K. and M.U.; data curation, T.K.; writing—original draft preparation, T.K.; writing—review & editing, T.K.; visualization, T.K.; supervision, T.K.; project administration, T.K.; funding acquisition, M.U. All authors have read and agreed to the published version of the manuscript.
Funding
This research did not receive a specific grant from any a funding agency in the public, commercial or not-for-profit sectors.
Institutional Review Board Statement
Not applicable.
Informed Consent Statement
Not applicable.
Data Availability Statement
Data is contained within the article.
Conflicts of Interest
The authors declare no conflict of interest.
References
- Rao, K.S.; Mohapatra, M.; Anand, S.; Venkateswarlu, P. Review on cadmium removal from aqueous solutions. Int. J. Eng. Sci. Technol. 2010, 2, 81–103. [Google Scholar] [CrossRef] [Green Version]
- Cheung, C.W.; Porter, J.F.; McKay, G. Elovich equation and modified second- order equation for adsorption of cadmium ions onto bone char. J. Chem. Technol. Biotechnol. 2000, 75, 963–970. [Google Scholar] [CrossRef]
- Wu, J.; Lu, J.; Chen, T.H.; He, Z.; Su, Y.; Yao, X.Y. In situ biotreatment of acidic mine drainage using straw as sole substrate. Environ. Earth Sci. 2010, 60, 421–429. [Google Scholar] [CrossRef]
- Conway, J. Beer Production Worldwide from 1998 to 2019. Available online: https://www.statista.com/statistics/270275/worldwide-beer-production/ (accessed on 20 June 2021).
- Levinson, J. Malting-brewing: A changing sector. BIOS Int. 2002, 5, 12–15. [Google Scholar]
- Ciancia, S. Micro-brewing: A new challenge for beer. BIOS Int. 2000, 2, 4–10. [Google Scholar]
- de Oliveira Dias, M. Heineken brewing industry in Brazil. Int. J. Manage. Technol. Eng. 2018, 8, 1304–1310. [Google Scholar]
- Fărcaş, A.C.; Socaci, S.A.; Mudura, E.; Dulf, F.V.; Vodnar, D.C.; Tofană, M.; Salanță, L.C. Exploitation of Brewing Industry Wastes to Produce Functional Ingredients, Brewing Technology; Chapter 7; IntechOpen: London, UK, 2017; pp. 137–156. [Google Scholar]
- Gupta, V.K.; Ali, I. Environmental Water Advances in Treatment, Remediation and Recycling; Elsevier: New Delhi, India, 2013; pp. 1–232. [Google Scholar]
- Portal, S. Available online: https://www.portalspozywczy.pl/alkohole-uzywki/wiadomosci/produkcja-piwa-wzrosla-w-2018-roku-do-40-93-mln-hektolitrow,167388.html (accessed on 20 June 2021).
- Związek Pracodawców Przemysłu Piwowarskiego w Polsce. Najlepsze Dostępne Techniki (BAT), Wytyczne dla Przemysłu Piwowarskiego; Ministerstwo Środowiska: Warszawa, Poland, 2005. [Google Scholar]
- Regulation of the Polish Minister of Health of 7 December 2017 Amending the Regulation on the Quality of Water Intended for Human Consumption, Item 2294; Polish J. Laws: Warsaw, Poland, 2017.
- Czekała, W.; Pawlisiak, A. Produkcja i wykorzystanie wysłodzin browarnianych. Tech. Rol. Ogrod. Leśna 2017, 5, 23–25. [Google Scholar]
- The Act of 14 December 2012 on Waste, Item. 21, as Amended; Pol. J. Laws: Warsaw, Poland, 2013.
- Regulation of the Minister of Environment of 11 May 2015 on Waste Recovery Outside of Installations and Devices; No. 796; Pol. J. Laws: Warsaw, Poland, 2015.
- Regulation of the Minister of Environment of 21 March 2006 on Waste Recovery Outside of Installations and Devices; No. 49, item 356; Pol. J. Laws: Warsaw, Poland, 2006.
- Alquzweeni, S.S.; Alkizwini, R.S. Removal of Cadmium from Contaminated Water Using Coated Chicken Bones with Double-Layer Hydroxide (Mg/Fe-LDH). Water 2020, 12, 2303. [Google Scholar] [CrossRef]
- Nnaji, C.H.; Emefu, S.C.H. Effect of Particle Size on the Sorption of Lead from Water by Different Species of Sawdust: Equilibrium and Kinetic Study. Bioresources 2017, 12, 4123–4145. [Google Scholar] [CrossRef] [Green Version]
- Alinnor, I.J. Adsorption of heavy metal ions from aqueous solution by fly ash. Fuel 2007, 86, 853–857. [Google Scholar] [CrossRef]
- Cui, F.M.; Zhang, X.Y.; Shang, L.M. Thermogravimetric Analysis of Biomass Pyrolysis under Different Atmospheres. Appl. Mech. Mater. 2013, 448–453, 1616–1619. [Google Scholar] [CrossRef]
- Kalak, T.; Dudczak-Halabuda, J.; Tachibana, Y.; Cierpiszewski, R. Residual biomass of gooseberry (Ribes uva-crispa L.) for the bioremoval process of Fe(III) ions. Desalin. Water Treat. 2020, 202, 345–354. [Google Scholar] [CrossRef]
- Erdemoglu, M.; Sarikaya, M. Effects of heavy metals and oxalate on the zeta potential of magnetite. J. Colloid Interface Sci. 2006, 300, 795–804. [Google Scholar] [CrossRef] [PubMed]
- Demirbas, Ö.; Alkan, M.; Doğan, M.; Turhan, Y.; Namli, H.; Turan, P. Electrokinetic and adsorption properties of sepiolite modified by 3-aminopropyltriethoxysilane. J. Hazard. Mater. 2007, 149, 650–656. [Google Scholar] [CrossRef]
- Kalak, T.; Kłopotek, A.; Cierpiszewski, R. Effective adsorption of lead ions using fly ash obtained in the novel circulating fluidized bed combustion technology. Microchem. J. 2019, 145, 1011–1025. [Google Scholar]
- Zdanowska, P.; Florczak, I.; Słoma, J.; Tucki, K.; Orynycz, O.; Wasiak, A.; Świć, A. An Evaluation of the Quality and Microstructure of Biodegradable Composites as Contribution towards Better Management of Food Industry Wastes. Sustainability 2019, 11, 1504. [Google Scholar] [CrossRef] [Green Version]
- Olkku, J.; Kotaviita, E.; Salmenkallio-Marttila, M.; Sweins, H.; Home, S. Connection between structure and quality of barley husk. J. Am. Soc. Brew. Chem. 2005, 63, 17–22. [Google Scholar] [CrossRef]
- Boateng, A.A.; Cooke, P.H.; Hicks, K.B. Microstructure development of chars derived from high-temperature pyrolysis of barley (Hordeum vulgare L.) hulls. Fuel 2007, 86, 735–742. [Google Scholar] [CrossRef]
- Ferraz, E.; Coroado, J.; Gamelas, J.; Silva, J.; Rocha, F.; Velosa, A. Spent Brewery Grains for Improvement of Thermal Insulation of Ceramic Bricks. J. Mater. Civ. Eng. 2013, 25, 1638–1646. [Google Scholar] [CrossRef]
- Rubio, F.T.V.; Maciel, G.M.; Silva, M.V.; Correa, V.G.; Peralta, R.M.; Haminiuk, C.W.I. Enrichment of waste yeast with bioactive compounds from grape pomace as an innovative and emerging technology: Kinetics, isotherms and bioaccessibility. Innov. Food Sci. Emerg. Technol. 2018, 45, 18–28. [Google Scholar] [CrossRef]
- Tao, Y.; Han, Y.; Liu, W.; Peng, L.; Wang, Y.; Kadam, S.; Show, P.L.; Ye, X. Parametric and phenomenological studies about ultrasound-enhanced biosorption of phenolics from fruit pomace extract by waste yeast. Ultrason. Sonochem. 2019, 52, 193–204. [Google Scholar] [CrossRef] [PubMed]
- Nasution, A.N.; Amrina, Y.; Zein, R.; Aziz, H.; Munaf, E. Biosorption characteristics of Cd(II) ions using herbal plant of mahkota dewa (Phaleria macrocarpa). J. Chem. Pharm. Res. 2015, 7, 189–196. [Google Scholar]
- Shaheen, S.M.; Derbalah, A.S.; Moghanm, F.S. Removal of Heavy Metals from Aqueous Solution by Zeolite in Competitive Sorption System. Int. J. Environ. Sci. Develop. 2012, 3, 362–367. [Google Scholar] [CrossRef]
- Sulaymon, A.H.; Mohammed, A.A.; Al-Musawi, T.J. Competitive biosorption of lead, cadmium, copper, and arsenic ions using algae. Environ. Sci. Pollut. Res. 2013, 20, 3011–3023. [Google Scholar] [CrossRef] [PubMed] [Green Version]
- Stafussa, A.P.; Maciel, G.M.; Anthero, A.G.S.; Silva, M.V.; Zielinski, A.A.F.; Haminiuk, C.W.I. Biosorption of anthocyanins from grape pomace extracts by waste yeast: Kinetic and isotherm studies. J. Food Eng. 2016, 169, 53–60. [Google Scholar] [CrossRef]
- Kim, T.-Y.; Lee, J.-W.; Cho, S.-Y. Application of residual brewery yeast for adsorption removal of Reactive Orange 16 from aqueous solution. Adv. Powder Technol. 2015, 26, 267–274. [Google Scholar] [CrossRef]
- Kalak, T.; Dudczak, J.; Cierpiszewski, R. Adsorption behaviour of copper ions on elderberry, gooseberry and paprika waste from aqueous solutions. In Proceedings of the 12th International Interdisciplinary Meeting on Bioanalysis (CECE), Brno, Czech Republic, 21–23 September 2015; pp. 123–127. [Google Scholar]
- Kalak, T.; Dudczak-Hałabuda, J.; Tachibana, Y.; Cierpiszewski, R. Effective use of elderberry (Sambucus nigra) pomace in biosorption processes of Fe(III) ions. Chemosphere 2020, 246, 125744. [Google Scholar] [CrossRef]
- Ahmad, I.; Akhtar, M.J.; Jadoon, I.B.K.; Imran, M.; Ali, S. Equilibrium modeling of cadmium biosorption from aqueous solution by compost. Environ. Sci. Pollut. Res. 2017, 24, 5277–5284. [Google Scholar] [CrossRef] [PubMed]
- Usman, A.; Sallam, A.; Zhang, M.; Vithanage, M.; Ahmad, M.; Al-Farraj, A.; Ok, Y.S.; Abduljabbar, A.; Al-Wabel, M. Sorption process of date palm biochar for aqueous Cd (II) removal: Efficiency and mechanisms. Water Air Soil Pollut. 2016, 227, 1–16. [Google Scholar] [CrossRef]
- Ho, Y.S.; Ng, J.C.Y.; McKay, G. Kinetics of pollutant sorption by biosorbents: Review. Sep. Purif. Rev. 2000, 29, 189–232. [Google Scholar] [CrossRef]
- Khajavian, M.; Wood, D.A.; Hallajsani, A.; Nasrollah, M. Simultaneous biosorption of nickel and cadmium by the brown algae Cystoseria indica characterized by isotherm and kinetic models. Appl. Biol. Chem. 2019, 62, 69. [Google Scholar] [CrossRef]
- Kaparapu, J.; Prasad, M.K. Equilibrium, kinetics and thermodynamic studies of cadmium(II) biosorption on Nannochloropsis oculata. Appl. Water Sci. 2018, 8, 1–9. [Google Scholar] [CrossRef] [Green Version]
- Naeem, M.A.; Imran, M.; Amjad, M.; Abbas, G.; Tahir, M.; Murtaza, B.; Zakir, A.; Shahid, M.; Bulgariu, L.; Ahmad, I. Batch and Column Scale Removal of Cadmium from Water Using Raw and Acid Activated Wheat Straw Biochar. Water 2019, 11, 1438. [Google Scholar] [CrossRef] [Green Version]
- Asuquo, E.; Martin, A.; Nzerem, P.; Siperstein, F.; Fan, X. Adsorption of Cd(II) and Pb(II) ions from aqueous solutions using mesoporous activated carbon adsorbent: Equilibrium, kinetics and characterisation studies. J. Environ. Chem. Eng. 2017, 5, 679–698. [Google Scholar] [CrossRef] [Green Version]
- Lodeiro, P.; Barriada, J.L.; Herrero, R.; Vicente, M.E.S. The marine macroalga Cystoseira baccata as biosorbent for cadmium(II) and lead(II) removal: Kinetic and equilibrium studies. Environ. Pollut. 2006, 142, 264–273. [Google Scholar] [CrossRef]
- Zhang, F.; Wang, X.; Yin, D.; Peng, B.; Tan, C.; Liu, Y.; Tan, X.; Wu, S. Efficiency and mechanisms of Cd removal from aqueous solution by biochar derived from water hyacinth (Eichornia crassipes). J. Environ. Manag. 2015, 153, 68–73. [Google Scholar] [CrossRef]
- Chen, C.Y.; Chang, H.W.; Kao, P.C.; Pan, J.L.; Chang, J.S. Biosorption of cadmium by CO2-fixing microalga Scenedesmus obliquus CNW-N. Bioresour. Technol. 2012, 105, 74–80. [Google Scholar] [CrossRef] [PubMed]
- Xu, X.; Cao, X.; Zhao, L.; Wang, H.; Yu, H.; Gao, B. Removal of Cu, Zn, and Cd from aqueous solutions by the dairy manure-derived biochar. Environ. Sci. Pollut. Res. 2013, 20, 358–368. [Google Scholar] [CrossRef]
- Li, F.; Shen, K.; Long, X.; Wen, J.; Xie, X.; Zeng, X.; Liang, Y.; Wei, Y.; Lin, Z.; Huang, W.; et al. Preparation and Characterization of Biochars from Eichornia crassipes for Cadmium Removal in Aqueous Solutions. PLoS ONE 2016, 11, 0148132. [Google Scholar] [CrossRef] [PubMed] [Green Version]
- Trakal, L.; Bingöl, D.; Pohoˇrelý, M.; Hruška, M.; Komárek, M. Geochemical and spectroscopic investigations of Cd and Pb sorption mechanisms on contrasting biochars: Engineering implications. Bioresour. Technol. 2014, 171, 442–451. [Google Scholar] [CrossRef] [PubMed]
- Han, X.; Liang, C.-F.; Li, T.-Q.; Wang, K.; Huang, H.-G.; Yang, X.-E. Simultaneous removal of cadmium and sulfamethoxazole from aqueous solution by rice straw biochar. J. Zhejiang Univ. Sci. B 2013, 14, 640–649. [Google Scholar] [CrossRef] [Green Version]
- Chen, L.; Fang, Y.; Jin, Y.; Chen, Q.; Zhao, Y.; Xiao, Y.; Zhao, H. Biosorption of Cd2+ by untreated dried powder of duckweed Lemna aequinoctialis. Des. Water Treat. 2015, 53, 183–194. [Google Scholar] [CrossRef]
- Ahmad, M.; Lee, S.S.; Dou, X.; Mohan, D.; Sung, J.-K.; Yang, J.E.; Ok, Y.S. Effects of pyrolysis temperature on soybean stover-and peanut shell-derived biochar properties and TCE adsorption in water. Bioresour. Technol. 2012, 118, 536–544. [Google Scholar] [CrossRef] [PubMed]
- Zhang, S.; Zhang, H.; Cai, J.; Zhang, X.; Zhang, J.; Shao, J. Evaluation and Prediction of Cadmium Removal from Aqueous Solution by Phosphate-Modified Activated Bamboo Biochar. Energy Fuels 2017, 32, 4469–4477. [Google Scholar] [CrossRef]
- Prapagdee, S.; Piyatiratitivorakul, S.; Petsom, A. Activation of Cassava Stem Biochar by Physico-Chemical Method for Stimulating Cadmium Removal Efficiency from Aqueous Solution. Environ. Asia 2014, 7, 60–69. [Google Scholar]
- Al-Dujaili, A.H.; Awwad, A.M.; Salem, N.M. Biosorption of cadmium (II) onto loquat leaves (Eriobotrya japonica) and their ash from aqueous solution, equilibrium, kinetics, and thermodynamic studies. Int. J. Ind. Chem. 2012, 3, 1–7. [Google Scholar] [CrossRef] [Green Version]
- Vilar, V.J.P.; Botelho, C.M.S.; Boaventura, R.A.R. Equilibrium and kinetic modelling of Cd(II) biosorption by algae Gelidium and agar extraction algal waste. Water Res. 2006, 40, 291–302. [Google Scholar] [CrossRef] [PubMed]
- Baraka, A.; Hall, P.J.; Heslop, M.J. Preparation and characterization of melamine-formaldehyde-DTPA chelating resin and its use as an adsorbent for heavy metal removal from wastewater. React. Funct. Polym. 2007, 67, 585–600. [Google Scholar] [CrossRef]
- Ding, Y.; Jing, D.B.; Gong, H.L.; Zhou, L.B.; Yang, X.S. Biosorption of aquatic cadmium(II) by unmodified rice straw. Bioresour. Technol. 2012, 114, 20–25. [Google Scholar] [CrossRef] [PubMed]
- Yakkala, K.; Yu, M.-R.; Roh, H.; Yang, J.-K.; Chang, Y.-Y. Buffalo weed (Ambrosia trifida L. var. trifida) biochar for cadmium (II) and lead (II) adsorption in single and mixed system. Des. Water Treat 2013, 51, 7732–7745. [Google Scholar] [CrossRef]
- Al-karam, U.F.; Danil de Namor, A.F.; Derwish, G.A.W.; Al-Dujaili, A.H. Removal of chromium, copper, cadmium and lead ions from aqueous solutions by diatomaceous earth. Environ. Eng. Manag. J. 2012, 11, 811–819. [Google Scholar]
- Marzal, P.; Seco, A.; Gabaldon, C.; Ferrer, J. Cadmium and zinc adsorption onto activated carbon: Influence of temperature, pH and metal/carbon ratio. J. Chem. Technol. Biotechnol. 1996, 66, 279–285. [Google Scholar] [CrossRef]
- Zhang, D.; Zeng, X.D.; Ma, P.; He, H.J. The sorption of Cd(II) from aqueous solutions by fixed Lentinus edodes mushroom flesh particles. Desalin. Water Treat. 2012, 46, 21–31. [Google Scholar] [CrossRef]
- Bhattacharyya, K.; Gupta, S. Kaolinite, montmorillonite, and their modified derivatives as adsorbents for removal of Cd(II) from aqueous solution. Sep. Purif. Technol. 2006, 50, 388–397. [Google Scholar] [CrossRef]
- Miretzky, P.; Saralegui, A.; Cirelli, A.F. Simultaneous heavy metal removal mechanism by dead macrophytes. Chemosphere 2006, 62, 247–254. [Google Scholar] [CrossRef] [PubMed]
- Lacin, O.; Bayrak, B.; Korkut, O.; Sayan, E. Modeling of adsorption and ultrasonic desorption of cadmium(II) and zinc(II) on local bentonite. J. Colloid Interface Sci. 2005, 292, 330–335. [Google Scholar] [CrossRef] [PubMed]
- Demirbas, A. Adsorption of lead and cadmium ions in aqueous solutions onto modified lignin from alkali glycerol delignication. J. Hazard. Mater. 2004, B109, 221–226. [Google Scholar] [CrossRef] [PubMed]
Publisher’s Note: MDPI stays neutral with regard to jurisdictional claims in published maps and institutional affiliations. |
© 2021 by the authors. Licensee MDPI, Basel, Switzerland. This article is an open access article distributed under the terms and conditions of the Creative Commons Attribution (CC BY) license (https://creativecommons.org/licenses/by/4.0/).