1. Introduction
In the United States, the energy used for building cooling and heating represents 20% of the total annual energy consumption [
1]. To reduce cooling and heating energy consumptions, there is growing interest in the effective operation of cooling and heating facilities as well as an improvement in their energy efficiency [
2]. However, there are still uncertainties in the correlation between energy consumption and thermal environment improvement, which is used in cooling and heating for establishing effective operation strategies [
3]. Thermal comfort through cooling and heating varies depending on the structure of the indoor space, cooling and heating methods, and the activity level of the occupants, which makes it difficult to establish standardized cooling and heating strategies. Therefore, much research has been conducted into cooling and heating methods for various spaces, such as classrooms, hospitals, offices, and theaters, and the thermal comfort of their occupants has been evaluated [
4,
5,
6,
7].
Some studies have been conducted on cooling and heating methods for large indoor spaces. Ricciardi et al. reported that thermal comfort may differ in large spaces due to non-uniform cooling and heating performance [
8]. Stamou et al. visually presented the distribution of the thermal comfort for large spaces by evaluating the thermal comfort in the Galatis Arena through computational fluid dynamics (CFD) [
9]. Previous studies have shown that local overcooling, overheating, and drafts caused by hot or cold air during cooling and heating operation in large indoor spaces may decrease the thermal comfort of occupants and that non-uniform thermal comfort can easily occur in large spaces. In addition, the demand for comfortable working environments has been expanding to workshops beyond offices. In particular, there is a growing demand for thermal comfort management from workers in large-scale assembly factories that contain many workers. However, it is difficult to predict the cooling and heating performance of large-scale assembly factories based on the results of previous studies on cooling and heating in large spaces because the cooling and heating performance of a building is significantly affected by the shape and cooling/heating conditions of the building, as described earlier. As previous studies on workshop cooling and heating [
10,
11] mostly present cooling/heating and thermal comfort results for spaces where static activities are performed, they are not suitable for evaluating the thermal comfort of occupants in buildings such as factories.
In particular, it is difficult to predict the effect of the heating operation method on the actual thermal comfort in a large-scale assembly factory. Heating methods applicable to indoor spaces can be mainly divided into two categories. First, the easiest method is to evenly heat the entire space. This method also leads to a high thermal comfort of occupants if there is no local temperature difference and no draft caused by air flow [
12]. The method of evenly heating ultra-large spaces, such as large-scale assembly factories, however, requires huge energy cost. Even if it can be implemented, maintaining the performance requires no inflow of outside air and excellent insulation performance of the building. Therefore, the method of evenly heating the entire space is not reasonable in terms of energy efficiency. The second method is to extensively install cooling and heating devices in some spaces where workers stay. This method is a reasonable choice in terms of energy consumption because cooling and heating are directly performed in spaces where heating is required, and this method is applicable in most workshops. However, a concentrated supply of heated air may increase thermal discomfort due to a draft or vertical temperature difference [
13]. In addition, local heating causes different temperatures depending on the location in the indoor space. In this case, buoyancy occurs due to the temperature difference, causing flow inside the factory. In particular, the flow caused by buoyancy moves to the upper part of the factory, and unheated ambient cold air is introduced to the areas where occupants are. For heating in large spaces, all factors affect each other, making it difficult to adopt an effective heating method.
Therefore, in this study, the thermal comfort and energy flow of a large-scale assembly factory were examined to present effective heating operation strategies. In particular, the temperature distribution inside the factory during heating in winter was predicted through CFD. In this instance, the thermal comfort of occupants was evaluated. In addition, the energy supply and loss in the large-scale assembly factory were quantitatively predicted by evaluating the energy flow of the building through a building energy simulation (BES). Computational analysis was conducted considering the operating conditions of an actual large-scale assembly factory, the structure of the building, and external environmental factors. In addition, heating strategies to reduce energy loss were presented along with changes in thermal comfort based on the energy loss rate in the large-scale assembly factory, confirmed through the energy flow of the building. As shown by the above results, the methodology to identify both the thermal comfort and building energy flow can indicate improvement measures for heating operation based on the energy flow calculated through BES and can evaluate the distribution of the thermal environment and airflow patterns as well as changes in thermal comfort through CFD. Consequently, the methodology and quantitative research results presented in this paper can provide useful insights required to improve the thermal comfort of workers and reduce the heating cost in a large-scale assembly factory.
2. Description of the Large-Scale Assembly Factory
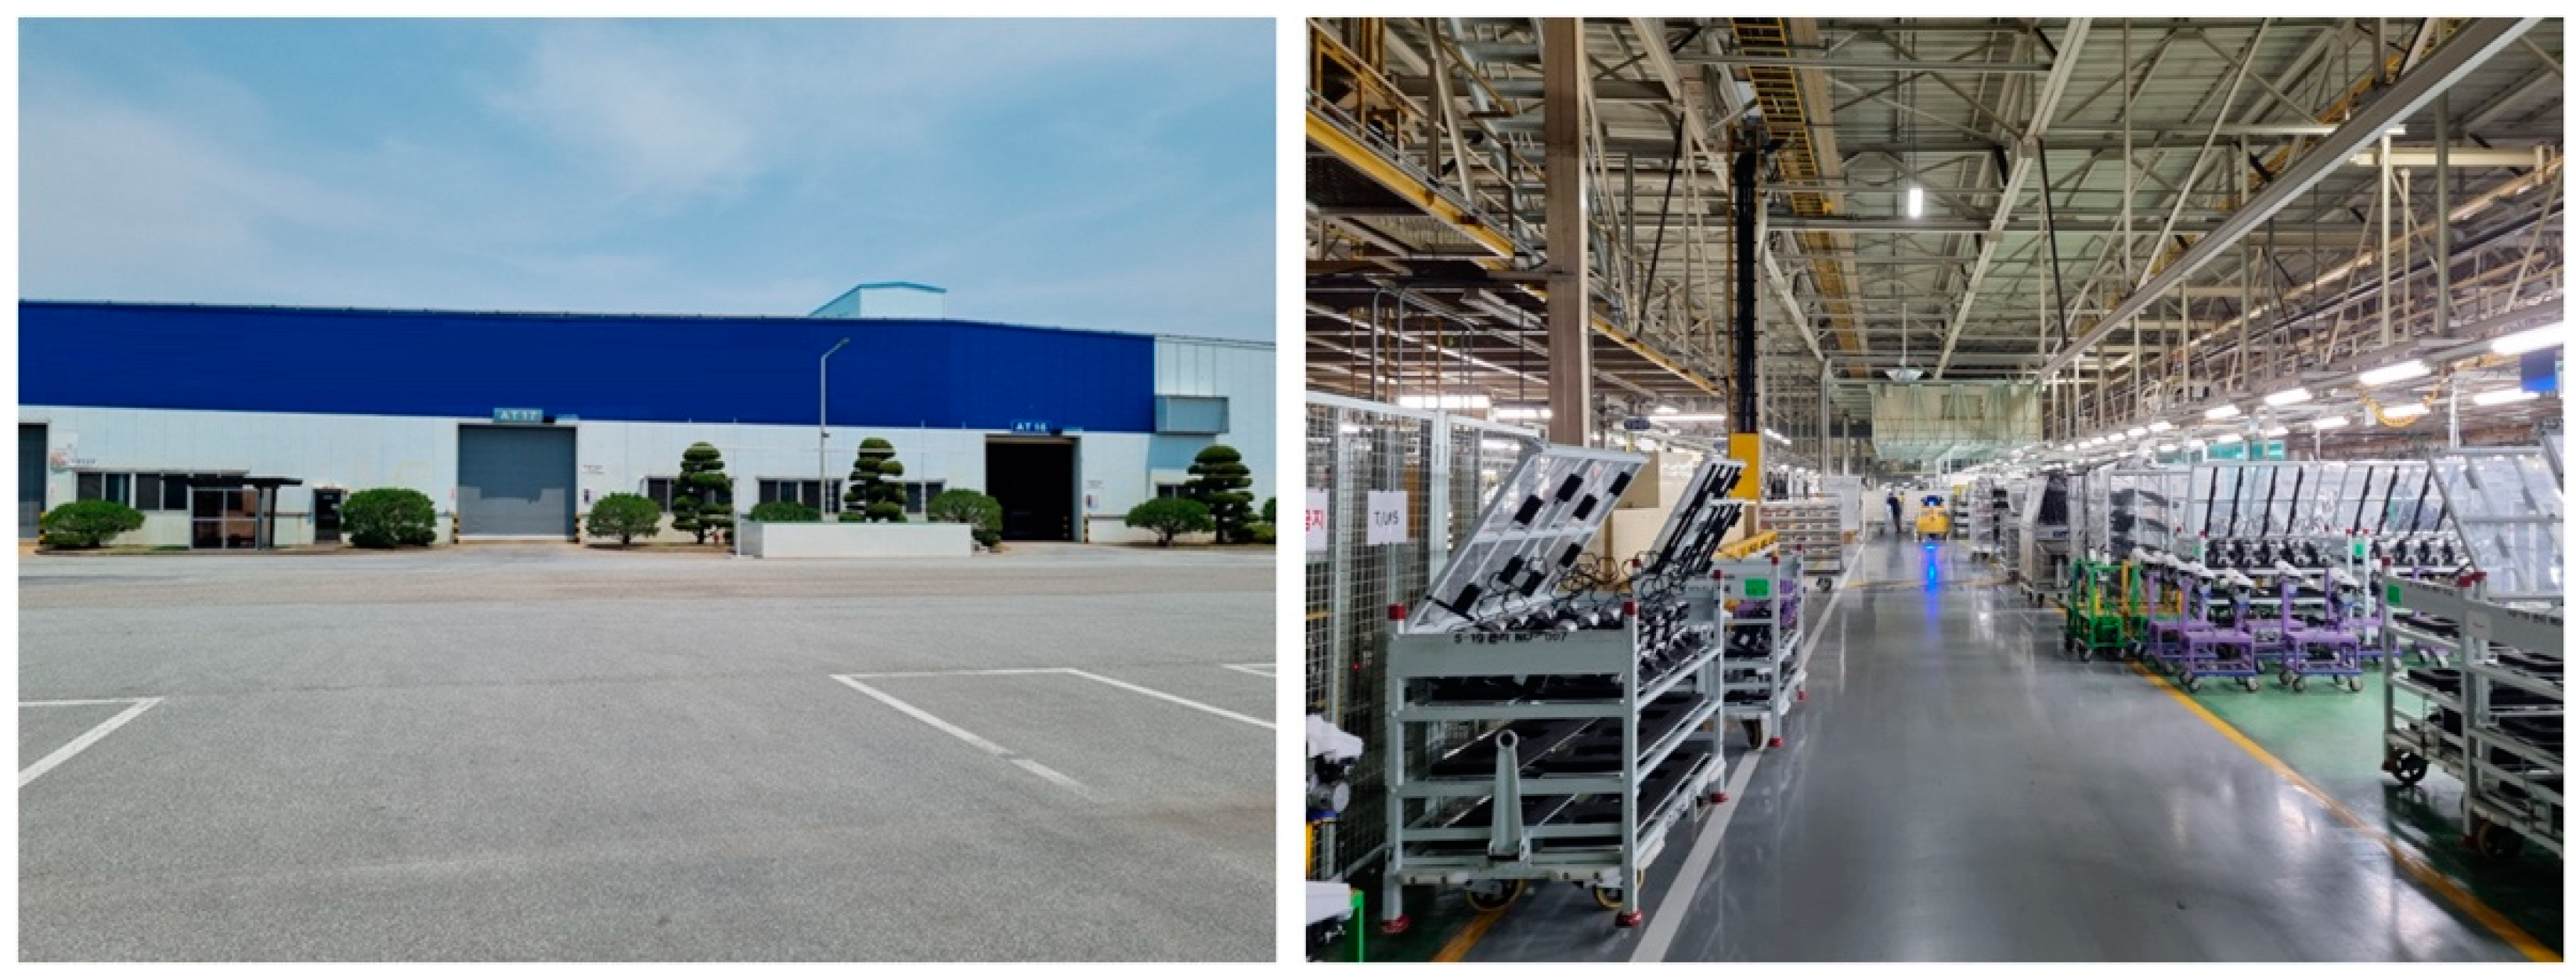
In this study, research was conducted on the thermal comfort of workers and building energy flow under heating conditions in winter in a large-scale assembly factory with a length of 390 m, width of 150 m, and height of 12.6 m located in Ulsan, South Korea. The entirety of this factory, with an area of 61,150 m
2 and a volume of 578,000 m
3, is an indoor space composed of one ultra-large zone, and 1200 people work on the floor. Completed in 1986, this factory has 17 large double doors and glass windows on three sides (east, west, and north) and top windows on the roof.
Figure 1 shows the exterior and interior of this large-scale assembly factory.
The factory is equipped with heating facilities capable of supplying heated air at a flow rate of 2,820,000 m
3/h, and they are divided into two types of devices (furnaces and hot water fan coil systems), as shown in
Figure 2. In the factory, the heating facilities are operated when the outdoor temperature is 7 °C or less from November to next February. First, the furnaces heat up the air with the heat generated by a burning gas, and the air volume supplied by each furnace is approximately 80,000 m
3/h. The furnaces are evenly distributed inside the factory to control the overall temperature of the factory. They are installed at a 4 m height from the floor, and they directly supply warm air towards the workshops without using ducts. Meanwhile, the hot water fan coil systems are used to provide heating to spaces where occupants work at fixed positions. Fifty fan coil systems are installed inside the factory, and the heat source is supplied through hot water. The air heated through the hot water fan coil systems provides heating to areas where workers stay through ducts, and heated air is supplied through diffusers installed at a 2.5 m height.
Inside the large-scale assembly factory, facilities to release internal energy or introduce outside air are also present, in addition to the facilities that provide energy through heating. In particular, forced ventilation facilities are installed in the areas of the inspection and repair processes, where toxic gases are generated, for the safety of workers. The total forced ventilation volume is 1,685,400 m3/h, which corresponds to three rounds of ventilation per hour based on the total factory volume. As the heated air is discharged through the forced ventilation facilities, a negative pressure is formed inside the factory. Thus, cold outside air is introduced through the openings of the factory.
Table 1 lists detailed information on the heating and ventilation facilities used in the factory.
3. Methodology
3.1. Computational Fluid Dynamics
A three-dimensional computational domain was constructed to investigate the heating performance of the assembly factory. The full-scale computational domain was composed of a ceiling, walls, openings, heating facilities, ventilation facilities, and internal structures, as shown in
Figure 3.
The ceiling, walls, and internal structures that constitute the exterior and entire indoor space of the assembly factory were modeled through the design drawings of the factory and a field survey. The modeling of the internal structures was determined considering the type, height, and area of each. The assembly factory has openings through which outside air could freely enter, even during heating. In particular, a 4 × 4 m large automatic door is frequently opened and closed for the movement of materials or the release of finished products, and most of the windows installed in the upper part of the factory remain open. Modeling was performed on the computational domain to reflect these conditions.
Heating facilities were divided into furnaces and hot water fan coil systems, as introduced in the previous section, and they were separately modeled in the computational domain. In the case of the furnaces, the actual size was reflected in the computational domain because the outlet of heated air was relatively large. However, for the size of the ducts that supplied heated air in the hot water fan coil systems, a separate assumption was required because it was very small compared to the size of the entire factory. In this study, it was assumed that heating was performed with two narrow and long ducts in the installation space for each of the 50 hot water fan coil systems installed in the factory. The flow velocity in the ducts was set based on the air volume. The forced ventilation facilities were modeled under the assumption that air was dumped at the bottom of the computational domain by reflecting the actual factory environment.
The numerical analysis was regarded as steady-state and incompressible fluids. The governing equations of mass, momentum and energy are shown as follows; the buoyancy effect was calculated using the Boussinesq approximation model [
14]:
A Reynolds-averaged Navier–Stokes (RANS) model was used to calculate the turbulent flow with the governing equations. To calculate the Reynolds stress term of the equations according to the turbulent flow, the realizable
k–
ε turbulence model [
15], which requires a relatively small amount of computation and can be widely used for various types of problems, was used. The finite volume method and the QUICK Scheme was used for the numerical approach. In addition, the SIMPLE algorithm was adopted for the coupling between the pressure and velocity in the steady-state analysis. The grids used for numerical analysis was regular hexahedral, and the number of grids was determined to be about 45,000,000 through a grid dependency test, as shown in
Figure 4. The base size of the hexahedral grids at the computational domain is 30 cm and the grids around the walls are finely configured to up to 25% of the base size. Residuals according to the iterative analysis were calculated to be 10
−5 or less for all the governing equations. In this study, Siemens star-ccm+, a commercial software program, was used. The simulation cases were computed in parallel through 16 processors, which took two days for each case.
Table 2 lists the boundary conditions used for the numerical approach. For the heated air flow velocity and the forced ventilation flow velocity, the average flow velocity was applied based on the specifications of each facility. For the temperature conditions, the setting values of the corresponding heating devices were applied. The calculation of the heat loss through the walls and ceiling of the factory was replaced with convective heat transfer that satisfied the same thermal resistance based on the composition of the walls and ceiling. In this instance, the outside air temperature and convective heat transfer coefficients were assumed to be −3 °C and 100 W/m
2·K, respectively. The inflow of outside air through the factory doors caused by forced ventilation was assumed to be 1.2 m/s, which is the average value for the total door area, based on experimental data measured for one hour. For the windows in the ceiling, the pressure outlet condition was set because they remained open at all times.
Table 3 lists the insulation details of the factory. The insulation details in a building are essential for the analysis of building energy flow as well as the temperature distribution.
3.2. Thermal Comfort
In the large-scale assembly factory equipped with the heating devices introduced above, heating is performed by spreading warm air into the inside of the target space. The effect of the flow by the diffuser on the thermal comfort inside the space was evaluated through the air diffusion performance index (ADPI) considering the characteristics of the flow from the diffuser, which exhibited the shape of a jet [
16]. ADPI is a value that statistically represents the satisfaction of occupants with the indoor temperature and ranges from 0 to 100%. ADPI can be expressed as a ratio of the space (
), where the airflow velocity is 0.35 m/s or less and the effective draft temperature (EDT) ranges from −1.5 to 1.0 °C, to the entire space (
). If the ADPI is 80% or higher, the space can be considered comfortable.
EDT for the measurement point is an index that can be calculated using the airflow velocity (
), average temperature of the space (
), and temperature of the measurement point (
). Liu and Novoselac [
17] devised an EDT calculation method and the range of EDT that can be used for ADPI under heating conditions, expressed as follows:
In the case of a large-scale factory, the ratio of the space where workers do not remain to the space where workers remain, is high, and the height of the building is high. Thus, the imitation of the thermal comfort experienced by actual workers can be difficult if ADPI is evaluated based on volume. Therefore, in this study, ADPI was calculated based on a plane at a height of 1.5 m from the ground surface; this is also the height of the stream of breath. The modified ADPI condition is formulated as follows:
3.3. Building Energy Modeling Simulation
BES is mainly used for designing heating, ventilating, and air-conditioning (HVAC) systems that meet the loads of a building and predict the building energy consumption. Among various building energy simulation software, EnergyPlus is used by the US Department of Energy and has been used by many researchers to analyze the building energy flow [
18]. This software can simulate the surface heat balance, air heat balance, and energy performance of a building based on various databases regarding time and seasons. It is possible to predict the equilibrium between the energy generated in the factory, including the input energy for air conditioning and the heat elements such as machinery and lighting, and the metabolism of the workers, and the energy dissipated through the exterior walls, openings, and ventilation exhaust. For building energy analysis, the shape and zone of the building were modeled using a Design Builder. At this time, the conditions reflected in the BES are shown in
Figure 5. The conditions given to the HVAC system of Building category and Product Schedule category are the same as those entered in CFD, and the remaining input conditions are indicated in
Table 4.
As external conditions are additionally applied in this study, not only information on the geographic location and material properties of the building, but information on the heating device operating time, number of occupants, and lighting equipment operating time according to the production schedule of the assembly factory were reflected in the BES. In addition, external environmental data, such as climatic conditions (solar radiation, cloud amount, rainfall, temperature, and humidity) according to the time and season, were reflected, and the Korea Meteorological Administration data for the Ulsan area were used. To confirm the internal heat except for the ventilation equipment, the worker’s metabolic heat was added [
19] and the lighting and machine were input according to the calendar work cycle. The total heat generation by the machine in the factory were considered to be about 40% of the electricity used, because it was considered to be equivalent to the energy efficiency rating of a typical electric machine. The calculation time for BES was simulated from November to February, which is the winter season, in units of one hour, and the ventilation energy cost and heat loss in each component were predicted in this way.
4. Results and Discussion
4.1. Temperature and ADPIrev Distribution of the Operating Condition
The temperature distribution inside the large-scale assembly factory under heating conditions was calculated through numerical analysis. To analyze the numerical results, the internal space of the factory was divided into seven zones according to the process and usage, as shown in
Figure 6a. As for the zones, the main assembly zone was located in the center of the large-scale assembly factory. In the main assembly zone, the density of workers is high, and heating is performed through hot water fan coil systems. As shown in the figure, the material storage zone is located on the right side of the assembly zone, and the test zone is located on the left. Repair zones to respond to defects during assembly are located above and below the test zone. Because these spaces have different environmental characteristics, such as the amount of heated air supplied, exhaust amount, distance to the door, and density of workers, the heating results were analyzed based on the characteristics to establish new heating strategies. In addition, to compare the numerical temperature distribution and the actual temperature data, 20 data loggers (Testo 175-H1) that can measure the temperature and humidity were installed throughout the factory and were measured once a minute for 24 h, as shown
Figure 6a. The data loggers were then installed. The measurement result of the data logger was verified to be within 0.5 degrees of temperature deviation through the temperature measurement result of the K-type thermocouple (OMEGA) and the thermometer (Fluke 52-2). Furthermore, the data loggers were installed as shown in
Figure 6b at a height of 1.5 m from the ground, which can be assumed to be the breathing line of the workers.
Figure 7 shows the temperature distribution at the 1.5 m plane on the floor in the large-scale assembly factory during heating, which was obtained through numerical analysis. The average temperature of the factory confirmed through the computational analysis results was 15.4 °C, and it was found that the temperature significantly dropped due to the infiltration of outside air. In particular, the cold air introduced into the building through the large door of the factory was not easily dissipated, and it decreased the temperature in the work areas. In addition, large unheated areas were formed around the walls near the doors. In such areas, hot water fan coil systems are not installed because work is not performed there on a regular basis.
In the case of the material storage zone, lower temperatures were formed compared to the main workshop because the installation of furnaces was difficult due to the internal space problem. As can be seen from
Figure 6, the air flow of the entire factory was generated toward the test line due to forced ventilation. Therefore, the unheated air in the material storage space affected the main assembly line. This caused low temperatures on the right side of the assembly line, where relatively unheated air was introduced.
The EDT distribution for ADPIrev calculation was visualized for areas that satisfied −2.2 < EDT < 2. EDT was generally calculated to be −2.2 or less for areas where the temperature was 8 °C or less. In particular, the ADPIrev of the sub assembly, repair 1, and material storage zones could not satisfy the 80% threshold, as they were 62%, 71%, and 59%, respectively.
The analysis results were compared with the average values of the temperatures measured inside the factory, as shown in
Figure 8. When the temperature of the entire factory was examined, the lowest temperature was 7.3 °C, and the highest temperature was 18 °C. The difference in temperature measurements between points was found to be smaller in the experimental results than in the analysis results. The analysis results confirm that the main factor that affects the temperature distribution is the outside air that penetrated through the doors. However, there was a difference in the infiltration of outside air between reality and the analysis. Although the analysis was conducted using the corrected flow velocity by examining the opening and closing time of the doors, the pattern between the intermittently incoming flow and the continuously supplied flow caused a difference between reality and the analysis. The temperature measurements at each point can represent the average temperature of the factory.
4.2. Building Energy Supply and Losses
The causes of the supply and loss of heating energy and the proportions of each cause were examined. The amount of natural gas consumed in the large-scale assembly factory for heating can be obtained through the actual factory operation data.
Table 5 lists the natural gas consumption for heating for four months. A total of 1,831,223 Nm
3 was consumed over four months, and the total cost for heating was 1254 million KRW. As for the monthly gas consumption, the consumption of the furnaces was larger in December and January, when the temperature of the entire factory dropped due to the low outside air temperature.
The heat supply and heat loss were predicted through BES based on the amount of heat supplied to the large-scale assembly factory and the conditions on the thermal environment of the factory, as shown in
Table 6.
The analysis results revealed that the amount of heat supplied to the indoor space by lighting, people, and solar heat, in addition to the amount of heat supplied for heating, did not significantly affect the temperature distribution, as it was evaluated to be less than 10% of the total amount of heat. As for heat loss, the amount of heated air discharged through mechanical ventilation exhibited the highest proportion of 35.5%. The heat loss through the ceiling, walls, and floor of the factory was calculated to be 36.26%. The heat loss through the openings, such as doors, was 27.86%. The heat loss through the windows was less than 0.5%, because the windows are very small compared to the overall factory size, and most of them are double glazed.
Based on the building energy analysis results, improvement methods to reduce the heat loss of the building can be suggested. The analysis results showed that overall insulation performance reinforcement is required for the building. In particular, the proportion of heat loss through the roof showed that the most important part for insulation performance reinforcement is the roof. However, there are limitations in improving the insulation performance of this 35-year-old building. It was also found that mechanical ventilation, which represented the highest proportion of total energy loss, is a factor that increases the heating cost inside the factory due to energy drain. In this instance, it is difficult to recover energy from the discharged air because its temperature is not high and reducing the amount of ventilation is impossible because it may cause the spread of pollutants inside the workshop. Accordingly, there is a need to design a space that can reduce the energy loss caused by mechanical ventilation and prevent the inflow of outside air caused by ventilation.
4.3. Evaluation of Thermal Comfort for Improved Heating Strategies
The building energy simulation results confirmed that the factors with the highest improvement effect on energy loss are the forced mechanical ventilation and inflow of outside air (opening and leak). Two strategies for improving heating performance were applied in this study. Strategy 1: The installation locations of the furnaces were changed to improve the discharge directions of the heating devices towards the ventilation area. Strategy 2: the operation method of the automatic door was improved to inhibit the inflow of outside air. The reason why it was excluded from the heat loss through the roof in the heating performance improvement strategy establishment is that the only way to reduce the heat loss of the roof is to reinforce the insulation performance, and it is difficult to apply this to the already aging target large-scale factory.
As shown in
Figure 9, the installation locations and heated air discharge directions of seven operational furnaces were modified. The non-heated areas distributed in the upper part of the main assembly zone and sub assembly zone were improved. The seven furnaces used for the improvement were located in the repair 1 zone, the upper part of the main assembly zone, and the sub assembly zone. The furnaces were installed in the areas where their position and direction could be easily adjusted, and significant temperature drops could occur due to outside air. For better understanding, the installation locations and discharge directions of the furnaces were marked with arrows on the temperature distribution image.
The average temperature of the factory by adjusting the installation locations and discharge directions of the furnaces was calculated to be 16.7 °C, which represents an improvement, and ADPI
rev increased by 9% to 79%. In addition, as shown in
Figure 9a, the temperature reduction in the main assembly zone due to air flow in non-heated zones caused by outside air was improved. This method can improve the draft caused by outside air while increasing the temperature of the entire factory. In particular, the sub assembly zone exhibited an average temperature improvement effect of 3.6 °C through heating improvement, and ADPI rose to 76%. Modifying the locations and discharge directions of the furnaces was effective in solving the non-heated area formed in the upper part of the main assembly zone.
Figure 10 shows the heating performance improvement results when the inflow of outside air into the factory was reduced. When the amount of air introduced was reduced by half through the proper use of double doors and air curtains, the average temperature inside the factory rose to 18.4 °C, and the internal temperature was increased by 3 °C, compared to the reference model. An increase in average temperature was observed throughout the sub zone, and an increase in the average temperature of the material storage zone and a reduction in the momentum of outside air led to an increase in the temperature of the main assembly line located in the center of the factory. The ADPI
rev of the entire factory was 79%, which is close to the 80% comfort threshold. However, low temperatures were still predicted in the large non-heated area of the sub assembly line, and ADPI was also found to be at a similar level.
Table 7 summarizes the average temperature and ADPI
rev of each sub zone for three cases (present, strategy 1, and strategy 2). Based on the average temperature and ADPI, it was confirmed that more than 80% can be secured for the ADPI
rev of the entire factory by improving heating in the sub assembly zone, while maintaining the current heating capacity, and the inflow of outside air is a factor that interferes with an increase in the thermal comfort inside the factory.
5. Conclusions
In this study, the heating performance of a large-scale assembly factory was investigated. The heating performance was evaluated by performing CFD and BES. These numerical results show the heating performance by the distribution of temperature and thermal comfort (EDT) inside the factory and the causes of energy loss in a large-scale factory. Furthermore, the numerical results of the air temperature are compared with experimental data. The studies confirm that the average air temperature of large-scale factories was calculated to be 15.4 °C, and the ADPI was 70%. Moreover, the BES results show that the energy losses due to forced ventilation and the inflow of outside air contributed 35.5% and 27.8%, respectively. The heat loss due to the insulation performance of the building mainly occurred in the ceiling, accounting for 19.6% of the total heat loss.
Therefore, we suggest two strategies to improve heating performances. First, the location and discharge direction of the heating facilities were adjusted so that the heating performance was uniform. Second, measures to block outside air such as double doors and air curtains were applied. The issue of thermal insulation performance was excluded from the discussion. The results show that the average temperature and thermal comfort inside the factory when applying these strategies were increased at the same energy consumption. If the inflow of outside air is reduced by 50%, the average temperature inside the factory can rise by 3 °C, thereby securing an ADPIrev of up to 79%. This suggests that forced ventilation and outside air inflow management are important for improving heating performance in a large-scale factory.
Based on these results, it was concluded that additional studies and methodologies are needed, from a large-scale factory design to energy flow in buildings where heating is considered. In particular, it was found that there is a need for co-simulation studies between CFD and BES that can predict the internal temperature distribution considered with energy loss due to outside air. This approach could also suggest efficient HVAC strategies and energy efficiency improvement of the building before the factory construction.
Author Contributions
Conceptualization, D.K., H.L., J.P. and G.R.; methodology, D.K., H.L. and G.R.; software, D.K., J.M. and J.P.; validation, D.K. and H.L.; formal analysis, D.K.; investigation, D.K. and J.M.; data curation, D.K.; writing—original draft preparation, D.K. and H.L.; writing—review and editing, H.L., J.M. and G.R.; supervision, G.R.; project administration, G.R. All authors have read and agreed to the published version of the manuscript.
Funding
This research received no external funding.
Institutional Review Board Statement
Not applicable.
Informed Consent Statement
Not applicable.
Data Availability Statement
The study did not report any data.
Acknowledgments
Thank you to everyone who has cooperated with the factory investigation.
Conflicts of Interest
The authors declare no conflict of interest.
References
- Pérez-Lombard, L.; Ortiz, J.; Pout, C. A review on buildings energy consumption information. Energy Build. 2008, 40, 394–398. [Google Scholar] [CrossRef]
- Alibabaei, N.; Fung, A.S.; Raahemifar, K.; Moghimi, A. Effects of intelligent strategy planning models on residential HVAC system energy demand and cost during the heating and cooling seasons. Appl. Energy 2017, 185, 29–43. [Google Scholar] [CrossRef]
- Yang, L.; Yan, H.; Lam, J.C. Thermal comfort and building energy consumption implications—A review. Appl. Energy 2014, 115, 164–173. [Google Scholar] [CrossRef]
- Wang, Y.; Kuckelkorn, J.; Zhao, F.Y.; Liu, D.; Kirschbaum, A.; Zhang, J.L. Evaluation on classroom thermal comfort and energy performance of passive school building by optimizing HVAC control systems. Build. Environ. 2015, 89, 86–106. [Google Scholar] [CrossRef]
- Ho, S.H.; Rosario, L.; Rahman, M.M. Three-dimensional analysis for hospital operating room thermal comfort and contaminant removal. Appl. Therm. Eng. 2009, 29, 2080–2092. [Google Scholar] [CrossRef]
- Gärtner, J.A.; Massa Gray, F.; Auer, T. Assessment of the impact of HVAC system configuration and control zoning on thermal comfort and energy efficiency in flexible office spaces. Energy Build. 2020, 212, 109785. [Google Scholar] [CrossRef]
- Nada, S.A.; El-Batsh, H.M.; Elattar, H.F.; Ali, N.M. CFD investigation of airflow pattern, temperature distribution and thermal comfort of UFAD system for theater buildings applications. J. Build. Eng. 2016, 6, 274–300. [Google Scholar] [CrossRef]
- Ricciardi, P.; Ziletti, A.; Buratti, C. Evaluation of thermal comfort in an historical Italian opera theatre by the calculation of the neutral comfort temperature. Build. Environ. 2016, 102, 116–127. [Google Scholar] [CrossRef]
- Stamou, A.I.; Katsiris, I.; Schaelin, A. Evaluation of thermal comfort in Galatsi Arena of the Olympics “Athens 2004” using a CFD model. Appl. Therm. Eng. 2008, 28, 1206–1215. [Google Scholar] [CrossRef] [Green Version]
- Kükrer, E.; Eskin, N. Effect of design and operational strategies on thermal comfort and productivity in a multipurpose school building. J. Build. Eng. 2021, 44, 102697. [Google Scholar] [CrossRef]
- Wagner, A.; Gossauer, E.; Moosmann, C.; Gropp, T.; Leonhart, R. Thermal comfort and workplace occupant satisfaction-Results of field studies in German low energy office buildings. Energy Build. 2007, 39, 758–769. [Google Scholar] [CrossRef]
- D’Ambrosio Alfano, F.R.; Olesen, B.W.; Palella, B.I.; Riccio, G. Thermal comfort: Design and assessment for energy saving. Energy Build. 2014, 81, 326–336. [Google Scholar] [CrossRef]
- Melikov, A.K.; Nielsen, J.B. Local thermal discomfort due to draft and vertical temperature difference in rooms with displacement ventilation. ASHRAE Trans. 1989, 95, 1050–1057. [Google Scholar]
- White, F.M. Fluid Mechanics; McGraw-Hill: Boston, MA, USA, 2003; ISBN 0072402172. [Google Scholar]
- Wilcox, D.C. Turbulence Modeling for CFD; DCW Industries: La Canada, CA, USA, 2002; ISBN 192872910X. [Google Scholar]
- American Society of Heating, Refrigeration; Air-Conditioning Engineers. 2009 ASHRAE Handbook; American Society of Heating, Refrigeration, and Air-Conditioning Engineers: Atlanta, GA, USA, 2009; ISBN 9781933742557. [Google Scholar]
- Liu, S.; Novoselac, A. Air Diffusion Performance Index (ADPI) of diffusers for heating mode. Build. Environ. 2015, 87, 215–223. [Google Scholar] [CrossRef]
- Crawley, D.B.; Lawrie, L.K.; Winkelmann, F.C.; Buhl, W.F.; Huang, Y.J.; Pedersen, C.O.; Strand, R.K.; Liesen, R.J.; Fisher, D.E.; Witte, M.J.; et al. EnergyPlus: Creating a new-generation building energy simulation program. Energy Build. 2001, 33, 319–331. [Google Scholar] [CrossRef]
- American Society of Heating, Refrigeration; Air-Conditioning Engineers. 2013 Ashrae Handbook; Ashrae: Atlanta, GA, USA, 2013; ISBN 9781936504459. [Google Scholar]
| Publisher’s Note: MDPI stays neutral with regard to jurisdictional claims in published maps and institutional affiliations. |
© 2021 by the authors. Licensee MDPI, Basel, Switzerland. This article is an open access article distributed under the terms and conditions of the Creative Commons Attribution (CC BY) license (https://creativecommons.org/licenses/by/4.0/).


