Article

Ground Source and Sewage Water Source Heat Pump Systems for Block Heating and Cooling Network

Renewable Heat Integration Research Lab, Korea Institute of Energy Research, Gajeong-ro 152, Daejeon 34129, Korea
*
Author to whom correspondence should be addressed.
Energies 2021, 14(18), 5640; https://doi.org/10.3390/en14185640
Submission received: 7 August 2021 / Revised: 2 September 2021 / Accepted: 5 September 2021 / Published: 8 September 2021

Abstract

:
The demand for district heating and cooling systems in block units with a heat pump that utilizes various unused energy sources for energy supply has been increasing. This study investigated experimentally the ground source heat pump (GSHP) and sewage water source heat pump (SWSHP) facilities used in block cooling and heating networks. Then, a heat pump performance prediction model was derived for utilization in future designs. Operational data for heating and cooling energy supply from an experimental site were investigated for the period between 2018 and 2020. During the cooling season, the coefficient of performance (COP) of the GSHP was approximately 4.1, and that of the SWSHP was approximately 2.9. The cooling performance of the SWSHP gradually decreased because of the fouling. The COP of the GSHP and SWSHP during the heating season was approximately 3.6 and 3.4, respectively. The results also demonstrated that, if fouling in the SWSHP can be prevented or reduced, the acquired COP can be similar to that of the GSHP. The derived prediction model serves as a good reference for engineers who require information on the performance of field operations.

1. Introduction

Recently, the utilization demand for water source heat pump (HP) systems for heating and cooling energy production has been increasing because of its advantages of reducing carbon emissions and increasing energy efficiency in buildings [1,2,3]. When the heat pump produces cooling energy for cooling the building and heating energy for heating at the load side, the efficiency of the heat pump is affected by the temperature of the source side. In order to produce cooling energy, the lower the temperature of the source side, the higher the efficiency of the HP. To produce heating energy, the higher the temperature of the source side, the higher the efficiency of the HP. These patterns indicate that, as the source side temperature is similar to the energy production side temperature, the HP exhibits a higher efficiency.
In general, an air source HP (e.g., a package air conditioner in a building) uses outdoor air as a heat source. This type of HP decreases in efficiency under low outdoor air temperatures in the production of heating energy in winter and under high outdoor air temperatures in the production of cooling energy in summer. To increase the efficiency of the HP, other types of heat sources have been explored, including the ground source heat pump (GSHP) using ground source heat exchangers, river water, seawater, and power plant wastewater [1,2,3]. Among these heat sources, sewage water sources have been utilized recently in buildings that discharge water into rivers/streams after treatment in a sewage treatment plant. The temperature of the source water is suitable for use as a heat source for heat pumps [1,2,3].
Regarding a state-of-the-art district heating and cooling network, the importance of a HP system in the community has been raised, and it is strongly expected that the HPs will play a vital role in the future [4]. Thus, it is crucial to investigate the performance of HP systems in terms of a real scale and duration.
State-of-the-art HP studies have been conducted using different strategies, [5] such as the investigation of the real-life performance of HP systems and the identification of optimization potential. Following this trend, some studies have focused on water source HPs for heating and cooling buildings for a long time. Cho and Yun [6] investigated the utilization of HPs with a raw water source (a reservoir) for the air conditioning of a building; the experimental results were a COP of 3.3 in winter and a COP of 7.2 in summer. Qin and Hao [7] conducted experiments to analyze the performance of a sewage water source HP using a free-flow-channel heat exchanger. The results showed that the average COP was 4.0, and the exergetic cost was 7.8 W/W on average. However, various methods have been investigated to overcome the decrease in efficiency of a heat exchanger because of the fouling problem in the heat exchanger when using sewage water, as well as the consequences of decreased efficiency in a HP when a sewage water source is used. Shen et al. [8] developed a de-fouling evaporator in a shell-and-tube dry expansion type as a measure to minimize fouling during heat exchange from wastewater, and analyzed the performance of the developed evaporator. In addition, the performance of the anti-fouling wastewater HP with a wastewater tower was analyzed; after a 41-day experiment, the HP COP was measured at 3.32 and the system COP was measured at 2.13 [9]. Ni et al. [10] implemented an HP with the application of a sewage hydrocyclone to minimize fouling, and analyzed its performance. Zhang et al. [11] conducted a performance analysis of a wastewater source HP using a falling film evaporator.
Despite these efforts, only a few studies have been conducted on comparative analysis with existing HP systems, such as the GSHP, based on measurements of a real system over a long time. Previous research [12] analyzed the applicability of the GSHP with a thermal energy storage system during a cooling operation. Nevertheless, operation results of the sewage water source heat pump (SWSHP) and the heating operation have not been conducted so far. Therefore, in this study, the experimental results of three years (2018–2020) for the GSHP and SWSHP systems in heating and cooling modes applied with a thermal energy storage system were comparatively analyzed. Additionally, a simulation model was derived based on the measured data and a curve fit model used in EnergyPlus software [13].

2. Methodology

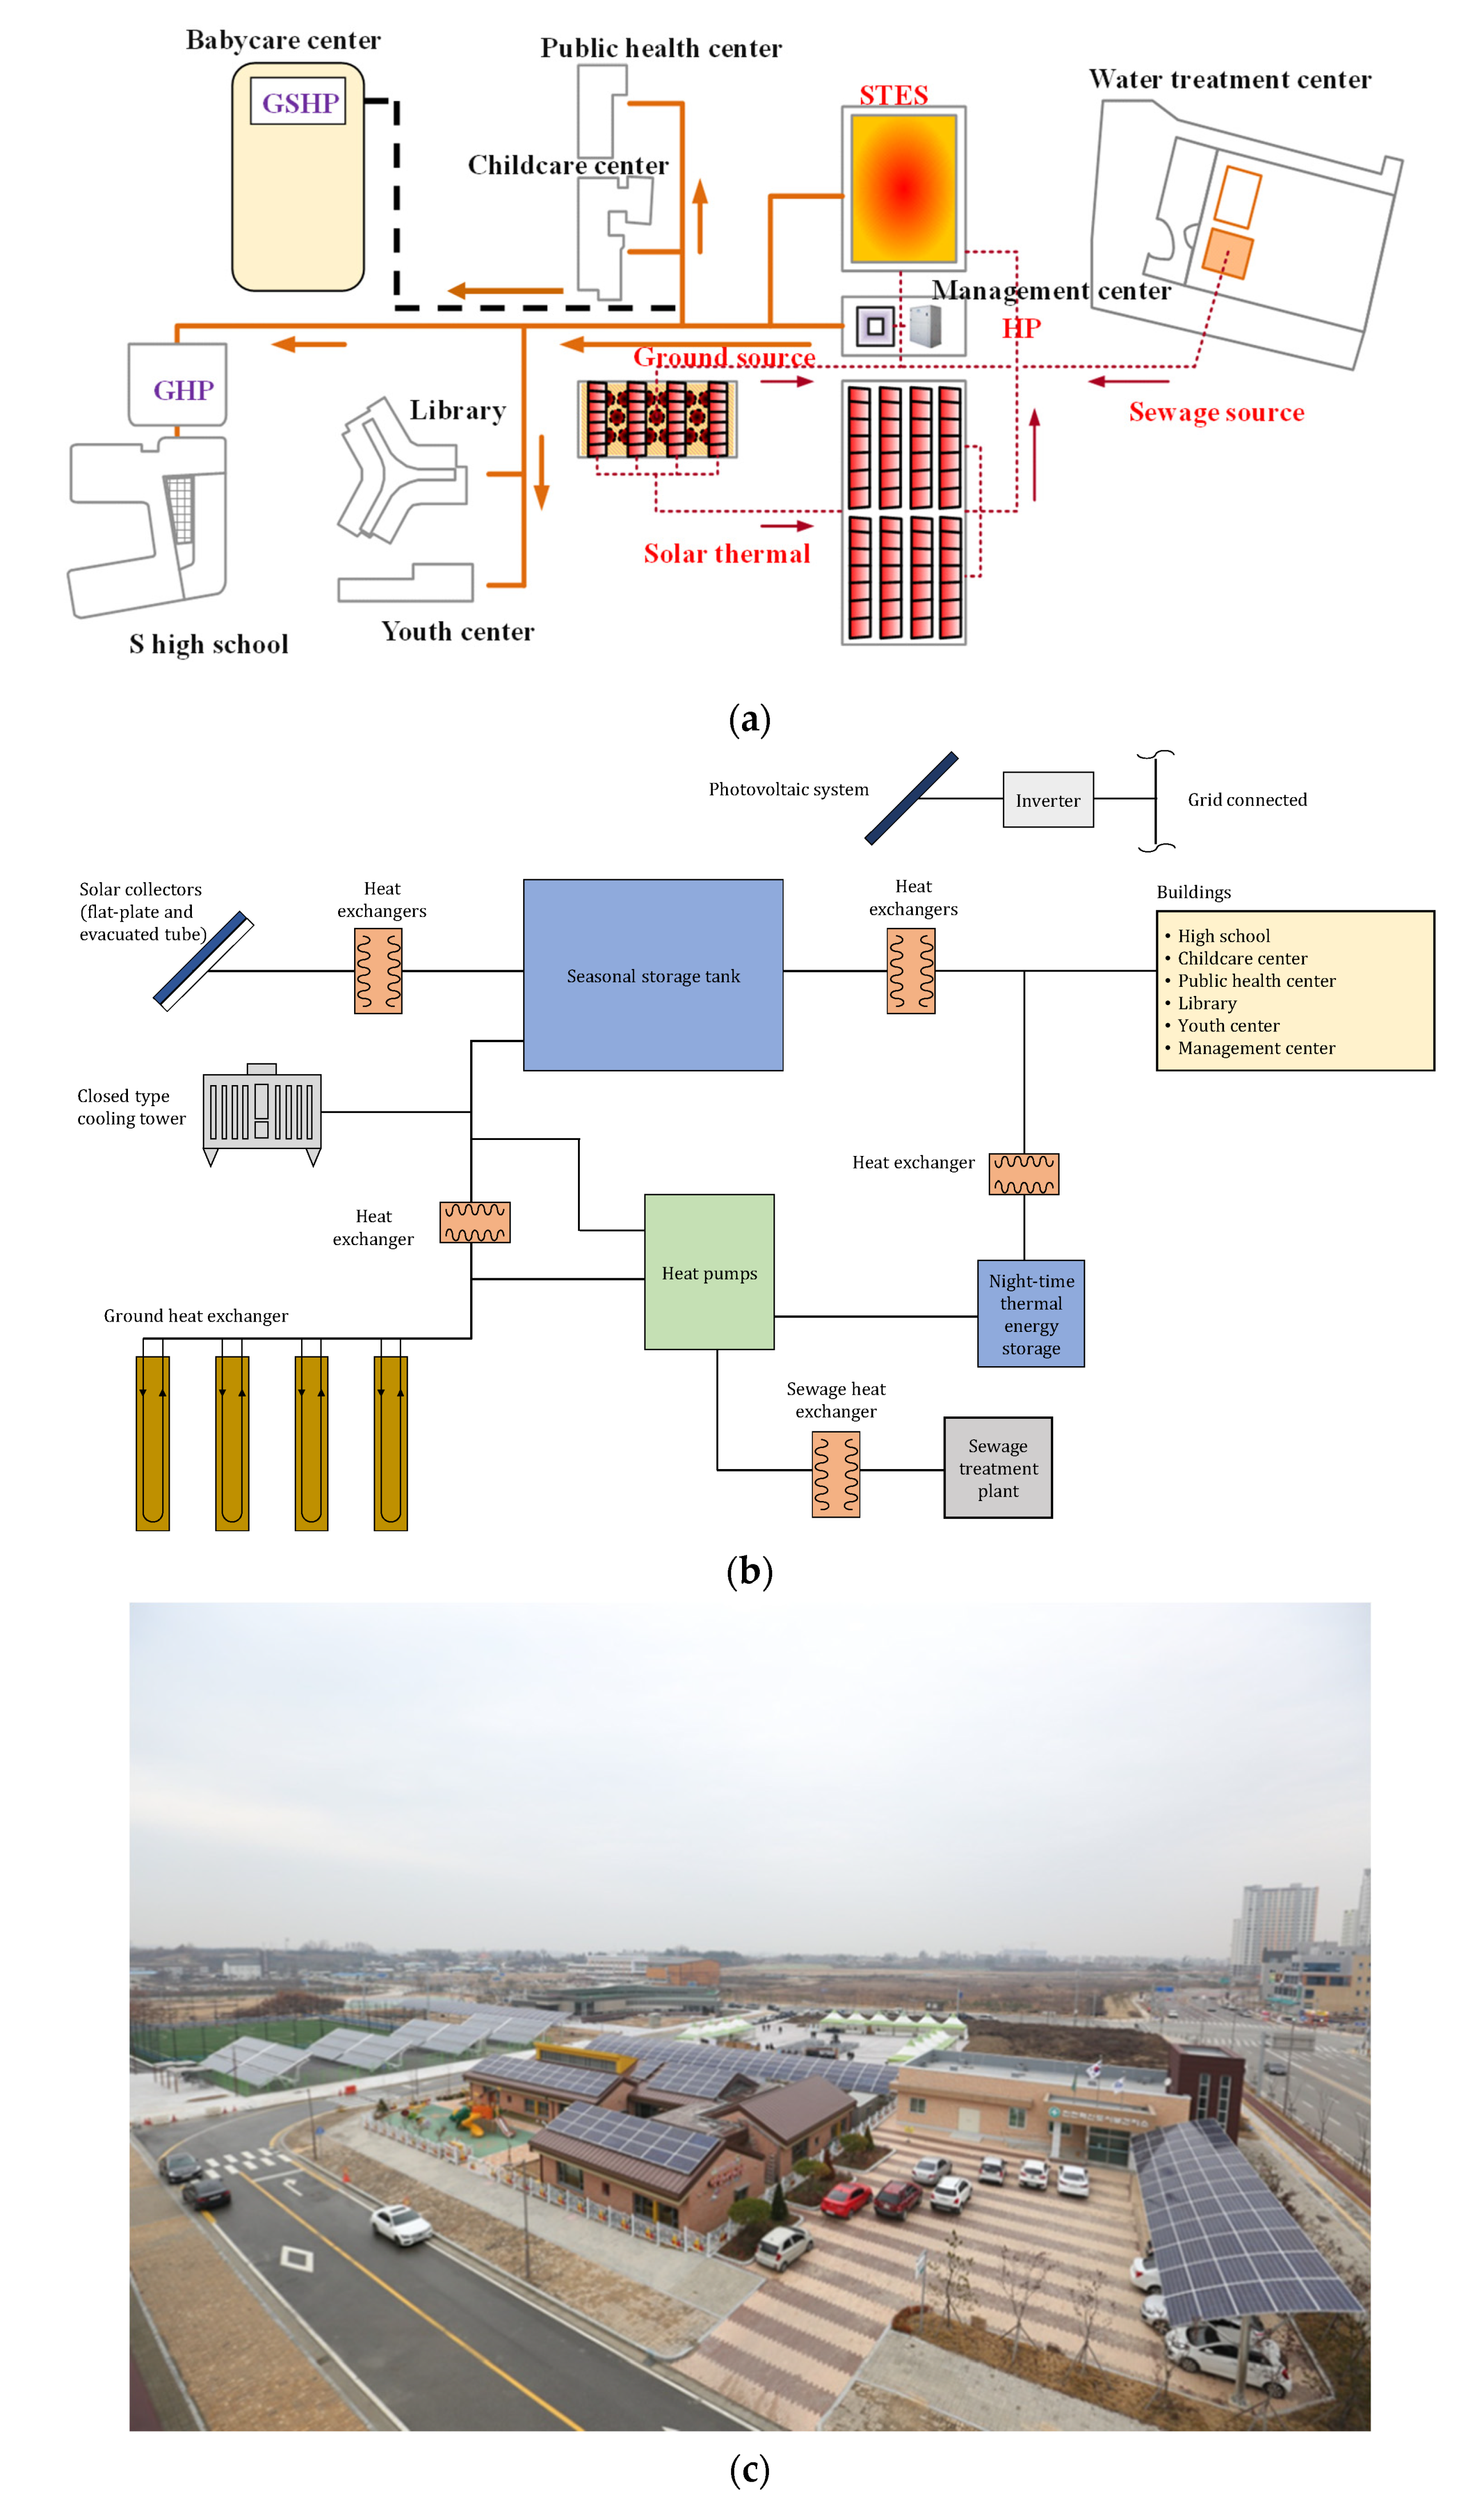
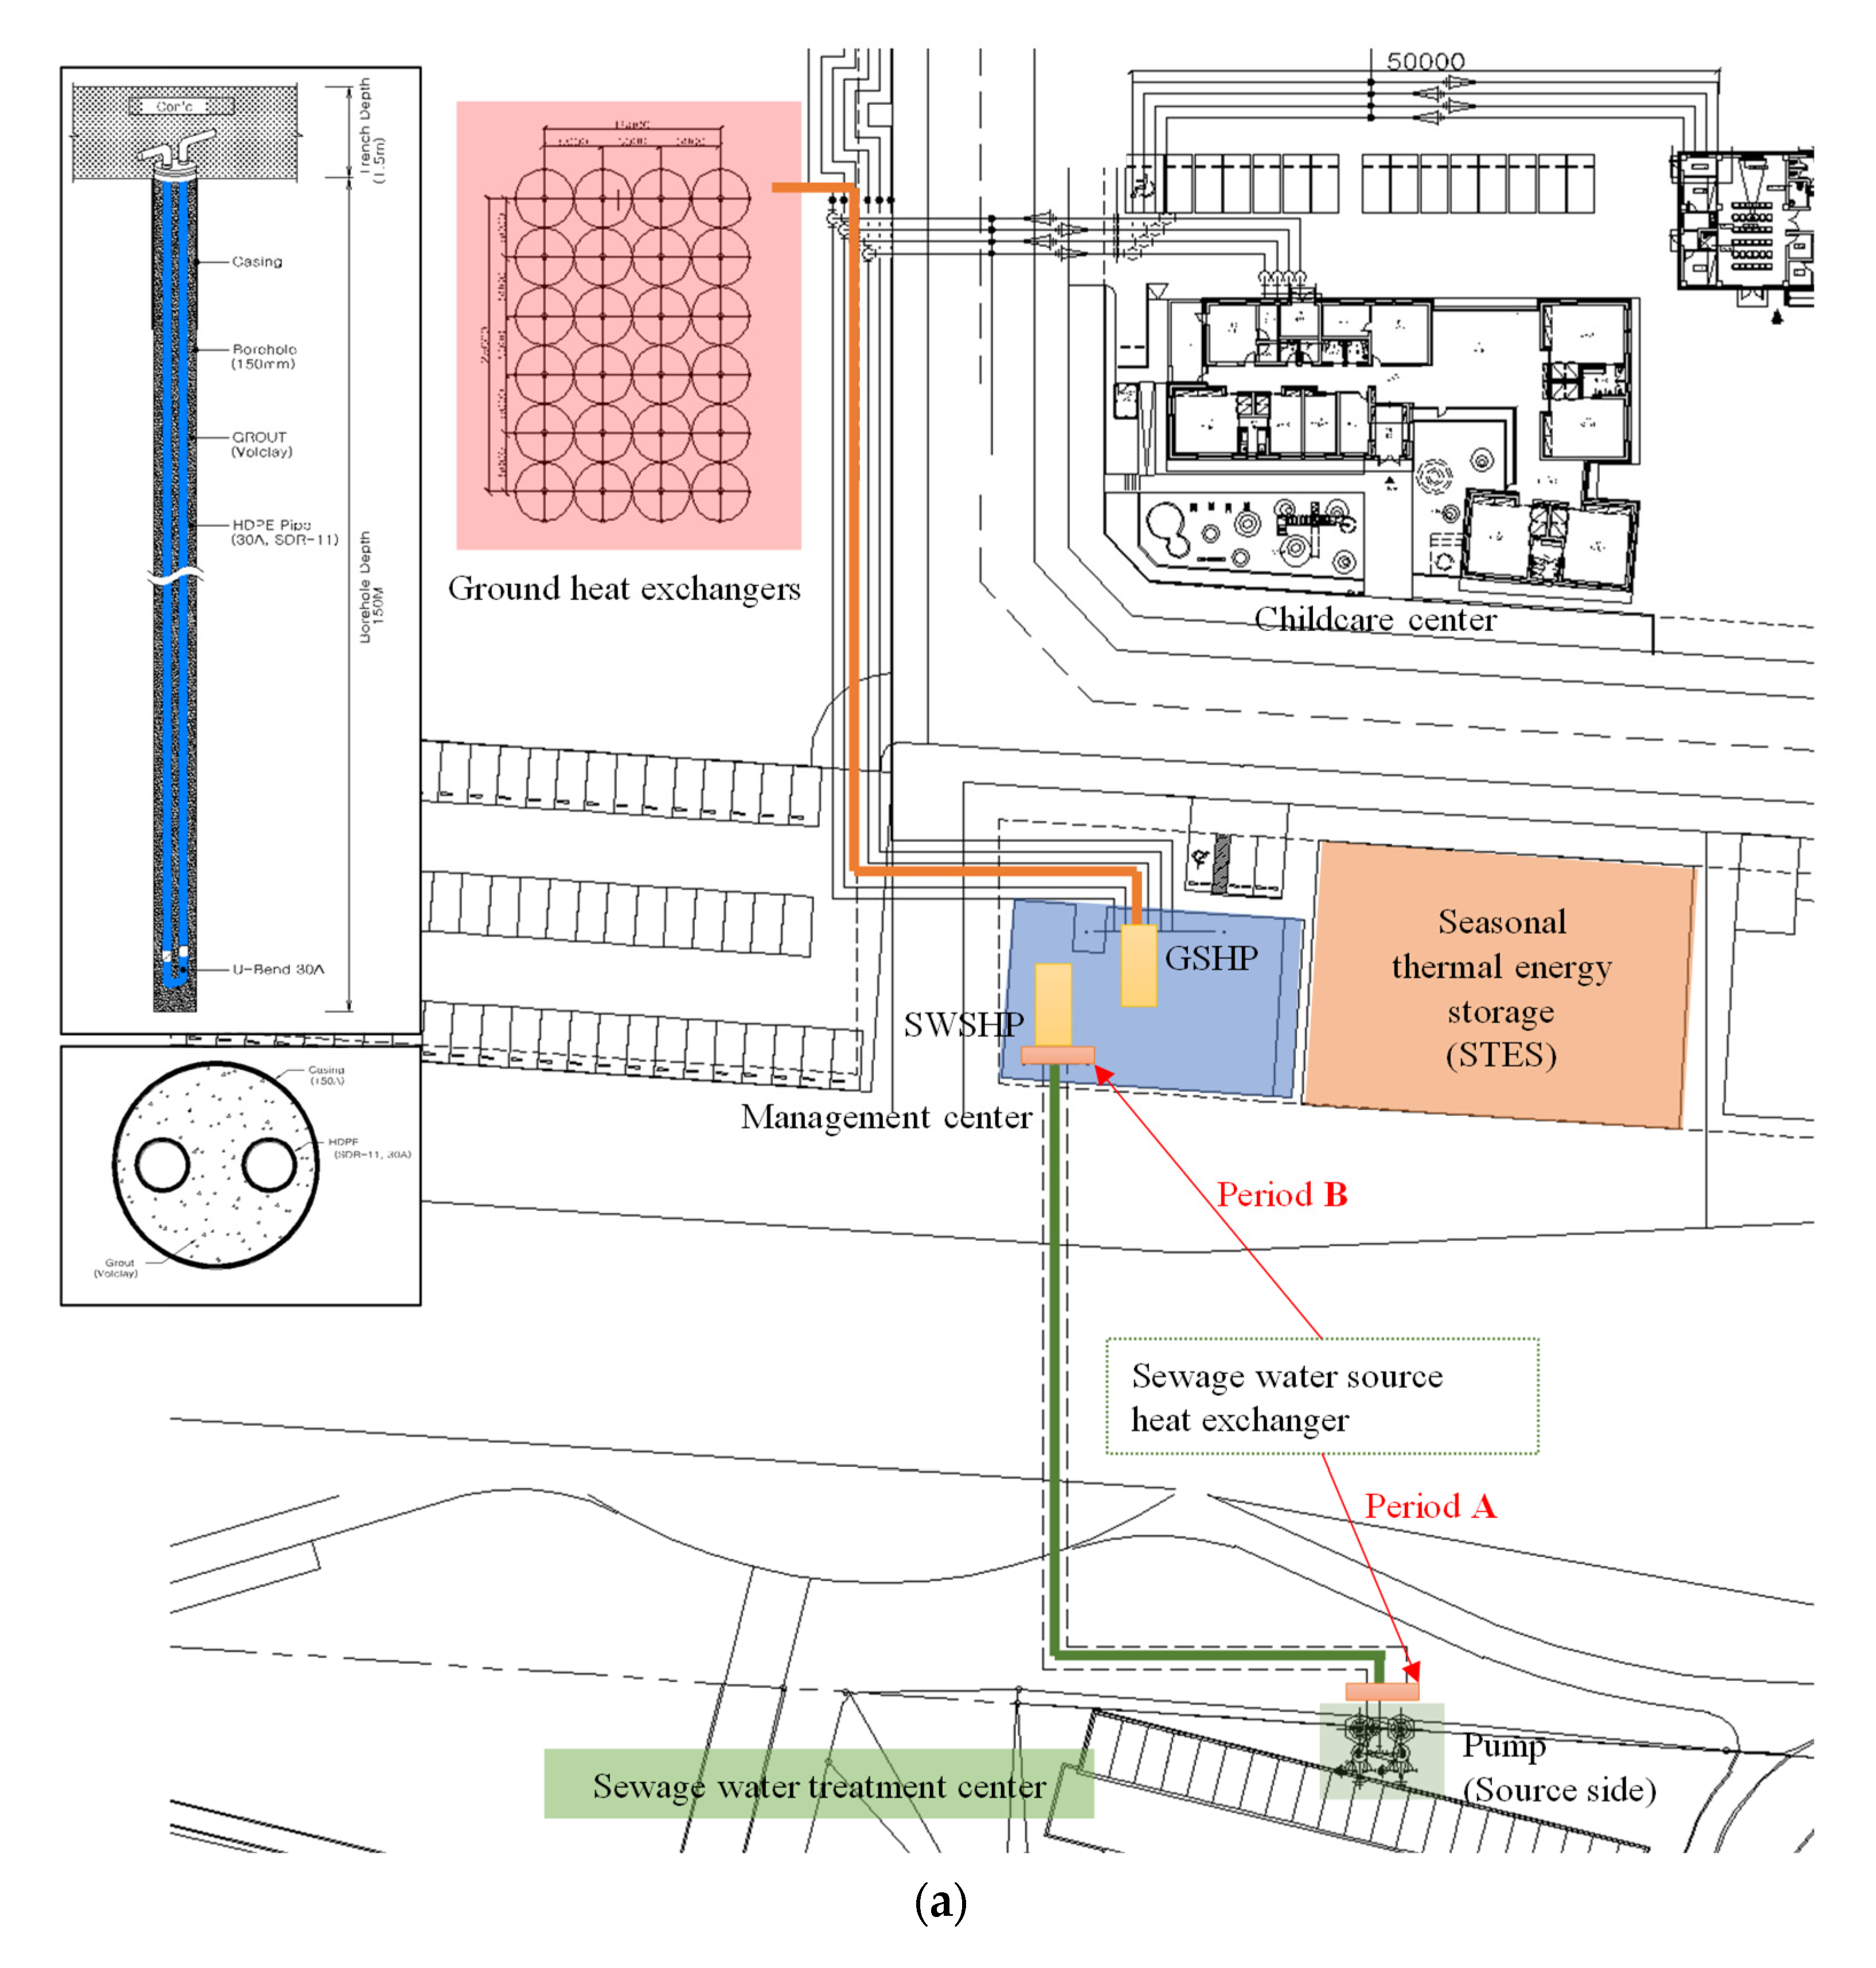
2.1. Overview of the Field Test Site

As shown in Figure 1, the field test site in an eco-friendly energy town of Jincheon in the Chungbuk Innovation City was selected in this research. This town had a total of six buildings, including the S High School of the Chungbuk Office of Education and five public buildings of Jincheon-gun. The primary heating facility of these buildings was a solar thermal system consisting of a 1600 m2 solar collector and 4000 m3 of seasonal thermal energy storage. As secondary heating facilities, three 175 kW HPs were installed in the integrated control room, including the GSHP and SWSHP, and a HP that utilized surplus heat at low temperatures in seasonal thermal energy storage as a heat source. From these HPs, the GSHP and SWSHP had a total capacity of 350 kW; they are capable of supplying cooling water for cooling in summer to public buildings, except for high schools with a heavy load of air conditioning. The heating/cooling energy produced from the integrated control room was used for self-consumption; additionally, the heat energy could be supplied to the remaining five buildings (or four buildings excluding the high school) through the pipe network. In high schools, a separate absorption heat pump with a capacity of approximately 1000 kW was installed as a cooling system for use in self-cooling. The detailed specifications of each facility are listed in Table 1. Among these facilities, which are shown in Figure 1b, the scope of this research is the energy performance of GSHP and SWSHP.

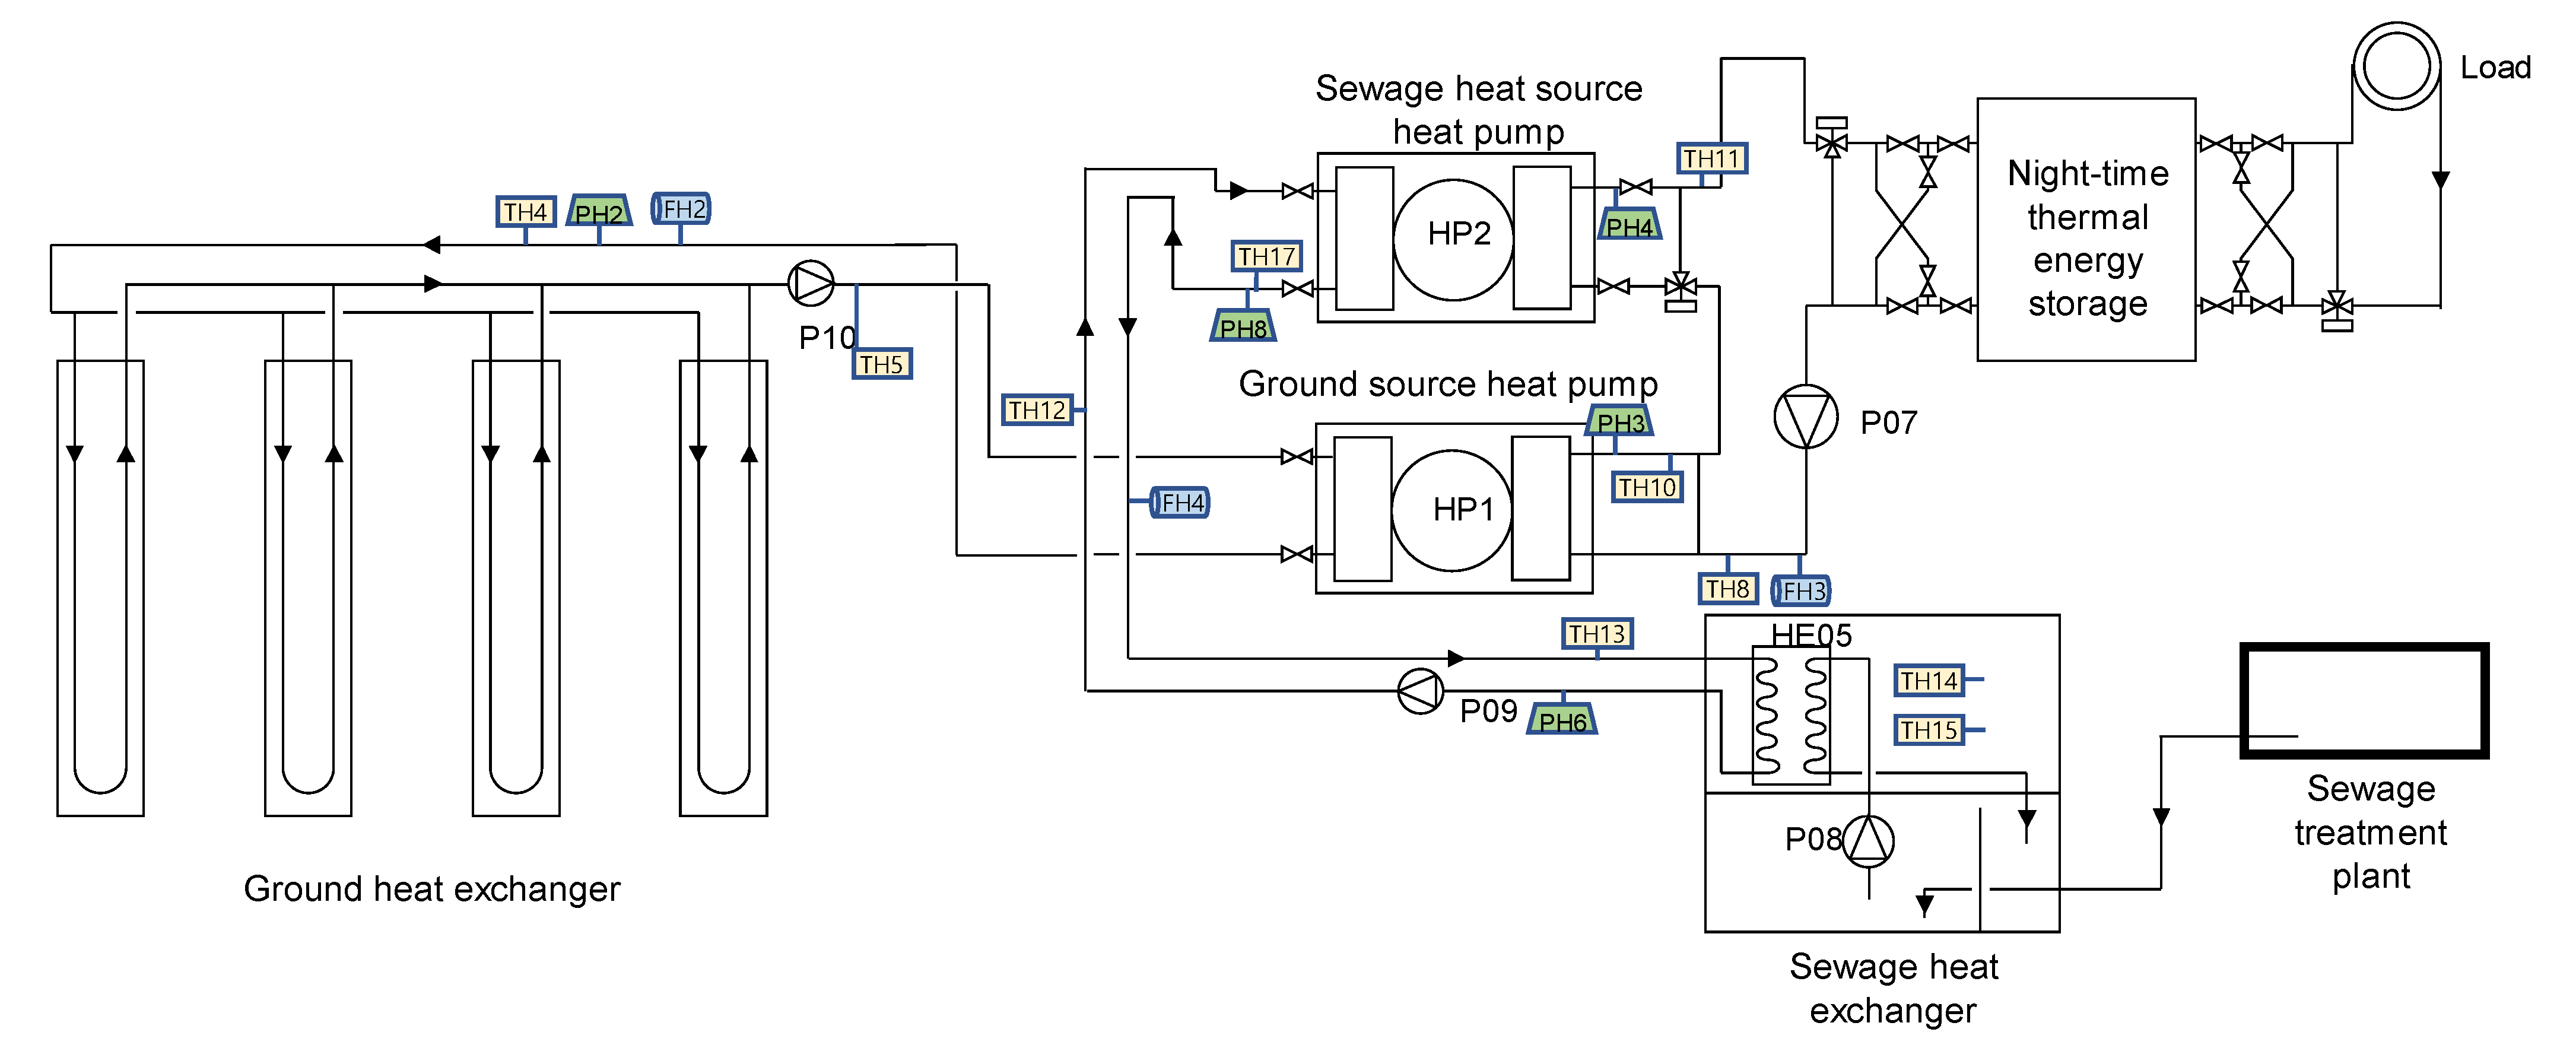
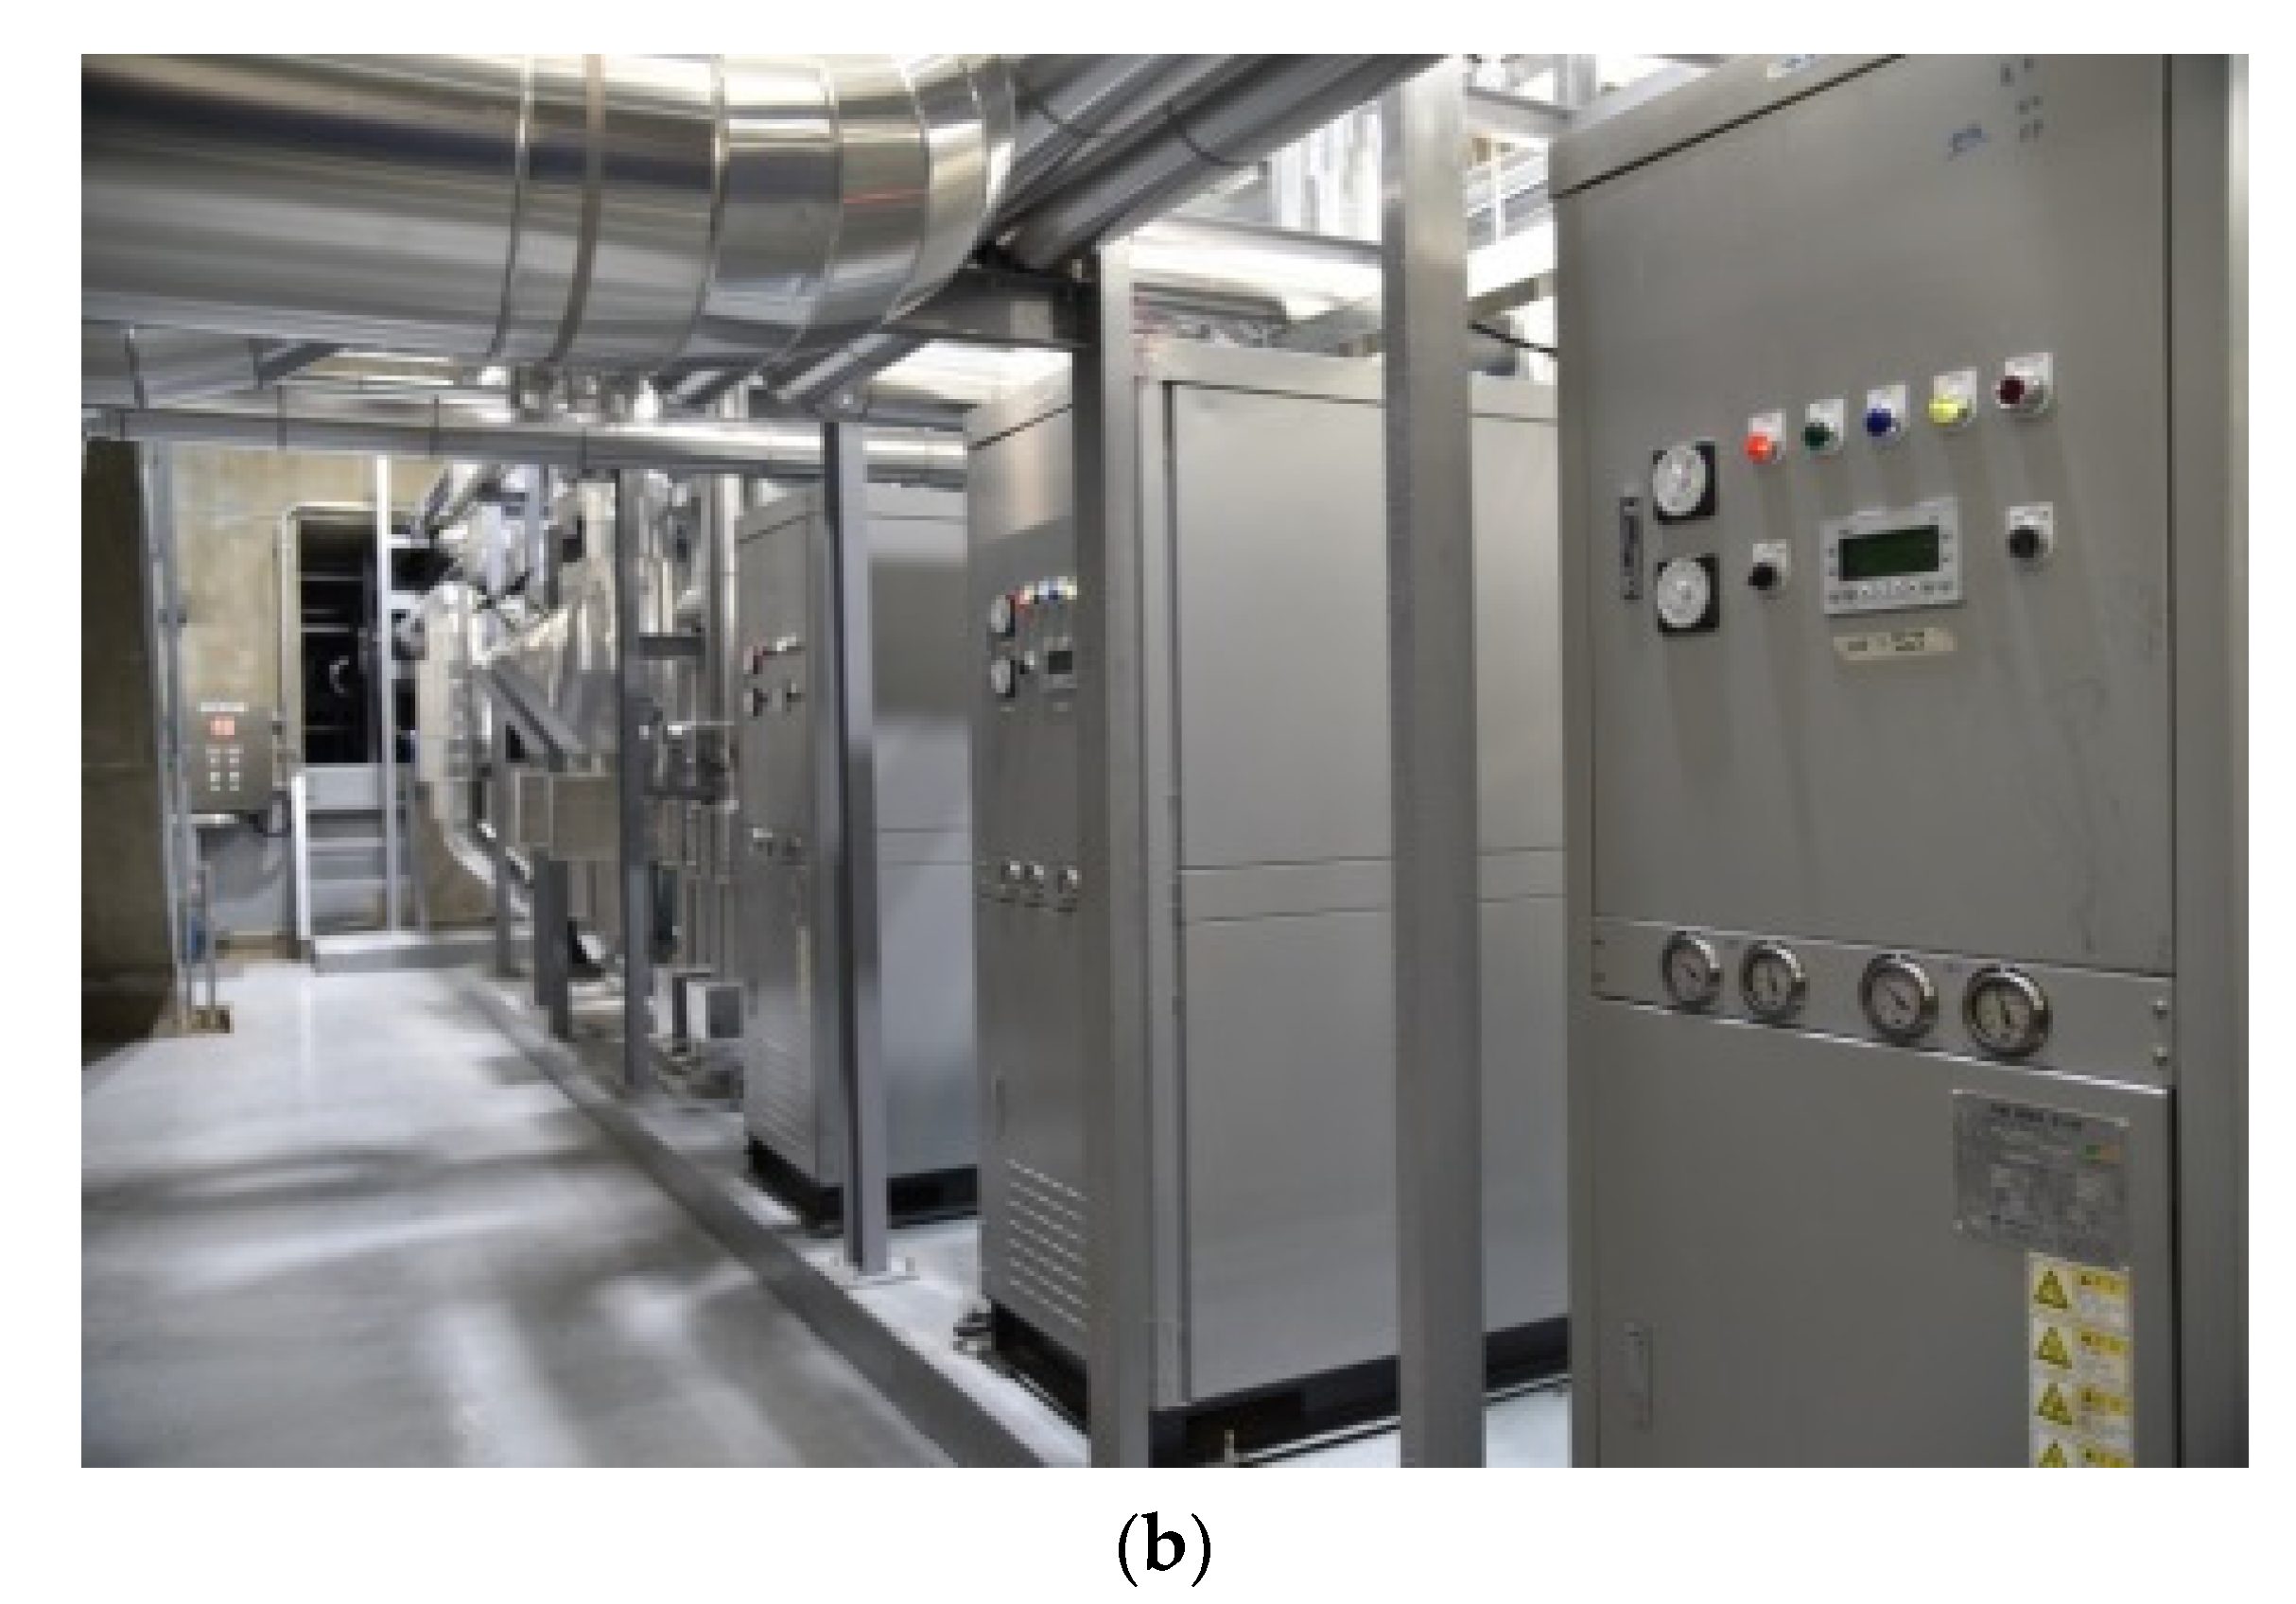
2.2. Overview of Ground and Sewage Water Source Heat Pumps

As shown in Table 1, the HPs in the town of the experimental site consisted of three types. Among the three HPs, the aim of this study was to conduct a performance comparison of a GSHP and SWSHP. As shown in Figure 2, the two HPs are supplied with the heat source for the HP from the ground source and the seawater source through the ground heat exchanger and the sewage water heat exchanger, respectively. At this time, the produced cooling and heating energies from the operation of each HP are stored in the night-time thermal energy storage (NTES) system.
During the cooling or heating season, GSHP and SWSHP produce cooling water or heating water to serve cooling or heating energy to the building. The produced thermal energy is stored in the NTES during the night-time and supplied during the daytime. After checking the status of GSHP and SWSHP, the operator selects an appropriate HP to produce cooling and heating energy manually.
Figure 3 shows the detailed positions of the ground source heat exchanger and the sewage water source heat exchanger in the HP in the central machine room. The ground source heat exchanger was located north of the machine room, and wells were drilled at a depth of 150 m; a total of 24 holes of heat exchangers were built. The upper part of the built heat exchanger was covered with soil with a thickness of 1.5 m, which is also a domestic design standard for winter freeze prevention. Then, a solar thermal collector was installed on the upper part, and an evacuated-type solar collector was installed. The sewage water source heat exchanger for the SWSHP used a plate heat exchanger (i.e., HE05). As shown in Figure 2, a pump is installed on both the primary side (i.e., P08) and the secondary side (i.e., P09) of the heat exchanger. Thus, during the operation of the HP, the pumps on the primary and secondary sides of the heat exchanger were operated simultaneously. The treated water from the sewage water treatment plant was collected in the sump; when it reached a certain amount, it was discharged to the surrounding stream through an outlet. Thus, the volume of water in the sump was kept almost constant.
However, through the SWSHP operation, a fouling problem occurred for the source side heat exchanger (i.e., HE05). Therefore, an experiment was performed to examine the method that was more efficient when changing the position of the heat exchanger. In this study, the heat exchanger was first placed in period A and operated from August 2018 to July 2019; then, it was placed in period B and operated from August 2019 to October 2020.

2.3. Overview of the Monitoring Systems

As shown in Table 2, various measurement sensors, such as temperature, flow, solar radiation, and electric power, were installed to measure and monitor system performance. In the experimental system, which is within the area range of this study, five pressure gauges, five flow meters, 20 temperature sensors (RTDs), and 6 watt-hour meters were installed. A pressure gauge and a flow meter measured the pressure and flow of the operating fluid flowing through the main pipe, respectively; the temperature sensor measured the temperature for each vertical section in the TES (other than those indicated in Figure 3). The watt-hour meter measured the power consumption of the circulation and HP. The measured data were recorded at 30 s intervals. In this study, the operational data of the heating and cooling energy supply between 1 January 2018, and 31 December 2020 were analyzed.

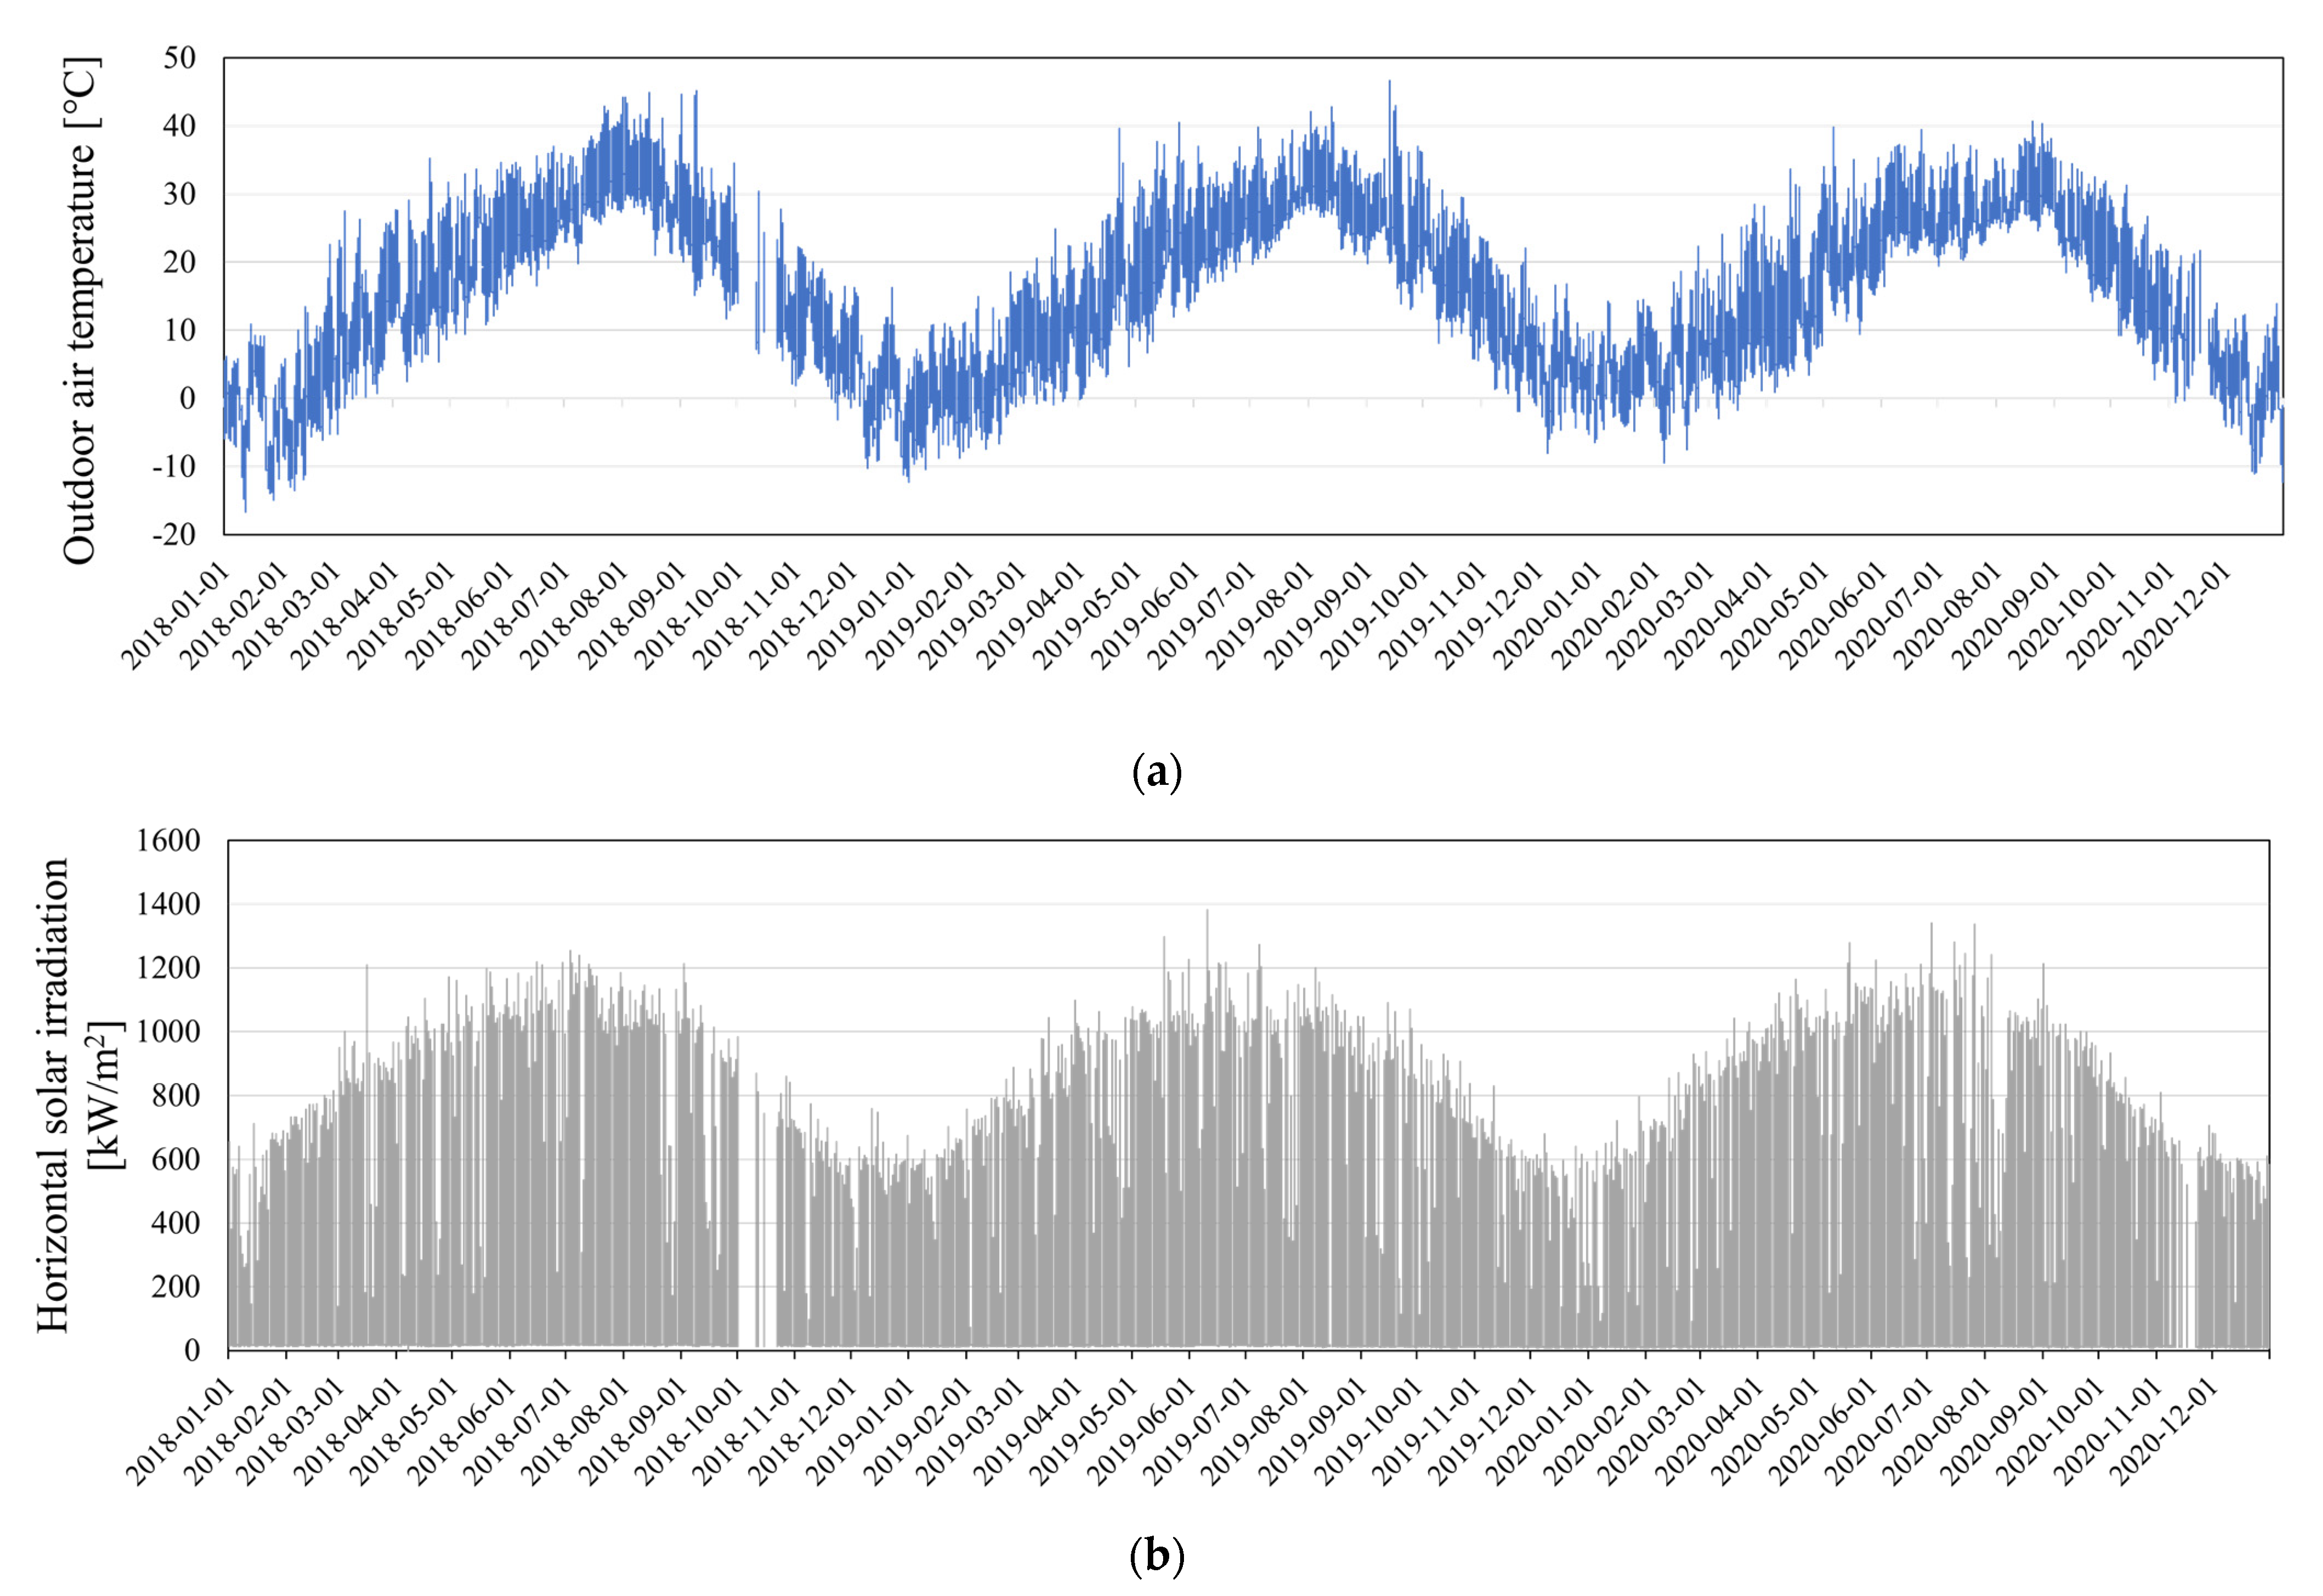
2.4. Outdoor Air Conditions during the Test

Figure 4 shows the outdoor air conditions during the test period. The outdoor air temperature ranged from −16.7 °C to 46.7 °C, and horizontal solar irradiation was observed from 0 to 1382.1 kW/m2.

2.5. Water-to-Water Heat Pump Model

Using the measured data from the temperature sensor and flow meter installed in the GSHP and SWSHP systems, the heat transfer rate in the cooling mode ( Q ˙ C , L ), the heat transfer rate in the heating mode ( Q ˙ C , L ), and the coefficient of performance (COP) of the system were calculated as follows:
Q ˙ G S H P , C , L = V ˙ L ( F H 3 ) c p ( T L , i n ( T H 8 ) T L , o u t ( T H 10 ) ) ,
Q ˙ G S H P , H , L = V ˙ L ( F H 3 ) c p ( T L , o u t ( T H 10 ) T L , i n ( T H 8 ) ) ,
Q ˙ S W S H P , C , L = V ˙ L ( F H 3 ) c p ( T L , i n ( T H 10 ) T L , o u t ( T H 11 ) ) ,
Q ˙ S W S H P , H , L = V ˙ L ( F H 3 ) c p ( T L , o u t ( T H 11 ) T L , i n ( T H 10 ) ) ,
C O P G S H P , C = Q G S H P , C , L / W G S H P , C ,
C O P G S H P , H = Q G S H P , H , L / W G S H P , H ,
C O P S W S H P , C = Q S W S H P , C , L / W S W S H P , C ,
C O P S W S H P , H = Q S W S H P , H , L / W S W S H P , H ,
where T L , i n is the load side inlet water temperature [K]; T L , o u t is the load side outlet water temperature [K]; V ˙ L is the load side volumetric flow rate [m3/s]; V ˙ S is the source side volumetric flow rate [m3/s]; Q ˙ C , L and Q ˙ H , L are the load side heat transfer rates (cooling and heating modes, respectively) [W]; and W C and W H are the power consumptions (cooling and heating modes, respectively) [W].
In this study, the curve fitting method adopted in the EnergyPlus program [13] was utilized. In the EnergyPlus software, the “parameter estimation-based model” and “curve fit method model” can be used as models for simulating the performance of water-to-water HP. Between the two models, a model using the curve fitting method that allows easy and fast simulation of the performance of the water-to-water HP was selected. Additionally, a model that can simulate the performance of the GSHP and SSHP was derived. To simulate the performance of the HP, as expressed in Equations (9)–(16), the heat on the production side of the HP and the power consumed at this time can be calculated using an empirical model with load side inlet temperature ( T L , i n ), source side inlet temperature ( T S , i n ), load side flow ( V ˙ L ), and source side flow ( V ˙ S ) as variables. The COP of the HP can be derived as expressed in Equations (17)–(20).
The subscript “ref” in the following equations indicates the certification performance under the reference conditions provided by the manufacturer; the reference conditions of the HP used in this study are outlined in detail in Table 3. The reference temperatures of those equations (i.e., T r e f ) were all set to 10 °C (283.15 K), which was uniformly applied to the model regardless of the data provided by the manufacturer.
Q ˙ G S H P , C Q ˙ G S H P , C , r e f = a 1 + a 2 ( T L , i n ( T H 8 ) T r e f ) + a 3 ( T S , i n ( T H 5 ) T r e f ) + a 4 ( V ˙ L ( F H 3 ) V ˙ G S H P , L , r e f ) + a 5 ( V ˙ S ( F H 2 ) V ˙ G S H P , S , r e f ) ,
Q ˙ G S H P , H Q ˙ G S H P , H , r e f = b 1 + b 2 ( T L , i n ( T H 8 ) T r e f ) + b 3 ( T S , i n ( T H 5 ) T r e f ) + b 4 ( V ˙ L ( F H 3 ) V ˙ G S H P , L , r e f ) + b 5 ( V ˙ S ( F H 2 ) V ˙ G S H P , S , r e f ) ,
Q ˙ S W S H P , C Q ˙ S W S H P , C , r e f = c 1 + c 2 ( T L , i n ( T H 10 ) T r e f ) + c 3 ( T S , i n ( T H 12 ) T r e f ) + c 4 ( V ˙ L ( F H 3 ) V ˙ S W S H P , L , r e f ) + c 5 ( V ˙ S ( F H 4 ) V ˙ S W S H P , S , r e f ) ,
Q ˙ S W S H P , H Q ˙ S W S H P , H , r e f = d 1 + d 2 ( T L , i n ( T H 10 ) T r e f ) + d 3 ( T S , i n ( T H 12 ) T r e f ) + d 4 ( V ˙ L ( F H 3 ) V ˙ S W S H P , L , r e f ) + d 5 ( V ˙ S ( F H 4 ) V ˙ S W S H P , S , r e f ) ,
W G S H P , C W G S H P , C , r e f = e 1 + e 2 ( T L , i n ( T H 8 ) T r e f ) + e 3 ( T S , i n ( T H 5 ) T r e f ) + e 4 ( V ˙ L ( F H 3 ) V ˙ G S H P , L , r e f ) + e 5 ( V ˙ S ( F H 2 ) V ˙ G S H P , S , r e f ) ,
W G S H P , H W G S H P , H , r e f = f 1 + f 2 ( T L , i n ( T H 8 ) T r e f ) + f 3 ( T S , i n ( T H 5 ) T r e f ) + f 4 ( V ˙ L ( F H 3 ) V ˙ G S H P , L , r e f ) + f 5 ( V ˙ S ( F H 2 ) V ˙ G S H P , S , r e f ) ,
W S W S H P , C W S W S H P , C , r e f = g 1 + g 2 ( T L , i n ( T H 10 ) T r e f ) + g 3 ( T S , i n ( T H 12 ) T r e f ) + g 4 ( V ˙ L ( F H 3 ) V ˙ S W S H P , L , r e f ) + g 5 ( V ˙ S ( F H 4 ) V ˙ S W S H P , S , r e f ) ,
W S W S H P , H W S W S H P , H , r e f = h 1 + h 2 ( T L , i n ( T H 10 ) T r e f ) + h 3 ( T S , i n ( T H 12 ) T r e f ) + h 4 ( V ˙ L ( F H 3 ) V ˙ S W S H P , L , r e f ) + h 5 ( V ˙ S ( F H 4 ) V ˙ S W S H P , S , r e f ) ,
C O P G S H P , C C O P G S H P , C , r e f = Q ˙ G S H P , C Q ˙ G S H P , C , r e f W G S H P , C W G S H P , C , r e f ,
C O P G S H P , H C O P G S H P , H , r e f = Q ˙ G S H P , H Q ˙ G S H P , H , r e f W G S H P , H W G S H P , H , r e f ,
C O P S W S H P , C C O P S W S H P , C , r e f = Q ˙ S W S H P , C Q ˙ S W S H P , C , r e f W S W S H P , C W S W S H P , C , r e f ,
C O P S W S H P , H C O P S W S H P , H , r e f = Q ˙ S W S H P , H Q ˙ S W S H P , H , r e f W S W S H P , H W S W S H P , H , r e f ,
where T S , i n is the source side inlet water temperature [K].
Uncertainty propagation of analysis was conducted. The method used is described in NIST Technical Note 1297 [14]. The overall uncertainty of the heat transfer rate in the cooling mode ( Q ˙ C , L ), the heat transfer rate in the heating mode ( Q ˙ H , L ), the COP in cooling mode ( C O P C ), and the COP in heating mode ( C O P H ) for GSHP were ± 4.669 W, ± 7.492 W, ± 0.115, and ± 0.162, respectively. The overall uncertainty of the heat transfer rate in the cooling mode ( Q ˙ C , L ), the heat transfer rate in the heating mode ( Q ˙ H , L ), the COP in cooling mode ( C O P C ), and the COP in heating mode ( C O P H ) for SWSHP were ± 5.134 W, ± 1.285 W, ± 0.148, and ± 0.026, respectively.

3. Results and Discussion

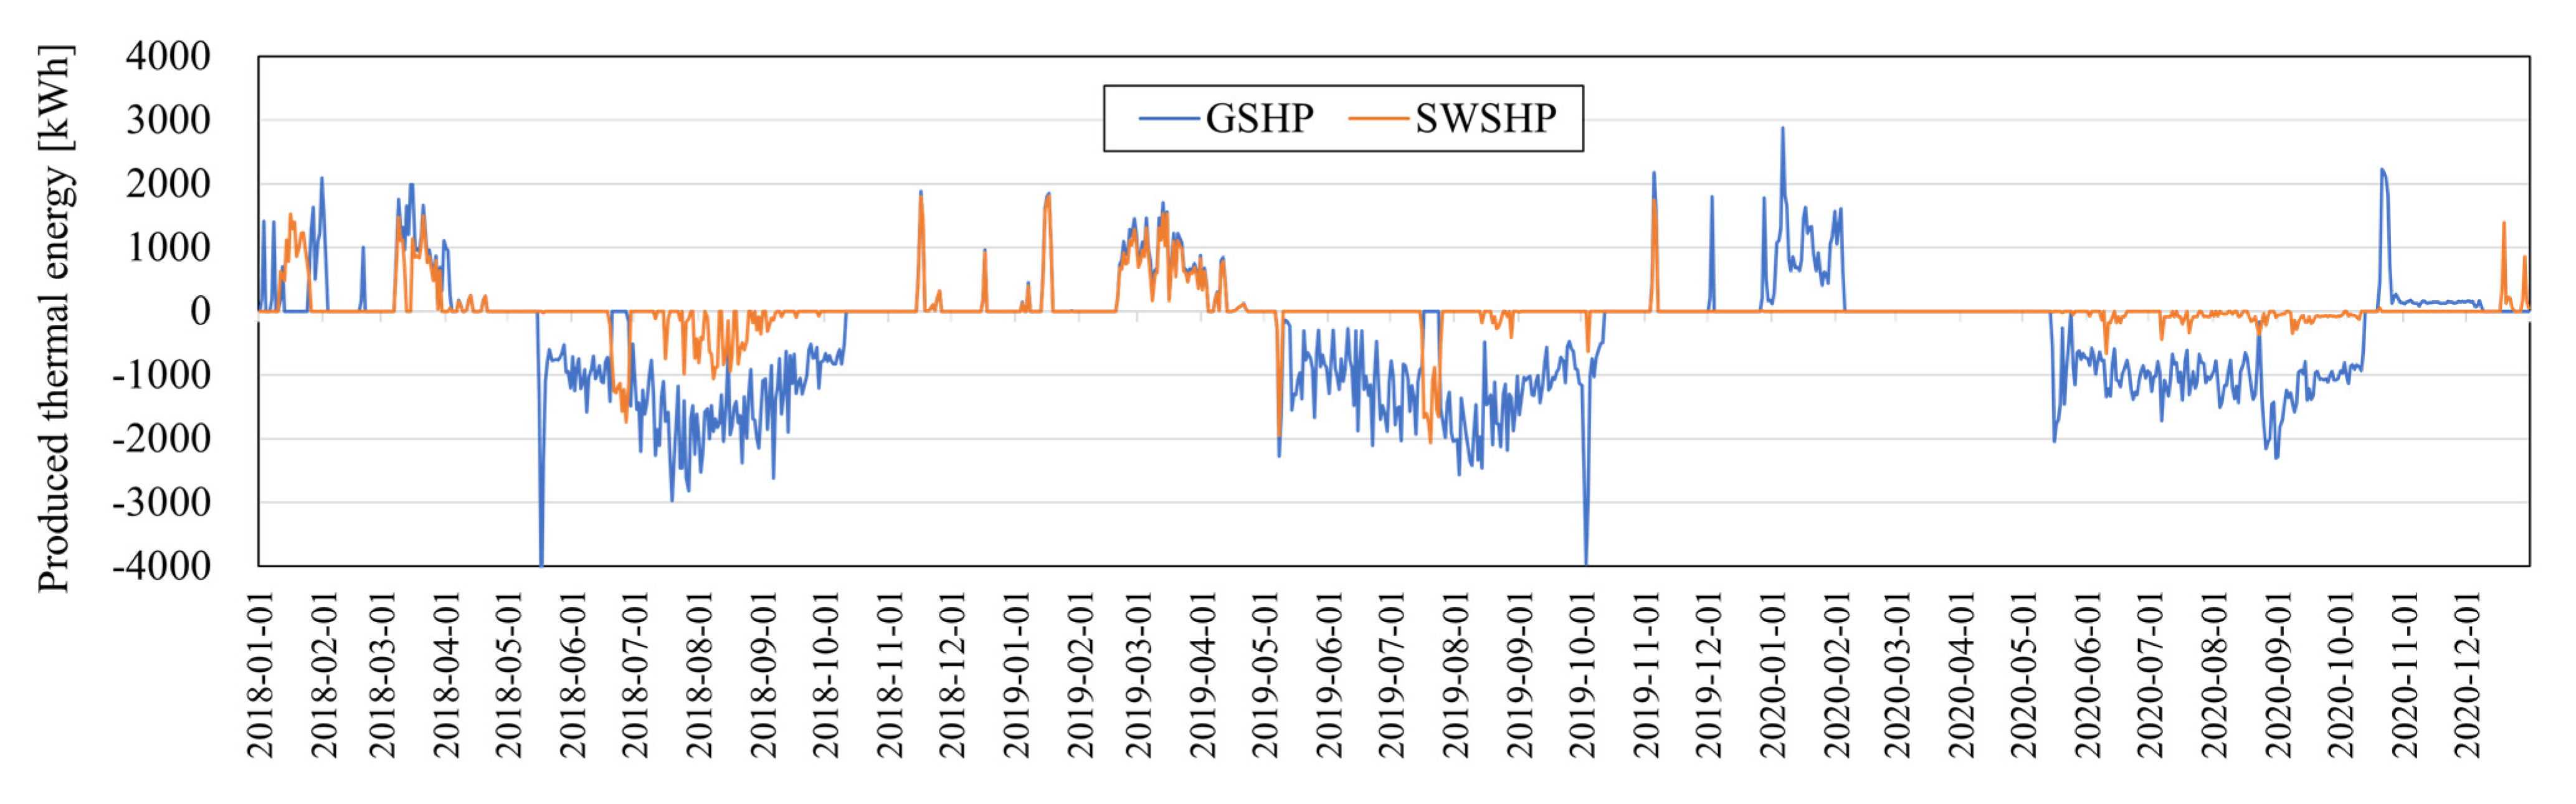
3.1. Thermal Loads during the Test

As shown in Figure 5, during the heating and cooling seasons, the total heating load of the town was 1386.2 MWh, and the cooling load was 596.3 MWh. With the GSHP, 161.0 MWh of heating energy was produced during the heating period, which accounted for 11.6% of the total heating load. With the SWSHP, 89.4 MWh of heating energy was produced, accounting for 6.4% of the total heating load. During the cooling season, the GSHP produced cooling energy of 538.1 MWh, accounting for 90.2% of the cooling load. With the SWSHP, 58.2 MWh of cooling energy was produced, accounting for 9.8% of the cooling load.

3.2. Operation Results of the Heat Pump Systems

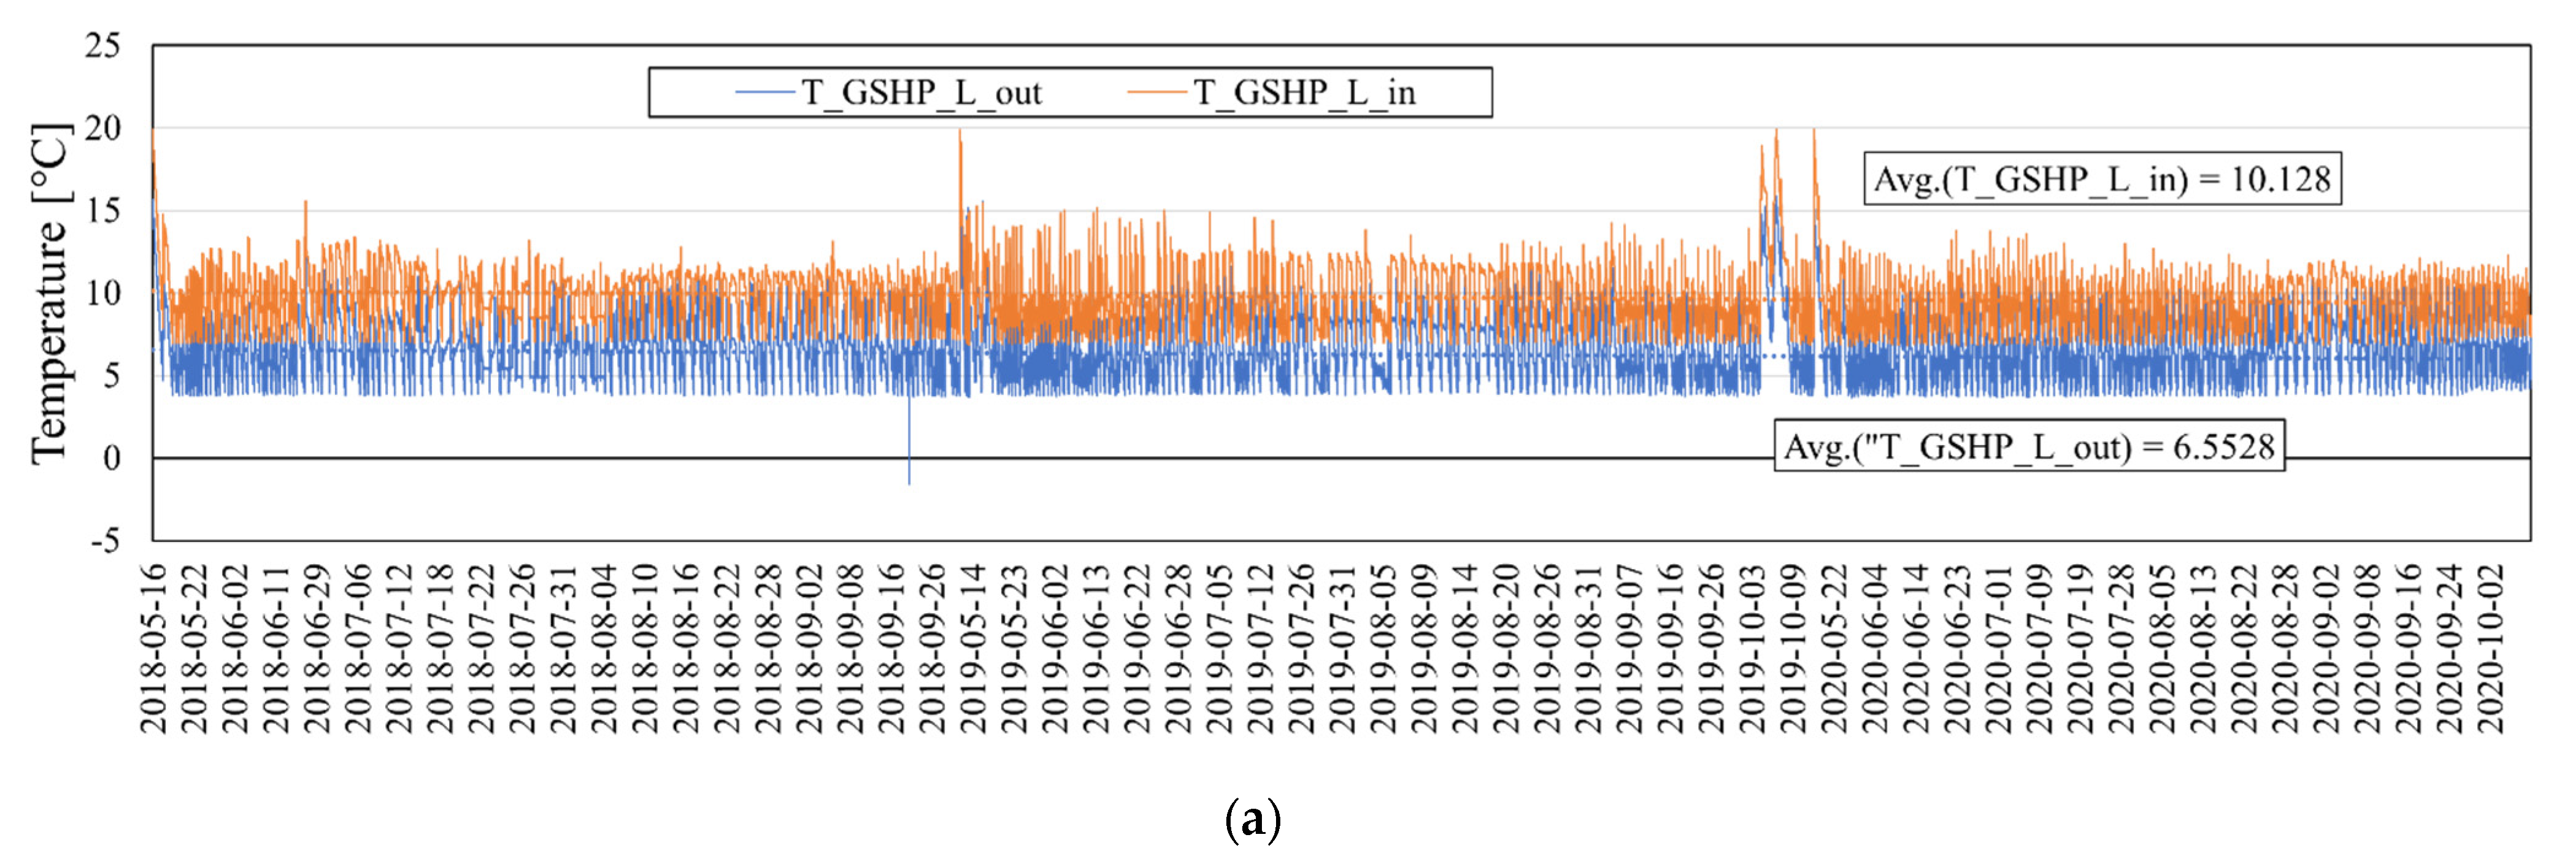
3.2.1. Comparison of GSHP and WSHP during Cooling Seasons

In this section, the performance of the GSHP and SWSHP during the cooling season is comparatively analyzed. Figure 6 is a graph showing the data measured in units of 30 s for the source side and load side temperatures during the time when the GSHP and WSHP were operating to produce cooling energy at a 5 min interval average value.
As shown in Figure 6a,c, the average cooling energy temperature produced by approximately 10 °C cooling water flowing into the HP inlet is almost similar to 6.6 °C and 6.4 °C, for the GSHP and SWSHP, respectively. In Figure 2, the GSHP and SWSHP are connected in series. Therefore, when both HPs are operating simultaneously, the temperature of the GSHP is generally lower. However, in the analysis of the three-year operation, this aspect was not considered because the time of the concurrent operation of the two HPs was insignificant.
As shown in Figure 6b, the average inlet temperature on the source side of the GSHP was 27.8 °C, and the outlet temperature was 31.1 °C. In Figure 6d, the average inlet temperature on the source side of the SWSHP was 28.4 °C, and the outlet temperature was 31.7 °C. Thus, it was confirmed that no significant difference existed in the source side temperature between the GSHP and SWSHP during the summer season.
However, as shown in Figure 6b, the source side temperature of the GSHP does not exhibit a significant difference even through the annual operation. Conversely, in Figure 6d, it can be clearly observed that the source side temperature of the SWSHP exhibits a clear increasing pattern annually. The results confirmed that the source side temperature increased with an increasing operating time because of the decrease in heat exchange efficiency from the fouling of the heat exchanger.
The operational data between July 2018–July 2019 and August 2019–October 2020 show a distinct difference. As described in Figure 3a, the location of the source side heat exchanger of the SWSHP was changed to the sump and machine room in periods A and B, respectively, and the operation continued. As a result, more fouling occurred when the source side heat exchanger was located on the machine room side than when it was located in the sump. When the heat exchanger was placed in the machine room, fouling occurred even in the pipe from the sump to the machine room, which greatly reduced the efficiency of the heat exchanger; this confirmed that the proper operation of the heat exchanger was difficult.
Figure 7 shows the operating performance of the GSHP and SWSHP during the cooling period. The results in Figure 7a show that the COP was approximately 2.9 during the cooling season in 2018 for the operation of the SWSHP, but the COP of the SWSHP decreased to 2.0, during 2019 and 2020. This is because, as discussed above, the efficiency of the heat exchanger was continuously degraded because of the fouling of the heat exchanger; additionally, more fouling occurred during operation according to the change in the position of the heat exchanger, leading to a gradual increase in temperature on the source side of the SWSHP passing through the heat exchanger. The heat exchanger has been cleaned annually because of fouling in the heat exchanger of the SWSHP; nevertheless, fouling on the heat exchanger side has been a continuous problem. At present, the position of the heat exchanger has been changed to be located in the sump again, as in period A. On the other hand, as shown in Figure 7b, during the cooling period, the GSHP showed a consistent cooling performance with the COP at 4.2 in 2018, 4.1 in 2019, and 4.1 in 2020, and without a significant reduction in the HP performance.

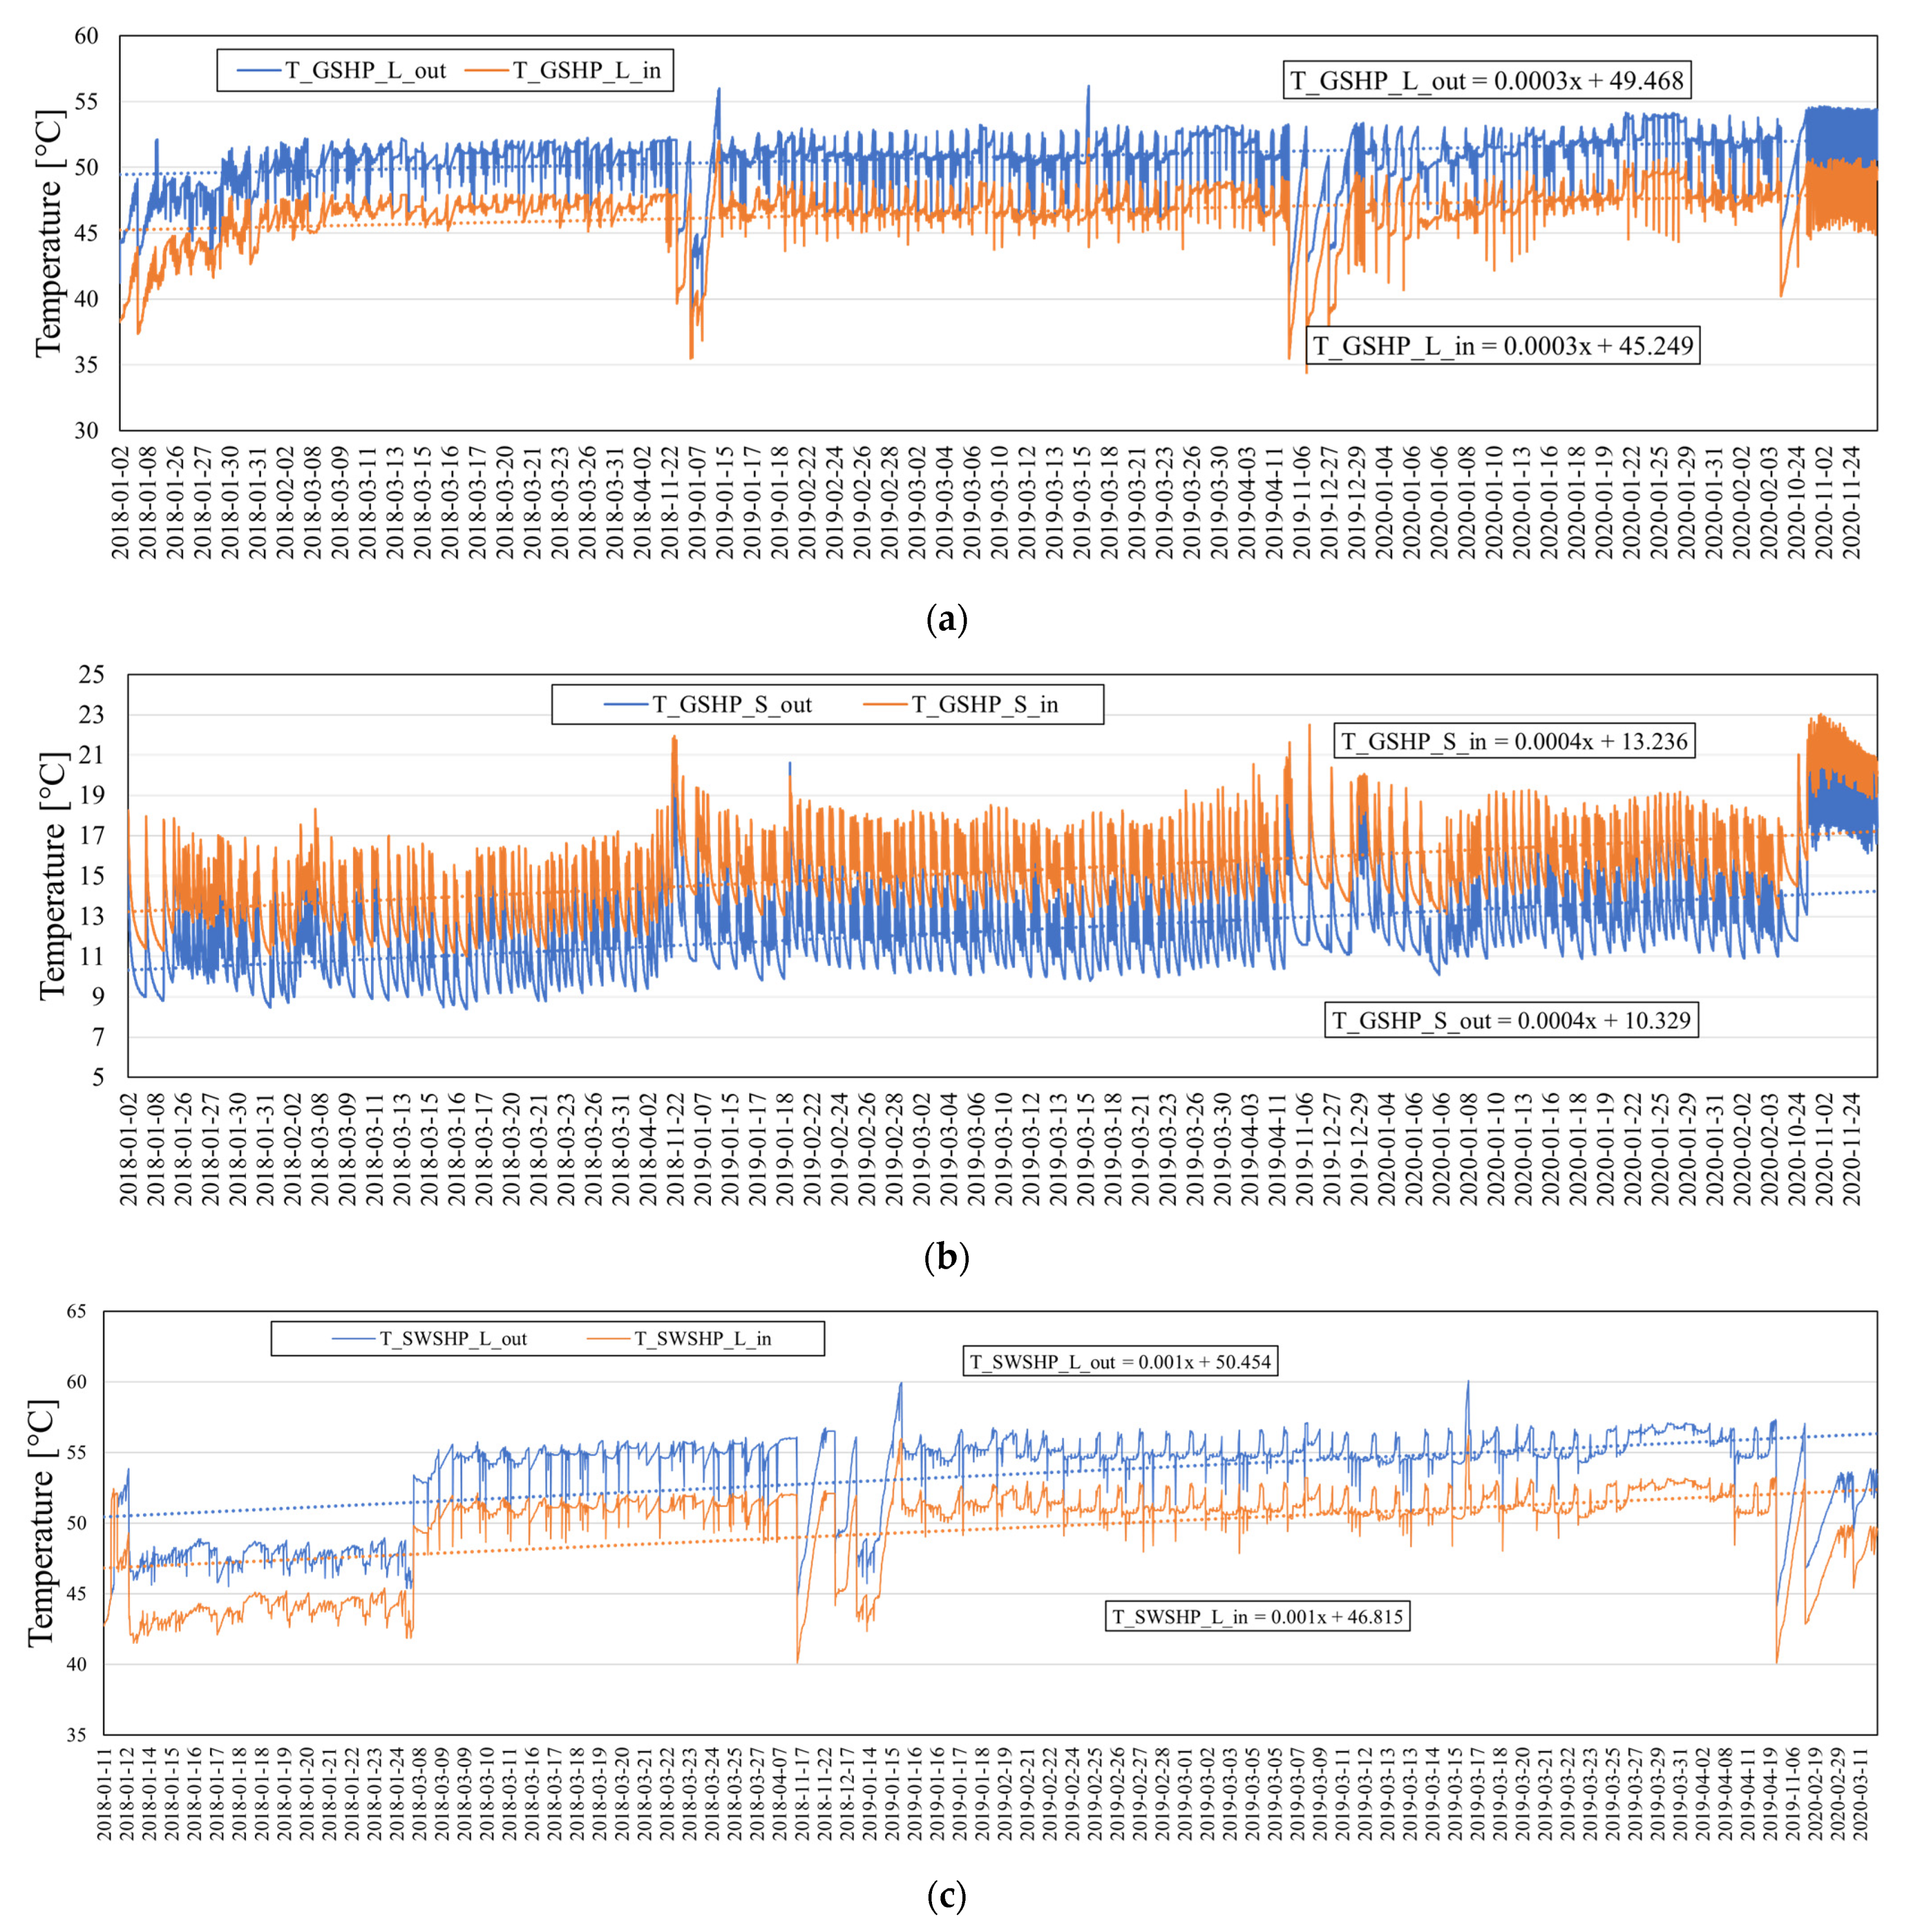
3.2.2. Comparison of GSHP and WSHP during Heating Seasons

The load side production temperatures of the GSHP and SWSHP are presented in Figure 8a,c. Similar to that in Figure 2, the temperature difference between the upper and lower parts must be large in order to increase the amount of heat stored in the TES. To this end, the HPs were operated in series during the heating season for many hours. Therefore, through the operation of the GSHP, hot water of approximately 45 °C passed through the GSHP to produce hot water of approximately 50 °C, whereas passing through the SWSHP, hot water of approximately 55 °C was used for heating the building. In this case, considering the source side temperature of each HP, it can be seen that, with a longer operation of the GSHP in winter, the temperature of the ground surface increased (Figure 8b). This is considered to be because the period of operating the GSHP in the cooling mode in summer was longer than that of winter. In addition, the source side temperature of the SWSHP increased continuously. The reason for the smaller decrease in the efficiency of the SWSHP in winter than in summer is that the operation of the heat exchanger was relatively smooth as a result of cleaning the heat exchanger for fouling before the winter operation. In addition, in sewage water treatment facilities, the greater the volume of water used in adjacent buildings, the greater the discharged water volume will be. One of the reasons for this is the increase in the number of new buildings in the surrounding area and the increase in the number of residents from 2018 to 2020.
After comparing the average heat source temperature, the results showed that the heat source temperature of the GSHP was 1–2 °C higher than that of the SWSHP. However, the winter temperature did not drop below 10 °C, even on the source side of the SWSHP.
Figure 9 shows the operating performance of the GSHP and SWSHP during the heating season. In Figure 9c, the performance of the HP was compared when the serial operation was performed simultaneously. As a result, as shown in Figure 9a, the SWSHP was operated with a COP of approximately 3.4 in 2018, 3.3 in 2019, and 3.5 in 2020 during the heating period; the trend of a lower COP in the winter operation than the summer operation was not significant. However, due to time delays, such as cleaning because of fouling in the heat exchanger, the operation time was shorter in 2019 and especially in 2020, compared with that of 2018.
As shown in Figure 9b, during the heating season, the GSHP obtained a COP value of 3.6 in 2018, 3.6 in 2019, and 3.7 in 2020; this demonstrates a uniform and consistent heating mode performance without a significant performance degradation of the HP. As a result, as shown in Figure 9c, when the GSHP and SWSHP were operated in series concurrently, the result of the comparative analysis of performance confirmed that the COP of the GSHP was maintained as higher than that of the SWSHP. Nevertheless, the difference in the COP was approximately 0.2–0.3, showing a difference of less than 10%. It can be seen that this is because the heat source temperatures of the two HPs were utilized at a similar level.

3.3. Heat Pump Models

In order to acquire a model that allows for the prediction of the operation of a HP, we performed statistical analysis based on the measured data. As described above, in each dataset, temperature, flow, and power generation data were measured at 30 s intervals, and the dataset was derived by calculating the 5 min average value. Statistical analysis was performed using Design-Expert software [15]. From the data from the operation of the HPs, we used the data under the stabilized operating conditions, excluding the data from the start and end of the operation. For data analysis, the blank spreadsheet design method was used for historical data analysis using Design-Expert software [15]. In this case, the response surface method was used, and the model was derived using analysis of variance (ANOVA). Among the various formulas for deriving a model using ANOVA, linear regression was used to derive the variables of the HP model. From the derived model and variables, a p-value that is less than 0.05 indicates a high significance; also, the closer the R2-value is to 100%, the smaller the difference between the predicted value and the actual value of the model will be. The operating ranges of the variables used in the dataset are shown in Table 4. Table 5 outlines the coefficients of the HP model.
Figure 10 shows the R2-value of each model. The closer the R2 of the derived model is to 1 (100%), the higher the validity of the model will be. It was confirmed that all eight models showed a high significance with a p-value < 0.0001. In addition, most of the models showed an R2-value larger than 89%. Among the models, the model representing the heat production rate during the heating mode operation of the GSHP, and the model representing the heat production rate during the heating mode operation of the SWSHP, showed lower R2-values. In the case of the GSHP, the size of the data used for deriving the model was 11,358 (approximately 56,790 min operation time). Thus, the model was derived based on the operation result of the longest period from all of the operations of the HPs, which led to a low value of R2. In the case of the SWSHP, the size of the data used for deriving the model was 361 (approximately 1805 min operation time). Hence, the validity of the model is relatively small because of the quite short operation time.

3.4. Discussion

In the case of the GSHP, the imbalance of the underground temperature due to its operation mainly in the cooling mode was expected to raise problems [16], such as a soil temperature increase or decrease and HP performance deterioration. Nevertheless, the three-year operation result showed that this type of problem was not significant. Although a difference exists in the annual production balance between the cooling and heating energies, as shown in Figure 7b, the underground characteristics of this experimental site show a rapid heat loss in order to maintain the underground temperature at a constant level; moreover, the efficiency of the cooling HP was adequate. Meanwhile, in the heating mode operation of the GSHP, it is expected that the COP of the HP may increase as the underground temperature increases annually. However, as these problems can be greatly dependent on underground characteristics, further investigation is required. In addition, the underground temperature in the summer season did not show a continuous rise, as in the case of winter. Thus, we cannot eliminate the possibility that the heat that should have been stored underground has flowed into the surrounding rivers due to rainwater during the summer rainy season, helping to maintain the underground temperature.
In the case of the SWSHP, efficiency degradation due to fouling of the source side emerged as the major problem [17]. Only a few studies have investigated the impact of fouling on the HP performance both theoretically and experimentally [18,19]. By contrast, this study investigated the HP system level performance degradation and retrofitting impact. The results confirmed that, through periodic cleaning and change in heat exchangers, unused heat sources in the sewage water treatment facilities can be utilized as good heat sources for the HP.
The balance between the heating and cooling production of GSHP and SWSHP was insignificant. However, the COP decreased as fouling of the source side heat exchanger was confirmed to be a major problem. During the cooling mode operation in summer, the SWSHP showed a relatively low COP compared with that of the GSHP, and difficulties existed in operation because of the efficiency decrease due to fouling. However, in winter, when fouling was managed by cleaning, the COP of the SWSHP was shown to be similar to that of the GSHP; this confirms the high potential applicability of unused energy sources, such as sewage water for HPs.
The model proposed in this study is a significant contribution to the literature because it is a model derived using long-term field operation data rather than being a model for predicting performance under various temperature and flow conditions on a theoretical scale. The operation results of the HPs were mainly obtained under full-load conditions rather than part-load conditions, indicating the limitation of this model. However, as reported in previous studies [20], the HP performance prediction model derived from lab-scale experiments is clearly different from that derived from actual on-site field operation data. Thus, a HP performance prediction model based on on-site field operation data is crucial. By deriving a model using the data measured by the curve fitting model used in the EnergyPlus software, it was confirmed that the R2-value was ≥89% in the developed model, except for the heating mode operation of the GSHP and heating mode of the SWSHP. The HP performance prediction model based on on-site field operation data is considered to serve as a reference point for engineers who need a performance evaluation under field operations.
From an economic point of view, the capital cost of the GSHP is more than three times higher than that of the conventional air-source HP [21]. On the other hand, the capital cost of the SWSHP is more than 65% higher than that of the conventional HP [22]. The installation and drilling of the ground for the ground source heat exchanger causes a difference in the cost. However, the GSHP operation during the three-year tests suggests that the GSHP can save significant operating energy compared with that of the SWSHP because of the maintenance needed to avoid fouling and a higher COP of the SWSHP.

4. Conclusions and Future Work

In this study, results from a long-term (2018 to 2020) experimental investigation for a block heating and cooling network-based GSHP and SWSHP were analyzed. The HP performance, source side temperature of the sewage water source and ground source, and COP were also analyzed. Additionally, an HP model that can be used for future designs was derived. After examining the GSHP and SWSHP in terms of operation for the annual heating and cooling load, the results showed that more operations were performed in the cooling mode than in the heating mode. The underground temperature of the GSHP during the summer season was approximately 27.8 °C, and did not show a significant change during the three years of operation, whereas the winter underground temperature showed a continuously increasing trend. On the other hand, the source side temperature of the SWSHP gradually increased and decreased during the cooling and heating seasons, respectively. The fouling of the sewage water heat exchanger mainly caused the source temperature degradation. The COP of the GSHP was approximately 4.1, and that of the SWSHP was approximately 2.9 during the cooling season. The COP of the GSHP and SWSHP during the heating season was approximately 3.6 and 3.4, respectively. The efficiency of the SWSHP can be increased by reducing fouling. In order to obtain performance prediction models for the GSHP and SWSHP, curve fitting was used. The derived prediction model serves as a good reference for engineers that require information on the performance of the field operation. The limitation of the proposed model is that it is not intended for predicting the performance under various temperature and flow conditions on a theoretical scale. The operation results of the HPs were mainly obtained from operations under full-load conditions rather than part-load conditions, indicating the limitation of this model. However, as reported in previous studies [20], the heat pump performance prediction model derived from lab-scale experiments is clearly different from actual on-site field operation data. Therefore, a heat pump performance prediction model based on on-site field operation data should be developed.
Based on the findings of this study, in future research, we aim to analyze various operating characteristics of the GSHP and the long-term operation characteristics of the ground heat exchanger according to various underground characteristics and climatic conditions. The tube-shell exchanger with the sewage volume and place should be considered for the SWSHP in future work. In addition, low-global-warming-potential refrigerants should be considered because of the ongoing climate crisis.

Author Contributions

Writing—original draft preparation, M.-H.K.; methodology and software, D.-W.K. and G.H.; writing—review and editing, J.H.; supervision and project administration, D.-W.L. All authors have read and agreed to the published version of the manuscript.

Funding

This research was funded by the Energy Technology Development Program of the Korea Institute of Energy Technology Evaluation and Planning (No. 2018201060010A).

Institutional Review Board Statement

Not applicable.

Informed Consent Statement

Not applicable.

Conflicts of Interest

The authors declare no conflict of interest.

References

  1. Hepbasli, A.; Biyik, E.; Ekren, O.; Gunerhan, H.; Araz, M. A Key Review of Wastewater Source Heat Pump (WWSHP) Systems. Energy Convers. Manag. 2014, 88, 700–722. [Google Scholar] [CrossRef]
  2. Gu, Y.; Li, Y.; Li, X.; Luo, P.; Wang, H.; Robinson, Z.P.; Wang, X.; Wu, J.; Li, F. The Feasibility and Challenges of Energy Self-Sufficient Wastewater Treatment Plants. Appl. Energy 2017, 204, 1463–1475. [Google Scholar] [CrossRef] [Green Version]
  3. Culha, O.; Gunerhan, H.; Biyik, E.; Ekren, O.; Hepbasli, A. Heat Exchanger Applications in Wastewater Source Heat Pumps for Buildings: A Key Review. Energy Build. 2015, 104, 215–232. [Google Scholar] [CrossRef]
  4. Mazhar, A.R.; Liu, S.; Shukla, A. A State of Art Review on the District Heating Systems. Renew. Sustain. Energy Rev. 2018, 96, 420–439. [Google Scholar] [CrossRef]
  5. Kuster, R.R.; Prinzing, M.; Matthias, B.; Eschmann, M.; Bertsch, S.S. Field Performance Of Domestic Heat Pumps For Heating And Hot Field Performance Of Domestic Heat Pumps For Heating And Hot Water In Switzerland Part I: Technology, Methods And State Of The Art Of The Field Studies. In Proceedings of the International Refrigeration and Air Conditioning Conference, West Lafayette, IN, USA, 24–28 May 2021; p. 2083. [Google Scholar]
  6. Cho, Y.; Yun, R. A Raw Water Source Heat Pump Air-Conditioning System. Energy Build. 2011, 43, 3068–3073. [Google Scholar] [CrossRef]
  7. Qin, N.; Hao, P.Z. The Operation Characteristics of Sewage Source Heat Pump System and the Analysis of Its Thermal Economic Benefits. Appl. Therm. Eng. 2017, 124, 1083–1089. [Google Scholar] [CrossRef]
  8. Shen, C.; Yang, L.; Wang, X.; Jiang, Y.; Yao, Y. An Experimental and Numerical Study of a De-Fouling Evaporator Used in a Wastewater Source Heat Pump. Appl. Therm. Eng. 2014, 70, 501–509. [Google Scholar] [CrossRef]
  9. Shen, C.; Lei, Z.; Lv, G.; Ni, L.; Deng, S. Experimental Performance Evaluation of a Novel Anti-Fouling Wastewater Source Heat Pump System with a Wastewater Tower. Appl. Energy 2019, 236, 690–699. [Google Scholar] [CrossRef]
  10. Ni, L.; Tian, J.; Shen, C.; Zhao, J. Experimental Study of the Separation Performance of a Novel Sewage Hydrocyclone Used in Sewage Source Heat Pump. Appl. Therm. Eng. 2016, 106, 1300–1310. [Google Scholar] [CrossRef]
  11. Zhang, Q.; Zhang, X.; Yin, C.; Liu, F.; Wang, G. Experimental Evaluation of Heat Transfer Performance of Falling Film Evaporator for Wastewater Source Heat Pump with Backwash System. Int. J. Refrig. 2020, 113, 80–93. [Google Scholar] [CrossRef]
  12. Kim, D.; Lee, D.; Heo, J.; Kim, M. Empirical Results and Operational Cost Analysis of Geothermal Heat Pump System Using Thermal Energy Storage in Cooling Season. Korean J. Air-Cond. Refrig. Eng. 2018, 30, 167–174. [Google Scholar] [CrossRef]
  13. EnergyPlus Development Team. EnergyPlus Version 9.2 Engineering Reference: The Reference to EnergyPlus; EnergyPlus Development Team: Washington, DC, USA, 2019. [Google Scholar]
  14. Taylor, B.N.; Kuyatt, C.E. Guidelines for Evaluating and Expressing the Uncertainty of NIST Measurement Results—1994 Edition; National Institute of Standards and Technology: Gaithersburg, MA, USA, 1994. [Google Scholar]
  15. Stat-Ease, Inc. Design-Expert 2021. Available online: www.statease.com (accessed on 9 August 2021).
  16. You, T.; Wu, W.; Shi, W.; Wang, B.; Li, X. An Overview of the Problems and Solutions of Soil Thermal Imbalance of Ground-Coupled Heat Pumps in Cold Regions. Appl. Energy 2016, 177, 515–536. [Google Scholar] [CrossRef]
  17. Bai, X.; Luo, T.; Cheng, K.; Chai, F. Experimental Study on Fouling in the Heat Exchangers of Surface Water Heat Pumps. Appl. Therm. Eng. 2014, 70, 892–895. [Google Scholar] [CrossRef]
  18. Zubair, S.M.; Sheikh, A.K.; Younas, M.; Budair, M.O. A Risk Based Heat Exchanger Analysis Subject to Fouling: Part I: Performance Evaluation. Energy 2000, 25, 427–443. [Google Scholar] [CrossRef]
  19. Lalot, S.; Lecoeuche, S. Online Fouling Detection in Electrical Circulation Heaters Using Neural Networks. Int. J. Heat Mass Transf. 2003, 46, 2445–2457. [Google Scholar] [CrossRef]
  20. Zhang, B.; You, S.; Wang, S.; Ding, X.; Wang, C.; Gao, Y. From Laboratory to On-Site Operation: Reevaluation of Empirically Based Electric Water Chiller Models. Build. Simul. 2021. [Google Scholar] [CrossRef]
  21. Lu, Q.; Narsilio, G.A.; Aditya, G.R.; Johnston, I.W. Economic Analysis of Vertical Ground Source Heat Pump Systems in Melbourne. Energy 2017, 125, 107–117. [Google Scholar] [CrossRef]
  22. Jung, Y.; Kim, J.; Kim, H.; Yun, R.; Park, C.; Nam, Y.; Cho, H.; Lee, H. Comprehensive Feasibility Investigation of River Source Heat Pump Systems in Terms of Life Cycle. Appl. Therm. Eng. 2021, 188, 116655. [Google Scholar] [CrossRef]
Figure 1. Overview of Jincheon eco-friendly energy town: (a) systems and building locations; (b) schematic of hybrid renewable energy systems configuration; and (c) front view of the town.
Energies 14 05640 g001
Figure 2. System configuration of the ground source and sewage water source heat pump.
Energies 14 05640 g002
Figure 3. Details of ground source and sewage water source components: (a) location and configuration of the system; (b) picture of heat pumps.
Energies 14 05640 g003aEnergies 14 05640 g003b
Figure 4. Outdoor air conditions during the test periods: (a) outdoor air temperature; (b) horizontal solar irradiation.
Energies 14 05640 g004
Figure 5. Daily thermal production rate of the heat pumps.
Energies 14 05640 g005
Figure 6. Thermal performance of the heat pump systems under the cooling season: (a) load side operation of GSHP; (b) source side operation of GSHP; (c) load side operation of SWSHP; and (d) source side operation of SWSHP.
Energies 14 05640 g006aEnergies 14 05640 g006b
Figure 7. Operation results of the heat pump systems under the cooling season: (a) operation of GSHP; (b) operation of SWSH.
Energies 14 05640 g007
Figure 8. Operation results of the heat pump systems during the heating season: (a) load side operation of GSHP; (b) source side operation of GSHP; (c) load side operation of WSHP; and (d) source side operation of WSHP.
Energies 14 05640 g008aEnergies 14 05640 g008b
Figure 9. Operation results of the heat pump systems during the heating season: (a) operation of SWSHP; (b) operation of GSHP; and (c) simultaneous operation results of GSHP and SWSHP in series.
Energies 14 05640 g009aEnergies 14 05640 g009b
Figure 10. Comparison of the predicted model with experimental results: (a) GSHP cooling mode operation model; (b) GSHP heating mode operation model; (c) SWSHP cooling mode operation model; and (d) SWSHP heating mode operation model.
Energies 14 05640 g010aEnergies 14 05640 g010b
Table 1. Specification of components of the hybrid renewable energy systems.
CategorySpecification
Solar thermal collectorFlat plate type: 399 EA (798 m2)
Evacuated tube type: 198 EA (808 m2)
Heat pumpsSeasonal thermal energy storage source heat pump (STHP): 181 kW (R134a)
Ground source heat pump (GSHP): 175 kW (R410a)
Sewage water source heat pump (SWSHP): 181 kW (R134a)
Seasonal thermal energy storageDouble wall structure, stainless lining
4000 m3 (24.7 m × 16.7 m × 10.3 m)
Night-time thermal energy storageConcrete wall, 200 m3
Ground source heat exchangerHDPE pipe (30 A, SDR-11)
U-Bend 30 A
Grout: volclay
Casing: 150 A
150 m depth × 24 holes
Table 2. Specification of the measurement sensors.
CategoryModelSpecificationQuantity
Temperature
(T)
RTD PT100 transmitter−10–100 °C
Accuracy ± 0.106 °C
Resolution 0.001 °C
57
RTD 3 wire11
RTD pt10005
PressureSensys PSCH0006K0–6 bar
Accuracy ± 0.25% FS
21
Solar irradiationKippen & ZonenCMP11
Accuracy 0.2% (1000 W/m2)
2
Flow
( V ˙ )
Toshiba LF620Accuracy
Vs > 0.5 m/s ± 0.3% of rate
Vs < 0.5 m/s ± 0.4% of rate
17
Outdoor air temperatureGOTH-1420/PT1000−36~80 °C
±(0.2~0.4) °C @25 °C
1
Table 3. Reference conditions of the heat pumps provided by the manufacturer.
CategoryParametersValues
Ground source heat pump
(GSHP)
Q ˙ G S H P , C , r e f 175,436 W
Q ˙ G S H P , H , r e f 177,980 W
V ˙ G S H P , L , r e f 580 LPM
V ˙ G S H P , S , r e f 580 LPM
W G S H P , C , r e f 37,469 W
W G S H P , H , r e f 47,733 W
Sewage water source heat pump (SWSHP) Q ˙ S W S H P , C , r e f 141,000 W
Q ˙ S W S H P , H , r e f 186,900 W
V ˙ S W S H P , L , r e f 580 LPM
V ˙ S W S H P , S , r e f 580 LPM
W S W S H P , C , r e f 29,800 W
W S W S H P , H , r e f 53,900 W
Table 4. Variation range of the measurement sensors and data.
GSHP for Cooling
T L , i n ( T H 8 )
[°C]
T S , i n ( T H 12 )
[°C]
V ˙ L ( F H 3 )
[LPM]
V ˙ S ( F H 2 )
[LPM]
Q ˙ G S H P , C
[kW]
W G S H P , C
[kW]
Dataset
7.0–18.526.7–35.5617.3–658.1704.6–891.0140.0–198.940.0–44.55092
GSHP for Heating
T L , i n ( T H 8 )
[°C]
T S , i n ( T H 12 )
[°C]
V ˙ L ( F H 3 )
[LPM]
V ˙ S ( F H 2 )
[LPM]
Q ˙ G S H P , H
[kW]
W G S H P , H
[kW]
Dataset
26.7–46.87.1–18.5514.4–704.6693.0–879.4177.3–245.142.2–60.511,358
SWSHP for Cooling
T L , i n ( T H 10 )
[°C]
T S , i n ( T H 12 )
[°C]
V ˙ L ( F H 3 )
[LPM]
V ˙ S ( F H 4 )
[LPM]
Q ˙ S W S H P , C
[kW]
W S W S H P , C
[kW]
Dataset
5.84–12.824.2–38.3611.5–663.9555.6–733.872.47–131.925.68–45.835897
SWSHP for Heating
T L , i n ( T H 10 )
[°C]
T S , i n ( T H 12 )
[°C]
V ˙ L ( F H 3 )
[LPM]
V ˙ S ( F H 4 )
[LPM]
Q ˙ S W S H P , H
[kW]
W S W S H P , H
[kW]
Dataset
49.6–52.59.8–12.8663.9–669.7578.7–582.4162.3–170.549.5–52.6361
Table 5. Heat pump model coefficients.
a 1 a 2 a 3 a 4 a 5
−1.26713+6.37042−3.53001−0.336208−0.030342
b 1 b 2 b 3 b 4 b 5
−0.359476−2.79622+4.49128+0.007381+0.053795
c 1 c 2 c 3 c 4 c 5
−4.92172+9.04453−4.52053+0.995621+0.344876
d 1 d 2 d 3 d 4 d 5
−3.03365+0.272381+2.44377+1.01202+0.001317
e 1 e 2 e 3 e 4 e 5
−5.62857+1.36093+4.99586−0.001842−0.014707
f 1 f 2 f 3 f 4 f 5
−5.45878+5.31541+0.764227−0.062415+0.001011
g 1 g 2 g 3 g 4 g 5
−12.05627+3.91437+11.30657−2.45730−0.015136
h 1 h 2 h 3 h 4 h 5
−5.69276+5.17011+1.20514−0.136563−0.325128
Publisher’s Note: MDPI stays neutral with regard to jurisdictional claims in published maps and institutional affiliations.

