
Research on Exhaust Emissions in Dynamic Operating States of a Combustion Engine in a Real Driving Emissions Test


Abstract
:1. Introduction
- environmental criteria (exhaust emissions),
- economy criteria (overall engine efficiency and, as a consequence, fuel consumption),
- energy criteria (usable power),
- dynamics criteria (acceleration).
- slow-varying processes,
- processes related to the engine operation,
- fast-varying processes.
2. Aim, Object, Program of Investigations, and Research Equipment
- vehicle velocity,
- intensity of the flow of fuel consumed by the engine,
- exhaust emissions concentration: carbon monoxide, hydrocarbons, nitrogen oxides, and carbon dioxide,
- intensity of the particle number
- the Flame Ionization Detector (FID) for the measurement of the concentration of hydrocarbons,
- the Non-Dispersive Ultraviolet (NDUV) analyzer utilizing ultraviolet radiation for the measurement of the concentration of nitrogen monoxide and nitrogen dioxide,
- the Non-Dispersive Infrared (NDIR) analyzer utilizing infrared radiation for the measurement of the concentration of carbon monoxide and carbon dioxide,
- the electrochemical analyzer for the measurement of the concentration of oxygen,
- a system for the measurement of the exhaust gas flow.
3. Methodology
- engine speed—n(t), characterizing the frequency of the realization of a thermal cycle,
- torque—Me(t), characterizing the engine load,
- engine thermal state—T(t), defined as a set of temperatures of the engine parts and its consumables (primarily the temperature of the lubricating oil and the coolant, if the engine is cooled indirectly).
- static model (11),
- positive acceleration model:
- negative acceleration model for:
- the exhaust emissions curves (carbon monoxide– ECO, hydrocarbons—EHC, nitrogen oxides—ENOx, and carbon dioxide– ECO2),
- the particle number intensity (EPN).
- the extreme values—Min, Max,
- the average value—AV,
- the standard deviation—D,
- the coefficient of variation—W:
- the ratio of the average value of the emission intensity or the intensity of the emission of PN in the analyzed model and the average value in the entire test—k.
4. Research Results and Discussion
5. Conclusions
- The process of vehicle velocity in the RDE test is characterized by a great deal of variability. The dynamic properties of the vehicle velocity process are similar for the negative and positive acceleration.
- Under the RDE conditions, the engine speed and torque processes are also characterized by a great deal of variability. Even more dynamic are the processes of intensity of emission of individual exhaust components and the emission intensity of particulate matter.
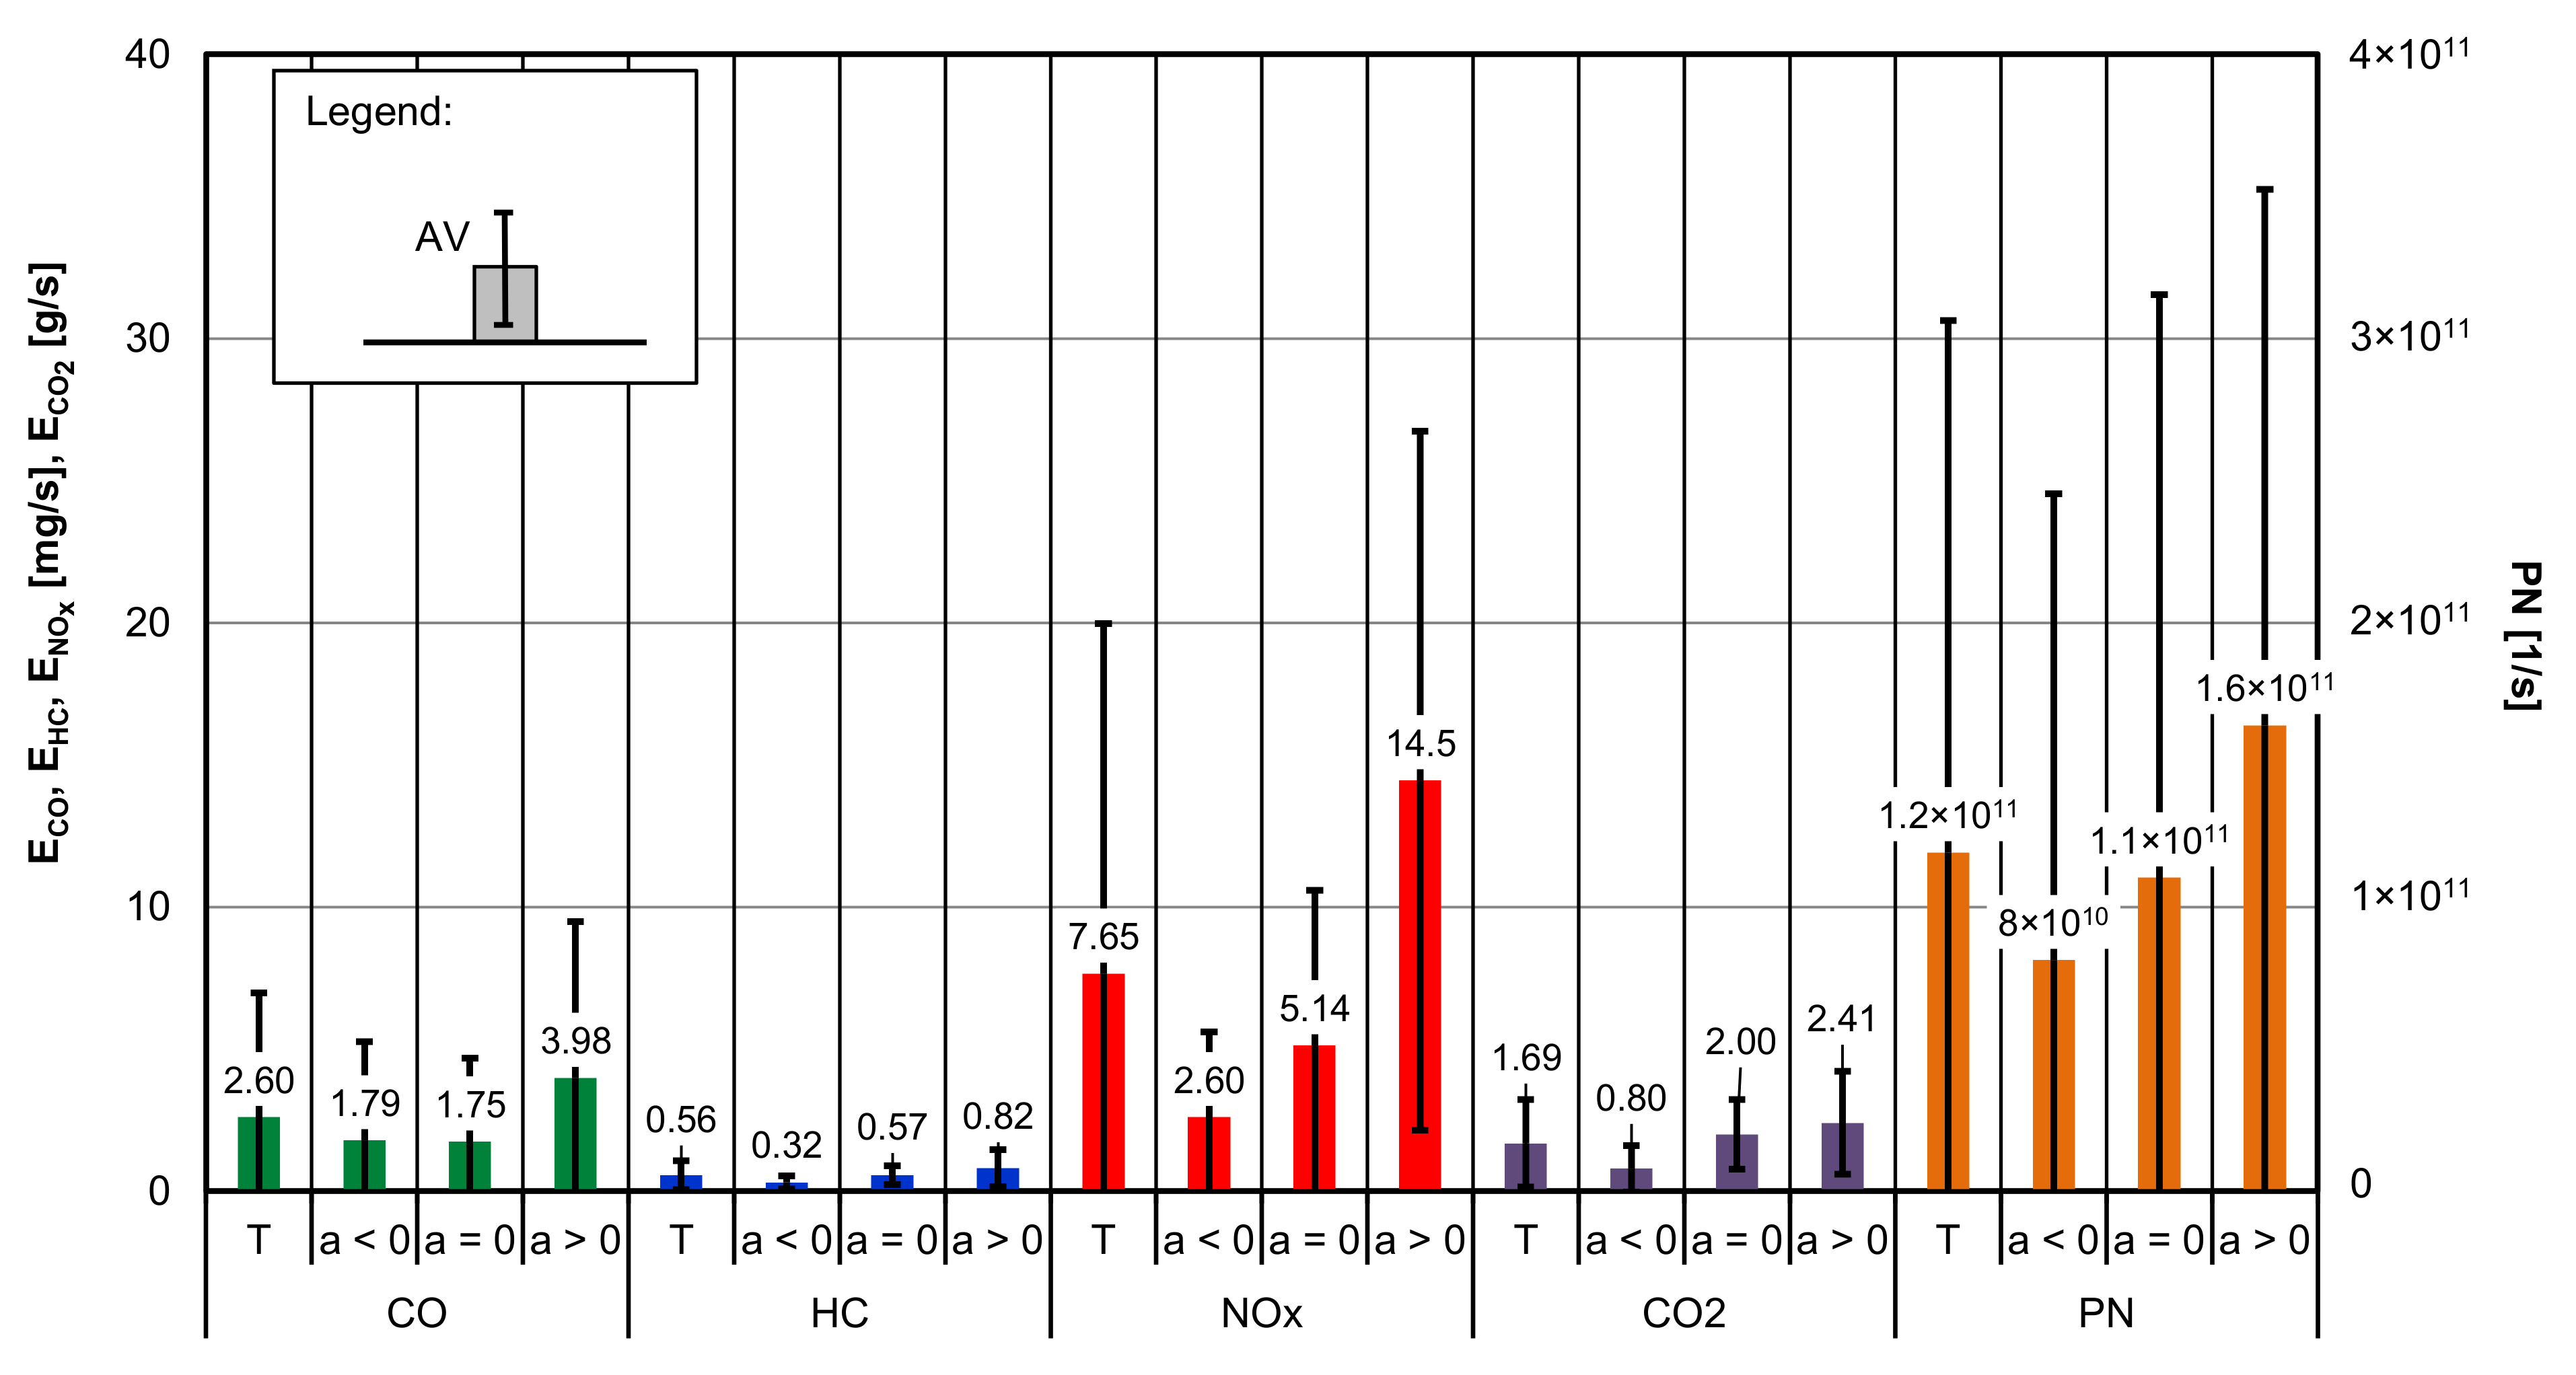
- The highest maximum value of exhaust emission intensity is for the positive acceleration except the intensity of emission of particulate matter—in this case the maximum value is for the negative acceleration.
- The average value of the emission intensity of all exhaust components and the intensity of the emission of particulate matter is the highest for the positive acceleration.
- The strongest dynamic properties have the processes of emission intensity of particulate matter and carbon monoxide in the model of negative acceleration.
- The greatest increase in the emission intensity is for nitrogen oxides in the model of positive acceleration and the smallest also for nitrogen oxides but in the model of negative acceleration.
- On average, the greatest increase in the intensity of exhaust emissions and the emission of particulate matter is for the dynamic states of the engine operation for positive acceleration.
Author Contributions
Funding
Institutional Review Board Statement
Informed Consent Statement
Conflicts of Interest
Nomenclature
| a | vehicle acceleration |
| Abs | absolute value operator |
| AV | average value |
| CO | carbon monoxide |
| CO2 | carbon dioxide |
| D | standard deviation |
| Ei | emission intensity of the “i-th” pollutant |
| EPN | particle number emission intensity |
| FID | Flame Ionization Detector |
| HC | hydrocarbons |
| k | the ratio of the average value of pollutant emission intensity or particulate number intensity in the analyzed model and the average value in the entire test |
| M | motorway |
| Max | maximum value operator |
| Me ext | engine torque at full throttle |
| Me | engine torque |
| Mer | relative engine torque |
| Min | minimum value operator |
| n | engine speed |
| NDUV | Non-Dispersive Ultraviolet |
| NEDC | New European Driving Cycle |
| NIDR | Non-Dispersive Infrared |
| NOx | nitrogen oxides |
| P | engine performance properties |
| PEMS | Portable Emissions Measurement System |
| PN | particle number |
| R | rural |
| RG | range value operator |
| RDE | Real Drive Emissions |
| S | engine states |
| T | engine thermal state |
| t, τ | time |
| U | urban |
| v | vehicle velocity |
| W | coefficient of variation |
| e | engine state qualification factor |
References
- Chłopek, Z.; Biedrzycki, J.; Lasocki, J.; Wójcik, P.; Samson-Bręk, I. Modelling of motor vehicle operation for the evaluation of pollutant emission and fuel consumption. Combust. Engines 2017, 171, 156–163. [Google Scholar] [CrossRef]
- Chłopek, Z.; Biedrzycki, J.; Lasocki, J.; Wójcik, P. Assessment of the impact of dynamic states of an internal combustion engine on its operational properties. Eksploat. Niezawodn. Maint. Reliab. 2015, 17, 35–41. [Google Scholar] [CrossRef]
- Chłopek, Z. Some remarks on engine testing in dynamic states. Silniki Spalinowe Combust. Engines 2010, 143, 60–72. [Google Scholar] [CrossRef]
- Guzzella, L.; Onder, C.H. Introduction to Modeling and Control of Internal Combustion Engine Systems; Springer: Berlin/Heidelberg, Germany, 2010. [Google Scholar] [CrossRef]
- Cox, D.R.; Hinkley, D.V. Theoretical Statistics; Chapman & Hall: London, UK, 1974. [Google Scholar]
- Chłopek, Z. Synthesis of driving cycles in accordance with the criterion of similarity of frequency characteristics. Eksploat. Niezawodn. Maint. Reliab. 2016, 18, 572–577. [Google Scholar] [CrossRef]
- Banach, S. Theory of Linear Operations; Elsevier: Amsterdam, The Netherlands, 1987. [Google Scholar]
- Commission Regulation (EU) 2016/427 of 10 March 2016 Amending Regulation (EC) No. 692/2008 as Regards Emissions from Light Passenger and Commercial Vehicles (Euro 6), Verifying Real Driving Emissions. Off. J. Eur. Union 2016, 82, 1–98. Available online: http://data.europa.eu/eli/reg/2016/427/oj (accessed on 16 January 2021).
- Commission Regulation (EU) 2016/646 of 20 April 2016 amending Regulation (EC) No. 692/2008 as Regards Emissions from Light Passenger and Commercial Vehicles (Euro 6), Verifying Real Driving Emissions. Off. J. Eur. Union 2016, 109, 1–22. Available online: http://data.europa.eu/eli/reg/2016/646/oj (accessed on 16 January 2021).
- European Commission (2017) Regulation (EC) 2017/1151 of 1 June 2017 Supplementing Regulation (EC) No. 715/2007 of the European Parliament and of the Council on Type-Approval of Motor Vehicles with Respect to Emissions from Light Passenger and Commercial Vehicles (Euro 5 and Euro 6) and on Access to Vehicle Repair and Maintenance Information, Amending Directive 2007/46/EC of the European Parliament and of the Council, Commission Regulation (EC) No. 692/2008 and Commission Regulation (EU) No. 1230/2012 and Repealing Commission Regulation (EC) No. 692/2008. Off. J. Eur. Union. 2017, 175, 1–643. Available online: http://data.europa.eu/eli/reg/2017/1151/oj (accessed on 16 January 2021).
- Worldwide Emission Standards. Passenger Cars and Light Duty Vehicles 2020/2021. In Innovation for the Real World; Delphi: London, UK, 2020. [Google Scholar]
- Merkisz, J.; Pielecha, J.; Radzimirski, S. New Trends in Emission Control in the European Union; Springer Tracts on Transportation and Traffic—STTT 4; Springer: New York, NY, USA, 2014; Volume 4. [Google Scholar]
- Merkisz, J.; Pielecha, J. Nanoparticle Emissions from Combustion Engines; Springer Tracts on Transportation and Traffic—STTT 8; Springer: New York, NY, USA, 2015; Volume 8. [Google Scholar]
- Andrych-Zalewska, M.; Chłopek, Z.; Merkisz, J.; Pielecha, J. Evaluation of the test drive cycle conditions impact on exhaust emissions from an internal combustion engine. Combust. Engines 2018, 175, 3–9. [Google Scholar] [CrossRef]
- White, L.; Miles, A.; Boocock, C.; Cooper, J.G.; Mills, S. A Comparison of Real Driving Emissions from Euro 6 Diesel Passenger Cars with Zero Emission Vehicles and Their Impact on Urban Air Quality Compliance. Urban Air Quality Study: Extension I; Concawe: Brussels, Belgium, 2018. [Google Scholar]
- Czerwinski, J.; Zimmerli, Y.; Hüssy, A.; Engelmann, D.; Bonsack, P.; Remmele, E.; Huber, G. Testing and evaluating real driving emissions with PEMS. Combust. Engines 2018, 173, 17–25. [Google Scholar] [CrossRef]
- International Transport Forum. Real-Word Vehicle Emissions. Discussion Paper No. 2017-06. In Proceedings of the International Transport Forum, Paris, France, 2 June 2017. [Google Scholar]
- Kurtyka, K.; Pielecha, J. The evaluation of exhaust emission in RDE tests including dynamic driving conditions. Transp. Res. Procedia 2019, 40, 338–345. [Google Scholar] [CrossRef]
- Merkisz, J.; Lijewski, P.; Fuc, P.; Weymann, S. Exhaust emission tests from non-road vehicles conducted with the use of PEMS analyzers. Eksploat. Niezawodn. Maint. Reliab. 2013, 15, 364–368. [Google Scholar]
- Merkisz, J.; Pielecha, J. Comparison of Real Driving Emissions Ttests; IOP Conference Series: Materials Science and Engineering; IOP Publishing: Bristol, UK, 2018; Volume 421, p. 42055. [Google Scholar] [CrossRef]
- Semtech-DS. On Board Vehicle Emissions Analyzer. In User Manual; Document: 9510-086, Revision: 2.01; Semtech-DS: Saline, MI, USA, 2010. [Google Scholar]
- TSI 3090 EEPS™ (Engine Exhaust Particle Sizer™). User Manual; TSI: Shoreview, MN, USA, 2008. [Google Scholar]
- Valverde, M.V.; Giechaskiel, B.; Carriero, M. Real Driving Emissions: 2018–2019 Assessment of Portable Emissions Measurement Systems (PEMS) Measurement Uncertainty; Publications Office of the European Union: Luxembourg, 2020. [Google Scholar] [CrossRef]
- Chłopek, Z.; Laskowski, P. Pollutant emission characteristics determined using the Monte Carlo Method. Eksploat. I Niezawodn. Maint. Reliab. 2009, 2, 42–51. [Google Scholar]
- Metropolis, N.; Ulam, S. The Monte Carlo Method. J. Am. Stat. Assoc. 1949, 247, 335–341. [Google Scholar] [CrossRef] [PubMed]
- Andrych-Zalewska, M.; Chłopek, Z.; Merkisz, J.; Pielecha, J. Investigations of the exhaust emissions from a combustion engine under simulated actual operating conditions in the Real Driving Emissions test. Energies 2021, 14, 935. [Google Scholar] [CrossRef]
- Andrych-Zalewska, M.; Chłopek, Z.; Merkisz, J.; Pielecha, J. Exhaust emission from a vehicle engine operating in dynamic states and conditions corresponding to real driving. Combust. Engines 2019, 178, 99–105. [Google Scholar] [CrossRef]
- Commission Regulation (EC) 715/2007 of the European Parliament and of the Council of 20 June 2007 on Type Approval of Motor Vehicles with Respect to Emissions from Light Passenger and Commercial Vehicles (Euro 5 and Euro 6) and on Access to Vehicle Repair and Maintenance Information, European Commission (EC). Off. J. Eur. Union 2007, 171, 1–16. Available online: http://data.europa.eu/eli/reg/2007/715/oj (accessed on 10 January 2021).
- Savitzky, A.; Golay, M.J.E. Smoothing and differentiation of data by simplified least squares procedures. Anal. Chem. 1964, 36, 1627–1639. [Google Scholar] [CrossRef]
- Papoulis, A.; Pillai, S.U. Probability, Random Variables, and Stochastic Processes; McGraw-Hill Book Co.: New York, NY, USA, 1965. [Google Scholar] [CrossRef]


| Engine | 1.3 JTD MultiJet: Diesel, Direct Injection; Common Rail; R4/8v |
| Engine displacement | 1248 cm3 |
| Maximum power/engine speed | 51 kW/4000 rpm |
| Maximum torque/engine speed | 180 N∙m/1750 rpm |
| After-treatment system | Oxicat only |
| Emission generation | Euro 4 |
| Dynamic dynamometer | AVL Dynoroad 120 kW |
| Voltage | 3 × 500 V |
| Frequency | 267 Hz |
| Power | 120 kW |
| Maximum torque | 509 N·m |
| Rotation speed range | 0–8000 rpm |
| Zero-Dimensional Characteristic Concept | Minimum Value (MIN) | Maximum Value (MAX) | Average Value (AV) | Standard Deviation (D) |
|---|---|---|---|---|
| Engine speed, n [rpm] | 133 | 3670 | 1445 | 507 |
| Relative engine torque, Mer [–] | 0.000 | 1.000 | 0.397 | 0.184 |
| Intensity of carbon monoxide emission, ECO [mg/s] | 0.017 | 50.500 | 2.290 | 4.160 |
| Intensity of hydrocarbons emission, EHC [mg/s] | 0.013 | 4.050 | 0.503 | 0.489 |
| Intensity of nitrogen oxides emission, ENOx [mg/s] | 0.020 | 96.300 | 6.650 | 11.600 |
| Intensity of carbon dioxide emission, ECO2 [g/s] | 0.035 | 10.600 | 1.510 | 1.480 |
| Intensity of particle number, EPN [1/s] | 4.17 × 10⁸ | 2.95 × 10¹² | 1.09 × 10¹¹ | 1.75 × 10¹¹ |
| ECO | EHC | ENOx | ECO2 | EPN | ||
|---|---|---|---|---|---|---|
| mg/s | mg/s | mg/s | g/s | 1/s | ||
| T | Min | 1.67 × 10⁻² | 1.33 × 10⁻² | 2.00 × 10⁻² | 3.53 × 10⁻² | 4.17 × 10⁸ |
| Max | 5.05 × 101 | 4.05 | 9.63 × 10⁻¹ | 1.06 × 101 | 2.95 × 10¹² | |
| AV | 2.60 | 5.64 × 10⁻¹ | 7.65 | 1.69 | 1.19 × 10¹¹ | |
| a = 0 | Min | 1.67 × 10⁻² | 1.33 × 10⁻² | 2.00 × 10⁻² | 3.53 × 10⁻² | 4.17 × 10⁸ |
| Max | 3.28 × 101 | 2.20 | 4.70 × 101 | 5.32 | 2.79 × 10¹² | |
| AV | 1.75 | 5.68 × 10⁻¹ | 5.14 | 2.00 | 1.10 × 10¹¹ | |
| a < 0 | Min | 1.67 × 10⁻² | 1.33 × 10⁻² | 2.00 × 10⁻² | 3.53 × 10⁻² | 4.17 × 10⁸ |
| Max | 5.05 × 101 | 2.15 | 3.83 × 101 | 5.20 | 2.95 × 10¹² | |
| AV | 1.79 | 3.16 × 10⁻¹ | 2.60 | 7.97 × 10⁻¹ | 8.13 × 10¹⁰ | |
| a > 0 | Min | 1.67 × 10⁻² | 1.33 × 10⁻² | 2.00 × 10⁻² | 3.53 × 10⁻² | 4.17 × 10⁸ |
| Max | 5.04 × 10 | 4.05 | 9.63 × 101 | 1.06 × 101 | 1.94 × 10¹² | |
| AV | 3.98 | 8.17 × 10⁻¹ | 1.45 × 101 | 2.41 | 1.64 × 10¹¹ |
Publisher’s Note: MDPI stays neutral with regard to jurisdictional claims in published maps and institutional affiliations. |
© 2021 by the authors. Licensee MDPI, Basel, Switzerland. This article is an open access article distributed under the terms and conditions of the Creative Commons Attribution (CC BY) license (https://creativecommons.org/licenses/by/4.0/).
Share and Cite
Andrych-Zalewska, M.; Chlopek, Z.; Merkisz, J.; Pielecha, J. Research on Exhaust Emissions in Dynamic Operating States of a Combustion Engine in a Real Driving Emissions Test. Energies 2021, 14, 5684. https://doi.org/10.3390/en14185684
Andrych-Zalewska M, Chlopek Z, Merkisz J, Pielecha J. Research on Exhaust Emissions in Dynamic Operating States of a Combustion Engine in a Real Driving Emissions Test. Energies. 2021; 14(18):5684. https://doi.org/10.3390/en14185684
Chicago/Turabian StyleAndrych-Zalewska, Monika, Zdzislaw Chlopek, Jerzy Merkisz, and Jacek Pielecha. 2021. "Research on Exhaust Emissions in Dynamic Operating States of a Combustion Engine in a Real Driving Emissions Test" Energies 14, no. 18: 5684. https://doi.org/10.3390/en14185684
APA StyleAndrych-Zalewska, M., Chlopek, Z., Merkisz, J., & Pielecha, J. (2021). Research on Exhaust Emissions in Dynamic Operating States of a Combustion Engine in a Real Driving Emissions Test. Energies, 14(18), 5684. https://doi.org/10.3390/en14185684