
Sensitivity Analysis of Influencing Factors of Supercritical Methane Flow and Heat Transfer in a U-Tube

 , ,
, ,
Abstract
:1. Introduction
2. Mathematical and Physical Models
2.1. Physical Model
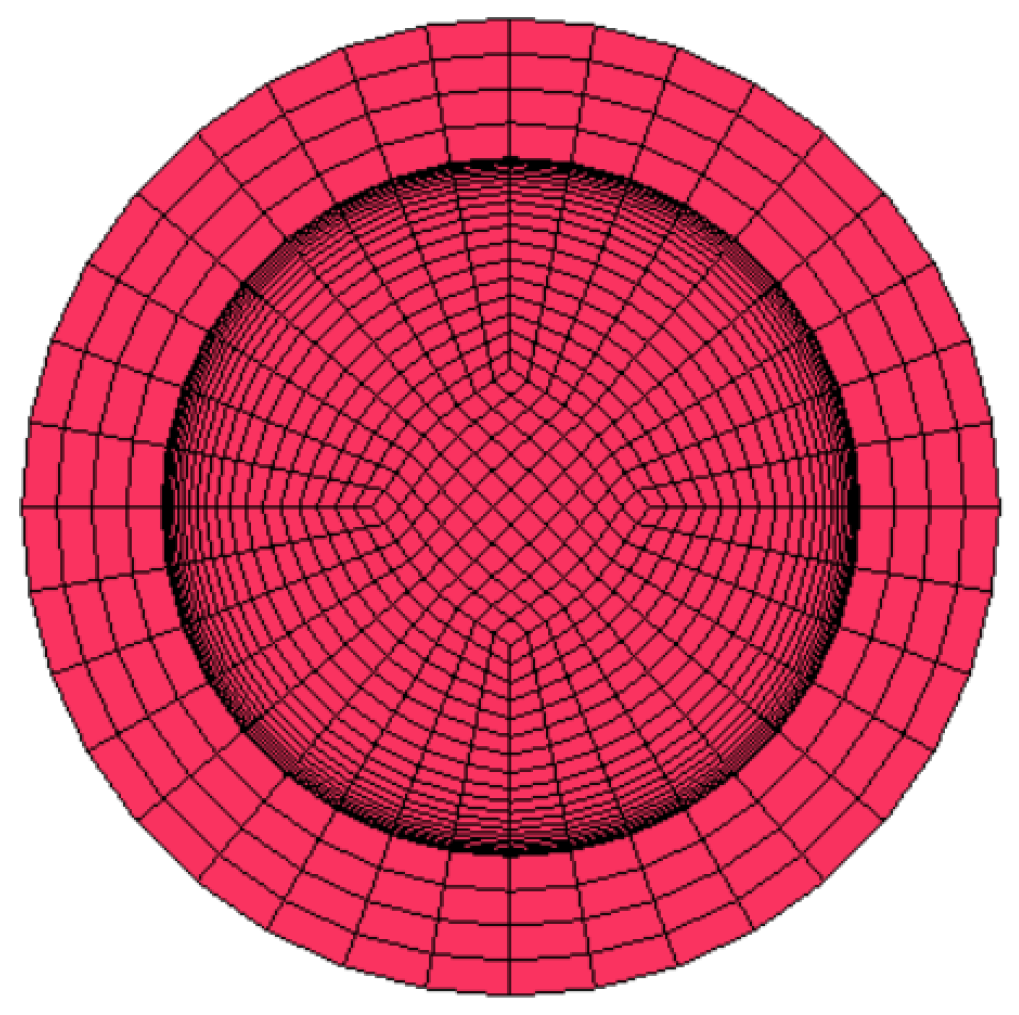
2.2. Meshing
2.3. Governing Equations
2.4. Data Reduction Method
2.5. Boundary Conditions
- It was assumed that the flow at the inlet was fully developed, its boundary condition was determined by the mass flux inlet, with the specific value changing from 50 to ~100 kg/m2 s, and temperature was set to 180 K. The pressure ranged from 5.43 to 9.55 MPa and the gravity acceleration from −6.8 to −12.8 m/s2. The outlet pressure was set to 6.93 MPa. Meanwhile, a constant heat flow boundary and no-slip-velocity conditions adopted for the outer wall of the heating section tube, and the wall heat flux varied from 60 to 100 kW/m2. In the case of other boundary conditions remaining unchanged, by changing the single-variable, the comparative analysis of its specific impact on heat transfer characteristics is carrying out.
- In the process of solving by Fluent 14.0 software, the physical properties of methane were regarding as a single-value function of temperature. According to the methane physical property data provided by the National Institute of Standards and Technology Database (NIST) [25], the physical property parameters were obtaining by the piecewise-liner linear interpolation method. Figure 4 shows the curves of specific heat at constant pressure cp, density ρ, dynamic viscosity μ, and thermal conductivity λ changing with methane temperature under different pressure conditions.
2.6. Verification of the Method
3. Results and Discussion
3.1. Analysis of the Flow Heat Transfer Process in a U-Tube Section
3.2. Effect of Mass Flux
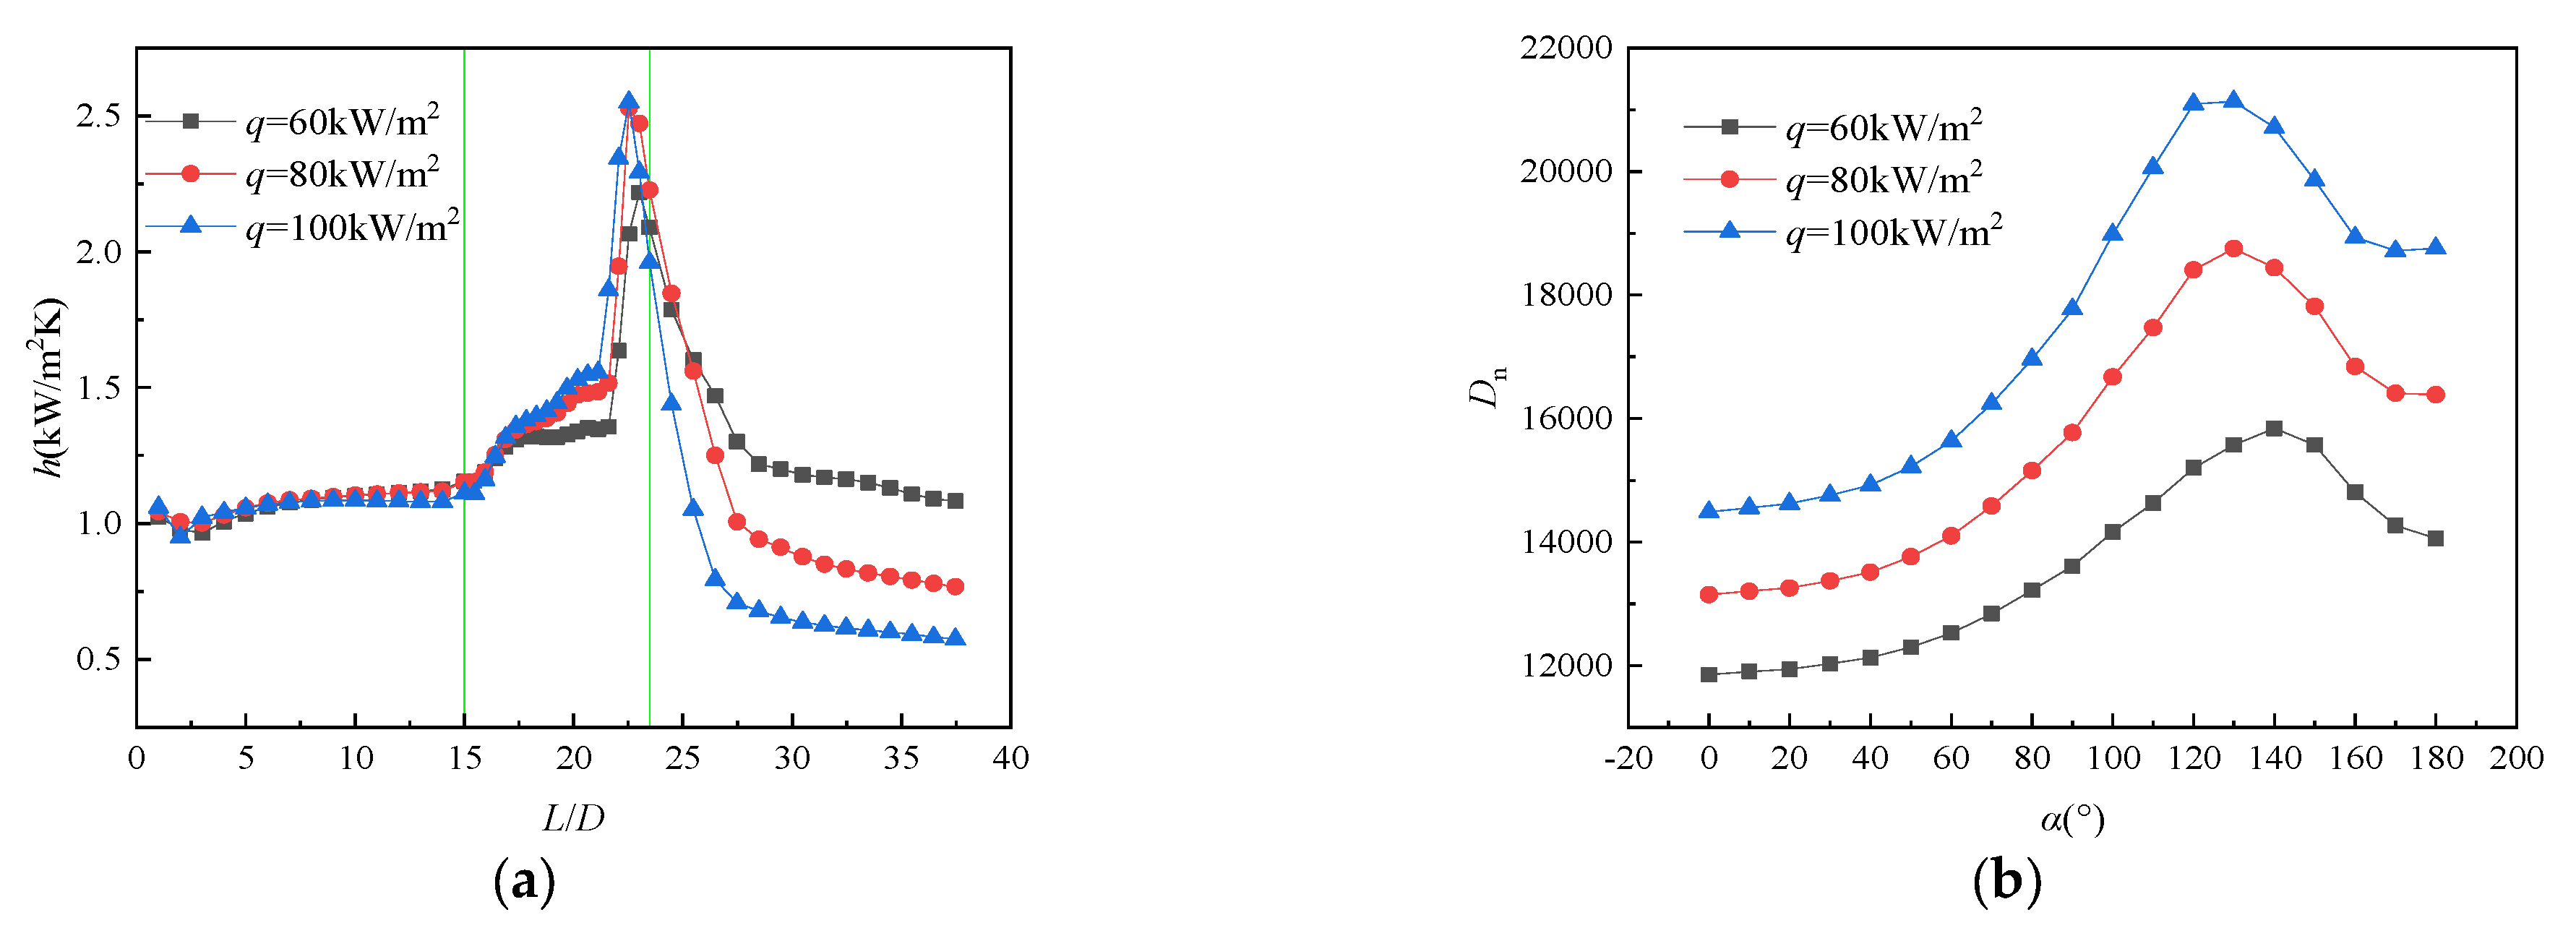
3.3. Effect of Heat Flux
3.4. Effect of Pressure
3.5. Effect of Gravity
3.6. Flow Heat Transfer Comparison between Different Tubes
4. Conclusions
- When the temperature of the main fluid is close to the quasi-critical temperature, the constant pressure specific heat capacity of the fluid increases rapidly and reaches its peak value. Thus methane can absorb more heat from the outer wall of the tube to increase temperature, reduce the temperature difference between the main fluid and the tube wall, increase the convective heat transfer coefficient of the local fluid, and enhance heat transfer.
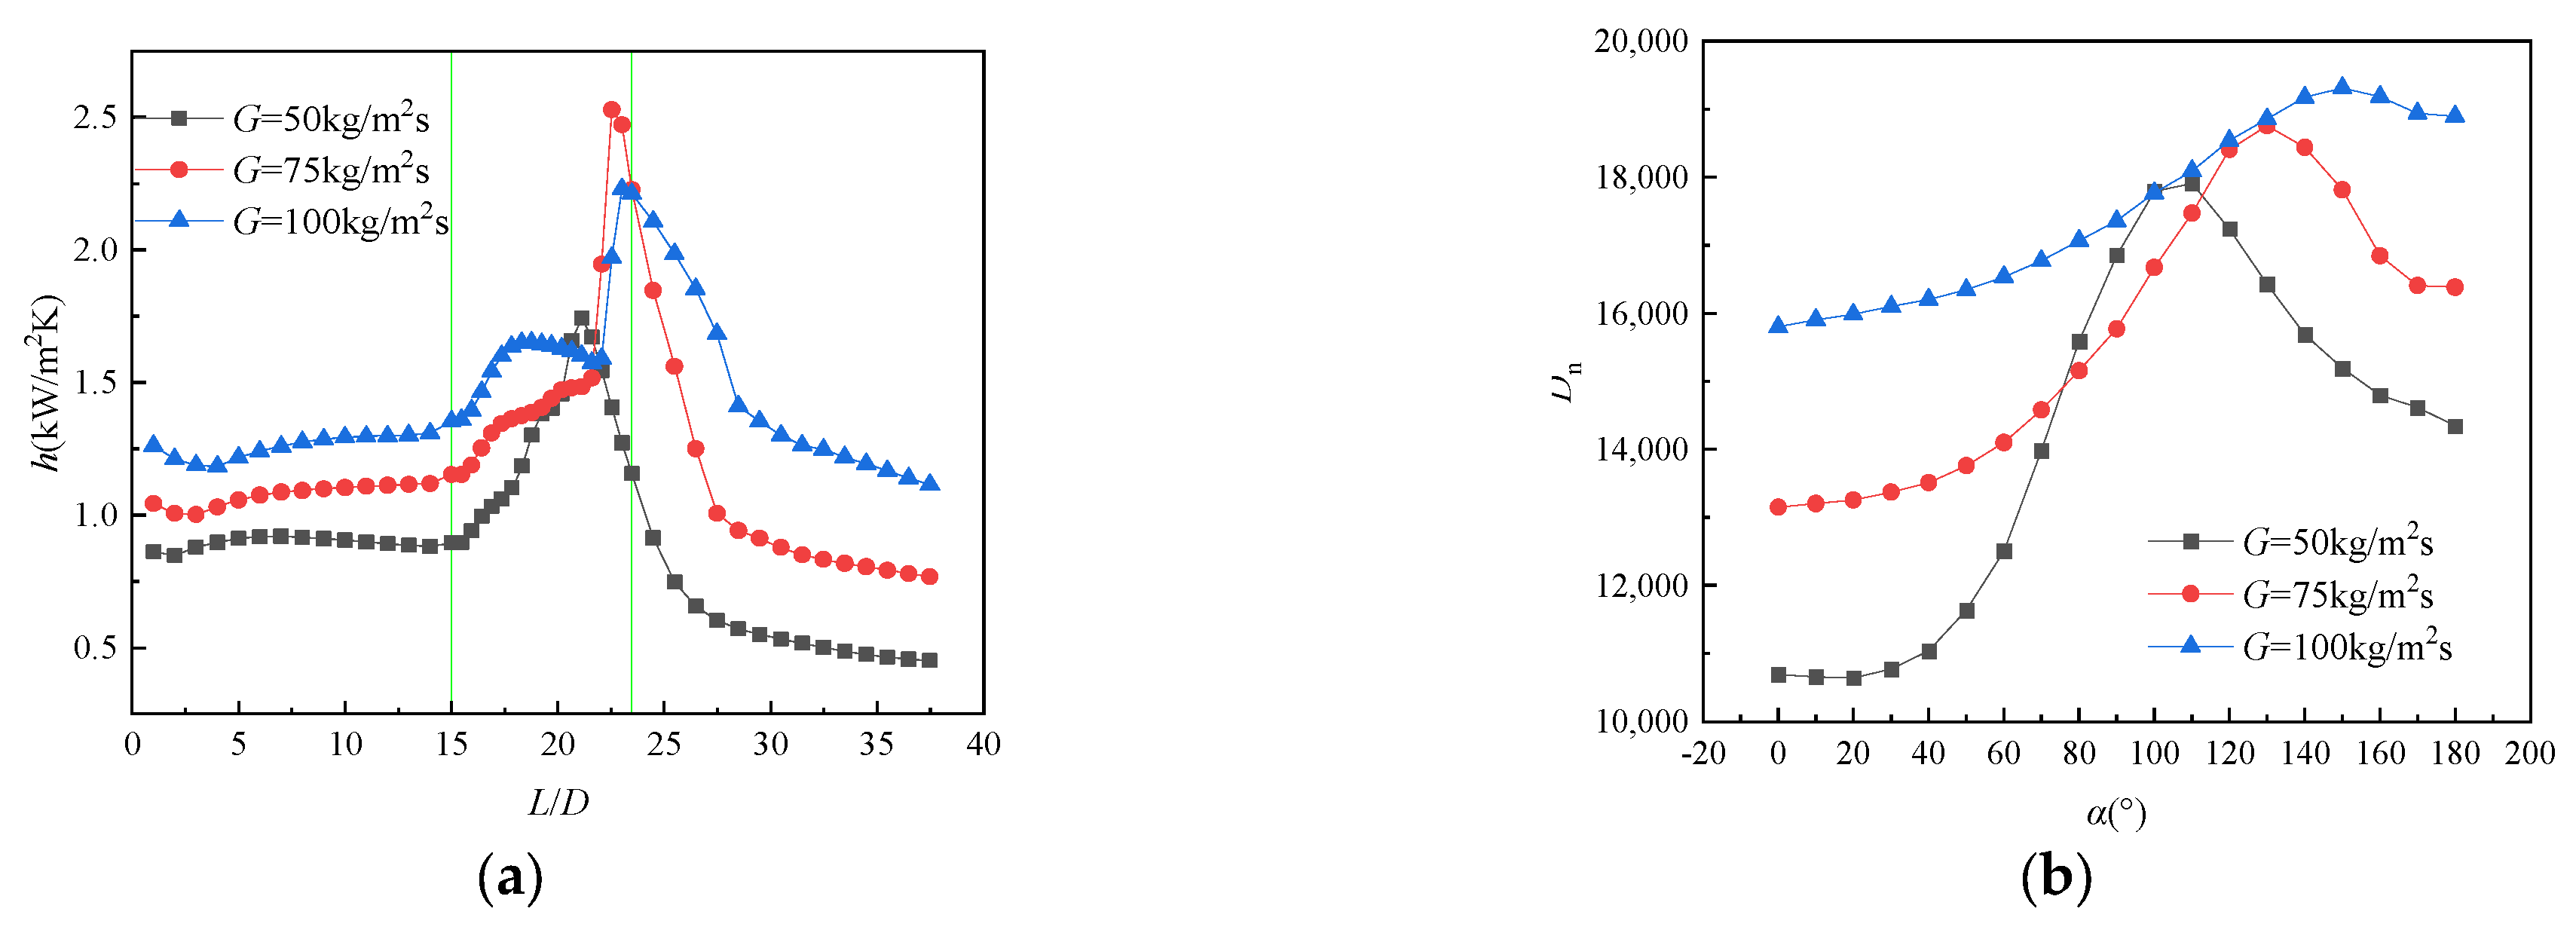
- The Dean vortex can significantly increase or decrease the convective heat transfer capacity of the elbow, and the strength of h and Dean vortices shows a trend of increasing and then decreasing in the curved tube. The peak values of h and Dean vortices increase with the mass flux, whereas heat transfer deteriorates when G = 100 kg/m2·s.
- Increasing the heat flux could lead to a rise in the heat transfer coefficient, while the peak value gradually decreases with the augmentation of operating pressures. The pressure drop obviously increases along the flow direction due to the decrease in bulk fluid density, and heat transfer deteriorates in the elbow at P = 5.43 MPa.
- Compared with the horizontal straight tube, the U-tube can significantly improve heat transfer in the elbow part, but the presence of an elbow reduces heat transfer in the subsequent straight pipe section. The sensitivity to the effect of various parameters on the heat transfer performance of supercritical methane in a U-tube is in the order of pressure P, mass flux G, gravity g, and heat flux q, from large to small.
Author Contributions
Funding
Institutional Review Board Statement
Informed Consent Statement
Data Availability Statement
Conflicts of Interest
Nomenclature
| A | cross-sectional area, m2 |
| D | tube outer diameter, mm |
| T | bulk fluid temperature, K |
| E | total energy, kJ/kg |
| P | static pressure, Pa |
| G | mass flow rate, kg/m2·s |
| L | characteristic length, mm |
| R | curvature radius of the bend, mm |
| H | bulk fluid enthalpy, kJ/kg |
| Nu | Nussel number |
| Reynolds number | |
| Dn | Dean number |
| Tw | averaging temperature of wall, K |
| Tb | bulk temperature of fluid, K |
| d | tube inner diameter, mm |
| r | bend radius, mm |
| bending angle | |
| k | turbulence kinetic energy, m2/s2 |
| p | bulk fluid pressure, Pa |
| u | bulk fluid velocity, m/s |
| h | heat transfer coefficient, W/m2·K |
| density, kg/m3 | |
| thermal conductivity of the fluid, W/m·K−1 | |
| ε | dissipation rate of turbulent kinetic energy, m2/s3 |
| dynamic viscosity, Pa·S | |
| μt | turbulent viscosity, Pa·S |
| qw | local heat flux of the wall, kW/m2 |
| ω | axial velocity, m/s |
| specific heat capacity, J/kg·K−1 | |
| ν | kinematic viscosity, m2/s |
| σk, σε | model constants |
| cμ, c1, c2 | coefficients of the Mathias and Copeman alpha function |
References
- Li, Z.J.; Guo, S.L.; Tao, W.Q. Studies of Supercritical Convective Heat Transfer of LNG in Tube. J. Eng. Thermophys. 2013, 34, 2314–2317. [Google Scholar]
- Han, H.; Yan, Y.; Wang, S.; Li, Y.X. Thermal design optimization analysis of an intermediate fluid vaporizer for liquefied natural gas. Appl. Therm. Eng. 2018, 129, 329–337. [Google Scholar] [CrossRef]
- Pan, J.; Bai, J.H.; Tang, L.H.; Li, R.; Wu, G. Thermal performance analysis of submerged combustion vaporizer at supercritical pressure. Cryogenics 2019, 100, 41–52. [Google Scholar] [CrossRef]
- Divyamaan, W.; Sun, B.; Ranjeet, P.U.; Geoffrey, E.; Moses, O.T.; Neil, K.; Solomon, F.; Vishnu, K.P. Numerical study of fog formation around ambient air vaporizers. Chem. Eng. Sci. 2018, 183, 37–46. [Google Scholar]
- Jiang, K.T.; Jing, B.J.; Wang, Z.L. Study on the Calculation Method of LNG Thermal Physical Parameters under the Change of Temperature and Pressure. Jiangsu Ship 2019, 36, 4–5. [Google Scholar]
- Mollee, P.; Tate, J.; Pretorius, C.J. The Experimental Determination of Solubilities. Chem. Int.-Newsmag. IUPAC 2003, 25, 30. [Google Scholar]
- Aim, K.; Fermeglia, M. Solubility of Solids and Liquids in Supercritical Fluids; John Wiley & Sons Ltd.: New York, NY, USA, 2004. [Google Scholar]
- Gu, H.; Li, H.; Wang, H.; Luo, Y. Experimental investigation on convective heat transfer from a horizontal miniature tube to methane at supercritical pressures. Appl. Therm. Eng. 2013, 58, 490–498. [Google Scholar] [CrossRef]
- Han, C.L.; Zhang, Y.N.; Yu, H.; Lu, Y.P.; Jiao, B. Numerical analysis on non-uniform flow and heat transfer of supercritical cryogenic methane in a heated horizontal circular tube. J. Supercrit. Fluid 2018, 138, 82–91. [Google Scholar] [CrossRef]
- Bruch, A.; Bontemps, A.; Colasson, S. Experimental investigation of heat transfer of supercritical carbon dioxide flowing in a cooled vertical tube. Int. J. Heat Mass Transf. 2009, 52, 2589–2598. [Google Scholar] [CrossRef]
- Koshizuka, S.; Takano, N.; Oka, Y. Numerical Analysis of Deterioration Phenomena in Heat Transfer to Supercritical Water. Int. J. Heat Mass Transf. 1995, 38, 3077–3084. [Google Scholar] [CrossRef]
- Song, J.H.; Kim, H.Y.; Kim, H.; Bae, Y.Y. Heat transfer characteristics of a supercritical fluid flow in a vertical pipe. J. Supercrit. Fluid 2008, 44, 164–171. [Google Scholar] [CrossRef]
- Kim, S.; Kim, Y.; Bae, Y.; Cho, B. Numerical simulation of the vertical upward flow of water in a heated tube at supercritical pressure. In Proceedings of the ICAPP. 2004 International Congress on Advances in Nuclear Power Plants, Pittsburgh, PA, USA, 13–17 June 2004; pp. 40–47. [Google Scholar]
- Walisch, T.; Müller, M.; Dörfler, W.; Trepp, C. The heat transfer to supercritical carbon dioxide in tubes with mixed convection. Process. Technol. Proc. 1996, 12, 199–204. [Google Scholar]
- Dong, W.P.; Ren, J.J.; Han, C.L.; Du, D.; Bi, M.S. Heat transfer characteristic of trans-critical liquefied natural gas on tube-side of submerged combustion vaporizer. Chem. Ind. Eng. Prog. 2017, 36, 4378–4384. [Google Scholar]
- Zhang, K.; Han, C.L.; Ren, J.J.; Zhou, Y.F.; Bi, M.S. Numerical simulation on heat transfer of supercritical LNG in coil tubes of submerged combustion vaporizer. CISSC J. 2015, 66, 4788–4795. [Google Scholar]
- Fu, Y.C.; Wen, J.; Tao, Z.; Xu, J.Q.; Huang, H.R. Experimental research on convective heat transfer of supercritical hydrocarbon fuel flowing through U-turn tubes. Appl. Therm. Eng. 2017, 116, 43–55. [Google Scholar] [CrossRef]
- Wei, C.; Yang, Z.N.; Li, Y.; Chyu, K. Numerical investigation of heat transfer and flow characteristics of supercritical CO2 in U-duct. Appl. Therm. Eng. 2018, 144, 532–539. [Google Scholar]
- Roache, P.J. Perspective: A method for uniform reporting of grid refinement studies. J. Fluids Eng. 1994, 116, 405–413. [Google Scholar] [CrossRef]
- De Oliveira, M.A.; de Moraes, P.G.; de Andrade, C.L.; Bimbato, A.M.; Pereira, L.A.A. Control and Suppression of Vortex Shedding from a Slightly Rough Circular Cylinder by a Discrete Vortex Method. Energies 2020, 13, 4481. [Google Scholar] [CrossRef]
- Tao, W.Q. Numerical Heat Transfer, 2nd ed.; Xi’an Jiaotong University Press: Xi’an, China, 2001. [Google Scholar]
- Versteeg, H.; Malalasekra, W. An Introduction to Computational Fluid Dynamics: The Finite Volume Method, 2nd ed.; Prentice Hall: New York, NY, USA, 2007. [Google Scholar]
- Han, C.L.; Ren, J.J.; Dong, W.P.; Bi, M.S. Numerical investigation of supercritical LNG convective heat transfer in a horizontal serpentine tube. Cryogenics 2016, 78, 1–13. [Google Scholar] [CrossRef]
- ANSYS Inc. Ansys Fluent Theory Guide 14.0; ANSYS Inc.: Canonsburg, PA, USA, 2012. [Google Scholar]
- Lemmon, E.W.; Huber, M.L.; McLinden, M.O. NIST Standard Ref. Database 23: Reference Fluid Thermodynamic and Transport Properties-REFPROP Version 8.0; NIST: Gaithersburg, MD, USA, 2007.
- Lei, X.L.; Zhang, J.; Gou, L.T.; Zhang, Q.; Li, H.X. Experimental study on convection heat transfer of supercritical CO2 in small upward channels. Energy 2019, 176, 119–130. [Google Scholar] [CrossRef]
- Cheng, X.; Kuang, B.; Yang, Y.H. Numerical analysis of heat transfer in supercritical water cooled flow channels. Nucl. Eng. Des. 2006, 237, 240–252. [Google Scholar] [CrossRef]


| Case | Radial | Circumferential | Axial | Number |
|---|---|---|---|---|
| 1 | 50 | 40 | 1740 | 1,400,000 |
| 2 | 60 | 40 | 1740 | 1,700,000 |
| 3 | 70 | 40 | 1740 | 2,000,000 |
Publisher’s Note: MDPI stays neutral with regard to jurisdictional claims in published maps and institutional affiliations. |
© 2021 by the authors. Licensee MDPI, Basel, Switzerland. This article is an open access article distributed under the terms and conditions of the Creative Commons Attribution (CC BY) license (https://creativecommons.org/licenses/by/4.0/).
Share and Cite
Zhu, L.; Lu, Y.; Tong, J.; Liang, T.; Lu, Y.; Fu, W.; Wang, B.; Zhang, Y. Sensitivity Analysis of Influencing Factors of Supercritical Methane Flow and Heat Transfer in a U-Tube. Energies 2021, 14, 5714. https://doi.org/10.3390/en14185714
Zhu L, Lu Y, Tong J, Liang T, Lu Y, Fu W, Wang B, Zhang Y. Sensitivity Analysis of Influencing Factors of Supercritical Methane Flow and Heat Transfer in a U-Tube. Energies. 2021; 14(18):5714. https://doi.org/10.3390/en14185714
Chicago/Turabian StyleZhu, Lingbo, Yiping Lu, Jianfei Tong, Tianjiao Liang, Youlian Lu, Weida Fu, Bin Wang, and Yunan Zhang. 2021. "Sensitivity Analysis of Influencing Factors of Supercritical Methane Flow and Heat Transfer in a U-Tube" Energies 14, no. 18: 5714. https://doi.org/10.3390/en14185714
APA StyleZhu, L., Lu, Y., Tong, J., Liang, T., Lu, Y., Fu, W., Wang, B., & Zhang, Y. (2021). Sensitivity Analysis of Influencing Factors of Supercritical Methane Flow and Heat Transfer in a U-Tube. Energies, 14(18), 5714. https://doi.org/10.3390/en14185714