Article

Experimental Investigation of Frost Formation Influence on an Air Source Heat Pump Evaporator

Department of Building Energetics, Vilnius Gediminas Technical University, Saulėtekio Al. 11, 10223 Vilnius, Lithuania
*
Author to whom correspondence should be addressed.
Energies 2021, 14(18), 5737; https://doi.org/10.3390/en14185737
Submission received: 14 August 2021 / Revised: 4 September 2021 / Accepted: 11 September 2021 / Published: 12 September 2021

Abstract

:
The application of heat pumps in the heating systems of buildings in the cold or transitional season is becoming an increasingly common practice not only in Lithuania but in other countries as well. Due to the growing popularity of air-to-air or air-to-water heat pumps in the building sector, the problem of the evaporator heat exchanger freezing is also becoming more and more relevant. As the outdoor temperature drops, so does the heat pump’s coefficient of performance (COP) for heating. The freezing of the evaporator surface increases the energy consumption of the system, has a negative effect on heat exchange, distorts the normal operating cycle of the heat pump and the energy is wasted for defrosting processes. This article describes the experimental investigation of an air-to-water heat pump, presents the results obtained during the experiments and their interfaces. The experiments were carried out during the transitional/cold season. It was found that frost formation on the evaporator started when the outdoor temperature was <3.5 °C and the relative humidity reached 88%. The defrosting cycle took an average of 5 min. The impact of the evaporator freezing on the operation and COP of the heat pump was assessed.

Graphical Abstract

1. Introduction

The levels of human activity lead to an increase in global warming and greenhouse gas emissions. Therefore, it is inevitable to look for and apply alternatives to shift from fossil fuel energy production to renewable energy sources. Air-to-water and air-to-air heat pumps are becoming an increasingly popular source of heat, providing buildings with both heat and cool. Air source heat pumps have lower costs and are less complex compared to ground source heat pumps [1]. Systems that integrate heat pumps in the heat sector are promoted at the level of the national policy and the European Union. The active spread of such systems is particularly noticeable in newly built, energy-efficient [2] or nearly zero-energy buildings [3]. The development of such buildings is encouraged by national legislation. However, with the environmental conditions changing throughout the year, the efficiency of systems with integrated air source heat pumps (ASHP) is volatile: their coefficient of performance (COP) is significantly higher in the transitional season than in the cold season.
Special attention must be given to the winter season [4]. As the outdoor temperature drops, the COP decreases, and at high relative humidity, there is a risk of the evaporator freezing, which increases the system’s energy consumption, energy costs and impairs the heat transfer [5]. There are various defrosting and anti-frosting methods that can be used; however, defrosting also reduces the energy efficiency of the system and can negatively affect the micro-climate indoors [6]. Possible improvements of ASHP units in terms of frost retarding and defrosting are reviewed by Mengjie et al. [7].
Summarising all the methods, we can divide them into two main groups: active and passive measures [8]. Passive measures include mechanical modifications of heat exchangers, the coating of surfaces with additional materials that reduce the risk of freezing and frost formation [9]. Active measures include auxiliary heaters [4], desiccant dehumidifiers [10], melting ice using a reversible gas cycle or hot gas bypass [11], as well as high and low-frequency vibrations and high voltage electromagnetic fields, etc. In addition, ASHPs come with solar thermal, photovoltaic and hybrid thermal systems integrated [12].
There are many factors that affect frost formation and growth. However, the most important of these are the humidity of the air passing through the heat exchanger, the outdoor air temperature, the air flow rate and the surface temperature of the heat exchanger [13]. Previous studies on the impact of frosting have shown that this phenomenon increases the heat transfer resistance between the ambient air and the refrigerant as frosting blocks air flow passage. In some cases, frosting causes the ASHP to shut down. Guo et al. distinguished three stages of the frost growing on the outdoor heat exchanger. In addition, they indicated a peak frosting outdoor air temperature when the frost grows at the maximum rate; it was about 0 °C at varying air relative humidity [14]. Chung et al. proposed a modified ε-NTU model to investigate various frosting conditions on the ASHP system, including sensible and latent heat transfer computation. The authors clarified that system operation conditions had an influence on the frosting time, and these conditions should be further investigated [15]. Liang et al. experimentally investigated the effects of evaporator surface characteristics on the defrosting behaviour [16]. Wang et al. proposed a heater-assisted ASHP, which contributed to retard the frost and extend the heating cycle. However, system components still must be investigated further for better system-wide performance [4]. Mengjie et al. also noted the need to optimise the system and its components, including experimental and numerical studies [7].
The ASHP performance depends on the operating conditions, the environment and the system design [17]. In addition, different refrigerants [18] and control modes of the equipment [19] exist and were analysed. Eom et al. used deep learning to implement a method to predict the heating capacity and power consumption of the ASHP due to frost growth [20]. Li et al. performed a theoretical and numerical study on ASHP performance in Tibet. They determined that the COP increased from 1.76 to 2.87 when the ambient temperature varied from −12 to 10 °C. In addition, the low air pressure impact was also evaluated [21]. Wei et al. analysed ASHP for district heating purposes. They found that frosting increased power consumption by 3.85–17.41%, while the seasonal COP value decreased by up to 14.83% [22]. Another study shows that the mal-defrost can reduce the COP by 40.4% [23]. Therefore, semi-experimental methods are proposed to clarify the variation in frosting [24], additionally looking into anti-frost modes and ASHP units [4,25].
Understanding the frost formation and its impact on the ASHP performance should be used in the software when planning an energy-efficient system. Studies show that there is a need to integrate the frosting impact [26] and defrosting techniques into software [27,28]. This is especially true with very high values (>80%) of relative air humidity [29]; e.g., in cold and humid climate conditions, the deviation between models, with frost formation excluded and factored in, is ~16% [30].
From the literature review, it was concluded that even though much work has been conducted to analyse the frosting and defrosting of ASHPs, there is still some uncertainty regarding performance reduction (COP) in freezing conditions, especially when the relative air humidity is high; e.g., frost forms on the surface of the ASHP outdoor coil in winter (relative humidity higher than 65% and the ambient temperature less than 5 °C) [31]. The relative humidity played a leading role in determining the accumulated frost amount [29] as it is one of the critical factors for frosting [15]. In addition, the COP of the ASHP was reduced up to 17% in a location with very high values of air relative humidity (RH > 80%) and the outdoor temperature within the range 0–6 °C [29]. In order to evaluate the frosting severity at different conditions (outdoor temperature and relative humidity), frosting maps were created [32]. Such maps had a great contribution to the development of anti-frosting technologies. However, every ASHP system has a unique frosting performance [24], and a frosting map should be adapted for it. Given the need for experimental and numerical research during the frosting/defrosting processes, the aim of this work is to analyse and present the characteristics and variation in the ASHP in the presence of freezing. This paper investigates the operation of an ASHP in the cold season and observes the freezing of the evaporator as the environmental conditions change. An experimental stand was constructed for this research; the necessary measuring devices and a camera were installed for visual observation of the experiment and assessment of frost formation. This has allowed drawing a more distinct line between the processes of frosting and defrosting and conducting a separate analysis thereof. The dependence of the COP on the average ambient air temperature and the relative humidity was determined. This understanding of the process helps to predict and planning the operation of the ASHP better, including simulation with dynamic software, which should mirror the actual process as closely as possible [30].

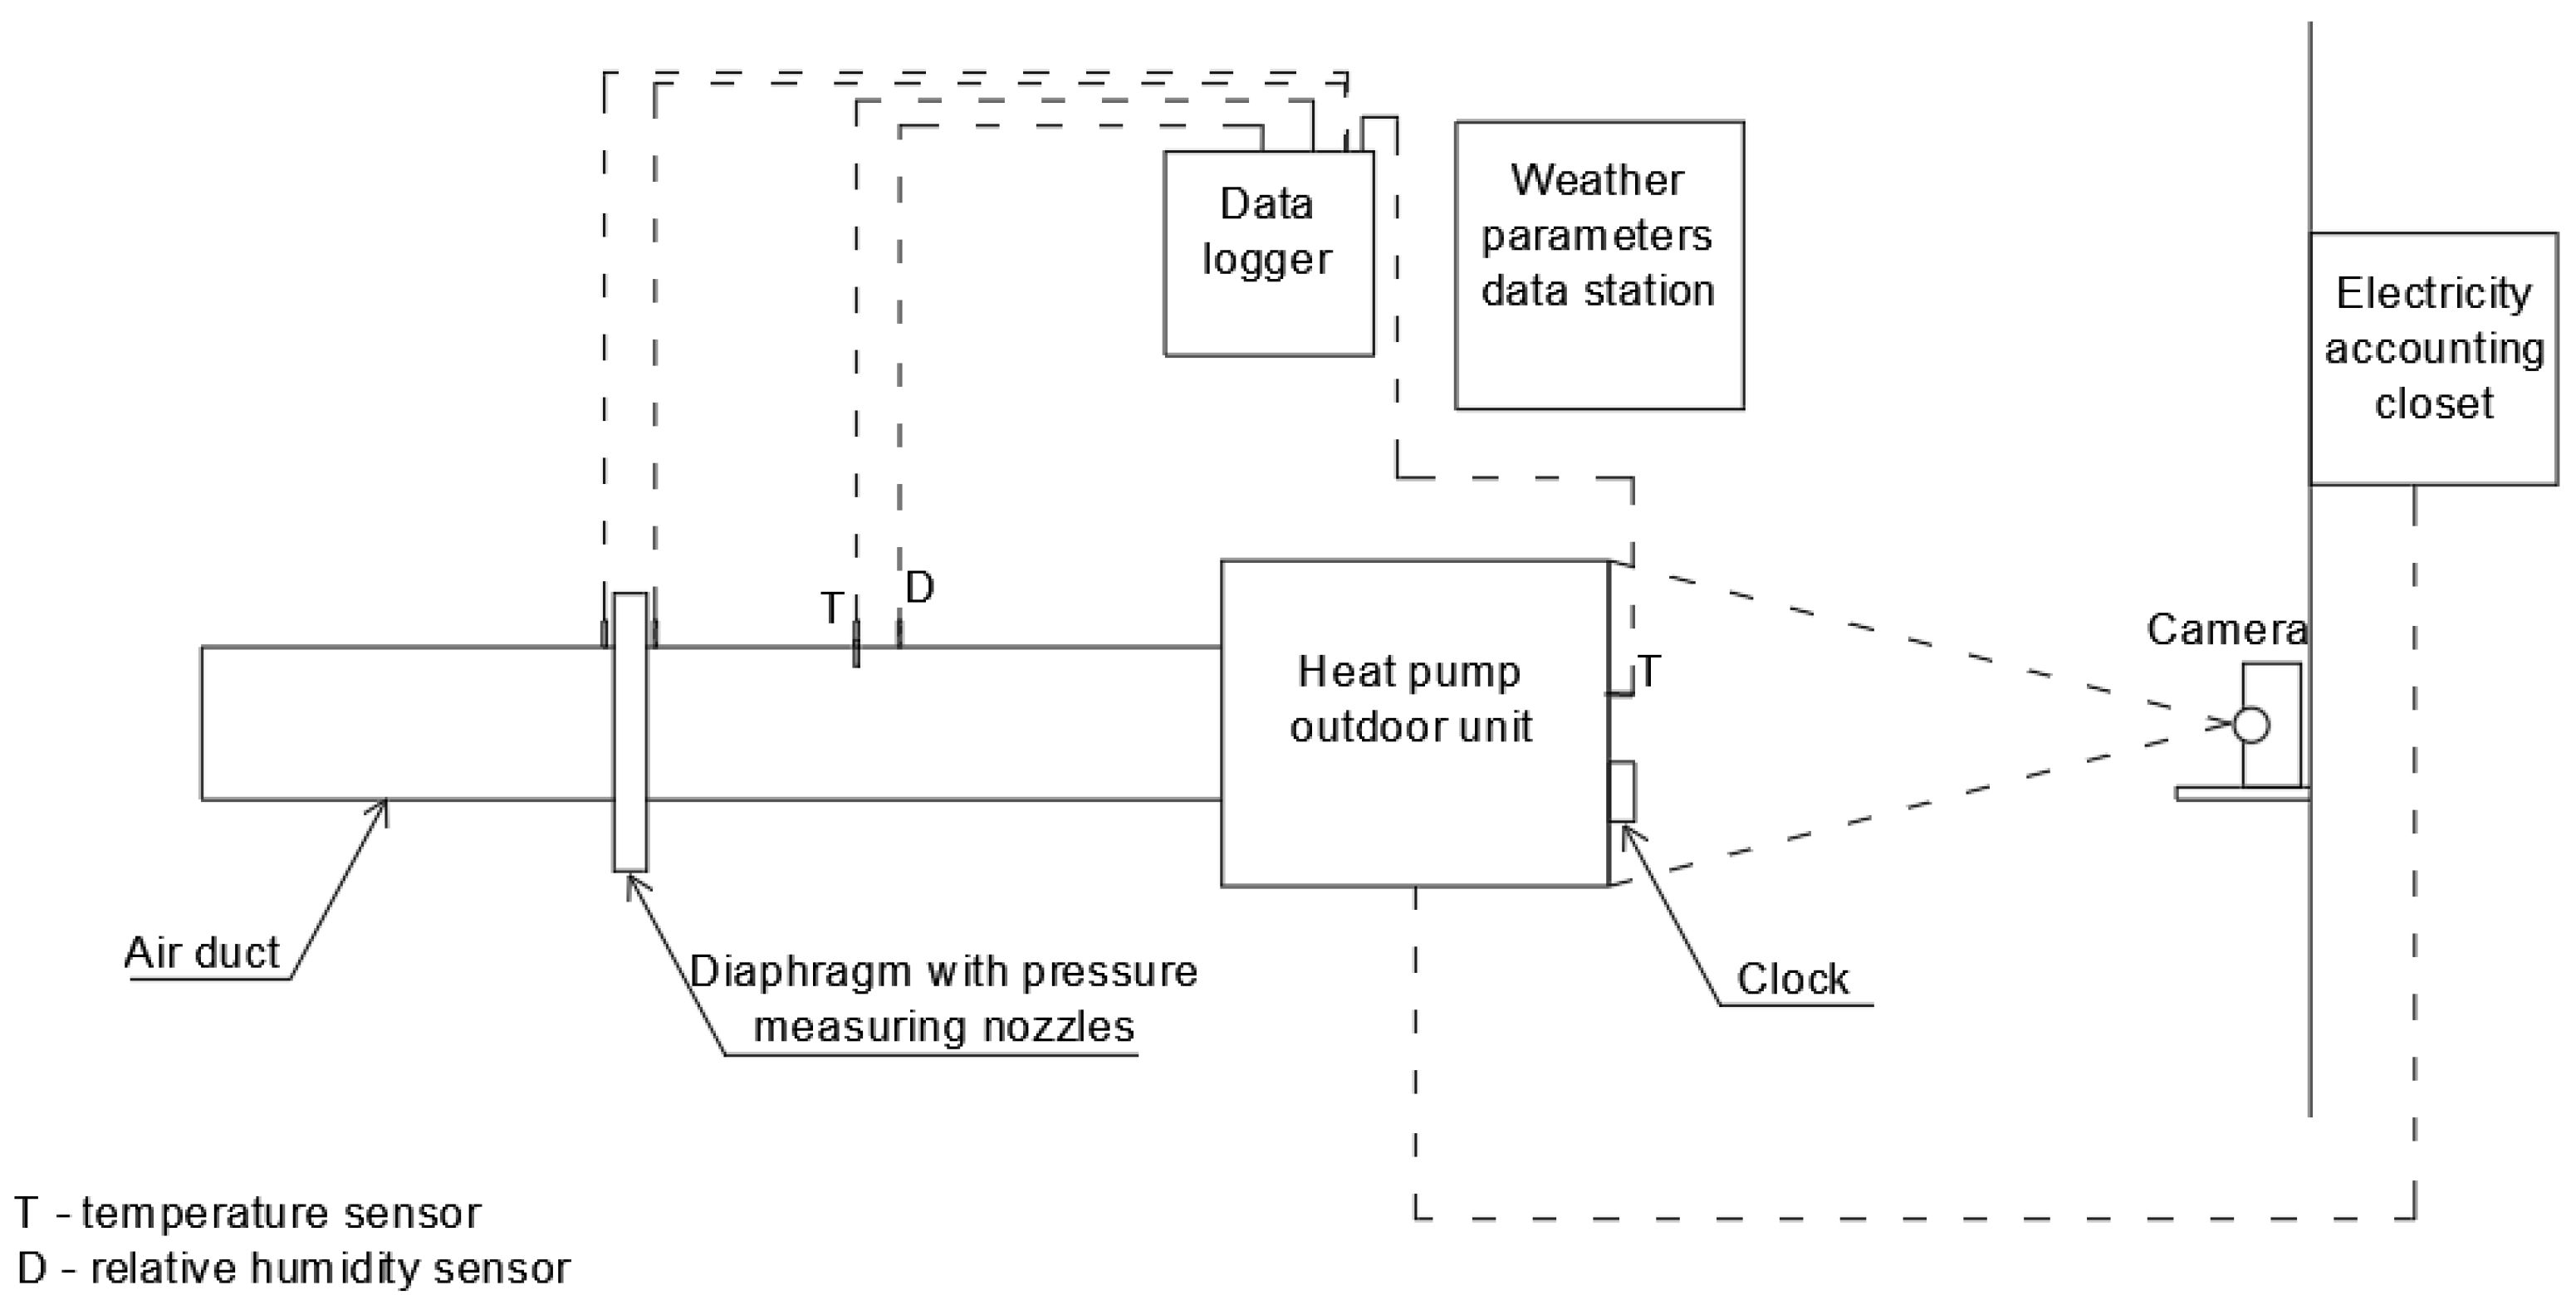
2. Methodology of Investigation

The object of the research is the evaporator of the ASHP (Panasonic WH-UD07HE5-1) located in the Laboratory of Building Energy and Microclimate Systems (BEMS) of Vilnius Gediminas Technical University (VILNIUS TECH). The operation mode of the heat pump heating loop during unfavourable climatic conditions—the cold season—was analysed. Under such environmental conditions, a frost layer starts to form on the evaporator surface. The specifics of its formation and impact on the operation and efficiency of the ASHP are investigated. According to the manufacturer’s specifications, the heating capacity of the ASHP is 7 kW, its power input is 1.57 and the COP is 4.46 when the ambient temperature is 7 °C and the temperature of water outflow from the condenser is 35 °C. The nominal air flow rate of the evaporator is 2760 m3/h.
During the experiment, the following parameters were measured: the air flow rate, the ambient air temperature, the relative humidity (upstream and downstream of the evaporator), the wind velocity, the water (inflow and outflow) temperatures and flow rates. In addition, a video camera (GoPro HERO7 Silver) was used for visual observation of the experiment and for the assessment of frost formation. The following measurement and data acquisition equipment available in the BEMS laboratory was used:
data logger Almemo 2890-9 for air parameters storing;
an IRIS-type flow control diaphragm with measuring nozzles. The diaphragm contains a differential pressure sensor FD A602-S1K with a measuring range of +/−1250 Pa and an RH accuracy of ±2.0% RH in the range <90% at a nominal temperature (25 °C ± 3 K) [33]. The air flow rate was evaluated knowing the measured pressure difference;
temperature and relative humidity (RH) sensor FHA 646 series E1 with pressure accuracy of ±0.5% of the final value in the range of 0 to the positive final value at a nominal temperature (25 °C) [34];
data logger HOBO U30 USB for the climate data storage station [35] and measurement with temperature and RH sensor S-THB-M002 [36]. The measuring range of temperature is from −40 °C to 75 °C, and the RH is 0–100%. The accuracy of air temperature is ±0.21 °C from 0 °C to 50 °C and RH, ±2.5% from 10% to 90% RH (typical), up to a maximum of +/−3.5% including hysteresis at 25 °C; below 10% and above 90% ±5% typical;
energy data logger HOBO H22 for storing water temperature and flow parameters [37];
12-bit smart temperature sensor S-TMB-M017 with a measuring range of 40° to 100 °C and accuracy < ±0.2 °C from 0 °C to 50 °C [38];
water flow meter sensor T-MINOL-130-NL with a measuring range of 0.95 l/min to 83.3 l/min and accuracy AWWA (American Water Works Association) spec 97–103% [39];
multi-meter/data-logger EX542 for electric current measurement and data storage, accuracy: ±0.06% [40];
leakage clamp TRMS meter with power functions MD9272 for power factor measurement with a measuring range of 0 to 1.00, accuracy: ±5 digits [41];
a digital clock.
All measurement results were recorded every 1 min.
The GoPro HERO7 Silver high-resolution action camera used for monitoring the frost formation on the heat exchanger surface is presented in Figure 1a. It was mounted under a transparent plastic hood perpendicularly to the heat exchanger. In order to visually monitor the formation of frost on the evaporator surface during the hours of darkness, a light source was installed (see Figure 1b).
The assembled experimental setup is shown in Figure 2, and its schematic representation is presented in Figure 3. As can be seen from Figure 2, a DN500 duct was mounted on the external unit of the heat pump to determine the amount of air drawn through the evaporator, and an IRIS500 diaphragm was mounted to measure it.
Various indicators could be used to evaluate heat pump operation [42]. For the purposes of this research, the efficiency factor COP was selected as one of the most popular indicators. This value is understood as the ratio between the amount of heat produced by the heat pump and the electricity consumed:
C O P = Q P e l ,
where Q is the amount of heat produced, kWh, and Pel is the electricity consumed, kWh.
The amount of heat produced by the heat pump (secondary water loop) is obtained from:
Q = V ˙ · ρ · C p · Δ t 3600 ,
where V ˙ is the water flow rate, m3/h; Cp is the specific heat capacity at constant pressure, kJ/(kgK); Δt is the temperature difference between the temperatures of water supplied and returned; ρ is the water density, kg/m3.
The amount of electricity consumed by the heat pump is calculated as follows:
P e l = I · U · τ 3600 · 10 3 · cos ( φ ) ,
where I is the current (taken from measurements), A; U is the voltage, V; τ is the duration of the experiment, s; cos(φ) is the power factor (it was measured to be 0.97). Voltage is taken as a constant value at 230 V.
In order to analyse the COP dependency on the air and water parameters, enthalpies of working fluids could be used. This is a convenient approach as the air enthalpy represents the heat energy due to temperature and moisture in the air. The enthalpy of air is determined from the following equation [43]:
h a i r = 1.006 t + W ( 2501 + 1.86 t ) ,
where t is the air temperature, °C; W is the specific humidity, kg/kg.
The enthalpy of water is calculated with the following equation [44]:
h w a t e r = h s + [ 1 + κ h ( p p s ) ] ,
where hs is the specific enthalpy of saturated water, kJ/kg; κ is the compressibility factor for the enthalpy (1/bar); p is the pressure, bar; ps is the saturation pressure, bar. A detailed way to determine the enthalpy and other properties of water is presented in [44].
Measurements always involve a certain degree of uncertainty. Propagation of uncertainty is applied for the purposes of indirect measurement (e.g., COP). It is assumed that uncertainties with direct measurements are independent, and each of them follows a normal pattern of Gaussian distribution. The measurement reliability of the COP can be expressed as the following function [30]:
Δ C O P = f ( V ˙ , t , I , cos φ ) .
With the uncertainty methodology, the uncertainty of the COP is ±3.2%, which is mainly affected by the accuracy of the flow meter and the temperature sensors.
As heat pump operation data were being recorded and its evaporator was being visually monitored, the data were analysed to examine the defrosting process of the heat exchanger and to assess the reduction in the COP due to frost formation on the evaporator. Depending on the ambient weather conditions during the experiments, it was decided to distinguish three different periods during typical days when the temperature and the humidity are as follows:
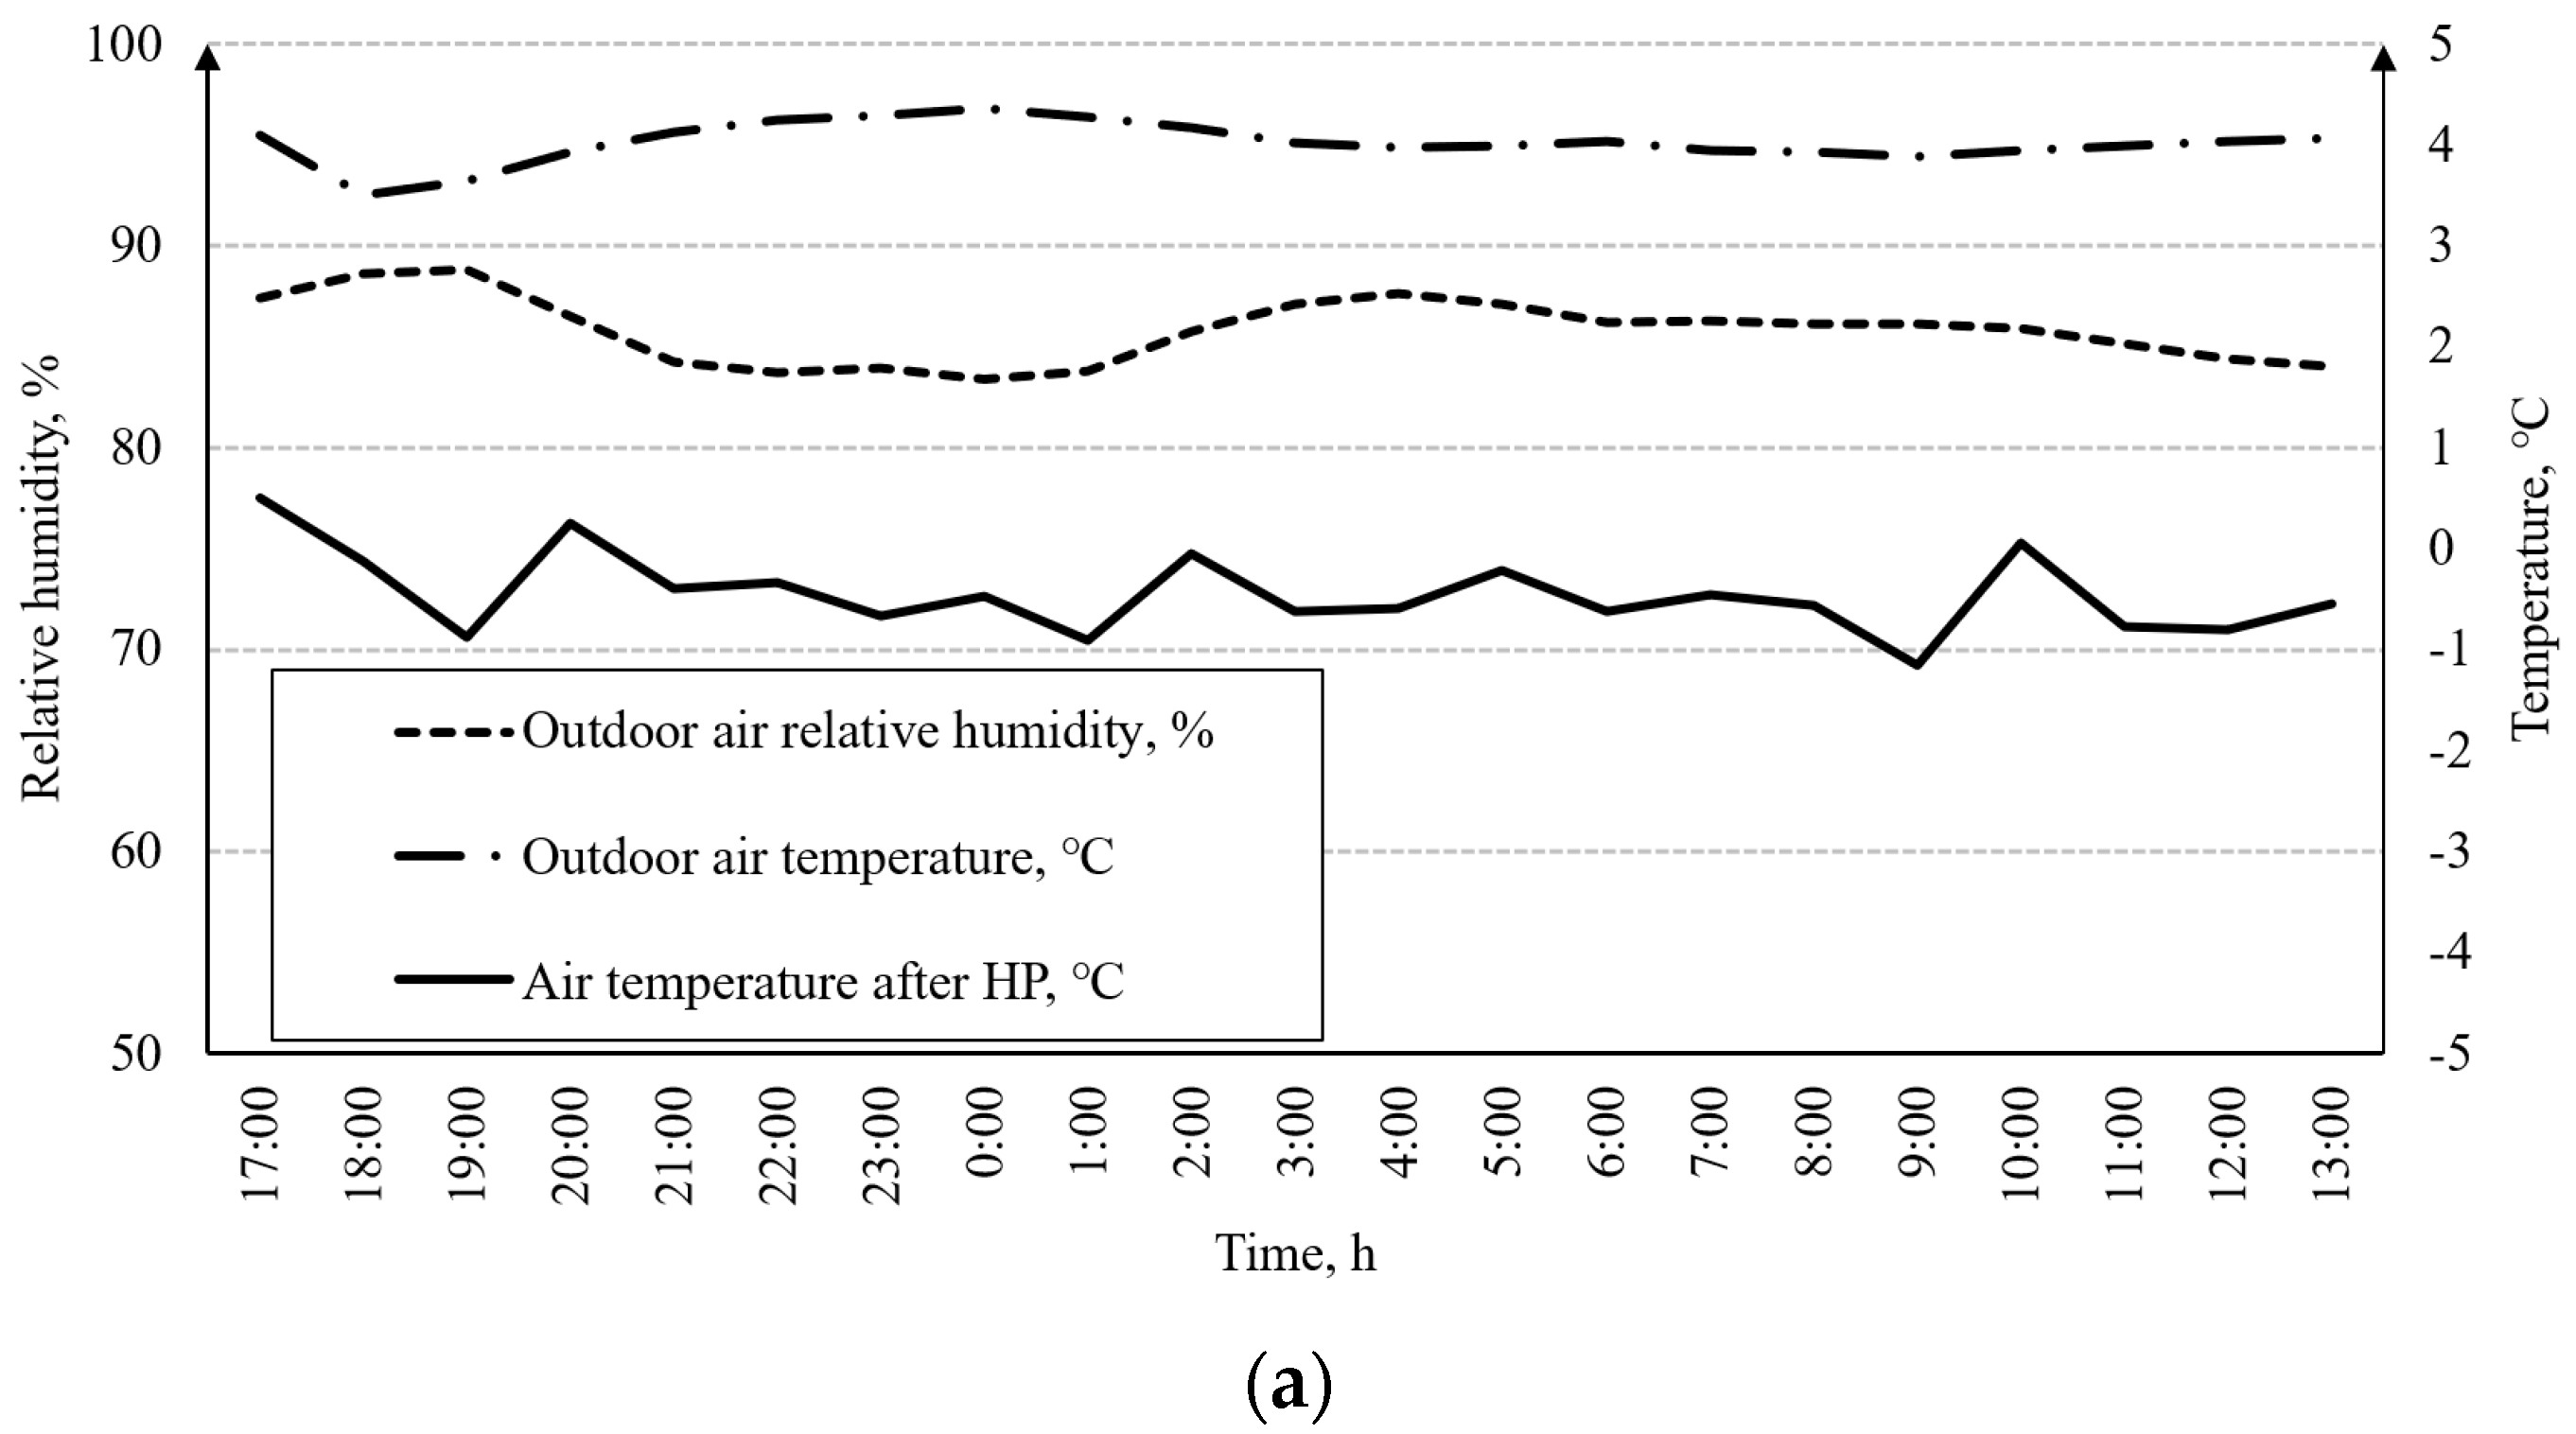
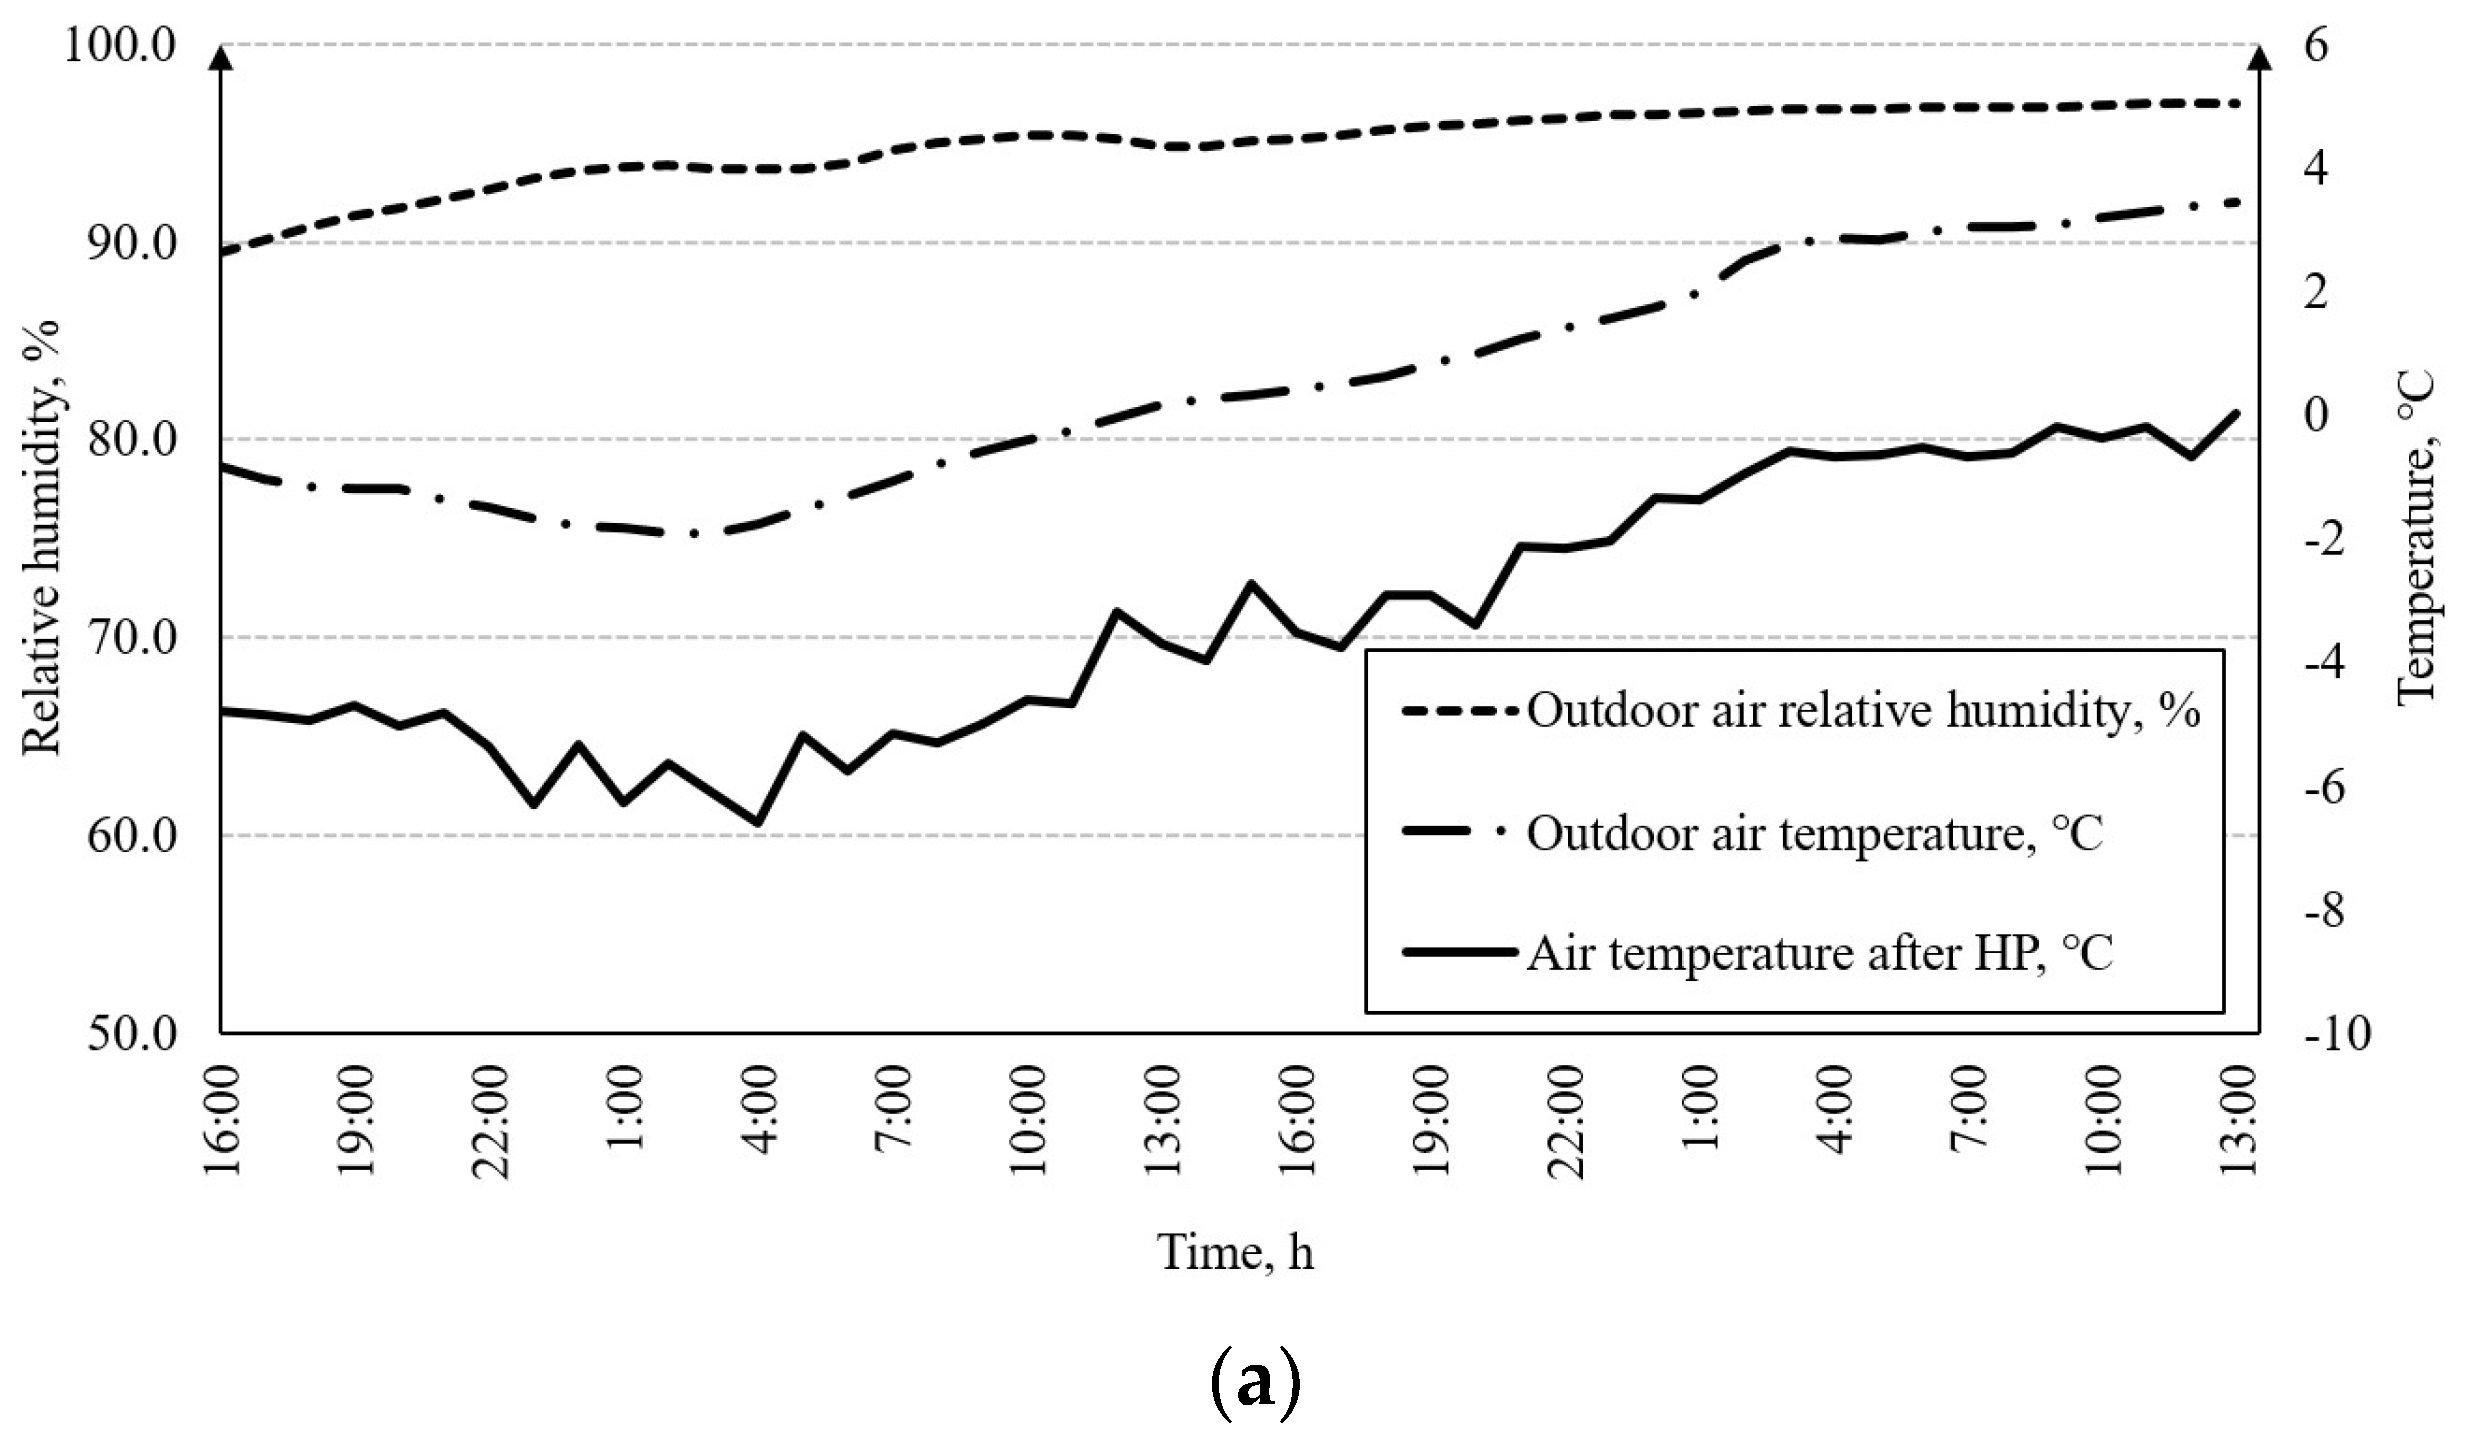
  • positive average ambient temperature (~4 °C) and average relative humidity (~86%);
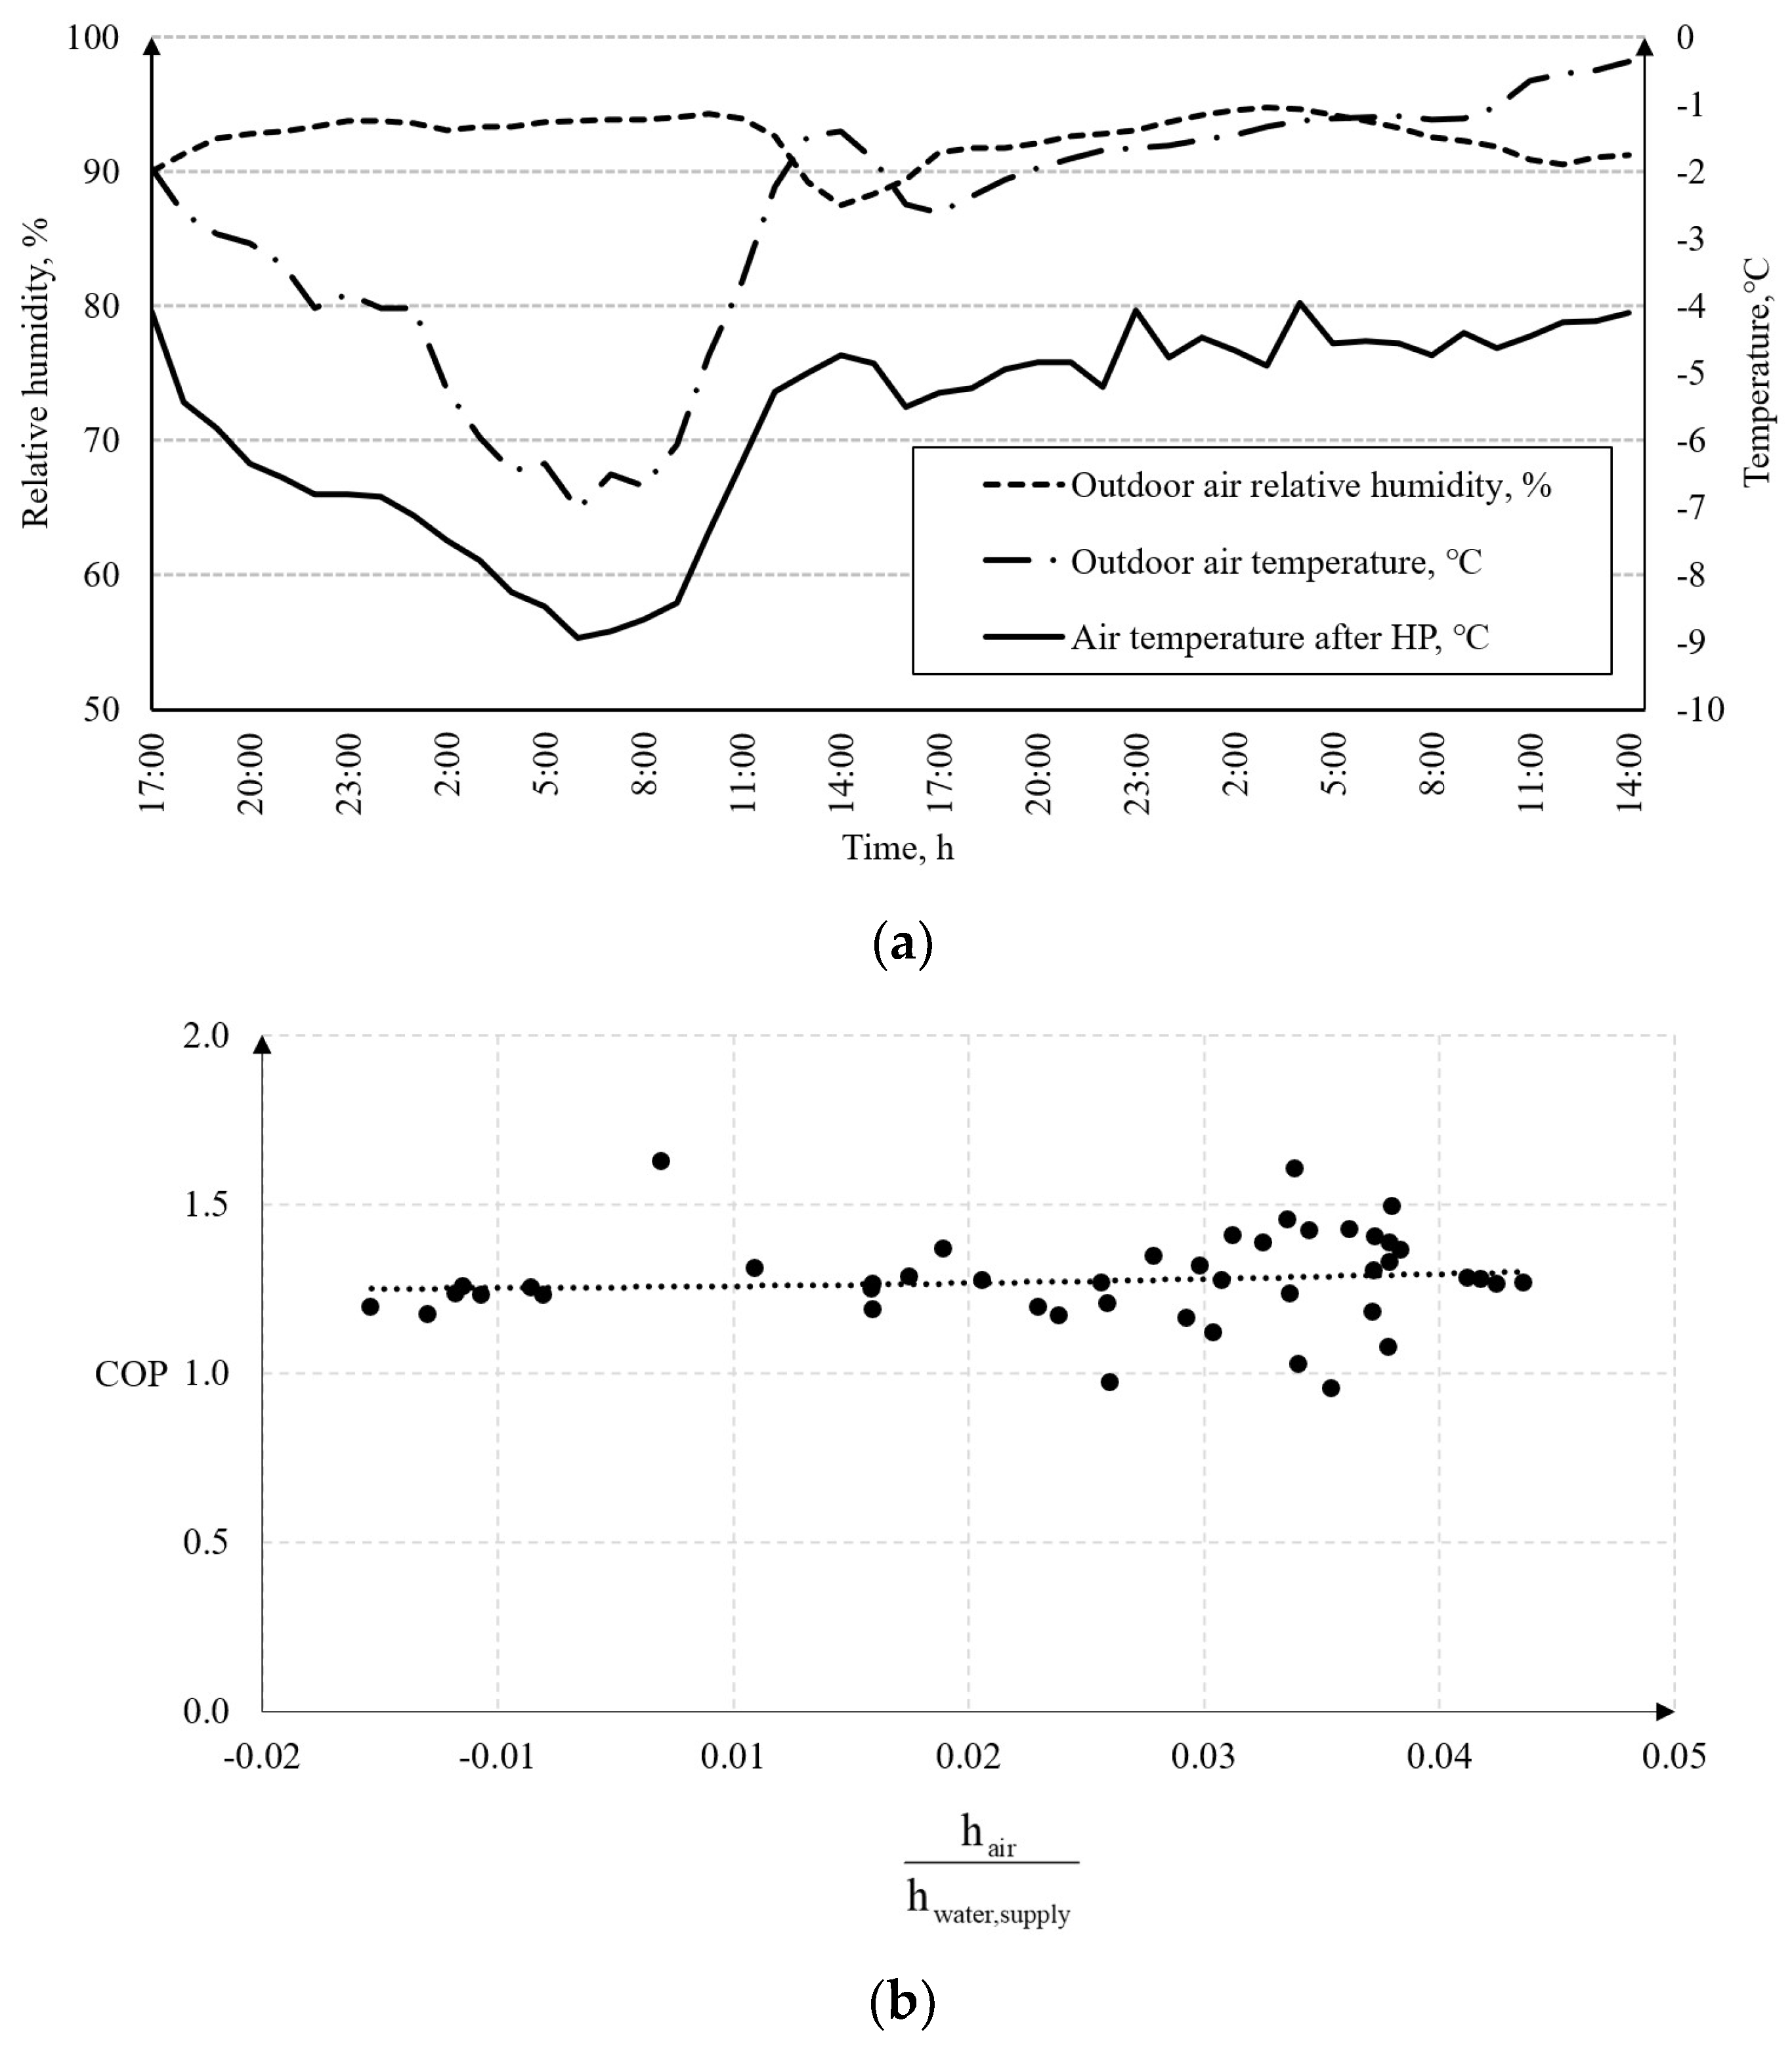
  • negative ambient temperature (from −7 to −1 °C, about −3 °C) and average relative humidity (~93%);
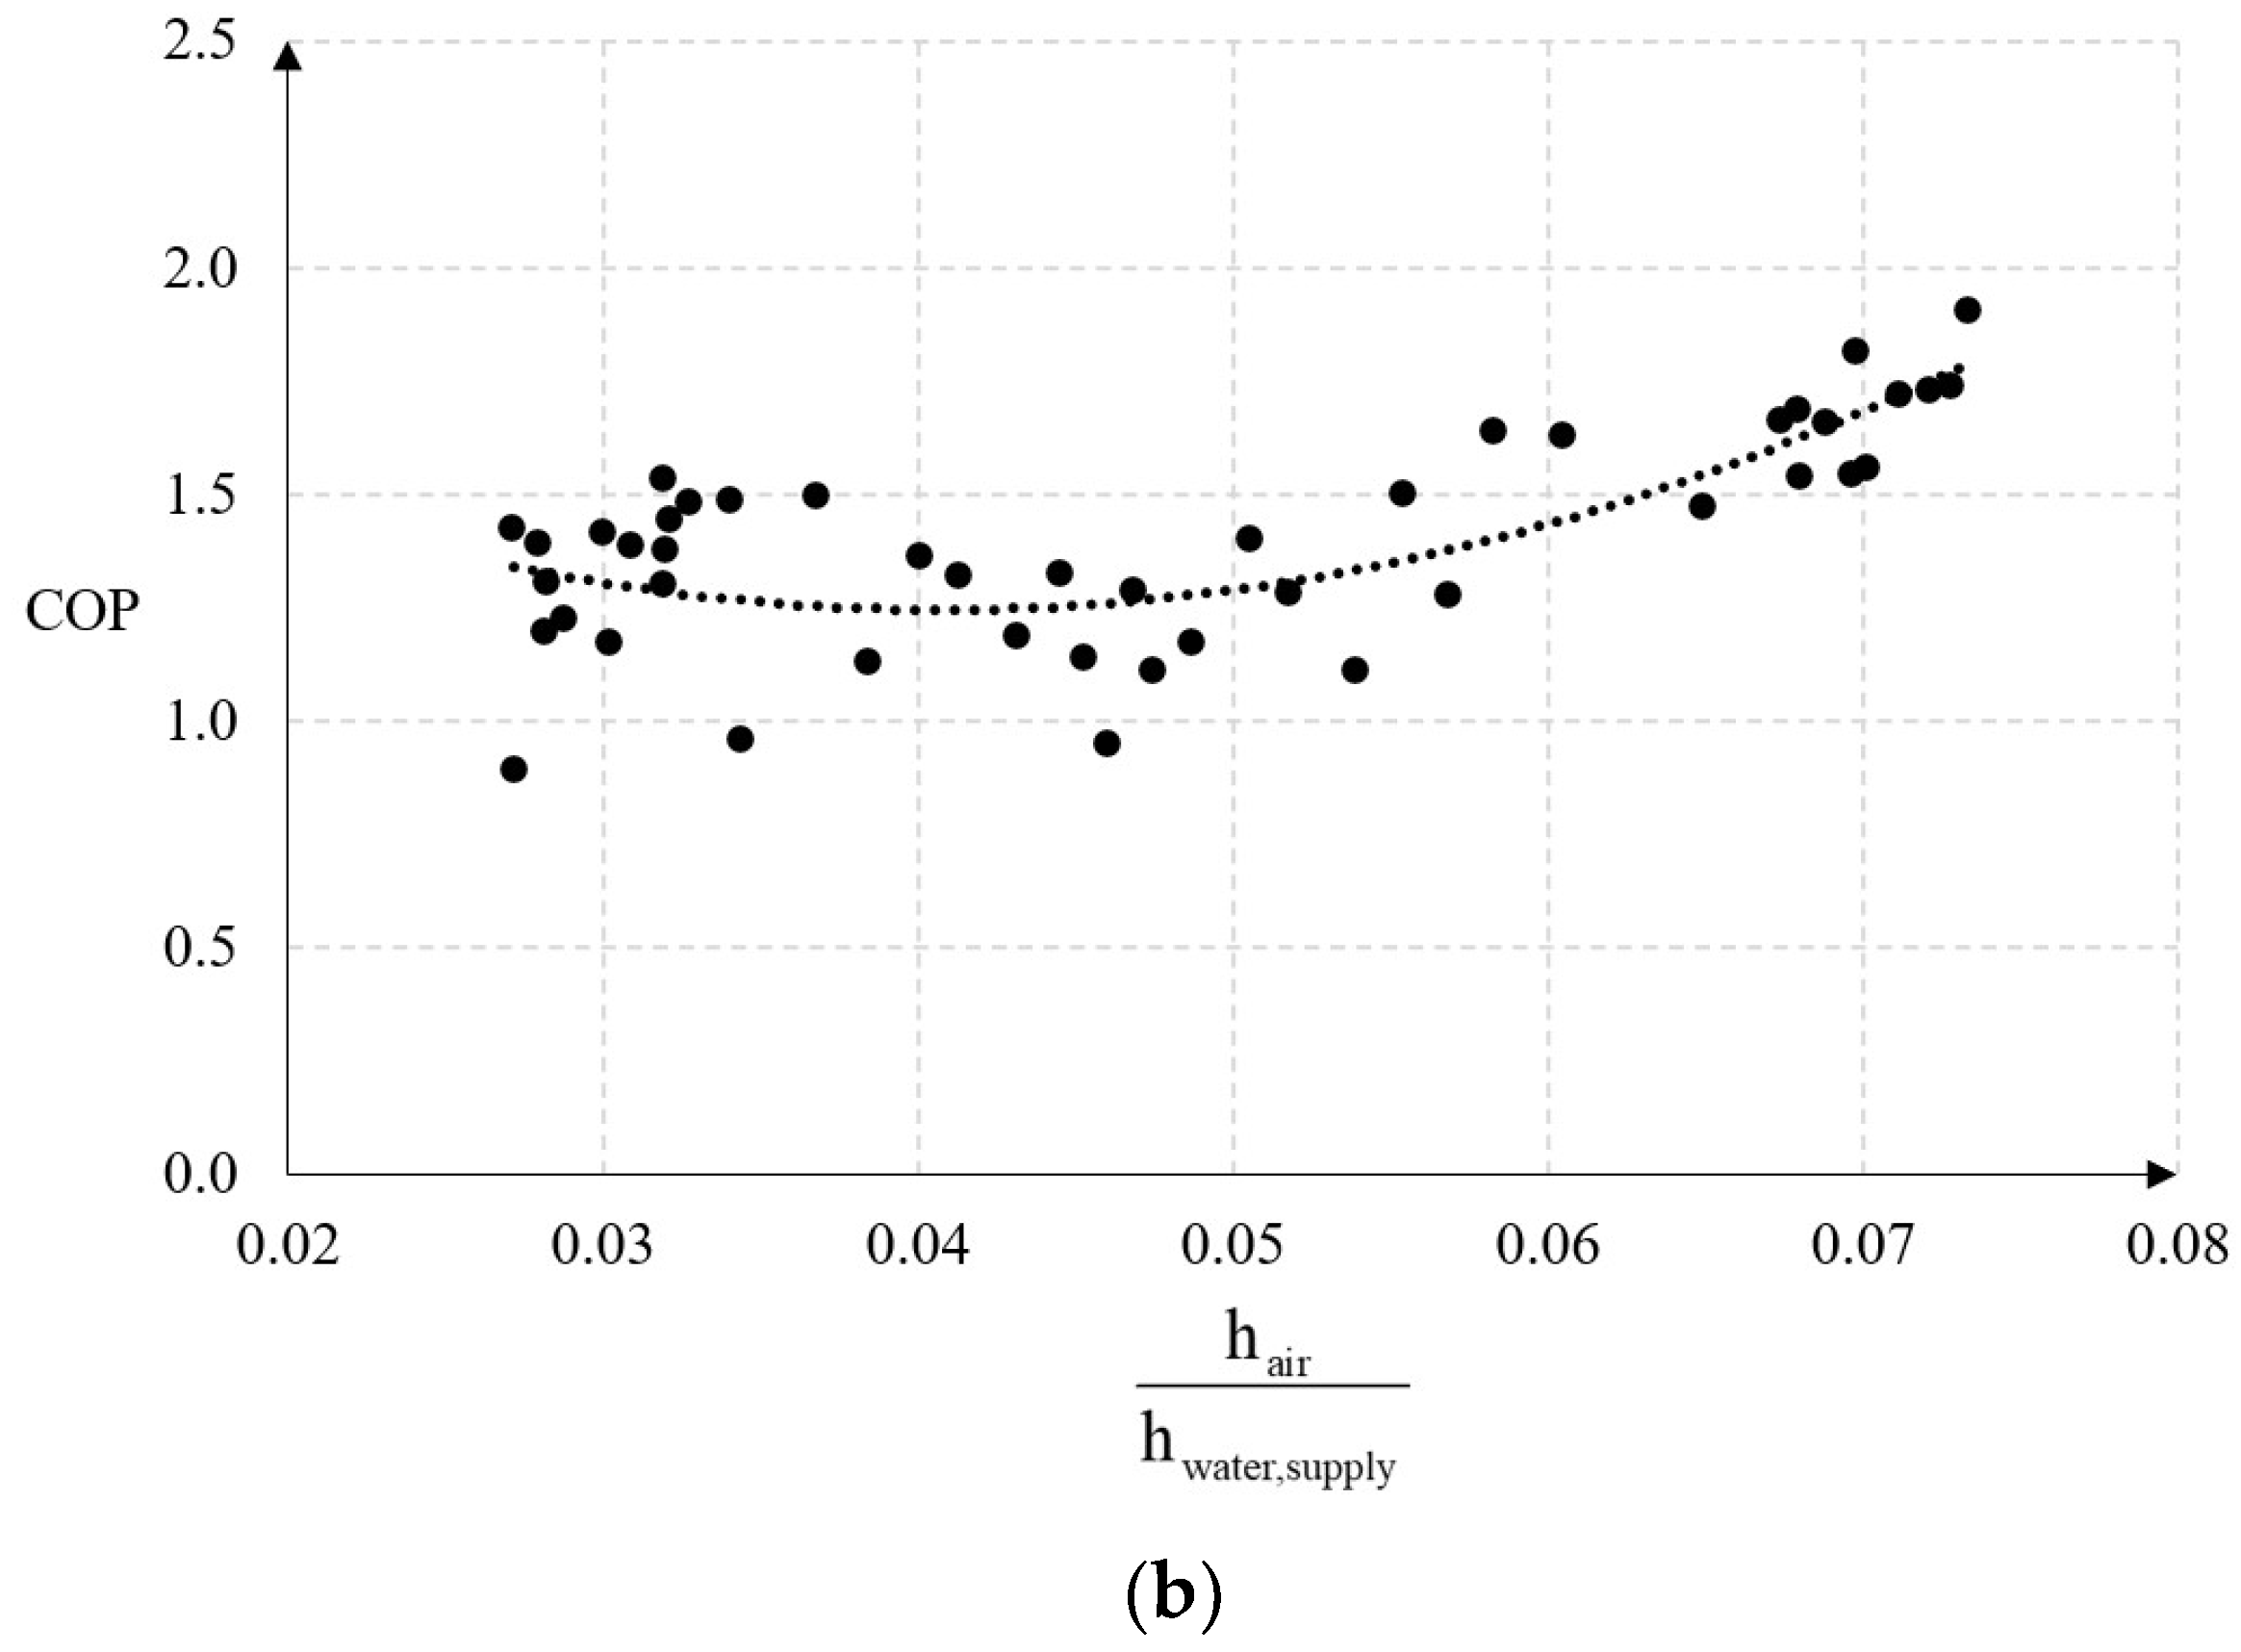
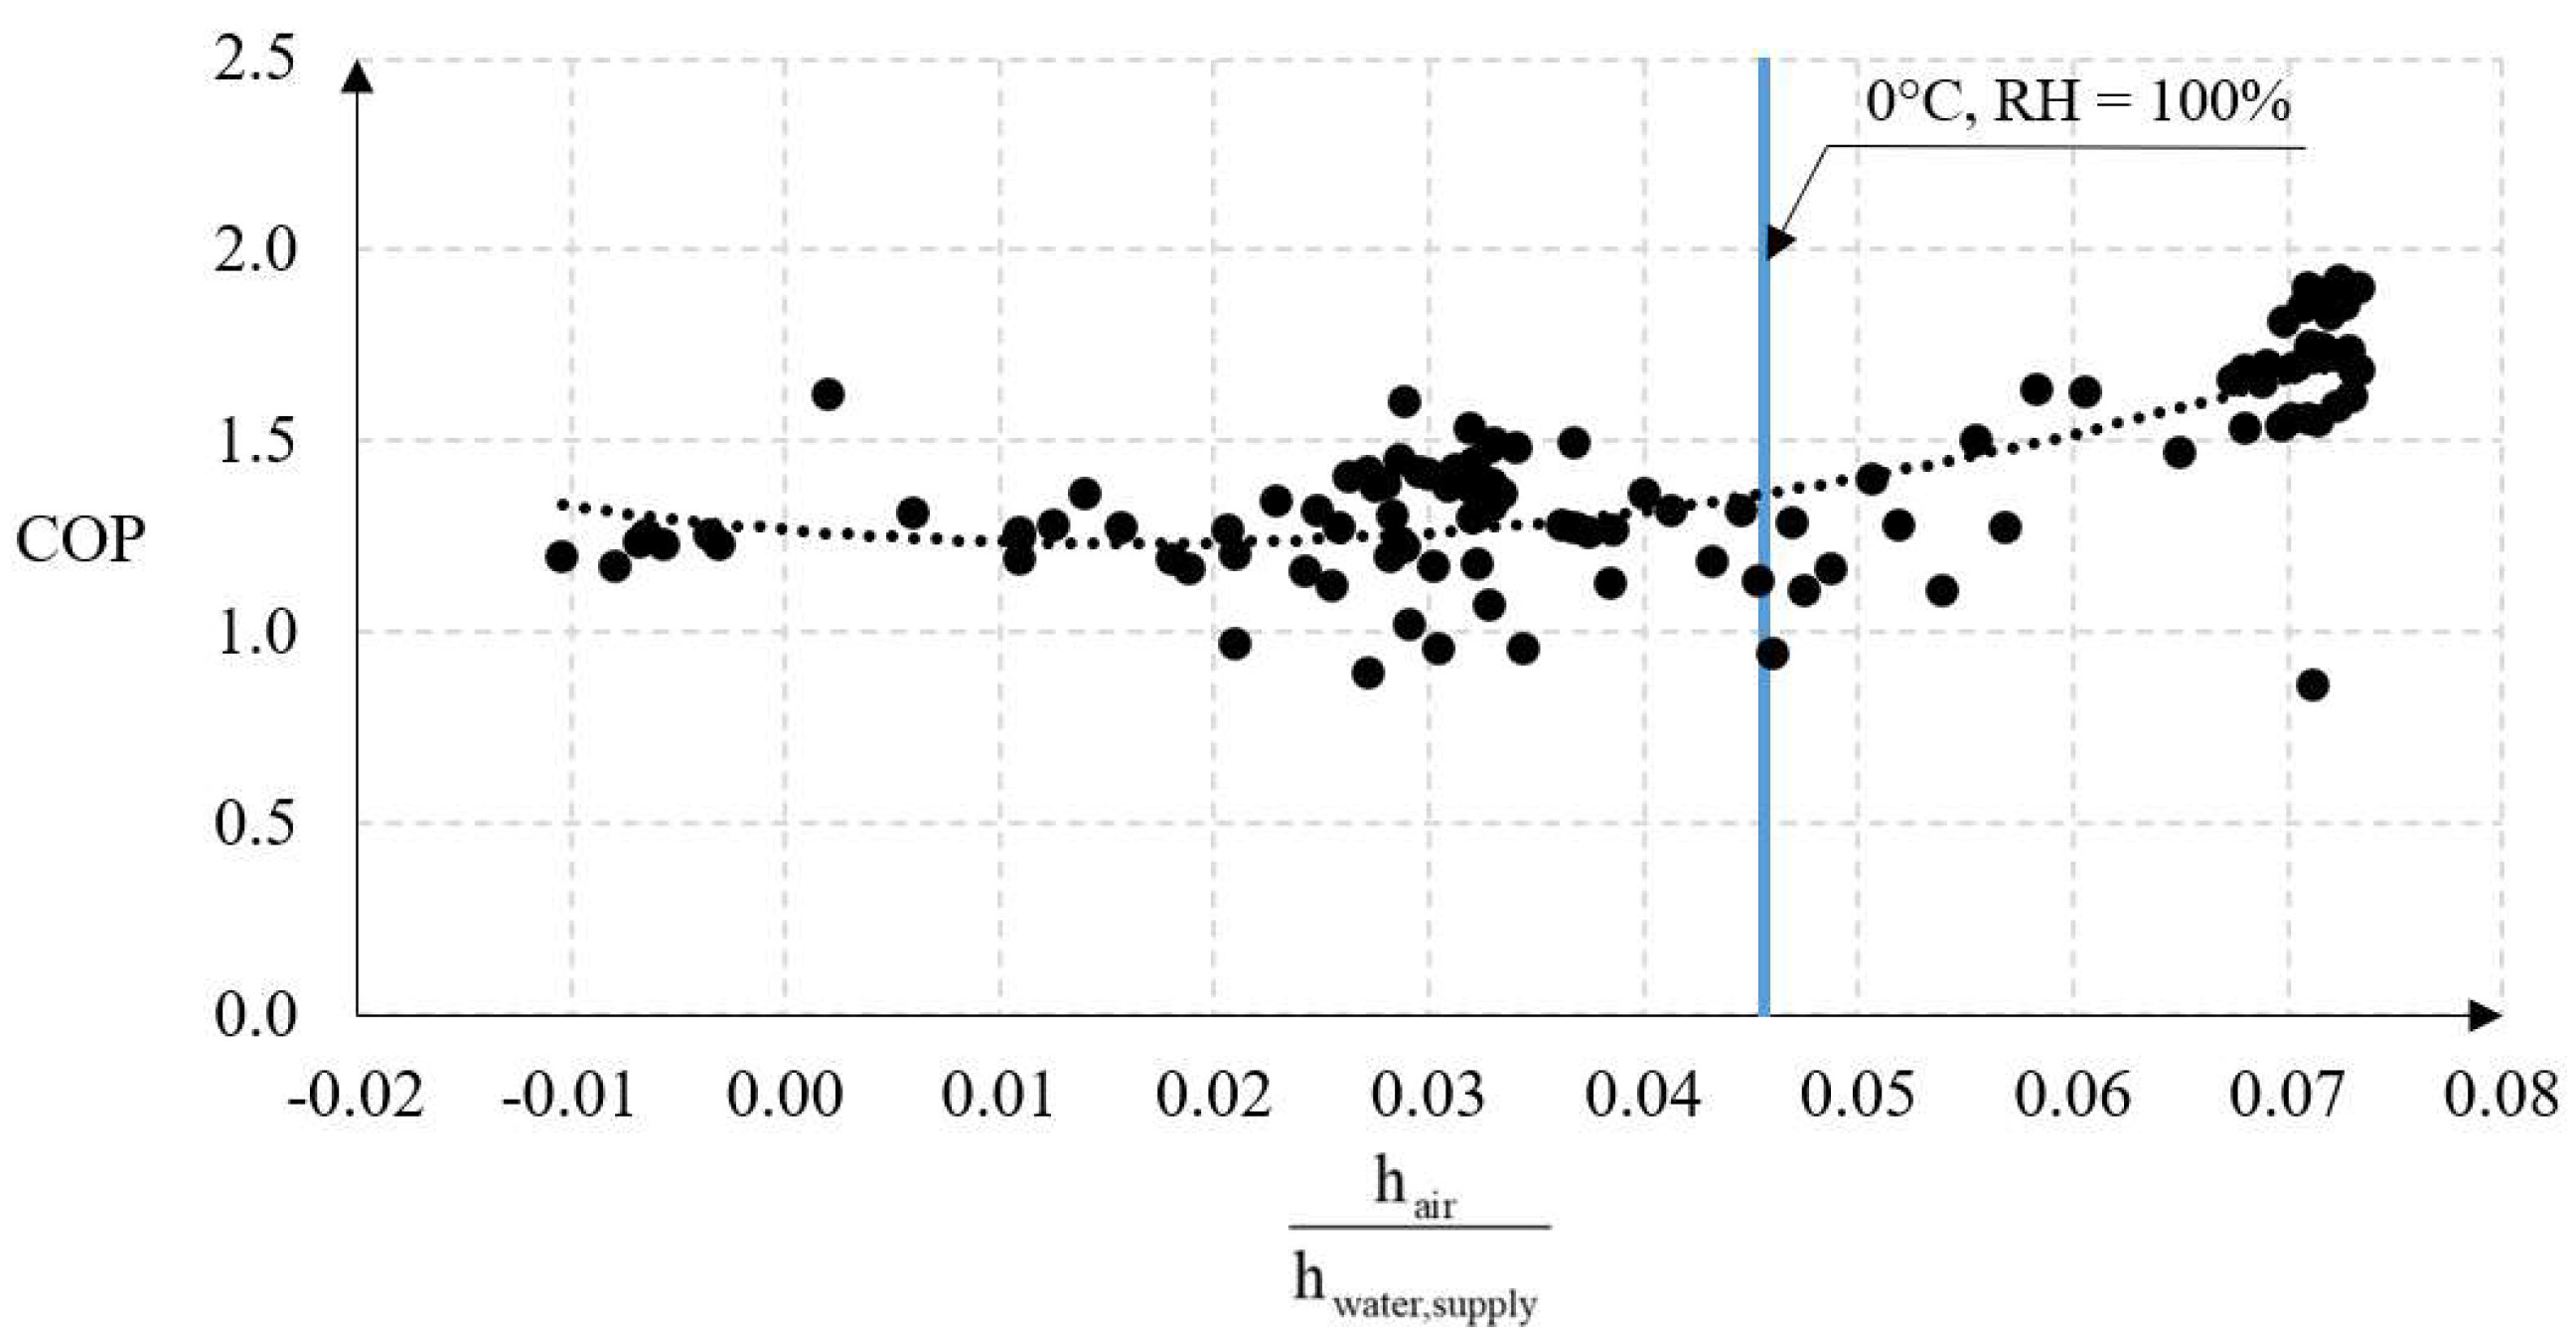
  • average temperature about (0 °C) and average relative humidity (~95%).
During all tests, the water flow temperature in the inner circuit was set at 50 °C.
The raw data obtained from the measuring equipment for individual periods every 1 min are later processed as hourly average data.

3. Results and Discussion

The measurements were performed during the 2020 heating season. Three different periods were selected for deeper analysis:
from 5 p.m. on November 11 to 1 p.m. on November 12;
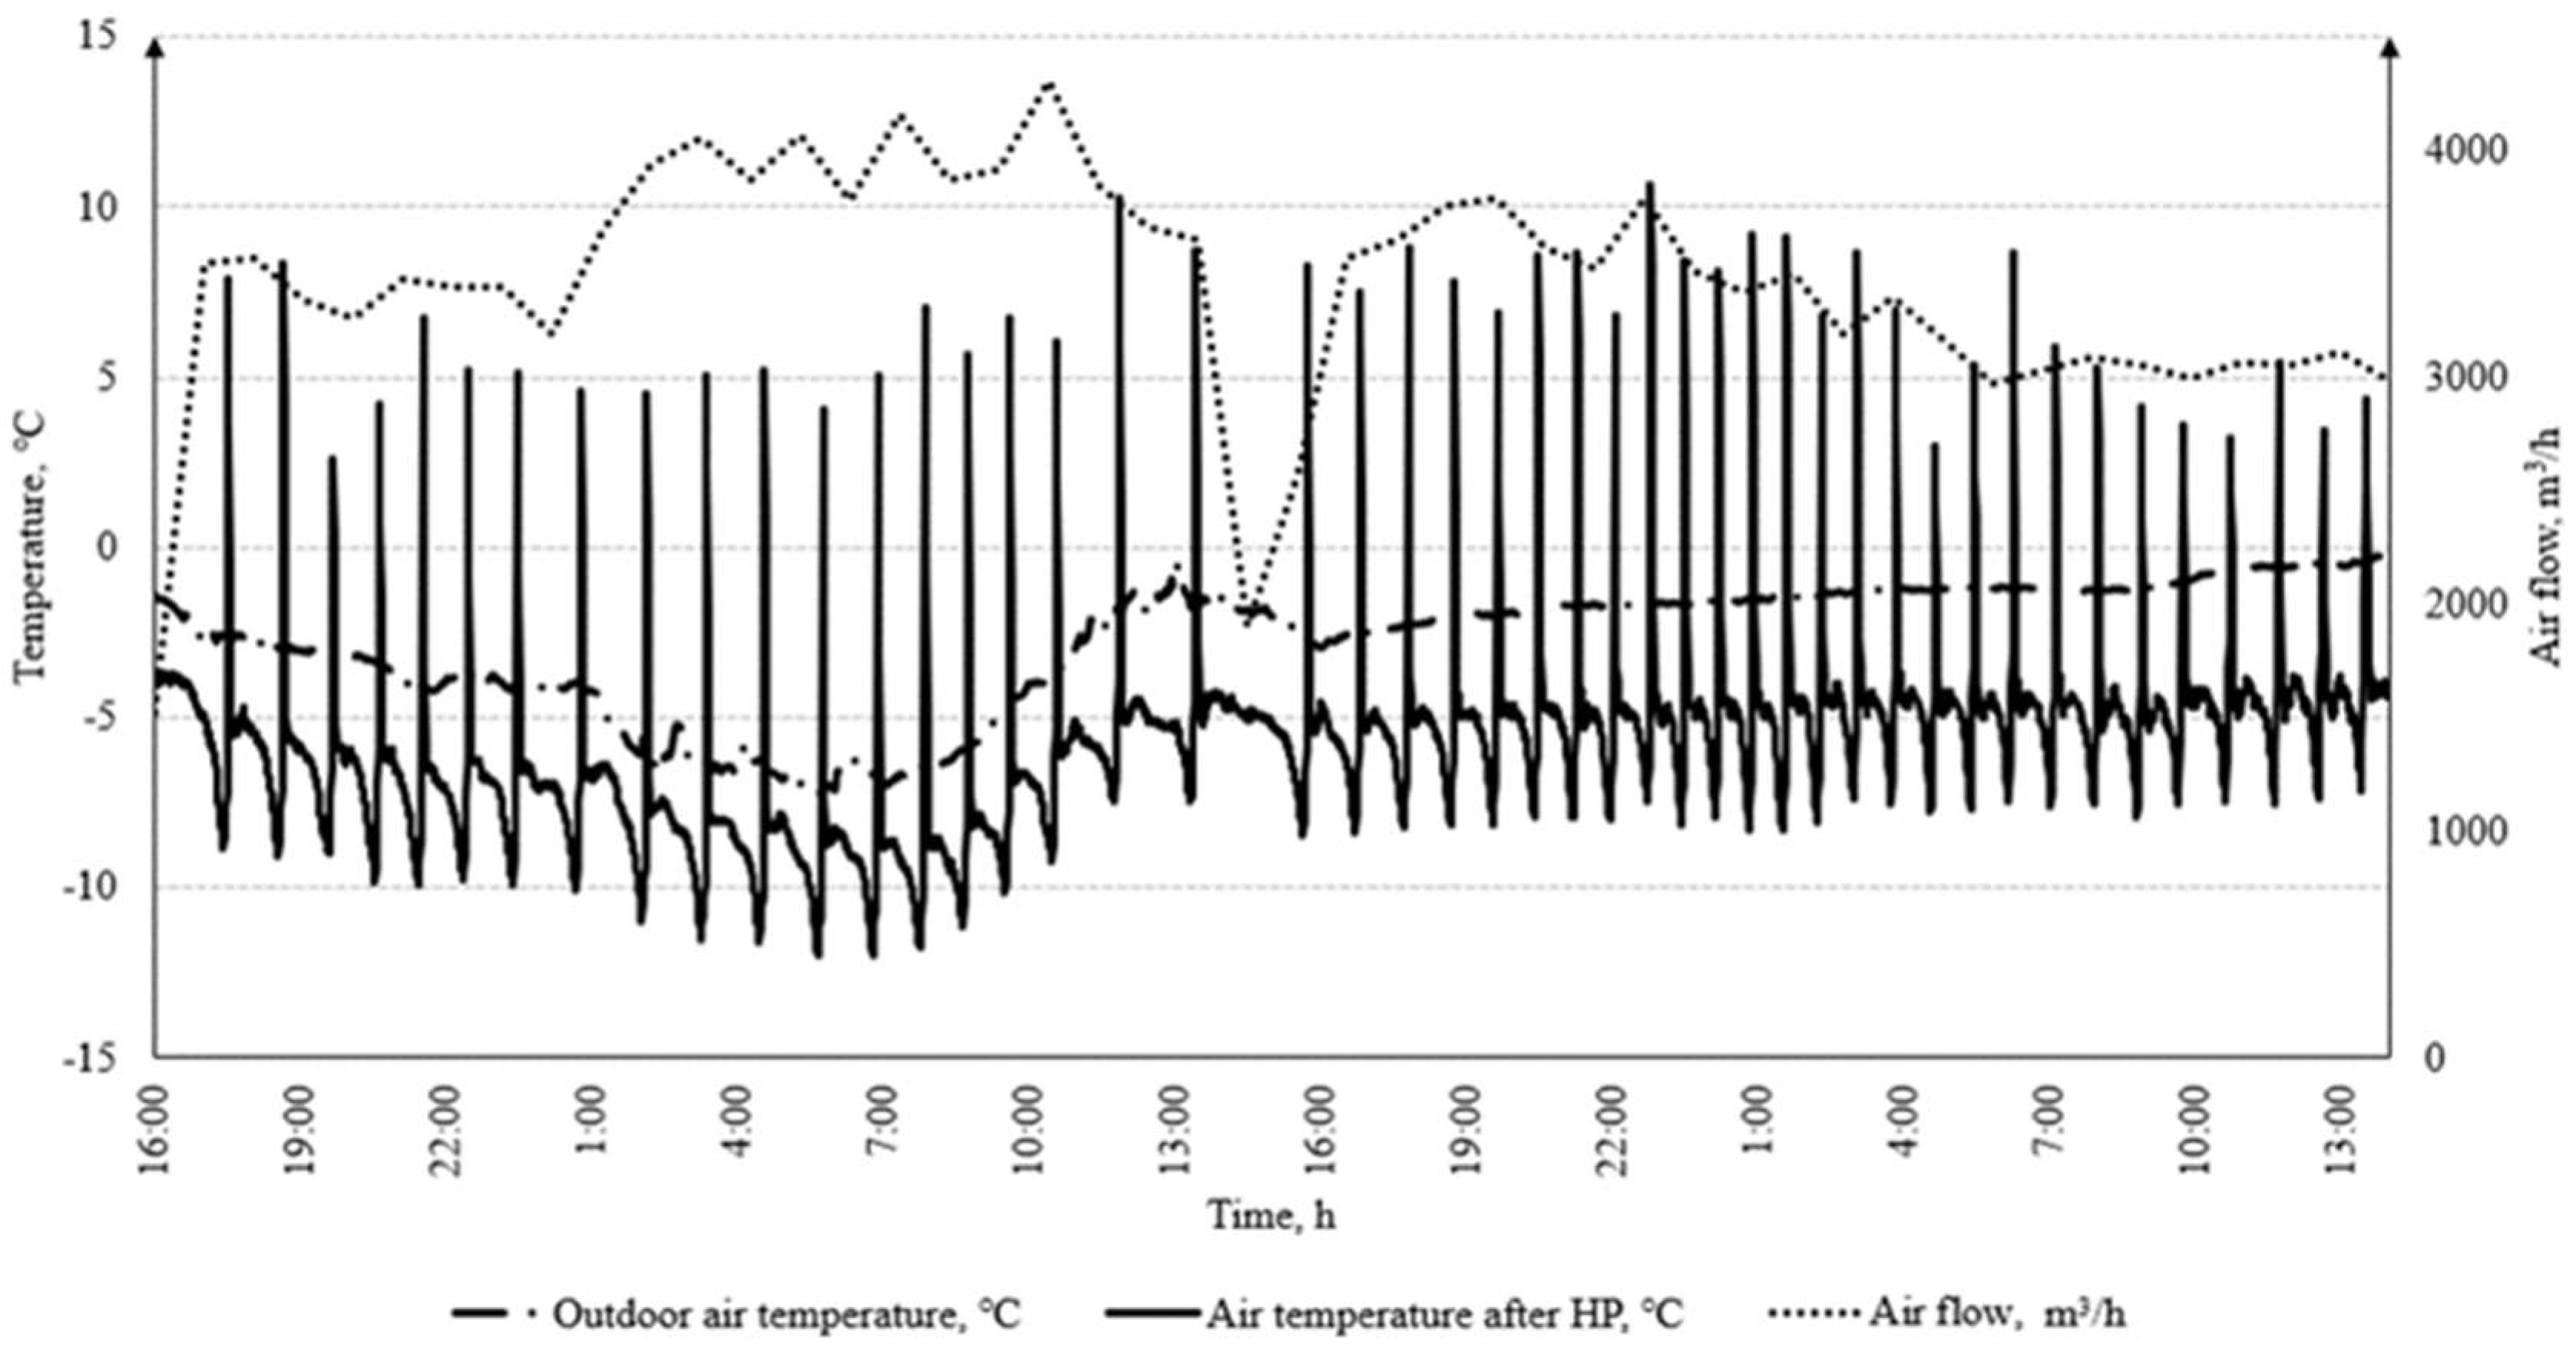
from 5 p.m. on December 1 to 2 p.m. on December 3;
from 4 p.m. on December 15 to 1 p.m. on December 17.
These time periods were chosen as the frosting process took place on the evaporator of the heat pump. In addition, defrosting processes occurred and were observed. The parameters of the supply and return water temperatures in the internal heat pump unit were set at 50 °C and 45 °C, respectively.
The first time period. During the period of November 11–12, the average ambient air temperature was 4.02 °C, the average relative humidity was recorded as 85.75%. The average air flow through the evaporator heat exchanger was 2110.77 m3/h.
During the experiment, the change in the air temperature after the evaporator heat exchanger was observed. The obtained measurement results (ambient air temperature and air flow rate, and temperature after evaporator) are presented in Figure 4 (raw data).
It can be seen that the outdoor air temperature remained almost constant during the selected period. However, the air flow temperature behind the evaporator heat exchanger fluctuated significantly and was lower than the ambient air temperature. Only the peak temperature rises that occur during the defrosting process were observed.
During that experiment, the lowest value of the air temperature after the heat pump (HP) evaporator was −3.43 °C, the highest was 13.09 °C. Such temperature fluctuations were caused by the formation of frost on the evaporator heat exchanger and defrosting process. The vapour in the air that entered the heat exchanger at a temperature below or equal to the condensing temperature condensed and then froze as the temperature dropped and covered the surface with frost and was removed—a defrost cycle was performed, in which the heat pump starts to run in a reverse cycle to dissolve the frost that has formed on it. The largest temperature difference between the ambient air temperature and the air temperature with the heat exchanger was 9.09 °C. In addition, Figure 4 shows that the frost–defrost cycle of the heat exchanger occurred 11 times during the period covered by the analysis, which means that, on average, complete freezing occurred 0.52 times per hour. Moreover, Figure 4 presents the variation in the air flow sucked in through the evaporator. The air flow increased with the frost thickness and was reduced as defrosting took place. The temperature change cycle did not quite match the air flow change cycle, as the latter cycle was more inert and changed more slowly than the heat exchanger temperature during defrosting.
The defrost cycle of the frozen evaporator is shown in Figure 5. The same cycle was performed during each defrost. On average, it took about 5 min. The same average defrost time was obtained in other experiments. The defrost cycle remained the same, regardless of the ambient air parameters—only its frequency changed.
Figure 6a shows ambient air temperature, relative humidity and temperature after ASHP evaporator during the first time period (the processed hourly average data); (b) shows the average hourly change in the COP of the ASHP as a function of the ratio of enthalpies of ambient air and water supplied to the indoor unit. During this period, the lowest relative humidity was 83.4%, and the highest value was 88.5%; the air temperature varied from 3.5 °C to 4.36 °C.
During this period, the average ASHP efficiency factor COP was 1.71. Later, the COP values at different hours were compared with the ASHP operating with or without defrost cycles. It was observed that the formation of frost on the plates of the evaporator’s heat exchanger began when the outdoor air temperature dropped to or below 3.5 °C and the relative humidity reached 88%. The average hourly efficiency was found to be 1.62 during the hours when defrosting was performed. Accordingly, the average hourly efficiency was found to be 1.81 during the hours when defrosting was not required. Thus, it is concluded that the freezing of the heat exchanger, the frosting of its surface reduces the heat transfer, disrupts the normal operating cycle of the ASHP and reduces its COP by 10.74%. The measurements have shown the COP to fall below 1 in some of the cases. This phenomenon was observed only during periods when the heat exchangers defrost process took place, and the normal operation of the ASHP was distorted. During defrosting, the heat was not taken from the environment but was given to it.
The second time period. During the period of December 1–3, the average ambient air temperature was −2.80 °C (varied from −7.03 °C to −0.37 °C), the average relative humidity was 92.54% (varied from 90.0% to 94.8%) (see Figure 7 and Figure 8). The average air flow through the evaporator‘s heat exchanger was 3404.51 m3/h. Similar to the first period, changes in the air temperature after the evaporator heat exchanger were observed. The obtained measurement results and their comparison with the ambient air temperature and the change of air flow during the experiment are presented in Figure 7 (raw data).
We can see in Figure 7 that the outdoor air temperature rose during this period, but the air flow temperature after the evaporator’s heat exchanger fluctuated significantly and was lower than the ambient air temperature. Such temperature fluctuations were caused by the formation of frost on the evaporator’s heat exchanger. The resulting frost had a negative effect on the heat exchange and acted as an insulating material. The refrigerant (Freon) circulating in the evaporator could not take the required energy from the ambient air and evaporate, so the ASHP lowered the evaporation temperature in order to increase the temperature difference between the ambient air and the evaporator temperature for more intensive heat exchange. As with the first experiment, the temperature peaked out during the defrosting process; when the heat pump started to run in a reverse cycle, hot Freon was directed to the evaporator heat exchanger to melt the frost. During the experiment, the lowest recorded air temperature after the evaporator was −11.97 °C, the highest value was 10.67 °C. Such temperature fluctuations were caused by the formation of frost on the evaporator and its defrosting cycles. The largest temperature difference between the ambient air temperature and the air temperature with the heat exchanger was 13.48 °C. Figure 7 shows that the frosting–defrosting cycle of the heat exchanger occurred 46 times during that time period. This means that, on average, complete freezing occurred once per hour. The flow of extracted air through the evaporator increased with the frost thickness and was also reduced during defrosting.
Figure 8a shows ambient air temperature, relative humidity and temperature after ASHP evaporator during the second time period (the processed hourly average data); (b) shows the average hourly change in the COP of the ASHP as a function of the ratio of enthalpies of ambient air and water supplied to the indoor unit.
During the second time period, the average ASHP COP was 1.28. Defrost cycles were averaged hourly during this experiment. Therefore, it was impossible to compare COP hours with or without defrost cycles. In the first experiment, the mean hourly efficiency was about 1.6 h during the defrost cycles. Therefore, the ASHP COP of the second time period was 20.99% lower compared to the first time period considered. This was due to the lower average air temperatures and the higher humidity, as well as double the frequency of frosting and defrosting cycles.
As shown in Figure 8b, we can see that the ratio of enthalpies depends directly on the ambient air parameters: the temperature and the relative air humidity, and this reflects in the air enthalpy since the enthalpy of the water supplied was constant. A direct dependence between the COP and the enthalpy ratio is obtained. As the enthalpy ratio decreases, so does the COP; by analogy, as the enthalpy ratio increases, the COP of the heat pump also grows.
The third time period. During the period of December 15–17, the average ambient air temperature was 0.51 °C, the average relative humidity was 94.90% (Figure 9 and Figure 10). The average air flow through the evaporator’s heat exchanger was 2811.32 m3/h. The measurement results obtained and their comparison with the ambient air temperature and the change of air flow during the experiment are presented in Figure 9 (raw data).
From Figure 9, we can see that the air temperature rose from −1.96 °C to 3.7 °C; however, the air flow temperature after the evaporator’s heat exchanger fluctuated significantly and was lower than the ambient air temperature. As during the first and second experiments, only the peak temperature rises that occurred during the defrosting process were distinguished. During this test, the lowest value of the air temperature after the ASHP was −8.95 °C, the highest value reached 15.1 °C. Such temperature fluctuations were caused by the formation of frost on the evaporator’s heat exchanger and its defrosting cycles. The largest temperature difference between the ambient air temperature and the air temperature with the heat exchanger was 11.80 °C. The Figure shows that the frosting-defrosting cycle of the heat exchanger occurred 54 times during this time period; this means that, on average, complete freezing occurred 1.17 times per hour. The flow of extract air through the evaporator increased with growing frost thickness and was also reduced during the defrosting. This indicates that at higher air temperatures, a lower air flow is required to ensure the same heat carrier parameters.
Figure 10a shows ambient air temperature, relative humidity and temperature after ASHP evaporator during the third first time period (the processed hourly average data); (b) shows the average hourly change in the COP of the ASHP as a function of the ratio of enthalpies of ambient air and water supplied to the indoor unit.
During the third time period, the average ASHP COP was 1.40. Defrost cycles occurred on average more frequently than hourly during this period, so a comparison of COP hours with or without defrost cycles was not possible. In the first experiment, the mean hourly efficiency was 1.6 h during the defrost cycles. Therefore, the COP of the third period was 13.58% lower compared to the first period considered. This was due to lower average air temperatures and higher humidity, as well as twice the frequency of frosting and defrosting cycles.
The results show that in all cases, there is a relationship between the COP and enthalpies ratio. This would allow to evaluate and plan the performance of such heat pump under changed conditions, e.g., outdoor air temperature or supply water temperature. All results are compared in Figure 11. The temperature of supply water was assumed to be 50 °C.
The overall analysis of the results shows that the smallest values of COP are obtained when the ratio of enthalpies was between 0.01 and 0.06. During this period, most defrost cycles were recorded. At low ambient air temperatures, the ratio of enthalpies was negative and the absolute humidity decreased, although relative humidity was very high (>80%) at the same time. This reduced the number of defrost cycles, and the COP slightly increased. In addition, a limit case when the ambient temperature is 0 °C and relative humidity 100% is shown in Figure 11. Under these conditions, it can be seen that freezing and defrosting processes could often be encountered. Such adverse conditions lasted up to −5 °C at high relative humidity. All measurements were performed in Vilnius city, where the average temperature of the heating season is −1.2 °C, and the relative humidity is high. This shows that the selection and assessment of the ASHP must be particularly careful in such locations.
The results reveal that the selected enthalpy ratio allows measuring how the selected heat pump would operate under different climatic conditions, e.g., at lower or higher temperatures. In addition, the enthalpy ratio analysis could be used to analyse other heat pumps or for different temperatures of water supplied. Such an approach could help in the planning and evaluating of equipment performance.
The obtained investigation results were reviewed and compared with the frosting map prepared by Zhu et al. [32]. According to the frosting map zones, the average parameters of all three periods fall into the moderate frosting zone. The results of the experiment confirmed that, on average, in this zone, ASHP reference defrosting interval is 45–90 min. Moreover, the results were consistent with the results of the previous studies when the evaporator was freezing impaired heat transfer processes [5] and reduced energy efficiency [6]. The three test/representative periods showed that the ASHP COP decreases as the ambient temperature decreases and the humidity increases, and vice versa: as the ambient temperature rises and the humidity decreases. At higher air temperatures, the air flow required by the evaporator also decreases.
There are many different ways and measures to reduce the problem of ASHP evaporator freezing, and some of them still require further in-depth research work, e.g., system and component optimisation, new material, control strategy optimisation, frost retarding methods. Future work and further research will carry out the analysis of long-period measurements and integration of ASHP and solar thermal technologies combination. Unglazed transpired solar collector’s (UTSC) influence on frost formation reduction in ASHP application will be investigated. Based on the results of this study, a UTSC assisted ASHP performance would be assessed.

4. Conclusions

The popularity of air-source heat pump installations in cold and temperate climates drives the need to assess the impact of climatic conditions on the operation of this kind of equipment: its efficiency. The article experimentally and visually examines the effect of the air source heat at negative, about 0 °C, and positive ambient air temperatures when there is a risk of the heat pump evaporator freezing. Experiments with the case study have shown that:
  • Frost formation on the evaporator’s heat exchanger plates started when the outdoor air temperature was below 3.5 °C, and the relative humidity reached 88%;
  • The frozen evaporator’s defrost cycle took an average of 5 min. The defrost cycle remained the same during the different experiments, regardless of the ambient air parameters, and only its frequency varied:
    0.52 times per hour with an average ambient temperature of 4.02 °C, and average relative humidity of 85.75%;
    once per hour, when the average ambient air temperature was −2.80 °C, and average relative humidity was 92.54%;
    1.17 times per hour with an average ambient temperature of 0.51 °C, and average relative humidity of 94.90%.
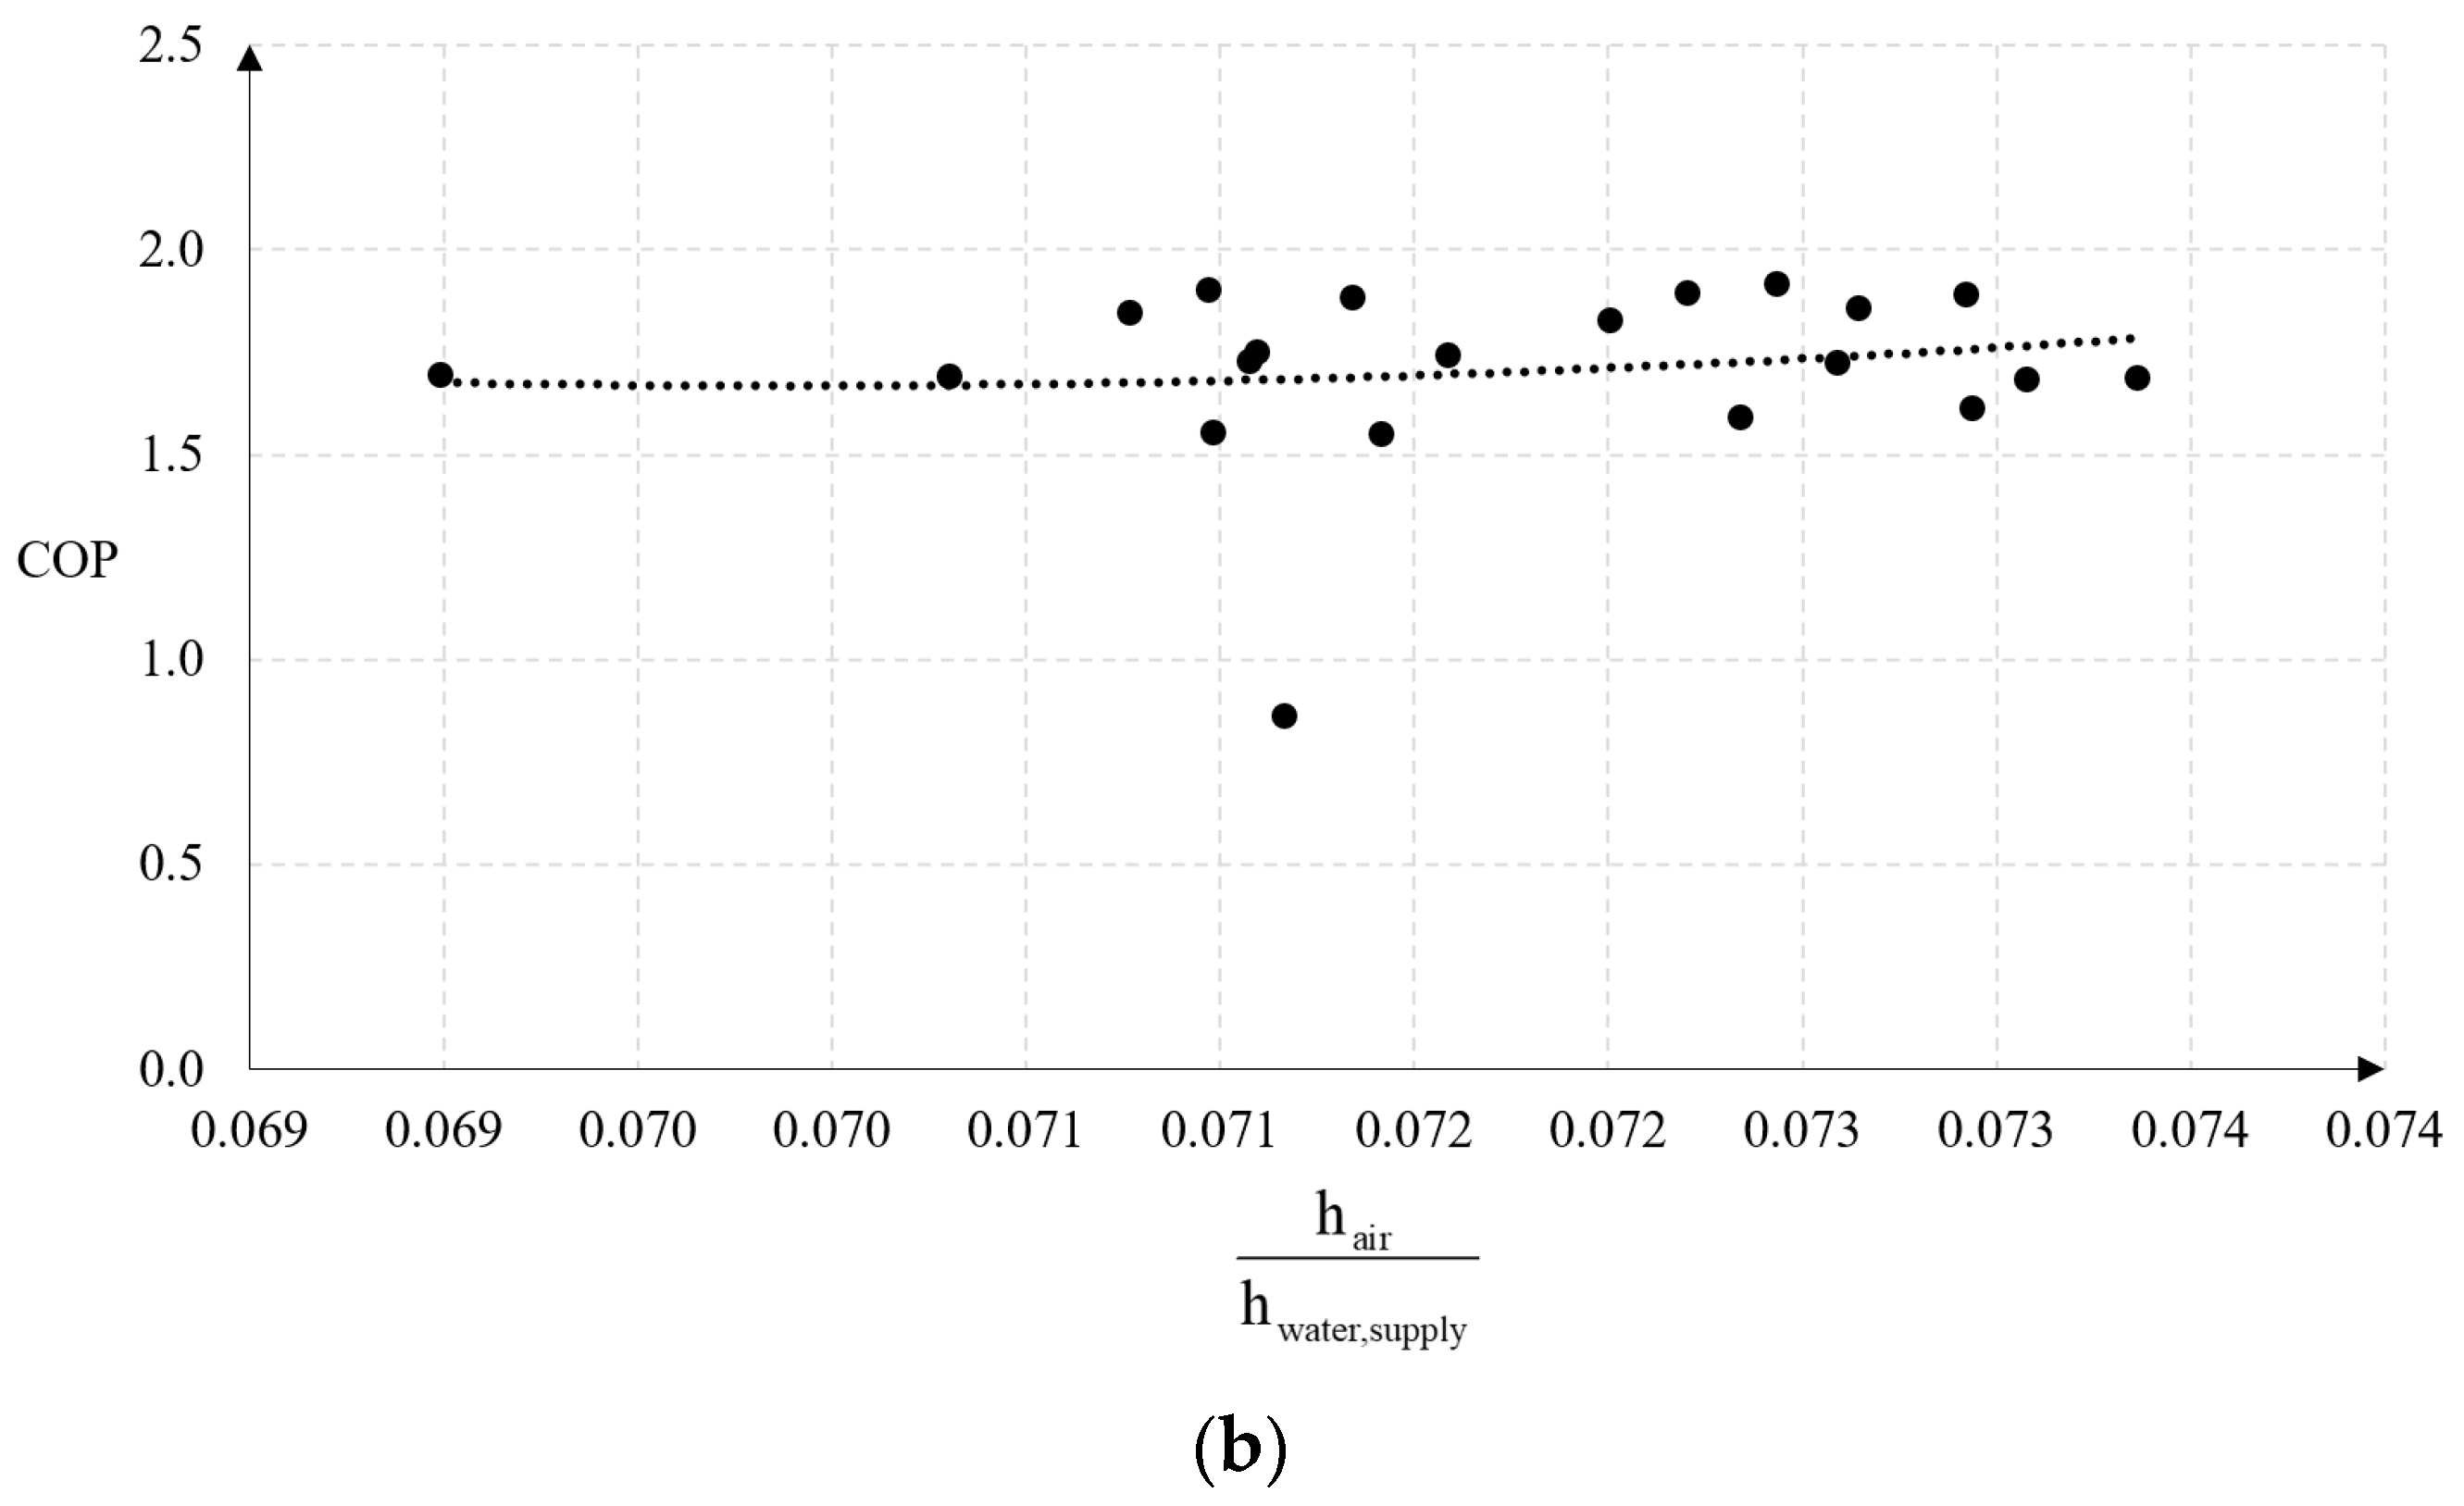
  • The specific HP COP values and their reduction in the case of evaporator freezing were assessed in detail based on the ASHP performance data. The frost and defrost process alone reduced the COP by 10.74% compared to the same period as the evaporator froze, but the defrost process did not occur. In other cases (at lower outdoor temperatures and high relative humidity), the COP fell even further (by up to 20.99% when the average ambient air temperature was −2.80 °C). It was confirmed that the freezing of the heat exchanger and the frosting of its surface impairs heat transfer to and from the environment, disrupting the normal operating cycle of the heat pump;
  • During the experiments, the dependence of the extracted air flow on the ambient air temperature was observed. The average air flow rate was found to decrease as the ambient temperature rose. This indicates that at higher air temperatures, a lower air flow is required to ensure the same heat carrier parameters.
The experimental study shows that the existing problem of frost formation on the evaporator surface of the ASHP has still not been solved effectively. Although the manufacturers of this kind of equipment often provide COP values at appropriate ambient and heat carrier temperatures, any values of relative air humidity are often not included. Therefore, further research is needed in this area with the inclusion of more variables in order to evaluate the efficiency of the equipment and extend its functionality.

Author Contributions

Conceptualisation, T.K. and G.S.; methodology, T.K. and J.B.; formal analysis, T.K.; investigation, T.K.; resources, J.B.; data curation, T.K. and J.B.; writing—original draft preparation, T.K. and G.S.; writing—review and editing, G.S.; visualisation, T.K. and G.S.; supervision, G.S. All authors have read and agreed to the published version of the manuscript.

Funding

This research received no external funding.

Institutional Review Board Statement

Not applicable.

Informed Consent Statement

Not applicable.

Data Availability Statement

The data presented in this study are available on request from the corresponding author.

Conflicts of Interest

The authors declare no conflict of interest.

References

  1. Wei, W.; Skye, H.M. Residential net-zero energy buildings: Review and perspective. Renew. Sustain. Energy Rev. 2021, 142, 110859. [Google Scholar] [CrossRef]
  2. Hewitt, D.; Coakley, S. Transforming our buildings for a low-carbon era: Five key strategies. Electr. J. 2019, 32, 106624. [Google Scholar] [CrossRef]
  3. Paiho, S.; Pulakka, S.; Knuuti, A. Life-cycle cost analyses of heat pump concepts for Finnish new nearly zero energy residential buildings. Energy Build. 2017, 150, 396–402. [Google Scholar] [CrossRef]
  4. Wang, F.; Zhao, R.; Xu, W.; Huang, D.; Qu, Z. A heater-assisted air source heat pump air conditioner to improve thermal comfort with frost-retarded heating and heat-uninterrupted defrosting. Energies 2021, 14, 2646. [Google Scholar] [CrossRef]
  5. Li, Z.; Wang, W.; Sun, Y.; Wang, S.; Deng, S.; Lin, Y. Applying image recognition to frost built-up detection in air source heat pumps. Energy 2021, 233, 121004. [Google Scholar] [CrossRef]
  6. Zhang, Y.; Zhang, G.; Zhang, A.; Jin, Y.; Ru, R.; Tian, M. Frosting phenomenon and frost-free technology of outdoor air heat exchanger for an air-source heat pump system in China: An analysis and review. Energies 2018, 11, 2642. [Google Scholar] [CrossRef] [Green Version]
  7. Song, M.; Deng, S.; Dang, C.; Mao, N.; Wang, Z. Review on improvement for air source heat pump units during frosting and defrosting. Appl. Energy 2018, 211, 1150–1170. [Google Scholar] [CrossRef]
  8. Kropas, T.; Streckienė, G. Orinio šilumos siurblio šilumokaičio užšalimo mažinimo ir valdymo būdai. In Proceedings of the 23th Conference for Junior Researchers “Science—Future of Lithuanuania”, Vilnius, Lithuania, 15 May 2020; pp. 1–7. [Google Scholar]
  9. Heu, C.S.; Jang, H.; Jeon, J.; Lee, K.S.; Rip Kim, D. Recent progress on developing anti-frosting and anti-fouling functional surfaces for air source heat pumps. Energy Build. 2020, 223, 110139. [Google Scholar] [CrossRef]
  10. Su, W.; Li, W.; Sun, B.; Zhang, X. Experimental study and correlations for heat and mass transfer coefficients in the dehumidifier of a frost-free heat pump system. Int. J. Heat Mass Transf. 2019, 131, 450–462. [Google Scholar] [CrossRef]
  11. Liu, Z.; Fan, P.; Wang, Q.; Chi, Y.; Zhao, Z.; Chi, Y. Air source heat pump with water heater based on a bypass-cycle defrosting system using compressor casing thermal storage. Appl. Therm. Eng. 2018, 128, 1420–1429. [Google Scholar] [CrossRef]
  12. Wang, X.; Xia, L.; Bales, C.; Zhang, X.; Copertaro, B.; Pan, S.; Wu, J. A systematic review of recent air source heat pump (ASHP) systems assisted by solar thermal, photovoltaic and photovoltaic/thermal sources. Renew. Energy 2020, 146, 2472–2487. [Google Scholar] [CrossRef] [Green Version]
  13. Wang, F.; Liang, C.; Zhang, X. Research of anti-frosting technology in refrigeration and air conditioning fields: A review. Renew. Sustain. Energy Rev. 2018, 81, 707–722. [Google Scholar] [CrossRef]
  14. Guo, X.M.; Chen, Y.G.; Wang, W.H.; Chen, C.Z. Experimental study on frost growth and dynamic performance of air source heat pump system. Appl. Therm. Eng. 2008, 28, 2267–2278. [Google Scholar] [CrossRef]
  15. Chung, Y.; Yoo, J.W.; Kim, G.T.; Kim, M.S. Prediction of the frost growth and performance change of air source heat pump system under various frosting conditions. Appl. Therm. Eng. 2019, 147, 410–420. [Google Scholar] [CrossRef]
  16. Liang, C.; Wang, F.; Lü, Y.; Wu, C.; Zhang, X.; Zhang, Y. Experimental study of the effects of fin surface characteristics on defrosting behavior. Appl. Therm. Eng. 2015, 75, 86–92. [Google Scholar] [CrossRef]
  17. Carroll, P.; Chesser, M.; Lyons, P. Air Source Heat Pumps field studies: A systematic literature review. Renew. Sustain. Energy Rev. 2020, 134, 110275. [Google Scholar] [CrossRef]
  18. Mendoza-Miranda, J.M.; Mota-Babiloni, A.; Ramírez-Minguela, J.J.; Muñoz-Carpio, V.D.; Carrera-Rodríguez, M.; Navarro-Esbrí, J.; Salazar-Hernández, C. Comparative evaluation of R1234yf, R1234ze(E) and R450A as alternatives to R134a in a variable speed reciprocating compressor. Energy 2016, 114, 753–766. [Google Scholar] [CrossRef]
  19. Le, K.X.; Huang, M.J.; Shah, N.; Wilson, C.; Artain, P.M.; Byrne, R.; Hewitt, N.J. High temperature air source heat pump coupled with thermal energy storage: Comparative performances and retrofit analysis. Energy Procedia 2019, 158, 3878–3885. [Google Scholar] [CrossRef]
  20. Eom, Y.H.; Chung, Y.; Park, M.; Hong, S.B.; Kim, M.S. Deep learning-based prediction method on performance change of air source heat pump system under frosting conditions. Energy 2021, 228, 120542. [Google Scholar] [CrossRef]
  21. Li, Y.; Li, W.; Liu, Z.; Lu, J.; Zeng, L.; Yang, L.; Xie, L. Theoretical and numerical study on performance of the air-source heat pump system in Tibet. Renew. Energy 2017, 114, 489–501. [Google Scholar] [CrossRef]
  22. Wei, W.; Wang, B.; Gu, H.; Ni, L.; Yao, Y. Investigation on the regulating methods of air source heat pump system used for district heating: Considering the energy loss caused by frosting and on–off. Energy Build. 2021, 235, 110731. [Google Scholar] [CrossRef]
  23. Wang, W.; Feng, Y.C.; Zhu, J.H.; Li, L.T.; Guo, Q.C.; Lu, W.P. Performances of air source heat pump system for a kind of mal-defrost phenomenon appearing in moderate climate conditions. Appl. Energy 2013, 112, 1138–1145. [Google Scholar] [CrossRef]
  24. Pu, J.; Shen, C.; Zhang, C.; Liu, X. A semi-experimental method for evaluating frosting performance of air source heat pumps. Renew. Energy 2021, 173, 913–925. [Google Scholar] [CrossRef]
  25. Wang, Z.; Song, M.; Wang, F.; Ma, Z.; Lin, Q. Experimental investigation and seasonal performance assessment of a frost-free ASHP system with radiant floor heating. Energy Build. 2018, 179, 200–212. [Google Scholar] [CrossRef]
  26. Januševičius, K.; Bielskus, J.; Martinaitis, V.; Streckienė, G.; Rimdžius, D. Expressing the building energy systems thermodynamic seasonal efficiency. 10th Int. Conf. Environ. Eng. ICEE 2017 2017, 27–28. [Google Scholar] [CrossRef]
  27. Cao, C.; Li, H.; Feng, G.; Zhang, R.; Huang, K. Research on PV/T—Air Source Heat Pump Integrated Heating System in Severe Cold Region. Procedia Eng. 2016, 146, 410–414. [Google Scholar] [CrossRef] [Green Version]
  28. Wang, Z.; Wang, F.; Ma, Z.; Lin, W.; Ren, H. Investigation on the feasibility and performance of transcritical CO2 heat pump integrated with thermal energy storage for space heating. Renew. Energy 2019, 134, 496–508. [Google Scholar] [CrossRef]
  29. Vocale, P.; Morini, G.L.; Spiga, M. Influence of outdoor air conditions on the air source heat pumps performance. Energy Procedia 2014, 45, 653–662. [Google Scholar] [CrossRef] [Green Version]
  30. Januševičius, K.; Streckienė, G. Analysis of air-to-water heat pump in cold climate: Comparison between experiment and simulation. Moksl.—Liet. Ateitis 2015, 7, 468–474. [Google Scholar] [CrossRef] [Green Version]
  31. Yao, Y.; Jiang, Y.; Deng, S.; Ma, Z. A study on the performance of the airside heat exchanger under frosting in an air source heat pump water heater/chiller unit. Int. J. Heat Mass Transf. 2004, 47, 3745–3756. [Google Scholar] [CrossRef]
  32. Zhu, J.H.; Sun, Y.Y.; Wang, W.; Deng, S.M.; Ge, Y.J.; Li, L.T. Developing a new frosting map to guide defrosting control for air-source heat pump units. Appl. Therm. Eng. 2015, 90, 782–791. [Google Scholar] [CrossRef]
  33.  Differential Pressure and Pitot Tube Measurement Measuring Connector FDA 602 S1K/S6K. 2021. Available online: https://www.ahlborn.com/download/katalog/en/AhlbornCat20e.pdf (accessed on 10 September 2021).
  34. Protective Caps for Capacitive Humidity Sensors FHA 646 E1. Available online: http://www.belmet.si/Custom/Modules/Products/uploadedFiles/Products/Datoteke/AMR%20kapacitivna%20sonda%203-FY763.pdf (accessed on 10 September 2021).
  35. HOBO U30 USB Weather Station Data Logger. Available online: https://www.onsetcomp.com/products/data-loggers/u30-nrc/ (accessed on 9 September 2021).
  36. HOBO S-THB-M002 Sensor. Available online: https://www.onsetcomp.com/datasheet/S-THB-M002 (accessed on 15 August 2021).
  37. HOBO H22 Energy Data Logger. Available online: https://www.onsetcomp.com/products/data-loggers/h22-001/ (accessed on 14 August 2021).
  38. Onset. 12-Bit Temperature Smart Sensor (S-TMB-M017). Available online: https://www.onsetcomp.com/products/sensors/s-tmb-m0xx/ (accessed on 14 August 2021).
  39. Meter, N.W.F. HOBO® T-MINOL-130-NL Sensor. Available online: https://www.onsetcomp.com/datasheet/T-MINOL-130-NL (accessed on 14 August 2021).
  40.  MultiMeter/Datalogger EX542 Specification. 2021. Available online: http://www.extech.com/products/EX542 (accessed on 10 September 2021).
  41. Ac, T. MD 9272 Leakage Clamp TRMS Meter with Power Functions. Specification. Available online: https://www.metrel.si/en/shop/DMM/clamp-meters/md-9272.html (accessed on 14 August 2021).
  42. Baglivo, C.; Bonuso, S.; Congedo, P.M. Performance Analysis of Air Cooled Heat Pump Coupled with Horizontal Air Ground Heat Exchanger in the Mediterranean Climate. Energies 2018, 11, 2704. [Google Scholar] [CrossRef] [Green Version]
  43. Chavan, D.K.; Pathak, G.K. Engineering Thermodynamics; Standard Book House: New Delhi, India, 2018. [Google Scholar]
  44. Popiel, C.O.; Wojtkowiak, J. Simple Formulas for Thermophysical Properties of Liquid Water for Heat Transfer Calculations (from 0 °C to 150 °C). Heat Transf. Eng. 1998, 19, 87–101. [Google Scholar] [CrossRef]
Figure 1. (a) A high-resolution camera for visually monitoring the surface of the evaporator; (b) the light source used during the nighttime.
Energies 14 05737 g001
Figure 2. The experimental setup on the roof of VILNIUS TECH.
Energies 14 05737 g002
Figure 3. The principal scheme of the experimental setup.
Energies 14 05737 g003
Figure 4. A comparison of the ambient air flow rate with the air flow temperature after the evaporator heat exchanger and the air flow rate through it (11–12 November 2020).
Energies 14 05737 g004
Figure 5. Defrosting the heat exchanger: (a) the first minute—the entire surface covered with frost; (b) the second minute—the start of the melting; (c) the third minute—frost melting; (d) the fourth minute—frost melting; (e) the fifth minute—condensate blowing.
Energies 14 05737 g005
Figure 6. (a) Variation in ambient air parameters and temperature after ASHP evaporator; (b) variation in the COP depending on the ratio of enthalpies of ambient air and water supplied (11–12 November 2020).
Energies 14 05737 g006aEnergies 14 05737 g006b
Figure 7. A comparison of the ambient air temperature with the air flow temperature after the evaporator heat exchanger and the air flow through it (1–3 December 2020).
Energies 14 05737 g007
Figure 8. (a) Variation in ambient air parameters and temperature after ASHP evaporator; (b) variation in the COP depending on the ratio of enthalpies of ambient air and water supplied (1–3 December 2020).
Energies 14 05737 g008
Figure 9. A comparison of the ambient air temperature with the air flow temperature after the evaporator heat exchanger and the air flow through it (15–17 December 2020).
Energies 14 05737 g009
Figure 10. (a) Variation in ambient air parameters and temperature after ASHP evaporator; (b) variation in the COP depending on the ratio of enthalpies of ambient air and water supplied (15–17 December 2020).
Energies 14 05737 g010aEnergies 14 05737 g010b
Figure 11. A comparison of all three periods—the variation in the COP depending on the ratio of enthalpies of ambient air and water supplied.
Energies 14 05737 g011
Publisher’s Note: MDPI stays neutral with regard to jurisdictional claims in published maps and institutional affiliations.

