Abstract
The condition monitoring of induction motors (IM), is an important concern for industry due to the widespread use of these machines. Magnetic Flux Analysis, has been proven to be a reliable method of diagnosing these motors. Among the IM types, squirrel-cage motors (SCIM) are one of the most commonly used. In many industrial applications, the IM are driven by different types of starters, quite often by soft-starters. Despite rotor damages are more prone to occur in line-started motors, these kind of failures have been also reported in those ones driven by soft-starters. Related to this, the use of these type of starters may introduce some harmonic components, that could veil the magnetic flux signature of the different rotor faults. So, the aim of this study is to confirm if the Stray Flux Analysis technique maintains its reliability in these cases. Thus, this article presents the results of soft-started induction motors start-up tests, both in healthy and faulty motors. The fault components are detected by analyzing the stray flux during the starting and the study is complemented by analyzing the stray flux during the steady-state. In addition to the failure patterns, numerical indicators have been found so the identification of the failures is not only qualitative, but also quantitative. The results confirm the potential of the technique for detecting electromechanical failures in soft-started SCIMs.
1. Introduction
Robustness, reliability and simplicity, are the main characteristics of induction motors (IMs). It is because of those advantages, that IMs are involved in a large part of the industrial processes of the industrialized countries [1]. Specifically, Squirrel Cage Induction Machines (SCIM) represent a significant part of those industrial machines [2].
Despite the above-mentioned robustness of these motors, both electrical and mechanical failures may appear thorough their operation time. Particularly dangerous are the rotor faults because usually, they do not show external symptoms until a fatal failure occurs [2,3,4,5].
On the other hand, different kinds of starting systems have become common in industrial applications. Besides the star-delta, auto-transformer or the other typical starting systems, the use of soft-starters has become one of the most preferred ones, due to their advantages. These systems allow to damp the start-up current of induction motors, so the suffered stresses become lower. Based usually on thyristors connected in anti-parallel, soft-starters allow setting, among other parameters, the initial voltage and the duration of the voltage ramp (and, in some cases, even limiting the maximum current during the starting).
But the use of soft-starters does not avoid the rotor to get damaged. As it is stated in [6,7,8,9,10], the use of these drives amplifies certain harmonics of the start-up current, generating additional stresses to the rotor. Even secondary torque harmonics may appear, leading to resonance problems [10].
Attending to what is previously said and to avoid the costs associated to unexpected failures, several monitoring systems and fault diagnosis methodologies have been developed. The aim is to detect the defects in their initial stages. One of those diagnosis methods, is the one based on the analysis of the magnetic stray flux. The main idea of this method, is that the presence of a failure in the motor, modifies the magnetic field in the surroundings of the frame of the machine [11,12,13,14].
Previous studies have dealt with the condition assessment of soft-started motors [15,16,17,18]. Some of them are focused on the rotor fault diagnosis based on the start-up current analysis using advanced time-frequency transforms [6,7,8,19,20]. Despite the results of these works were satisfactory, it has been proven that the analysis of stray fluxes yields a much richer harmonic content in the resulting time-frequency maps, compared to current analysis [14,21], hence enabling a more reliable diagnosis of the fault since it can be based on further harmonics. Thus, as the use of soft-starters introduce additional harmonic components during the start-up that could veil the failure patterns, it becomes important to confirm the reliability of the stray flux analysis method in these cases.
The aims of this study are:
- To validate the fault diagnosis method, based on the transient analysis of the stray flux in soft-started induction motors.
- To obtain numerical indicators, so the severity of the failures can be categorized.
In this sense, the tests where carried out by using soft-starters of diverse manufacturers and topologies. 270 signals were obtained during the laboratory tests and then analized applying the STFT (Short Time Fourier Transform) method, obtaining time-frequency maps and also numerical indicators. Thus, the failure identification is both qualitative and quantitative. Besides, to complement the study, the steady-state signals where analized applying the FFT (Fast Fourier Transform), obtaining numerical indicators also.
In this sense, despite the simplicity of the FFT analysis, its main drawback is that the time information is lost when transforming to the frequency domain. This means that it is impossible to tell, looking at the FFT spectrum, when a particular event has occurred. Since this fact is not very important when analyzing a stationary signal, this technique is applied to the steady-state signal to obtain additional information. On the other hand, since trends, abrupt changes, beginnings and ends of events, etc. are contained in non-stationary signals, STFT method is applied to analyze the start-up transient signal. More details of this techniques can be found in [22,23].
As far as the authors know, this is the first time that this approach is carried out and the results, prove the potential of this method as a source of information in these cases.
2. Materials and Methods
Several previous studies have proven that the analysis of the external magnetic field, allows to detect different types of failures in induction motors. In [24], Bellini et al. demonstrated that, once obtained the Fourier Spectrum of the EMF induced in a proper coil sensor, the study of the sideband components given by the expression:
where supply frequency and slip.
They appear at both sides of the fundamental component, apports significant information about the rotor conditions. Besides, in [24] it was proven that the components given by the expressions:
are significantly affected when rotor faults exist. Also, in [25], it was stated that the components given by the expressions (2) and (3) are mainly present in the axial magnetic field, while the components given by (1) are essentially present in the radial one. Thus, depending on the sensor position, either the radial or the axial components will prevail over the other ones. According to this, as stated in [25], the axial field is measured when the sensor is settled in the position A. The radial field, is mainly measured locating the sensor in position C and when it is settled in position B, the sensor measures the radial field and a portion of the axial one (see Figure 1).
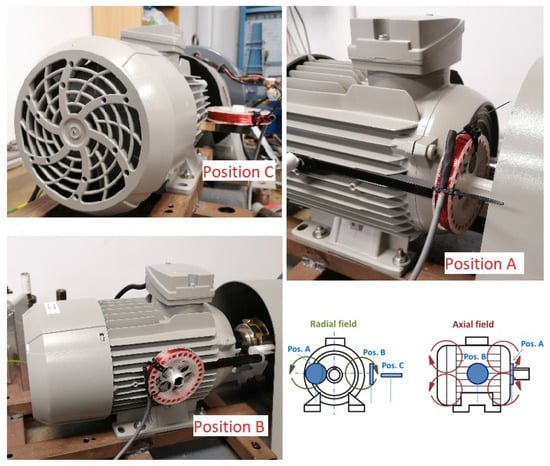
Figure 1.
Coil sensor positions.
On the other hand, Ishkova and Vitek [26] stated that some frequencies in the FFT spectrum of the steady-state flux, would be amplified when mixed eccentricities exist. Those frequencies are obtained from:
where pole pair number and
It is known that the aforementioned components evolve in a characteristic way during the start-up (see Figure 2). And here relies the method used for this study. The analysis of the evolution of these components under that transient, with proper time-frequency tools [14], to confirm if it is possible to detect the failure patterns and indicators when the motors are driven by soft-starters.
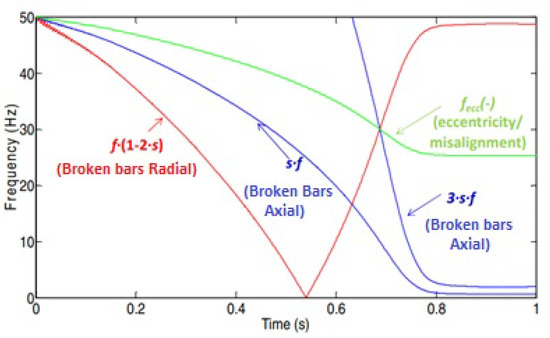
Figure 2.
Theoretical evolutions, under the starting, for the different failure components.
The stated hypothesis is that in a healthy motor, despite other harmonics with lower amplitude related to constructive matters, no more than the fundamental component is expected. This component will appear as a horizontal line in the time-frequency analysis. As proven in various studies as [25], some additional harmonics can appear nearby but they tend to zero as the motor reaches its nominal speed. In the case of broken-bar failures, both radial and axial components will appear. The axial component given by (2), is expected to drop from the supply frequency (50 Hz) in the initial stage of the start-up, to almost 0 Hz at steady state. The component given by (3) will evolve in a similar way, but this time decreasing from 150 Hz to almost 0 Hz. Regarding to the radial component, given by the expression (1), it will follow a V-shaped characteristic pattern, dropping to zero and then increasing almost to f at steady state [14]. Finally, the two main components associated to misalignments or eccentricities, for a 2-pair-of-poles machine, would start at 50 Hz and drop to almost 25 Hz for (see Equation (4)) and almost 75 Hz for (see Equation (5)). By using proper time-frequency analysis tools, such as STFT or DWT (Discrete Wavelet Transform), the identification of the aforementioned patterns in each component defined, would be a reliable way of determining the presence of each type of failure.
To carry out the laboratory tests, a 4-pole SIEMENS 400 V, 1.1 kW single-cage induction motor was used. A DC machine was coupled to it acting as a load when needed. The characteristics of the SCIM tested, are shown in Table 1, according to the data provided by the manufacturer.

Table 1.
Rated characteristics of the SIEMENS motor.
The bench used in the laboratory tests, is shown in Figure 3.
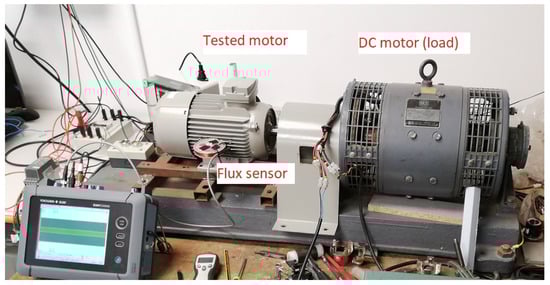
Figure 3.
Test bench used in the laboratory.
The sensor used to capture the stray flux, was manufactured in the laboratory. The main characteristics are shown in Figure 4. There, the dimensions are depicted. The coil has 1000 turns of a 0.2 mm diameter wire.
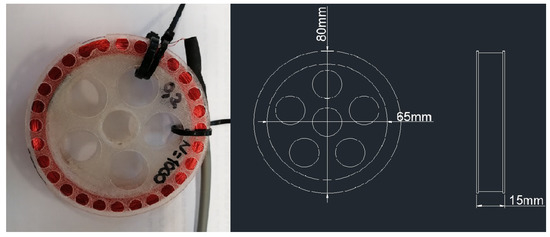
Figure 4.
Coil sensor characteristics.
The tests, were carried out in three stages:
- In a first stage, the healthy motor was tested, both with and without load.
- In a second stage, 1 bar breakage was forced in the motor and it was tested both with and without load.
- In a third stage, 2 bar breakages were forced in the motor and it was tested both with and without load.
To force the different levels of failure, a hole was drilled to cut the connection between the bar and the short-circuit end ring (see Figure 5). The bars drilled, were consecutive in these tests.
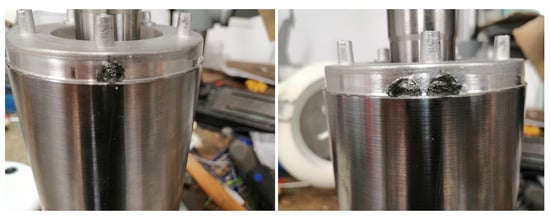
Figure 5.
1 and 2 forced bar breakages.
In each stage, the motor was started using four different models of soft-starters, each one of them from well-known trademarks. The four models employed, had different topologies and regulation settings. Their main characteristics are shown in Table 2 (see also Figure 6).
Table 2.
Characteristics of the soft-starters.

Figure 6.
Tested soft-starters.
In each stage, the flux sensor was set consecutively in the three known positions (A, B and C), in order to capture both the axial and the radial components (see Figure 1). For each position of the sensor, the motor was started by means of the 4 different soft-starters. For each soft-starter, at least 3 different regulations of time (voltage ramp) and initial torque/current were set, depending on the available possibilities. For each test, the stray flux and the current of each phase were captured, both during the starting and at steady state. The induced emf signals were captured by connecting the sensor coil to a digital waveform recorder. The sampling rate was kHz and the acquisition time was set in 40 s. Consequently, 270 signals were obtained when the three stages of tests were finished.
Once the signals were obtained, the start-up transient part of each one was analized by means of the STFT and the time-frequency maps were obtained. Once those maps were depicted, we were able to identify some of the expected failure patterns and so, we obtained the numerical indicators related to them.
To complement this study, the steady-state parts of the obtained signals were analyzed by means of the FFT, obtaining numerical indicators as a complementary way to confirm the presence of the fault and categorize its severity. Although the steady-state analysis, as it has been stated in other studies, may point out false failure alarms, in combination with the transient analysis of the start-up is useful to confirm the presence of rotor damages [14].
3. Results
In this section, trying to be concise, only the representative results will be shown. In Figure 7, Figure 8, Figure 9, Figure 10, Figure 11, Figure 12, Figure 13 and Figure 14, different STFT analyses (time-frequency maps) are depicted. Settled the sensor in the position B in every case, the results correspond to the healthy, 1-broken-bar and 2-broken-bars motor driven by each soft-starter, them regulated as it is shown in Table 3. The reasons for selecting position B are: (1) This position enables measuring both the axial and radial portion of the flux. Therefore, its information for the diagnosis is richer than that of other positions (such as A or C in Figure 1) that only enable to measure the axial or radial, but not both of them simultaneously, and (2) the amount of stray flux measured at this position is larger than for others, a fact that yields higher amplitudes of the possible fault components present in the emf signals.
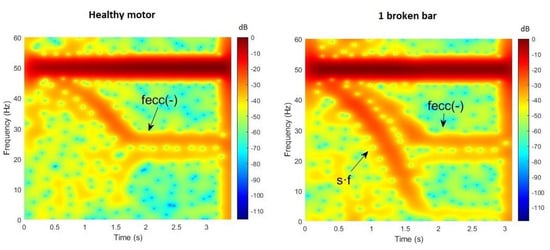
Figure 7.
Results of the STFT analyses of the stray flux under the start-up transient, for the SIEMENS soft-starter, corresponding to the healthy and 1 broken bar motor.
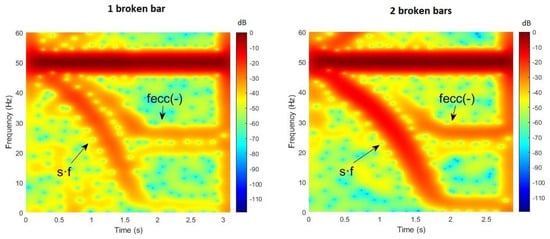
Figure 8.
Results of the STFT analyses of the stray flux under the start-up transient for the SIEMENS soft-starter, corresponding to the 1 and 2 broken bars motor.
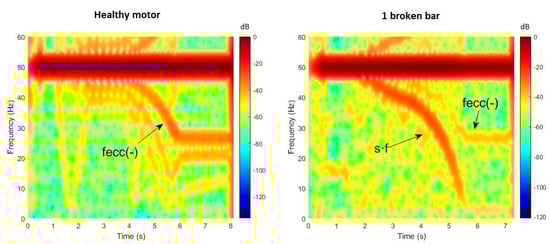
Figure 9.
Results of the STFT analyses of the stray flux under the start-up transient for the ABB soft-starter, corresponding to the healthy and 1 broken bar motor.
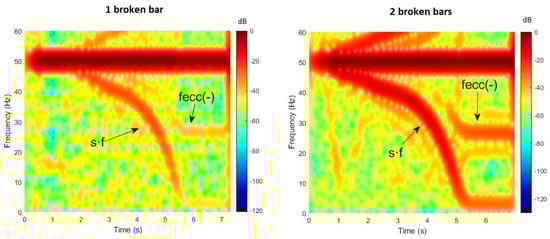
Figure 10.
Results of the STFT analyses of the stray flux under the start-up transient for the ABB soft-starter, corresponding to the 1 and 2 broken bars motor.
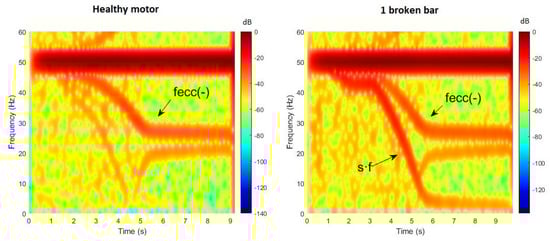
Figure 11.
Results of the STFT analyses of the stray flux under the start-up transient for the OMRON soft-starter, corresponding to the healthy and 1 broken bar motor.
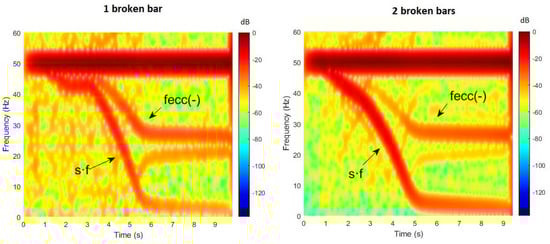
Figure 12.
Results of the STFT analyses of the stray flux under the start-up transient for the OMRON soft-starter, corresponding to the 1 and 2 broken bars motor.
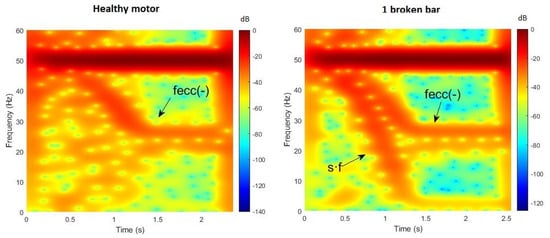
Figure 13.
Results of the STFT analyses of the stray flux under the start-up transient, for the SCHNEIDER soft-starter, corresponding to the healthy and 1 broken bar motor.
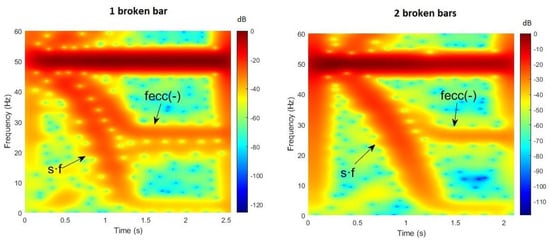
Figure 14.
Results of the STFT analyses of the stray flux under the start-up transient for the SCHNEIDER soft-starter, corresponding to the 1 and 2 broken bars motor.
Table 3.
Regulation of each soft-starter whose results are shown.
3.1. STFT Analyses of Start-Up Transient
The STFT analyses show that the component, found in the axial flux, is present in the cases of bar breakages for every model of soft-starter. It is also noticeable that this component, is more evident as the severitiy of the fault rises. Related to this, different colors in the time-frequency maps obtained denotes different energy density. Thus, colors tending to red denote higher densities meaning, in those patterns related to failures, that the severity of the fault is higher.
On the other hand, the V-shaped component, linked to bar breakages and present in the radial flux, is not evident. This may be due to the large amplitude of the component, that may partially mask the radial one. Nonetheless, the significant amplification of the component clearly evidences the presence of the fault.
The time-frequency maps also show the presence of the component, which is linked to eccentricities, even in the healthy motor. This component is typically associated to eccentricities present in the motor and may be also amplified due to misalignment between the motor and the driven load. Note that, regardless of the presence of this component, which denotes the presence of eccentricity and exists at all tested conditions, the component at is clearly increased as the fault gets worse and this occurs for every soft-starter. Therefore, this component is proven to be a good indicator of the presence of the rotor fault.
Summarizing, the qualitative results obtained until now ratify that this methodology allows to identify the presence of the faults studied, even when the motors are driven by soft-starters of different topologies.
To reinforce the reliability of the methodology, numerical indicators where obtained from the STFT analyses. Centering the search in the track of the component, the highest value of amplitude was obtained for each case. In the case of the healthy motor, the tracks of the component of the faulty cases were taken as reference. Thereby, the obtained values for each model of soft-starter are shown in Table 4:
Table 4.
Numerical indicators related to the component, for each soft-starter.
Attending to the values obtained, indicators between dB and dB, linked to the time-frequency patterns observed in the maps previously shown, evidence the presence of rotor bar breakages. Moreover, the values shown in Table 4, confirm the robustness of the indicators. Comparing the three studied cases (healthy, 1-broken-bar and 2-broken-bars state), the indicator stays quite stable even for different topologies of soft-starter. Values in the range of dB, confirm the healthy state of the rotor, while values in the range of dB, reveal the presence of 1 broken bar. On the other hand, in the case of 2 broken bars, although the indicator also stays quite stable for the models of soft-starter controlling 2 or 3 phases, it is noticeable that the SCHNEIDER model (1 controlled phase) exhibits less sensibility in terms of variation of the indicator, attending to the fault severity. For the case of the three models controlling more than 1 phase, the indicator stays in the range of dB. In the case of the SCHNEIDER one, the value of the indicator stays close to the 1-broken-bar one, but with variation enough to confirm the increase of the severity of the fault, as it is shown in Table 5. Anyway, for all the soft-starters tested, the difference between the healthy and the faulty state keeps clear enough to determine the presence of rotor faults.
Table 5.
Variation of failure indicators, for each soft-starter.
Thus, regarding to the severity categorization and attending to the indicators, it is noticeable the strong dependence on the number of phases controlled by the soft-starter. In the case of the SCHNEIDER model (1 controlled phase), the variation between the 1-broken-bar and the 2-broken-bars indicators is significantly lower than in the other 3 cases, as Table 5 shows.
To summarize the quantitative aspect of the analyses, indicators between dB and dB linked to the component, will reveal the presence of 1 broken bar in the rotor. On the other hand, indicators between dB and dB linked to the component, will reveal the presence of 2 broken bars.
3.2. FFT Analyses of the Steady State
To corroborate the results obtained in the STFT analyses, FFT analyses of the steady-state were carried out. Note that, at this regime, the soft-starter is by-passed and should not interfere in the analyses. The objective here is to check if the results of steady-state stray flux analyses under that regime, are coherent with those of the start-up. One could think that this steady-state analysis could be enough to detect the presence of the fault, but the problem of this methodology is the possibility of false indications which have raised when only steady-state data are used [27]. This is why in this paper the aforementioned methodology relying on starting analysis is proposed. The signals analyzed correspond to the same settings of the STFT ones, with the tested motor loaded.
In Figure 15, Figure 16, Figure 17, Figure 18, Figure 19, Figure 20, Figure 21 and Figure 22, the FFT spectra are depicted. These FFT steady-state analyses, were focused on the component, which was the clearer one in the transient analyses previously shown.
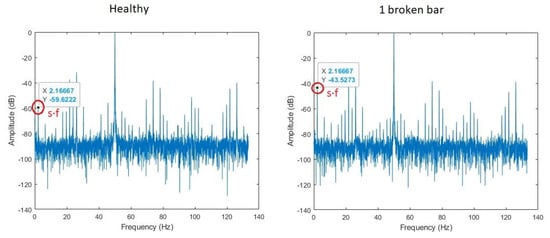
Figure 15.
Results of the FFT analyses of the stray flux under the steady state, for the SIEMENS soft-starter, corresponding to the healthy and 1 broken bar motor.
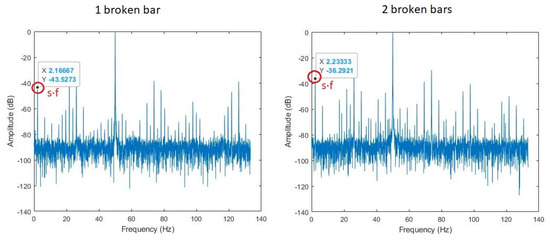
Figure 16.
Results of the FFT analyses of the stray flux under the steady state for the SIEMENS soft-starter, corresponding to the 1 and 2 broken bars motor.
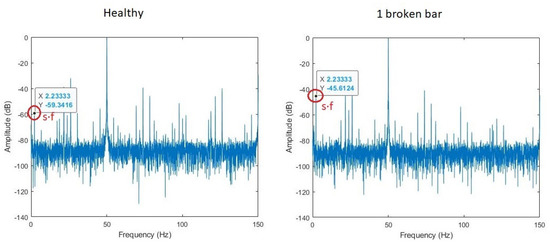
Figure 17.
Results of the FFT analyses of the stray flux under the steady state for the ABB soft-starter, corresponding to the healthy and 1 broken bar motor.
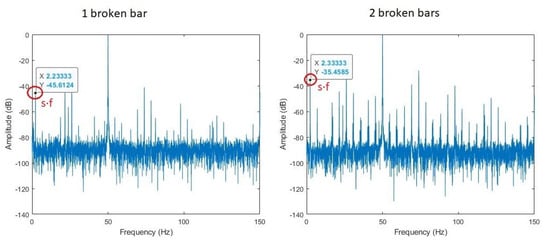
Figure 18.
Results of the FFT analyses of the stray flux under the steady state for the ABB soft-starter, corresponding to the 1 and 2 broken bars motor.
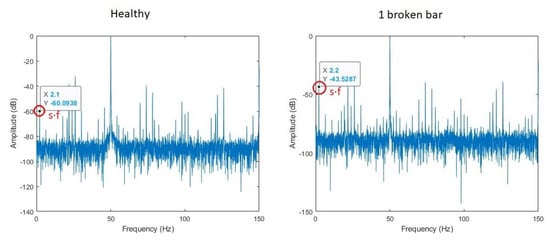
Figure 19.
Results of the FFT analyses of the stray flux under the steady state for the OMRON soft-starter, corresponding to the healthy and 1 broken bar motor.
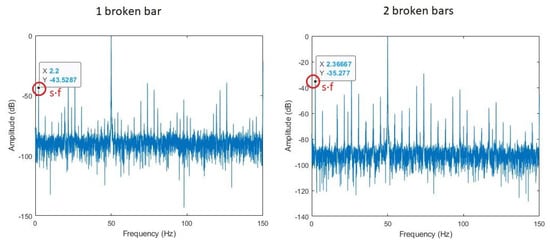
Figure 20.
Results of the FFT analyses of the stray flux under the steady state for the OMRON soft-starter, corresponding to the 1 and 2 broken bars motor.
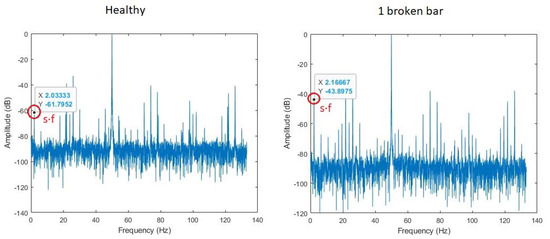
Figure 21.
Results of the FFT analyses of the stray flux under the steady state, for the SCHNEIDER soft-starter, corresponding to the healthy and 1 broken bar motor.
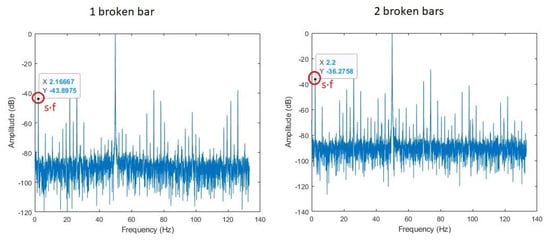
Figure 22.
Results of the FFT analyses of the stray flux under the steady state for the SCHNEIDER soft-starter, corresponding to the 1 and 2 broken bars motor.
By analyzing these results, fault indicators related to the component were identified. They are shown in Table 6. These fault indicators were obtained by means of a self-custom Matlab code. The higher the indicator is, the higher is the severity of the fault related to it. Taking the SIEMENS soft-starter as an example and attending to the results shown in Table 6 and Figure 15 and Figure 16, we can see that at the corresponding frequency of the component, the amplitude of the signal (indicator) has a value of dB in the healthy case. Once the bar breakage appears, this indicator for the component increases its value, reaching dB. As the failure severity increases, so does the indicator associated to the component, reaching a value of dB in the 2-broken-bar case. The same trend follow the indicators of the component when the other soft-starters are used.
Table 6.
Numerical indicators related to the component, for each soft-starter.
To summarize the quantitative aspect of the FFT analyses:
- Indicators between dB and dB linked to the component, will confirm the healthy state of the rotor.
- Indicators between dB and dB linked to the component, will reveal the presence of 1 broken bar in the rotor.
- Indicators between dB and dB linked to the component, will reveal the presence of 2 broken bars in the rotor.
All this analyses corroborate the coherent results of the start-up stray-flux-based methodology and at the same time, indicate that simultaneous analysis of start-up and steady-state stray flux signals (which can be carried out in the same measurement) can be a powerful and reliable method to detect the presence of the fault.
4. Conclusions
The object of this article, has been to evaluate if even when IMs are driven by soft-starters, the analysis of the start-up transient stray flux can provide evidences of the presence of different rotor faults. On the other hand, it was also a goal to confirm if this methodology could even categorize the severity of the faults, despite the side effects introduced in the signals by soft-starters.
According to the results obtained from the laboratory tests, this approach, combined with the steady-state analysis of the stray flux, provide reliable information about the conditions of the rotor.
The component of the axial flux, related to broken bar faults, is evidenced in the time-frequency maps obtained from the transient-based analyses. And this occurs regardless of the type and topology of the soft-starter employed to start the motor.
Furthermore, indicators have been obtained so the identification of the failures and its severity are not only qualitative, by means of the patterns shown in the time-frequency maps, but also qualitative.
Finally, the combination of the transient-based analyses with the steady-state ones, allows to avoid false failure alarms and confirm the presence of rotor failures.
To conclude, even though more studies will be developed to prove if these conclusions can be extended to other rotating electrical machines, the results confirm that the stray flux analysis under the starting, allows to detect electromechanical faults, even when the motor is driven by soft-starters. Thus, due to the extended use of these devices in industrial applications, this study reinforces the applicability of the method. Furthermore, the obtaining of the indicators, will be helpful to advance in the automation of the diagnosis, combining their recognition with the automatic identification of the fault patterns.
In this sense, the results presented in this paper open the way to implement stray-flux-based methodologies in the soft-starter itself. The incorporation of additional sensors, such as triaxial flux sensors and current ones, in combination with built-in Artificial Intelligence devices, could lead industrial soft-starters to become smart devices, able to apply these methodologies and add not only the motor-starting-control functionalities, but also the motor-diagnosis ones.
Future works will deal with the application of the proposed methodologies in a broader number of motor sizes, including large industrial motors.
Author Contributions
Conceptualization, J.A.A.-D., V.B.-M. and Á.N.-N.; methodology, J.A.A.-D., V.B.-M. and Á.N.-N.; software, J.A.A.-D., V.B.-M. and Á.N.-N.; validation, J.A.A.-D., V.B.-M. and Á.N.-N.; formal analysis, V.B.-M. and Á.N.-N.; investigation, J.A.A.-D., V.B.-M. and Á.N.-N.; resources, J.A.A.-D.; data curation, J.A.A.-D., V.B.-M. and Á.N.-N.; writing—original draft preparation, V.B.-M.; writing—review and editing, J.A.A.-D., V.B.-M. and H.R.; visualization, V.B.-M., J.A.A.-D. and H.R.; supervision, J.A.A.-D.; project administration, J.A.A.-D.; funding acquisition, J.A.A.-D. All authors have read and agreed to the published version of the manuscript.
Funding
This research was founded by the Spanish ‘Ministerio de Ciencia Innovación y Universidades’ and FEDER program in the framework of the ‘Proyectos de I+D de Generación de Conocimiento del Programa Estatal de Generación de Conocimiento y Fortalecimiento Científico y Tecnológico del Sistema de I+D+i, Subprograma Estatal de Generación de Conocimiento’ grant number: PGC2018-095747-B-I00.
Institutional Review Board Statement
Not applicable.
Informed Consent Statement
Not applicable.
Conflicts of Interest
The authors declare no conflict of interest.
Abbreviations
The following abbreviations are used in this manuscript:
| IM | Induction Motors |
| SCIM | Squirrel Cage Induction Machines |
| STFT | Short Time Fourier Transform |
| FFT | Fast Fourier Transform |
| DWT | Discrete Wavelet Transform |
| emf | Electromotive Force |
References
- Haraguchi, N.; Cheng, C.F.C.; Smeets, E. The Importance of Manufacturing of Manufacturing Development: Has This Changed? United Nations Industrial Development Organization: Vienna, Austria, 2016. [Google Scholar] [CrossRef]
- Thomson, W.; Fenger, M. Current signature analysis to detect induction motor faults. IEEE Ind. Appl. Mag. 2001, 7, 26–34. [Google Scholar] [CrossRef]
- Thomson, W.; Culbert, I. Current Signature Analysis for Condition Monitoring of Cage Induction Motors: Industrial Application and Case Histories; John Wiley & Sons, Ltd.: Hoboken, NJ, USA, 2016; pp. 1–397. [Google Scholar] [CrossRef]
- Strangas, E.G.; Clerc, G.; Razik, H.; Soualhi, A. Fault Diagnosis, Prognosis, and Reliability for Electrical Machines and Drives; Wiley-IEEE Press: Hoboken, NJ, USA, 2021; ISBN 978-1-119-72275-5. [Google Scholar]
- Soualhi, A.; Razik, H. Electrical Systems 1 & 2, From Diagnosis to Prognosis; Wiley: Hoboken, NJ, USA, 2020; ISBN1 978-1-119-72057-7. ISBN2 978-1-119-72030-0. [Google Scholar]
- Corral-Hernandez, J.A.; Antonino-Daviu, J.A. Thorough validation of a rotor fault diagnosis methodology in laboratory and field soft-started induction motors. Chin. J. Electr. Eng. 2018, 4, 66–72. [Google Scholar] [CrossRef]
- Corral-Hernandez, J.A.; Antonino-Daviu, J.; Pons-Llinares, J.; Climente-Alarcon, V.; Francés-Galiana, V. Transient-Based Rotor Cage Assessment in Induction Motors Operating with Soft Starters. IEEE Trans. Ind. Appl. 2015, 51, 3734–3742. [Google Scholar] [CrossRef]
- Corral-Hernandez, J.; Antonino-Daviu, J. Startup-based rotor fault detection in soft-started induction motors for different soft-starter topologies. In Proceedings of the IECON 2016—42nd Annual Conference of the IEEE Industrial Electronics Society, Florence, Italy, 23–26 October 2016; pp. 6977–6982. [Google Scholar] [CrossRef]
- Akar, M. Detection of Rotor Bar Faults in Field Oriented Controlled Induction Motors. J. Power Electron. 2012, 12, 982–991. [Google Scholar] [CrossRef]
- Pons-Llinares, J.; Morinigo-Sotelo, D.; Duque-Perez, O.; Antonino-Daviu, J.; Perez-Alonso, M. Transient detection of close components through the chirplet transform: Rotor faults in inverter-fed induction motors. In Proceedings of the IECON 2014—40th Annual Conference of the IEEE Industrial Electronics Society, Dallas, TX, USA, 29 October–1 November 2014; pp. 3386–3392. [Google Scholar] [CrossRef]
- Ceban, A.; Pusca, R.; Romary, R. Study of Rotor Faults in Induction Motors Using External Magnetic Field Analysis. IEEE Trans. Ind. Electron. 2012, 59, 2082–2093. [Google Scholar] [CrossRef]
- Henao, H.; Demian, C.; Capolino, G.A. A frequency-domain detection of stator winding faults in induction machines using an external flux sensor. IEEE Trans. Ind. Appl. 2003, 39, 1272–1279. [Google Scholar] [CrossRef]
- Henao, H.; Capolino, G.; Martis, C. On the stray flux analysis for the detection of the three-phase induction machine faults. In Proceedings of the 38th IAS Annual Meeting on Conference Record of the Industry Applications Conference, 2003, Salt Lake City, UT, USA, 12–16 October 2003; Volume 2, pp. 1368–1373. [Google Scholar] [CrossRef]
- Ramirez-Nunez, J.A.; Antonino-Daviu, J.A.; Climente-Alarcón, V.; Quijano-López, A.; Razik, H.; Osornio-Rios, R.A.; Romero-Troncoso, R.D.J. Evaluation of the Detectability of Electromechanical Faults in Induction Motors via Transient Analysis of the Stray Flux. IEEE Trans. Ind. Appl. 2018, 54, 4324–4332. [Google Scholar] [CrossRef]
- Kudelina, K.; Vaimann, T.; Rassõlkin, A.; Kallaste, A.; Huynh, V.K. Heat Pump Induction Motor Faults Caused by Soft Starter Topology—Case Study. In Proceedings of the 2021 IEEE 19th International Power Electronics and Motion Control Conference (PEMC), Gliwice, Poland, 25–29 April 2021; pp. 454–459. [Google Scholar] [CrossRef]
- Rabbi, S.F.; Kahnamouei, J.T.; Liang, X.; Yang, J. Shaft Failure Analysis in Soft-Starter Fed Electrical Submersible Pump Systems. IEEE Open J. Ind. Appl. 2020, 1, 1–10. [Google Scholar] [CrossRef]
- Zhang, P.; Du, Y.; Dai, J.; Habetler, T.G.; Lu, B. Impaired-Cooling-Condition Detection Using DC-Signal Injection for Soft-Starter-Connected Induction Motors. IEEE Trans. Ind. Electron. 2009, 56, 4642–4650. [Google Scholar] [CrossRef]
- Zhang, P.; Du, Y.; Habetler, T.G.; Lu, B. A non-intrusive winding heating method for induction motor using soft-starter for preventing moisture condensation. In Proceedings of the 2010 IEEE Energy Conversion Congress and Exposition, Atlanta, GA, USA, 12–16 September 2010; pp. 1306–1311. [Google Scholar] [CrossRef]
- Briz, F.; Degner, M.W.; Guerrero, J.M.; Garcia, P. Stator Windings Fault Diagnostics of Induction Machines Operated from Inverters and Soft-Starters Using High-Frequency Negative-Sequence Currents. IEEE Trans. Ind. Appl. 2009, 45, 1637–1646. [Google Scholar] [CrossRef]
- Georgoulas, G.; Karvelis, P.; Stylios, C.D.; Tsoumas, I.P.; Antonino-Daviu, J.A.; Corral-Hernández, J.; Climente-Alarcón, V.; Nikolakopoulos, G. Automatizing the detection of rotor failures in induction motors operated via soft-starters. In Proceedings of the IECON 2015—41st Annual Conference of the IEEE Industrial Electronics Society, Yokohama, Japan, 9–12 November 2015; pp. 003743–003748. [Google Scholar] [CrossRef]
- Park, Y.; Yang, C.; Lee, S.B.; Lee, D.M.; Fernandez, D.; Reigosa, D.; Briz, F. Online Detection and Classification of Rotor and Load Defects in PMSMs Based on Hall Sensor Measurements. IEEE Trans. Ind. Appl. 2019, 55, 3803–3812. [Google Scholar] [CrossRef]
- Pons-Llinares, J.; Riera-Guasp, M.; Antonino-Daviu, J.A.; Habetler, T.G. Pursuing optimal electric machines transient diagnosis: The adaptive slope transform. Mech. Syst. Signal Process. 2016, 80, 553–569. [Google Scholar] [CrossRef]
- Mehala, N.; Dahiya, R. A comparative study of FFT, STFT and wavelet techniques for induction machine fault diagnostic analysis. In Proceedings of the 7th WSEAS International Conference on Computational Intelligence, Man-Machine Systems and Cybernetics (CIMMACS ’08), Cairo, Egypt, 29–31 December 2008. [Google Scholar]
- Bellini, A.; Concari, C.; Franceschini, G.; Tassoni, C.; Toscani, A. Vibrations, currents and stray flux signals to asses induction motors rotor conditions. In Proceedings of the IECON 2006—32nd Annual Conference on IEEE Industrial Electronics, Paris, France, 6–10 November 2006; pp. 4963–4968. [Google Scholar] [CrossRef]
- Romary, R.; Pusca, R.; Lecointe, J.P.; Brudny, J. Electrical machines fault diagnosis by stray flux analysis. In Proceedings of the 2013 IEEE Workshop on Electrical Machines Design, Control and Diagnosis (WEMDCD), Paris, France, 11–12 March 2013; pp. 247–256. [Google Scholar] [CrossRef]
- ISHKOVA, I. Detection and classification of faults in induction motor by means of motor current signature analysis and stray flux monitoring. Przegląd Elektrotechniczny 2016, 1, 168–172. [Google Scholar] [CrossRef][Green Version]
- Gyftakis, K.N.; Panagiotou, P.A.; Spyrakis, D. Detection of simultaneous mechanical faults in 6-kV pumping induction motors using combined MCSA and stray flux methods. IET Electr. Power Appl. 2021, 15, 643–652. [Google Scholar] [CrossRef]


Publisher’s Note: MDPI stays neutral with regard to jurisdictional claims in published maps and institutional affiliations. |
© 2021 by the authors. Licensee MDPI, Basel, Switzerland. This article is an open access article distributed under the terms and conditions of the Creative Commons Attribution (CC BY) license (https://creativecommons.org/licenses/by/4.0/).