Article

Stabilization of Rock Roadway under Obliquely Straddle Working Face

1
Key Laboratory of Deep Coal Resource Mining of the Ministry of Education, School of Mines, China University of Mining and Technology, Xuzhou 221116, China
2
Admissions and employment Division, Wenzhou University, Wenzhou 325035, China
*
Author to whom correspondence should be addressed.
Energies 2021, 14(18), 5759; https://doi.org/10.3390/en14185759
Submission received: 27 July 2021 / Revised: 25 August 2021 / Accepted: 8 September 2021 / Published: 13 September 2021

Abstract

:
A floor rock roadway under an oblique straddle working face is a typical dynamic pressure roadway. Under the complex disturbance of excavation engineering works, the roadway often undergoes stress concentration and severe deformation and damage. To solve the problem of surrounding rock stability control for this roadway type, this study considered the East Forth main transport roadway in the floor strata of the 1762(3) working face of the Pansan coal mine. In situ ground pressure monitoring and numerical simulation calculation using the FLAC2D software were carried out. The influence laws of the surrounding rock lithology, the vertical and horizontal distance between the roadway and overlying working face, the positional relationship between the roadway and the overlying working face, and the support form and strength of the rock surrounding an oblique straddle roadway were obtained. Within the range of mining influence, the properties of the rock surrounding the roof and floor were very different, and the deformation of the rock surrounding the two sides exhibited regional difference. The influence range of the mining working face on the rock floor of the roadway was approximately 30–40 m, and that of horizontal mining was approximately 50–60 m. The mining influence on the rock surrounding the side roadway of the working face is large, but the mining influence on the roadway below is small. Using FLAC2D, the stress and displacement characteristics of the rock surrounding the obliquely straddle roadway were compared and analyzed when the bolt support, combined bolt and shed support, and bolt–shotcreting–grouting support were adopted, the proposed support scheme of bolting and shotcreting was successfully applied. The deformation of the rock surrounding the roadway was satisfactorily controlled, and the results were useful as a reference for similar roadway maintenance projects.

1. Introduction

Underground mining is dominant in China’s coal mines. As the lifeblood of underground coal mine production, roadways account for a large proportion of mine engineering [1,2,3,4]. Dynamic pressure roadways account for 70–80% of coal mine roadways, among which the coal seam rock floor roadway is a typical dynamic pressure roadway [5,6,7,8]. After a floor rock roadway under an obliquely straddle working face is affected by the dynamic pressure of the overlying working face, owing to the change of the spatial relationship between the different areas of the roadway and the working face, the distribution of the stress field and the displacement field of the rock surrounding the roadway becomes more complex under the influence of the mining face, and the support difficulty increases [9,10,11]. Therefore, stricter requirements are proposed for the stability control of the rock surrounding a floor rock roadway under an obliquely straddle working face.
According to the positional relationship between the axial projection of the roadway floor to the plane of the overlying coal seam and the advancing vertical, parallel, and oblique direction of the upper coal seam working face, the cross-mining dynamic pressure roadway can be divided into three basic forms: the transverse straddle roadway, longitudinal straddle roadway, and oblique straddle roadway [12,13,14], as shown in Figure 1. During the mining of the overlying mining face, the bearing pressure generated by the mining space spreads to the floor. Under the complicated disturbance of the excavation engineering, the stress field and displacement field of the floor are redistributed. Hence, stress concentration occurs during driving or in the already driven cross-mining floor rock roadway. The original support system cannot guarantee the stability of the roadway, and the deformation and damage of the cross-mining roadway are severe, which restricts the normal production of the coal mine [15,16,17,18]. Analyzing the deformation and failure laws of the various rocks is an important method for investigating the stability of diagonal roadways. Chang and Haimson [19,20,21,22] obtained the strength and deformation characteristics of the rock under different loading conditions by carrying out true triaxial compression tests on different rocks. Many studies have extensively investigated the stability control of the cross-mining roadway [23,24,25,26,27,28,29,30]. Jiang [31] analyzed the characteristics of the surrounding rock deformation of the cross-span and longitudinal-span roadway, and put forward corresponding control countermeasures. Zhang and Liu [32,33] investigated the evolution of the stress field and displacement field of the floor under the influence of mining. The additional stress change of the floor can be divided into three areas along the coal seam direction, namely, the stress increase area, stress reduction zone, and stress recovery zone, to obtain the depth and shape for the obvious change zone of the rock floor stress. Aiming at the current situation that the Huaibei mining area has crossed the roadway for many times and cannot be used normally after repeated maintenance, Li [34] summarized 4 types of typical damage characteristics, and proposed control methods and technologies. Yuan [35] analyzed the mechanical characteristics of the surrounding rock of the longitudinal-span roadway based on the rheological characteristics, and pointed out that the rheological effect under the action of lateral stress is an important factor affecting the stability of the longitudinal-span roadway. Guo [36] conducted research on the stability of the crossing roadway in Inner Mongolia Chengyi Coal Mine and established a floor stress increment model. Based on elastic mechanics, Zhang [37] established the mechanical stress distribution model for the stope floor using the additional stress algorithm, and obtained the propagation law of the mining abutment pressure in the floor: The mining stress concentration coefficient of a point under the floor gradually decreased as the buried depth increased, and the degree of pressure relief gradually weakened as the buried depth increased. Xie [38] considered the formation process of the supporting pressure and its influence on the stability of the surrounding rock at the floor of the roadway, and analyzed the relationship between the stress of the surrounding rock and the displacement of the cross-mining roadway. Zhu [39] established a mechanical model to analyze the rheological characteristics of the rock surrounding the roadway under dynamic pressure in straddle mining, and proposed an expression for estimating the stress and deformation of the roadway with time. Zhang [40] used FLAC to analyze the influence range of mining on a crossing mining pressure roadway, and obtained the relationship between the vertical distance separating the roadway and the overlying working face and the horizontal distance of the stope boundary. Considering the high ground stress, large cross-section, and close distance characteristics, Ma [41] proposed a high-rigidity coupling support technology plan for a dynamic pressure roadway to improve the strength of the rock surrounding the roadway and the rigidity and stability of the supporting structure. The use of bolt, steel belt, anchor cable, metal mesh, and shotcrete coupling support technology is feasible. In summary, research on the distribution of the stress field and the displacement field and stability of the surrounding rock in cross-mining roadways has achieved good results. However, existing studies have mainly focused on transverse straddle roadways and longitudinal straddle roadways, while research on the stability of obliquely straddle roadways has been scarce. For the obliquely straddled roadway, there are two situations of the horizontal distance and vertical distance between each section of the roadway and the edge of the overlying working face: the horizontal distance is different, the vertical distance is different, or the horizontal and vertical distance are different. The influence factors of surrounding rock stability of crossing and longitudinal span roadways are relatively less and more controllable. The stress distribution of surrounding rock in different positions of obliquely straddle roadway is more different, so the stability of surrounding rock is relatively difficult to control. To date, the stress field and displacement field of an obliquely straddle floor rock roadway have not been elucidated, and their investigation is relatively difficult.
Based on previous studies and practical experience, and on in situ ground pressure monitoring, this study investigated the stability of the rock surrounding the roadway under different lithology conditions, different vertical distance between the roadway and the working face, different horizontal distance between the roadway and the working face, different positional relationship between the roadway and the working face, and different support form and strength. The Flac2D numerical simulation software was used to compare and analyze the control effect of the surrounding rock under different support schemes. Finally, an optimized support scheme was designed and evaluated. The results obtained by the industrial test revealed that the deformation control effect was satisfactory.

2. Engineering Background and Methods

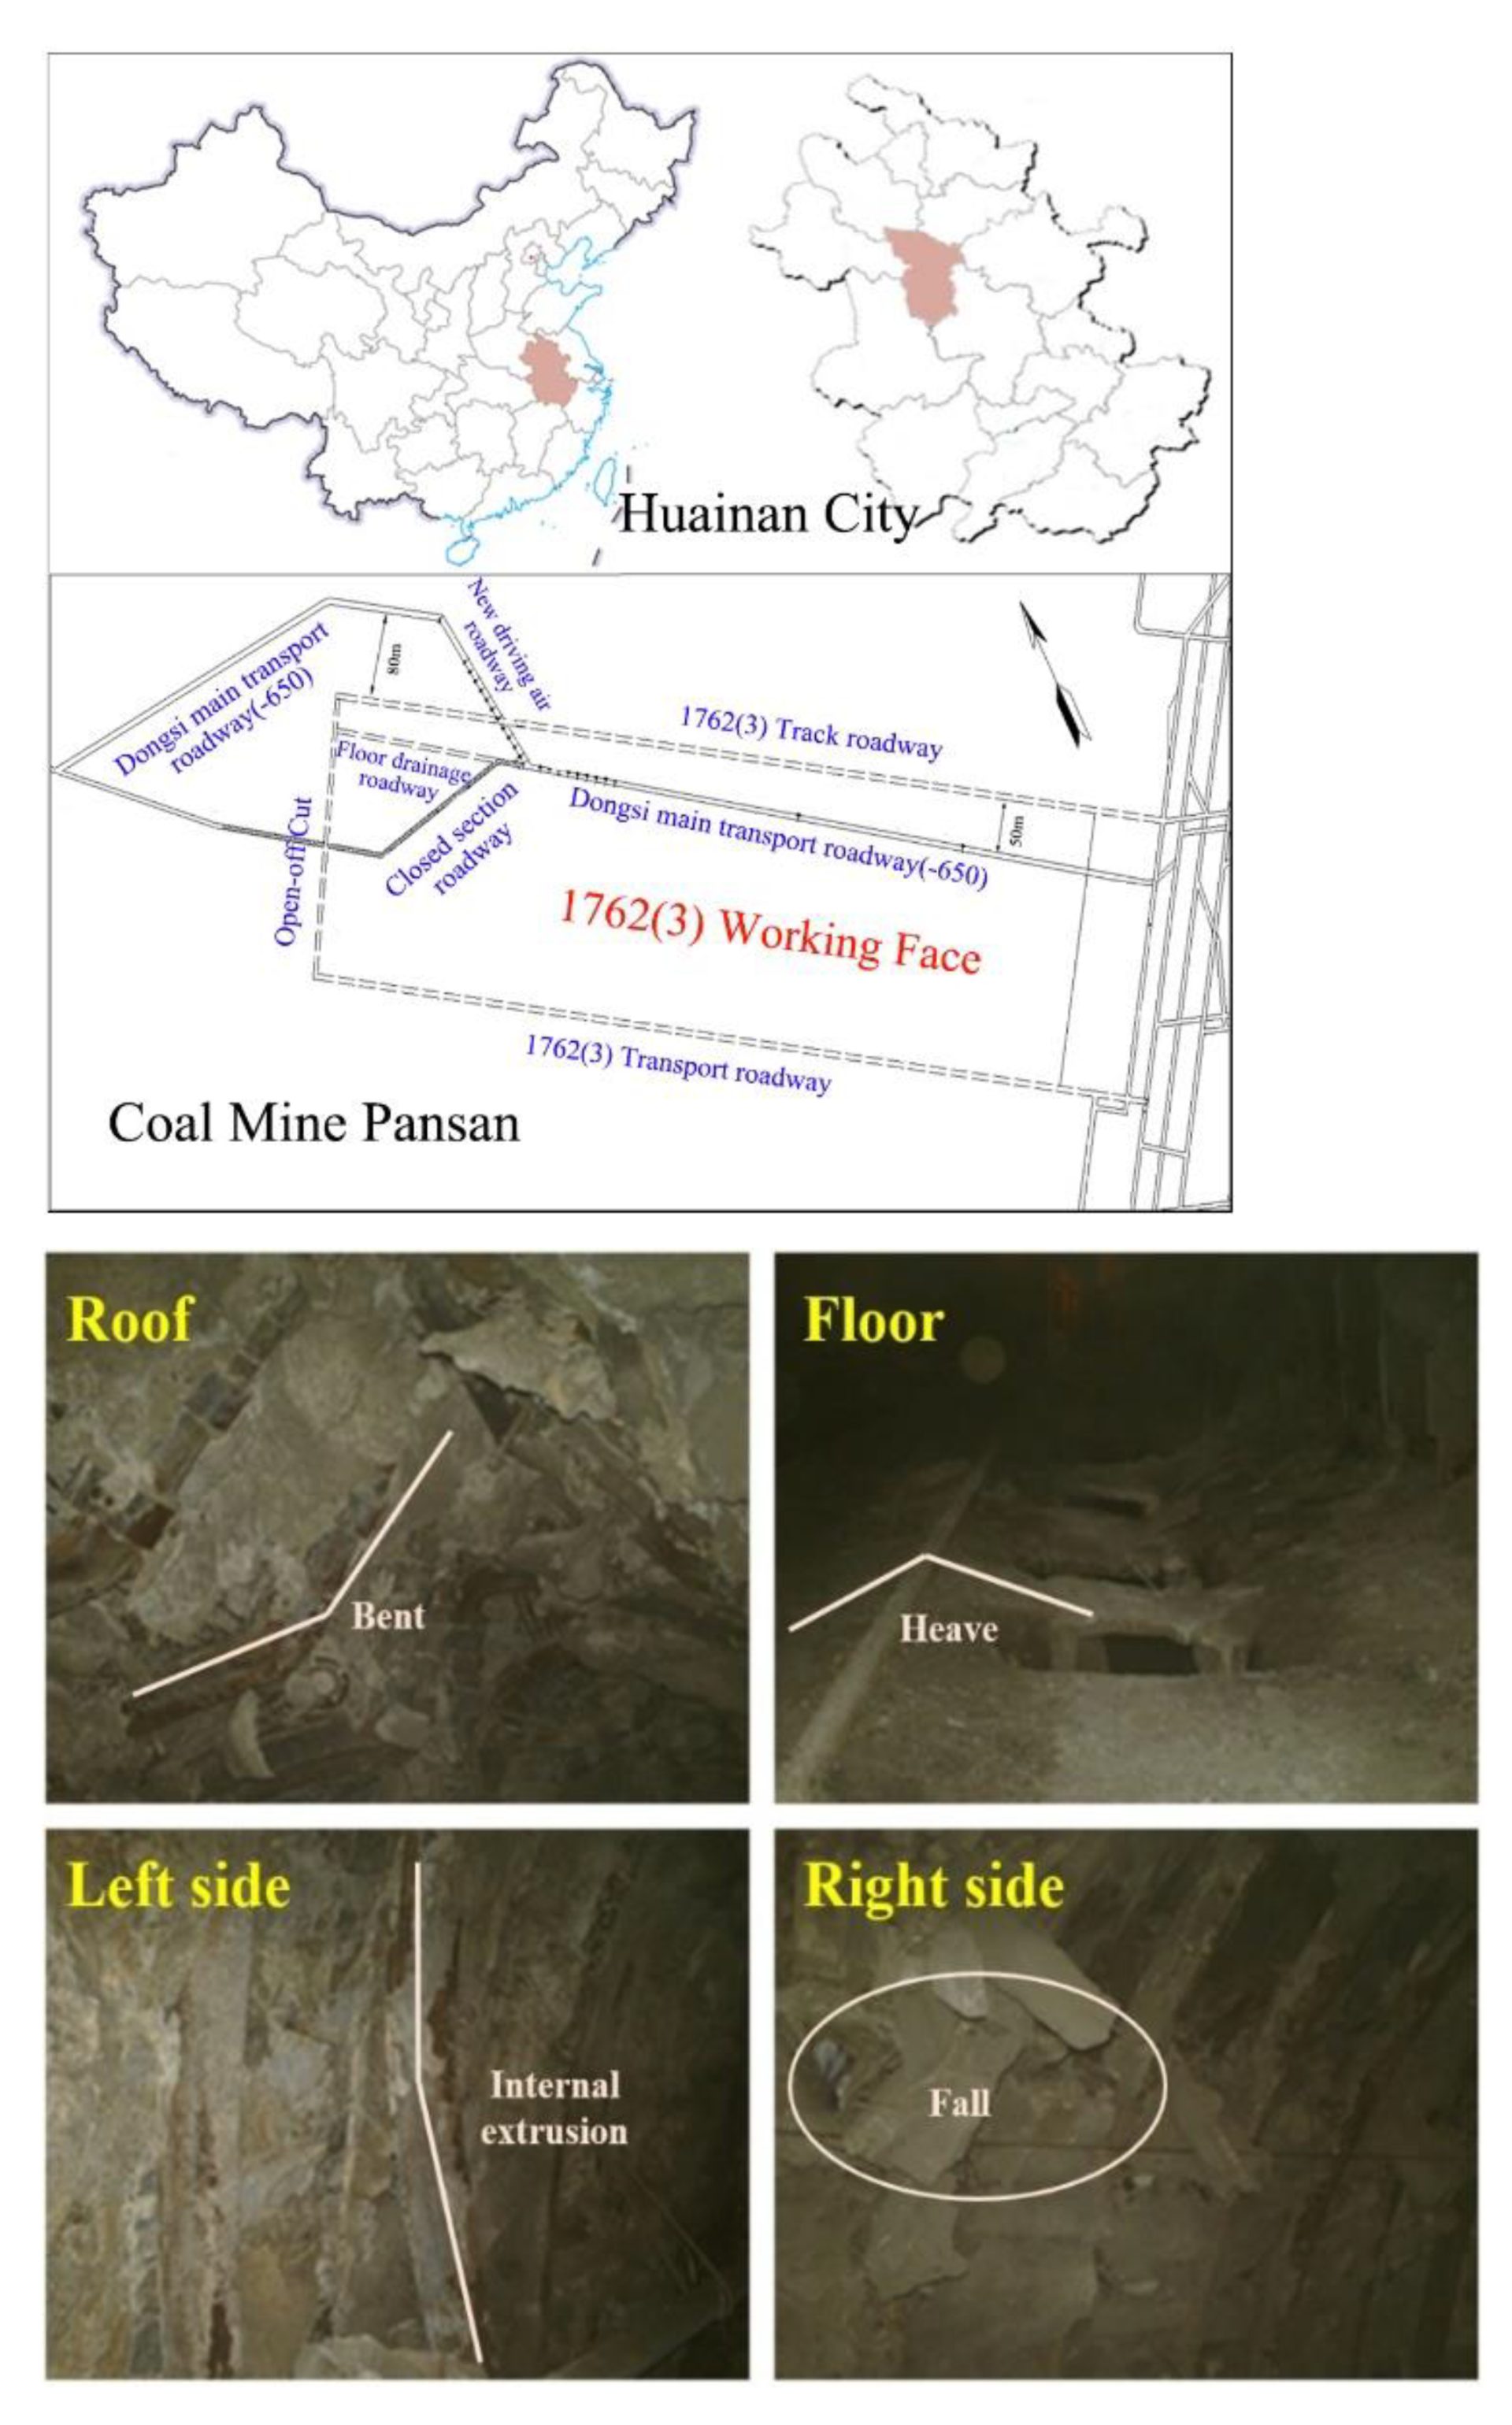
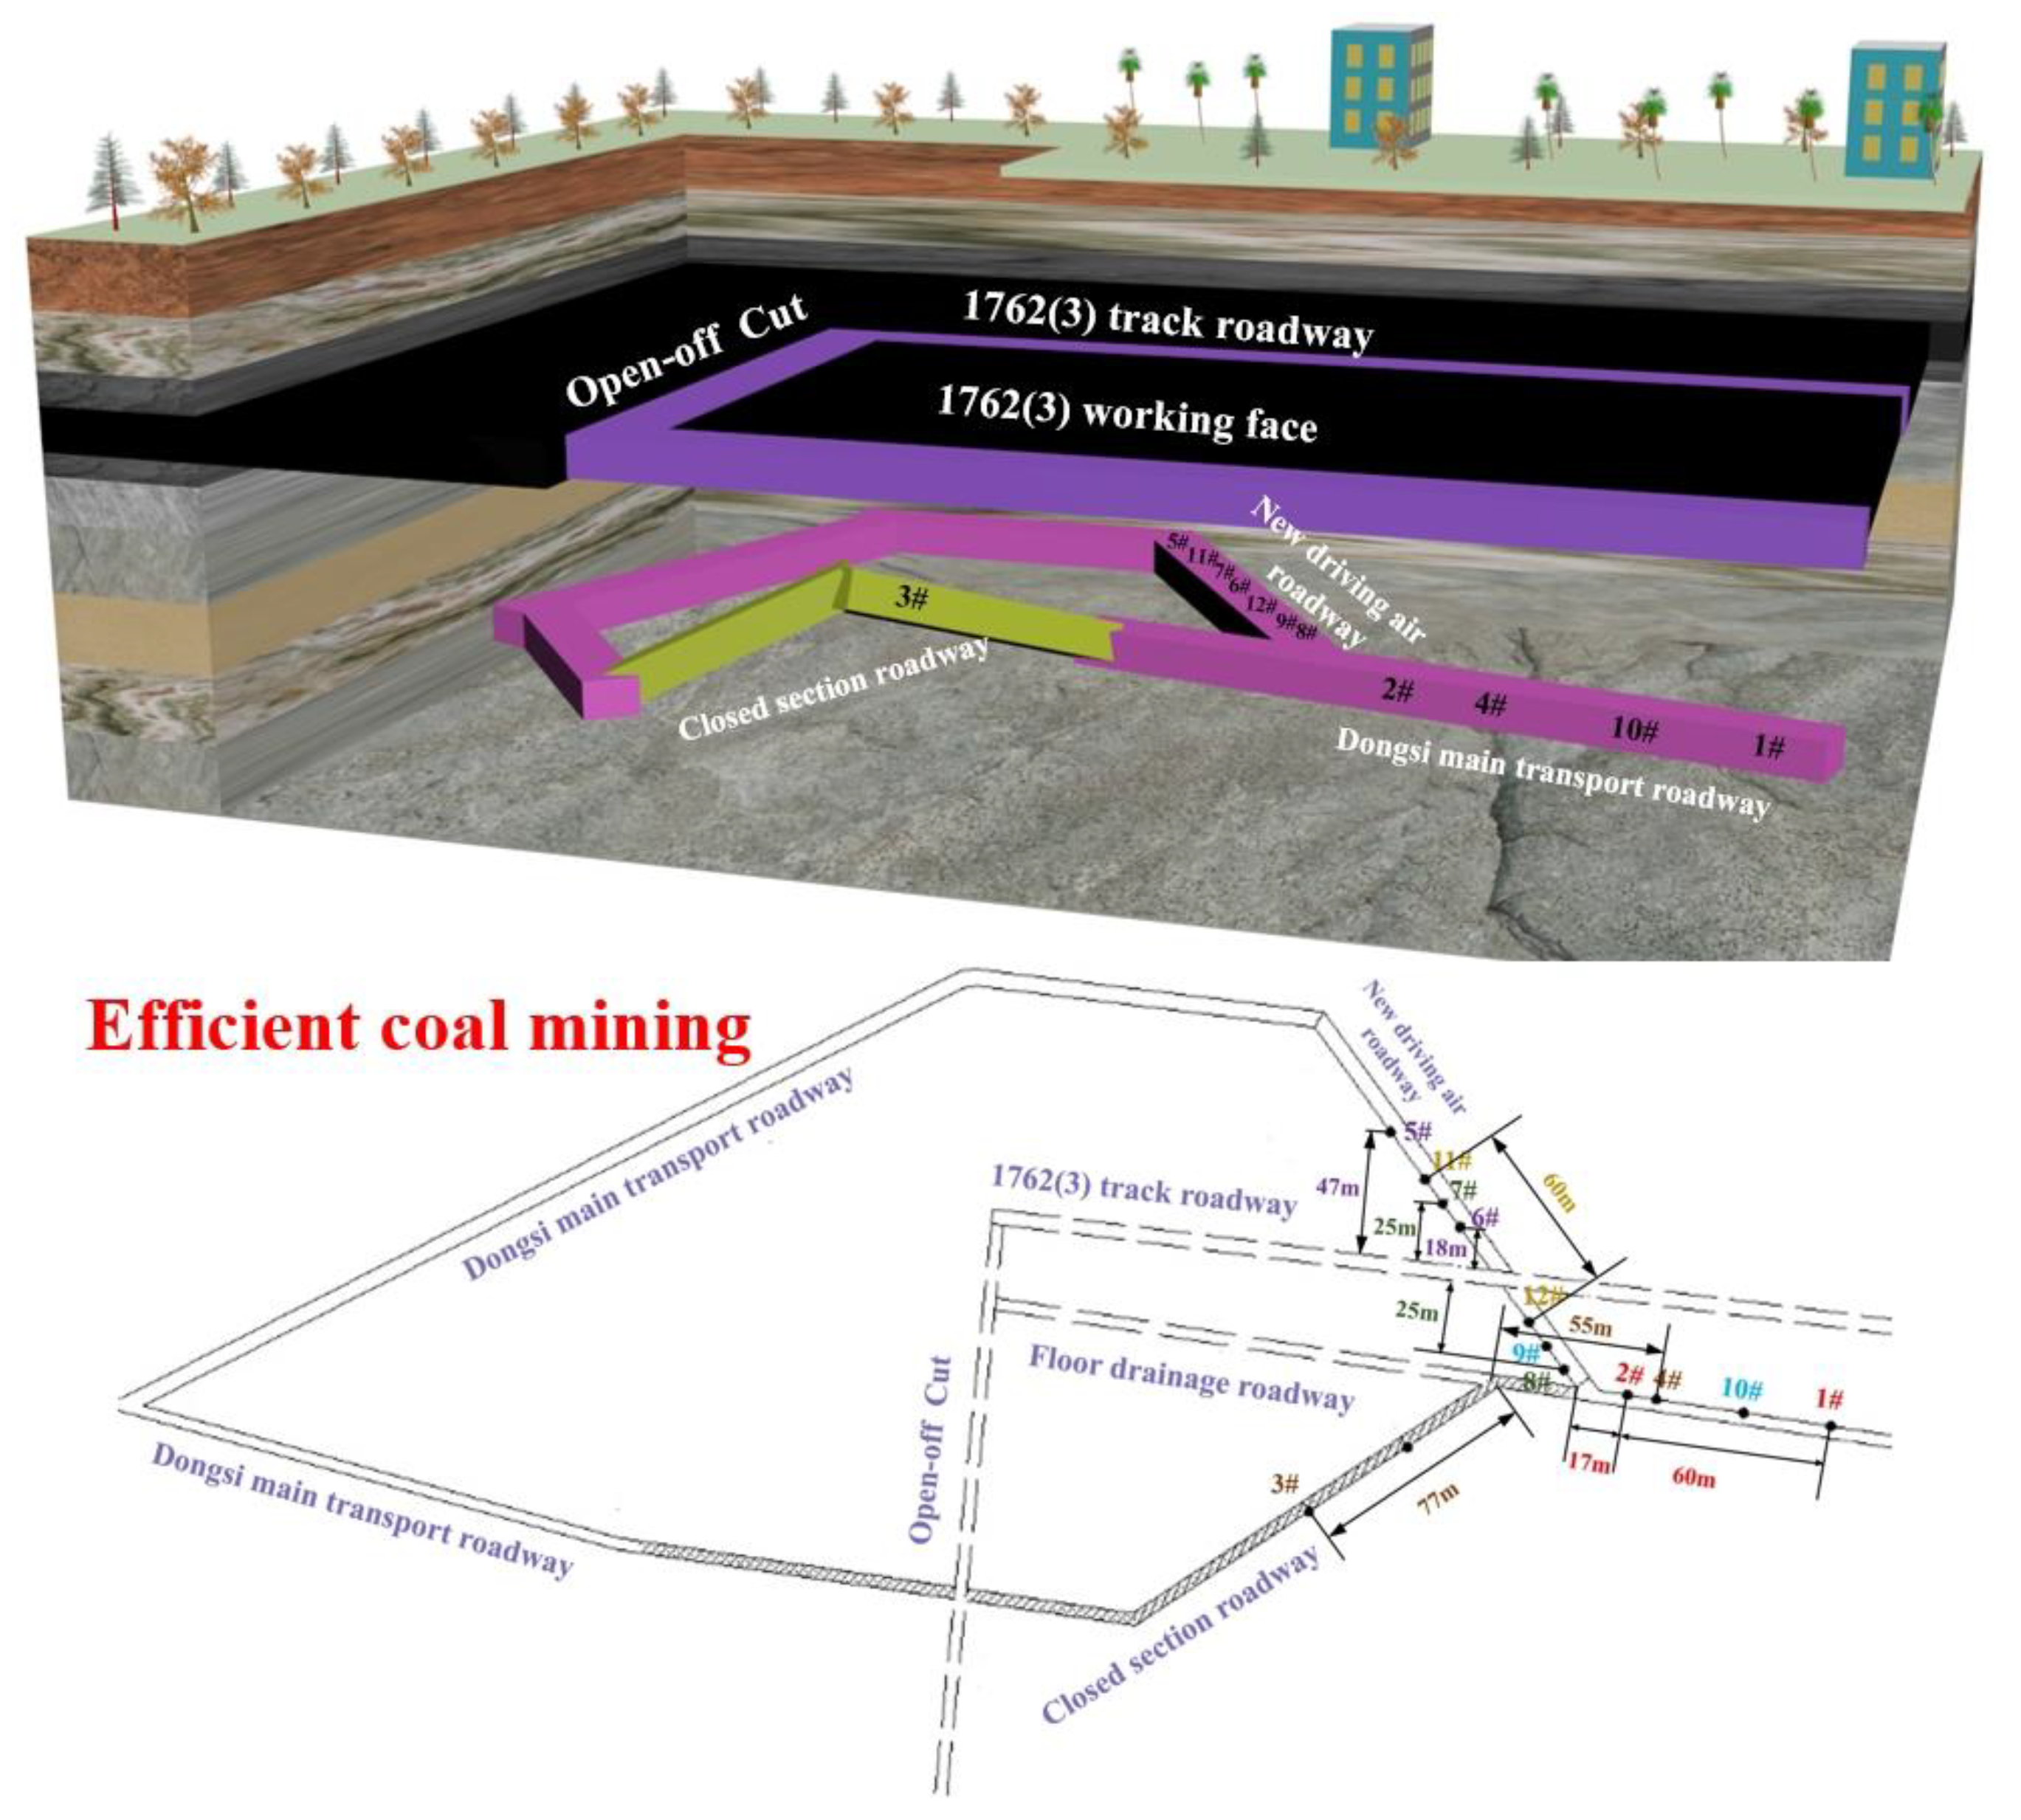
2.1. Engineering Background

The Pansan coal mine is located in the northwest part of Huainan City, Anhui Province, China, and has a design production capacity of 5 MT/A. The Dongsi main transportation roadway of the Pansan coal mine is located in the floor rock of the 1762(3) working face. The elevation of the 1762(3) working face is −590 to −640 m, the mining height is 4.2 m, and the elevation of the Dongsi main transportation roadway is −637 m. The vertical distance between the Dongsi main transportation roadway and the 1762(3) working face is 30–43 m, and the horizontal projection distance between the Dongsi main transportation roadway and the 1762(3) working face is approximately 50 m. The direct roof of the roadway is 2.2-m thick mudstone, the main roof is 4.6-m thick sandy mudstone, the direct bottom is 2.8-m thick mudstone, and the main bottom is 3.5-m thick siltstone. Considering that the distance between the Dongsi transportation roadway close to the cut off of the 1762(3) working face is too close to the working face, and that the surrounding rock has poor lithology, the maintenance of the roadway is difficult and thus a new transportation roadway has been excavated to bypass this section. The layout of the roadway and working face is shown in Figure 2.
Bolt support is used in a few sections of the Dongsi transportation roadway, and the remaining sections are simply supported by a U29 steel shed. The roadway section of the shed supporting section is arched, the section size is net-width × medium-height = 5.6 × 4.3 m, the shed distance is 600 mm. Two rows of bracing bars have been constructed, and the overall stability of the supporting structure is poor. Some U-shaped roof beams are bent and severely inclined, and most of the back plates behind the shed are not solid. From when the roadway starts being affected by the overlying working face mining until the influence tends toward stability, the surrounding rock is damaged in different degrees. Based on data obtained from the continuous observation of the roadway, the roadway deformation and failure situation are shown in Figure 2. When the distance between the roadway and the overlying working face is small, a part of the roof is bent down or even broken by the action of the two sides of the roadway, and a certain portion of the roof is bent upward by extrusion. Additionally, the shed legs of the side part are squeezed and even the back plate falls off.

2.2. Methods

This study mainly used the method of in situ monitoring and numerical simulation; the specific scheme is described below.

2.2.1. On-Site In Situ Mine Pressure Monitoring

Based on the influence of different factors on the stability of the rock surrounding the roadway, six types of measuring points were arranged: different lithology (2#, 1#), different vertical distance between the roadway and the overlying working face (3#, 4#), different horizontal distance between the roadway and the overlying working face (5#, 6#), different positional relationship between the roadway and the overlying working face (7#, 8#), different support form and strength (9#, 10#), and optimized supporting scheme (11#, 12#). The monitoring contents include the deformation of the surrounding rock, deformation velocity, roof separation layer, development of surrounding rock fracture, and so on. The monitoring methods and instruments are the cross-section method, roof separation instrument, and borehole peeping instrument. The specific layout of the measuring points is shown in Figure 3.

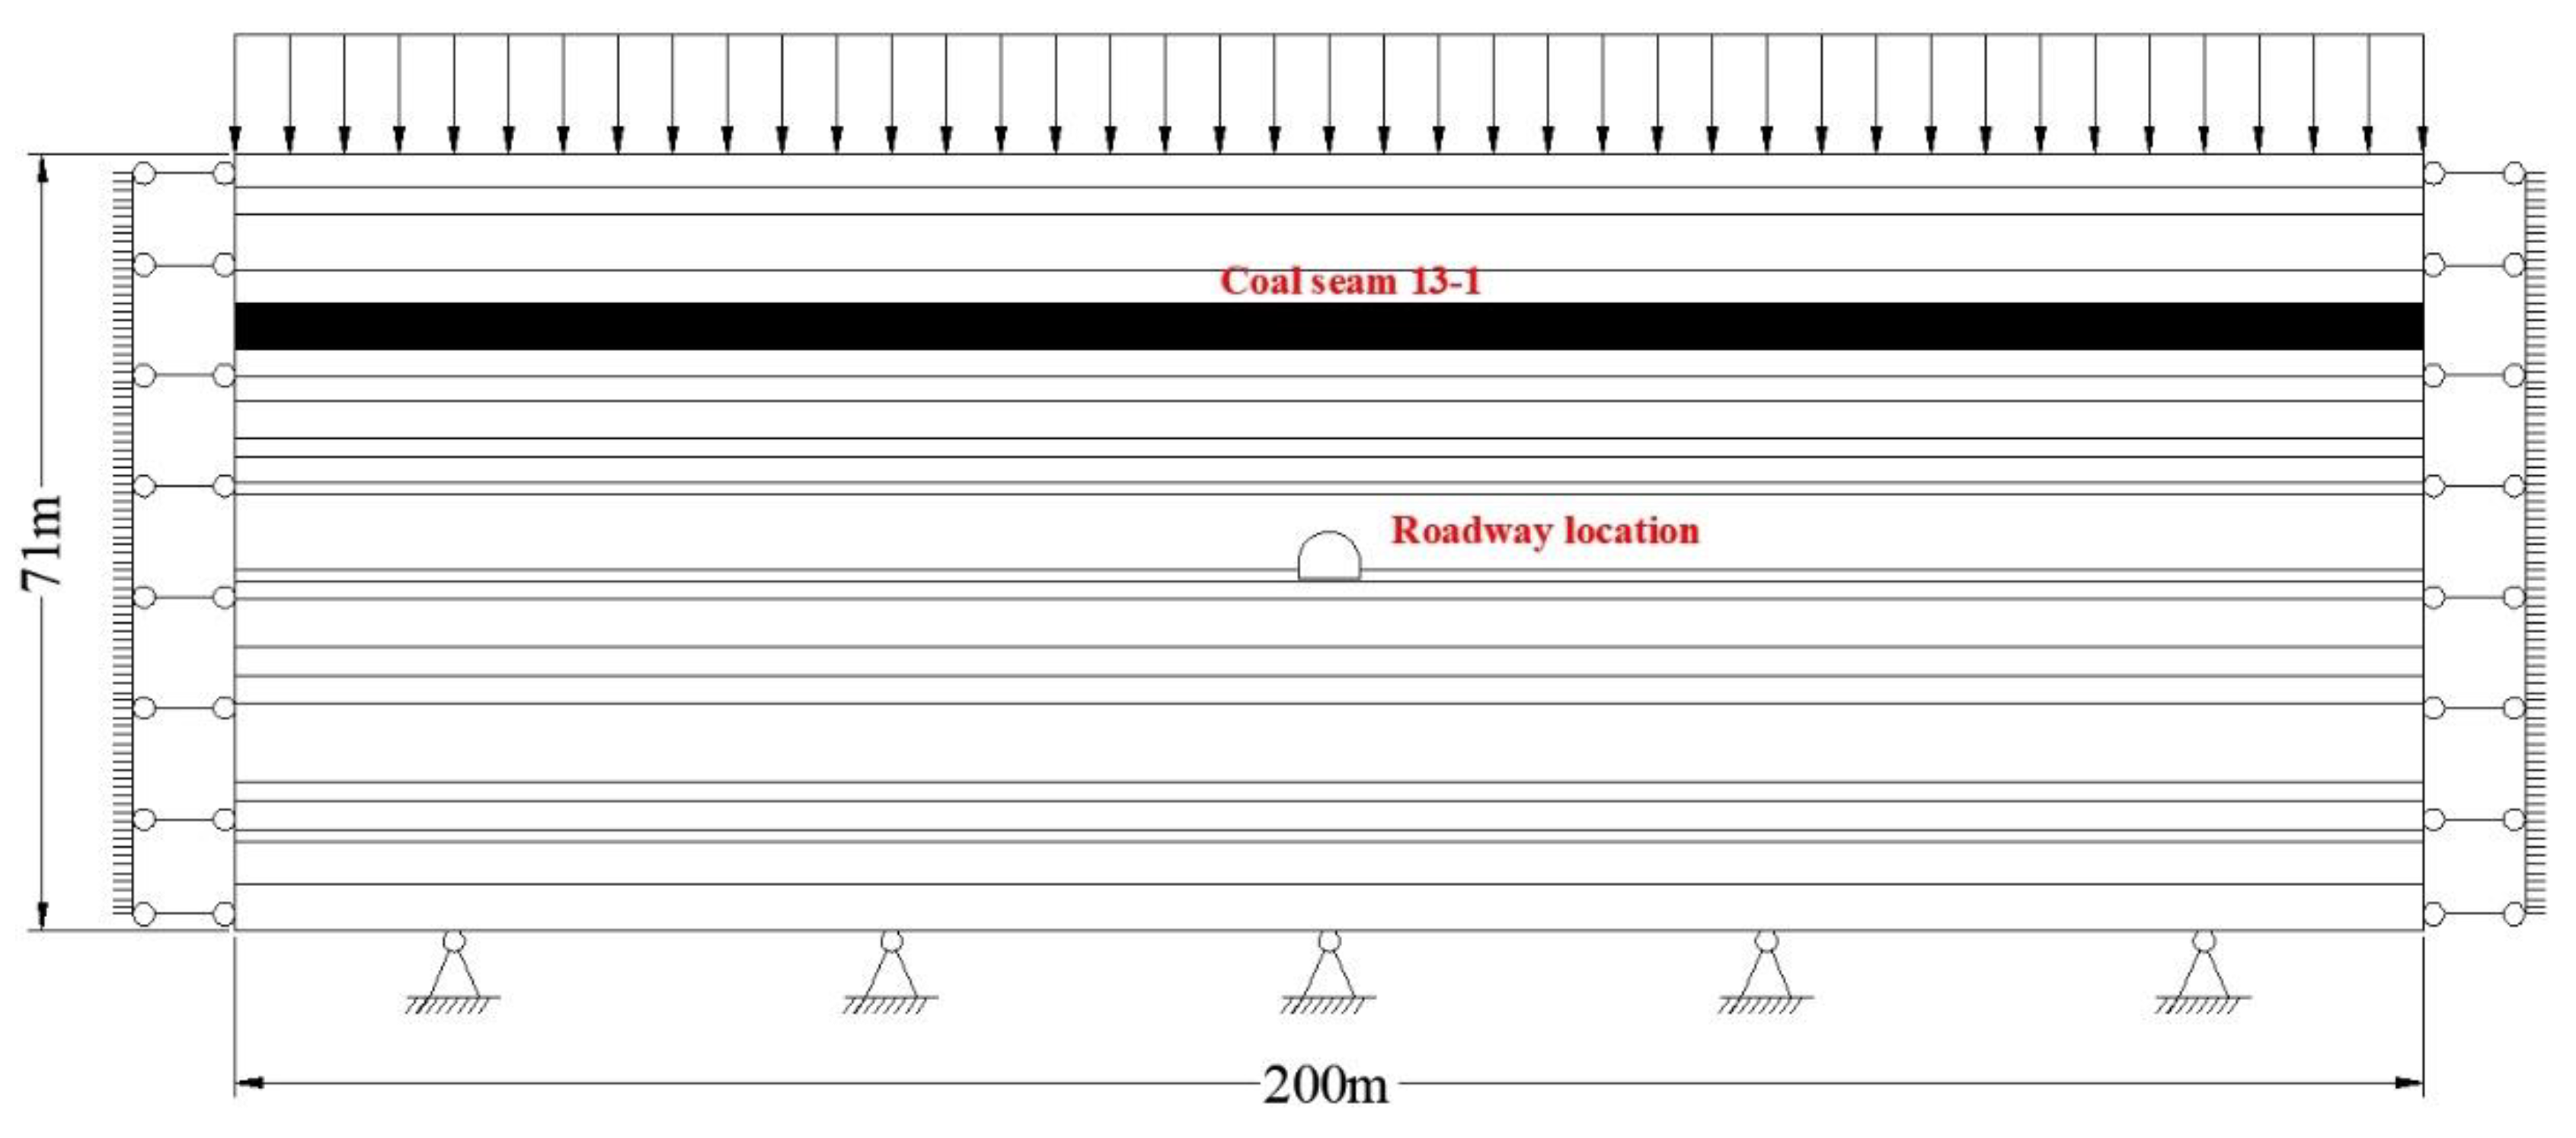
2.2.2. Numerical Simulation Software and Model

According to geological data for the Pansan coal mine, the FLAC2D numerical simulation software was used to establish the corresponding analysis model. The plane strain calculation model shown in Figure 4 was used to simulate the deformation process of the rock surrounding the roadway, and the surrounding rock was considered as a layered isotropic elastic medium. The calculation model size is length×width = 200 × 71 m, divided into 25,680 units, the rock mass element grid is divided into hexahedral elements. In order to balance the calculation accuracy and speed, the grid division around the roadway is dense and the grid division away from the roadway is sparse, which can effectively reduce the sawtooth shape in the stress nephogram. The left, right, and lower boundaries of the model were displacement fixed–constraint boundaries, and the upper boundary was the stress boundary. The uniformly distributed load was applied according to the thickness of the overlying strata. The buried depth of the roadway was about 600 m, the overlying load was 15 MPa, the lateral pressure coefficient was 1, and the gravity was set to 10 m/s2. At the same time, the structural plane was applied at the upper and lower boundaries of the coal seam to avoid the mutual embedding of the overlying roof collapse and the floor strata after the excavation of the working face, the constitutive relationship of the surrounding rock is the Mohr Coulomb model. The roadway was located in the bottom sandstone layer of the working face, and the vertical distance from the overlying working face was 30.3 m, and the cross-section of the roadway was arched, the cross-section size is net-width × middle-height = 5.6 × 4.3 m. The mechanical parameters of the rock were selected as presented in Table 1. The simulation process is as follows: calculation of original rock stress balance; calculation of model not affected by mining; calculation of affected by mining of 13–1 coal seam.

3. Results and Analysis

3.1. In Situ Test for Surrounding Rock Stability of Obliquely Straddle Roadway under Different Influencing Factors

3.1.1. Influence of Different Lithology on Stability of Surrounding Rock

In the layout of the measuring points shown in Figure 3, the measuring points 2# and 1# were both arranged in the tunnel of the shed section. The distance between the two measuring points was 60 m, and the distance from the upper mining face was approximately 30 m. According to the borehole detection data, both sides of the roadway at the 2# and 1# survey points are medium sandstone with moderate hardness. The sandstone lithology in the 2# measuring point is relatively brittle and can easily fracture under the influence of mining. The roof is hard sandstone. The floor of the 1# measuring point contains approximately 7.2 m of sandy mudstone and clay rock, and the thickness of the sandy mudstone at the 2# measuring point is only approximately 3.3 m.
The deformation of the two sides, the deformation of the roof and floor, and the deformation velocity of the measuring points 2# and 1# are shown in Figure 5.
As can be seen in Figure 5, the surface displacement of measuring point 2# starts being affected by the mining when it is approximately 40 m ahead of the working face, and 1# only starts being affected by advance mining when it is 20 m away from the working face. The accumulated deformation of the 2# measuring point is approximately 28 mm, and that of the 1# surface displacement measuring point is 14 mm. The deformation of the right side (leeward) of the roadway at the two measuring points is approximately 10 mm larger than that of the left side. After mining approximately 70 mm, the deformation of both sides gradually tends toward stability. After the working face is pushed through the measuring point, the accumulated deformation of the 2# and 1# measuring points is 90 and 120 mm, respectively, and the deformation of the roadway roof and floor at both sides continues. From the deformation velocity of the roof and floor, the maximum moving velocity for the roof and floor of the 2# and 1# measuring points is 4.25 and 7 mm/d, respectively. After the working face pushes over 70 m, the deformation velocity of the roadway at the two measuring points sharply decreases and gradually tends toward stability.
Through the deep detection of the surrounding rock near the 2# and 1# measuring points, the deep separation layer and fracture development of the surrounding rock at the side were observed as shown in Figure 6. From the drilling detection at different depths shown in Figure 6, it can be seen that the left and right sides of the roadway are relatively fractured within the range of 1.5 m near the 2# measuring point. In addition to the various cracks at approximately 2.5 m on the right side, there is no obvious fracture phenomenon in the surrounding rock at the depth of the measuring point. Moreover, from the perspective of the fragmentation degree, the right side is obviously larger than the left side, which leads to the displacement of the right side of the roadway and is greater than the displacement of the left side. The left side of the roadway near the 1# measuring point was relatively fractured in the range of 1.0 m, from 1.5 to 3.0 m, and crack development was not observed in the rock surrounding the roadway. However, when the depth was 3.5–4.5 m, cracks in the rock surrounding the roadway developed to a certain extent. This indicates that, in this section, the surrounding rock was relatively fractured, compared with other sections, and that the surrounding rock properties are poor. Therefore, when the mining stress is transferred to the side of the floor roadway, the surrounding rock in this section is prone to plastic deformation or even brittle failure. The fracture of the surrounding rock on the right side of the roadway is mainly concentrated in the range of 1.0 m, and there is essentially no crack development in the deep part of the surrounding rock. According to the shape of the hole’s inner surface, there are circular ripples on the surface of the borehole when the hole is 1.5–2.5 m, while the surface of the borehole is spiral at the depth of the borehole, particularly when the hole is 3.5–4.5 m. This indicates that the hardness of the rock mass is quite different at different borehole depths. When the surrounding rock is soft, the surface of the drilled hole has a circular or non-obvious ripple. However, when the surrounding rock is hard, the ripple on the surface of the hole has spiral form.

3.1.2. Influence of Vertical Distance and Horizontal Distance between Roadway and Overlying Working Face End on Surrounding Rock Stability

To investigate the influence of the vertical distance and horizontal distance between the Dongsi main transportation roadway and the end of the overlying working face on the stability of the surrounding rock, four measuring points were arranged. In the vicinity of measuring point 3#, the vertical distance between the roadway and the overlying 1762(3) working face is only approximately 10 m, while in the vicinity of the 4# measuring point, the vertical distance between the roadway and the overlying working face is approximately 30 m. The horizontal distance between the measuring point 5# and the overlying 1762(3) working face is approximately 47 m, while that of 6# is approximately 18 m.
The vertical distance between the 3# and the 4# measuring point and the working face is different, and the deformation amount and deformation velocity curve of the upper part are shown in Figure 7.
As can be seen in Figure 7, the cumulative deformation of the two sides near the 3# measuring point is 90 mm, the maximum deformation speed reaches 3 mm/d, and the average deformation speed is 1 mm/d during the mining influence. The deformation of the surrounding rock slope tends toward stability when the working face pushes through the measuring point at approximately 100 m. The cumulative deformation of the two sides of the 4# measuring point is approximately 25 mm, and the maximum deformation velocity is 2 mm/d. The average deformation velocity during mining is only approximately 0.7 mm/d. The deformation of the side begins to stabilize after the working face pushes over the measuring point at approximately 50 m. Therefore, as the vertical distance between the roadway and the working face becomes smaller, the degree of the mining influence increases, and the mining influence time after the working face is mined becomes longer. For the 3# measuring point, the maximum deformation velocity of the roof and the floor of the roadway under the mining of the overlying working face reaches 12 mm/d, and the average deformation velocity is still 2 mm/d when the working face passes the 3# measuring point by 100 m. However, for the 4# measuring point, the maximum deformation velocity of the roadway top and floor is 6 mm/d, and the average deformation velocity of the roadway is only 1 mm/d at 80 m after the measuring point.
Measuring points 5# and 6# are both located in the new combined roadway, and the supporting mode and surrounding rock properties are essentially the same. Before and after mining, owing to the difference of the horizontal distance from the working face, the rock surrounding the roadway also has different deformation and failure degrees. One of the most obvious characteristics is the difference of the roadway surface displacement; details are shown in Figure 8.
As can be seen in Figure 8, during the mining of the overlying working face, the maximum deformation velocity on the two sides of measuring point 5# was approximately 2.5 mm/d. As the working face moved forward, the deformation fluctuated on both sides, but tended toward stability overall. Under the influence of mining, the maximum deformation velocity on both sides of the 6# measuring point was 5.5 mm/d, which is twice that of measuring point 5#. The maximum approaching velocity of the roof and floor near measuring point 5# was 4.5 mm/d, and its average moving speed was approximately 2 mm/d under the mining influence. The maximum moving speed of the roof and floor near measuring point 6# was approximately 14 mm/d, while the average deformation velocity of the working face before and after mining was 4 mm/d, which is twice that of measuring point 5#.

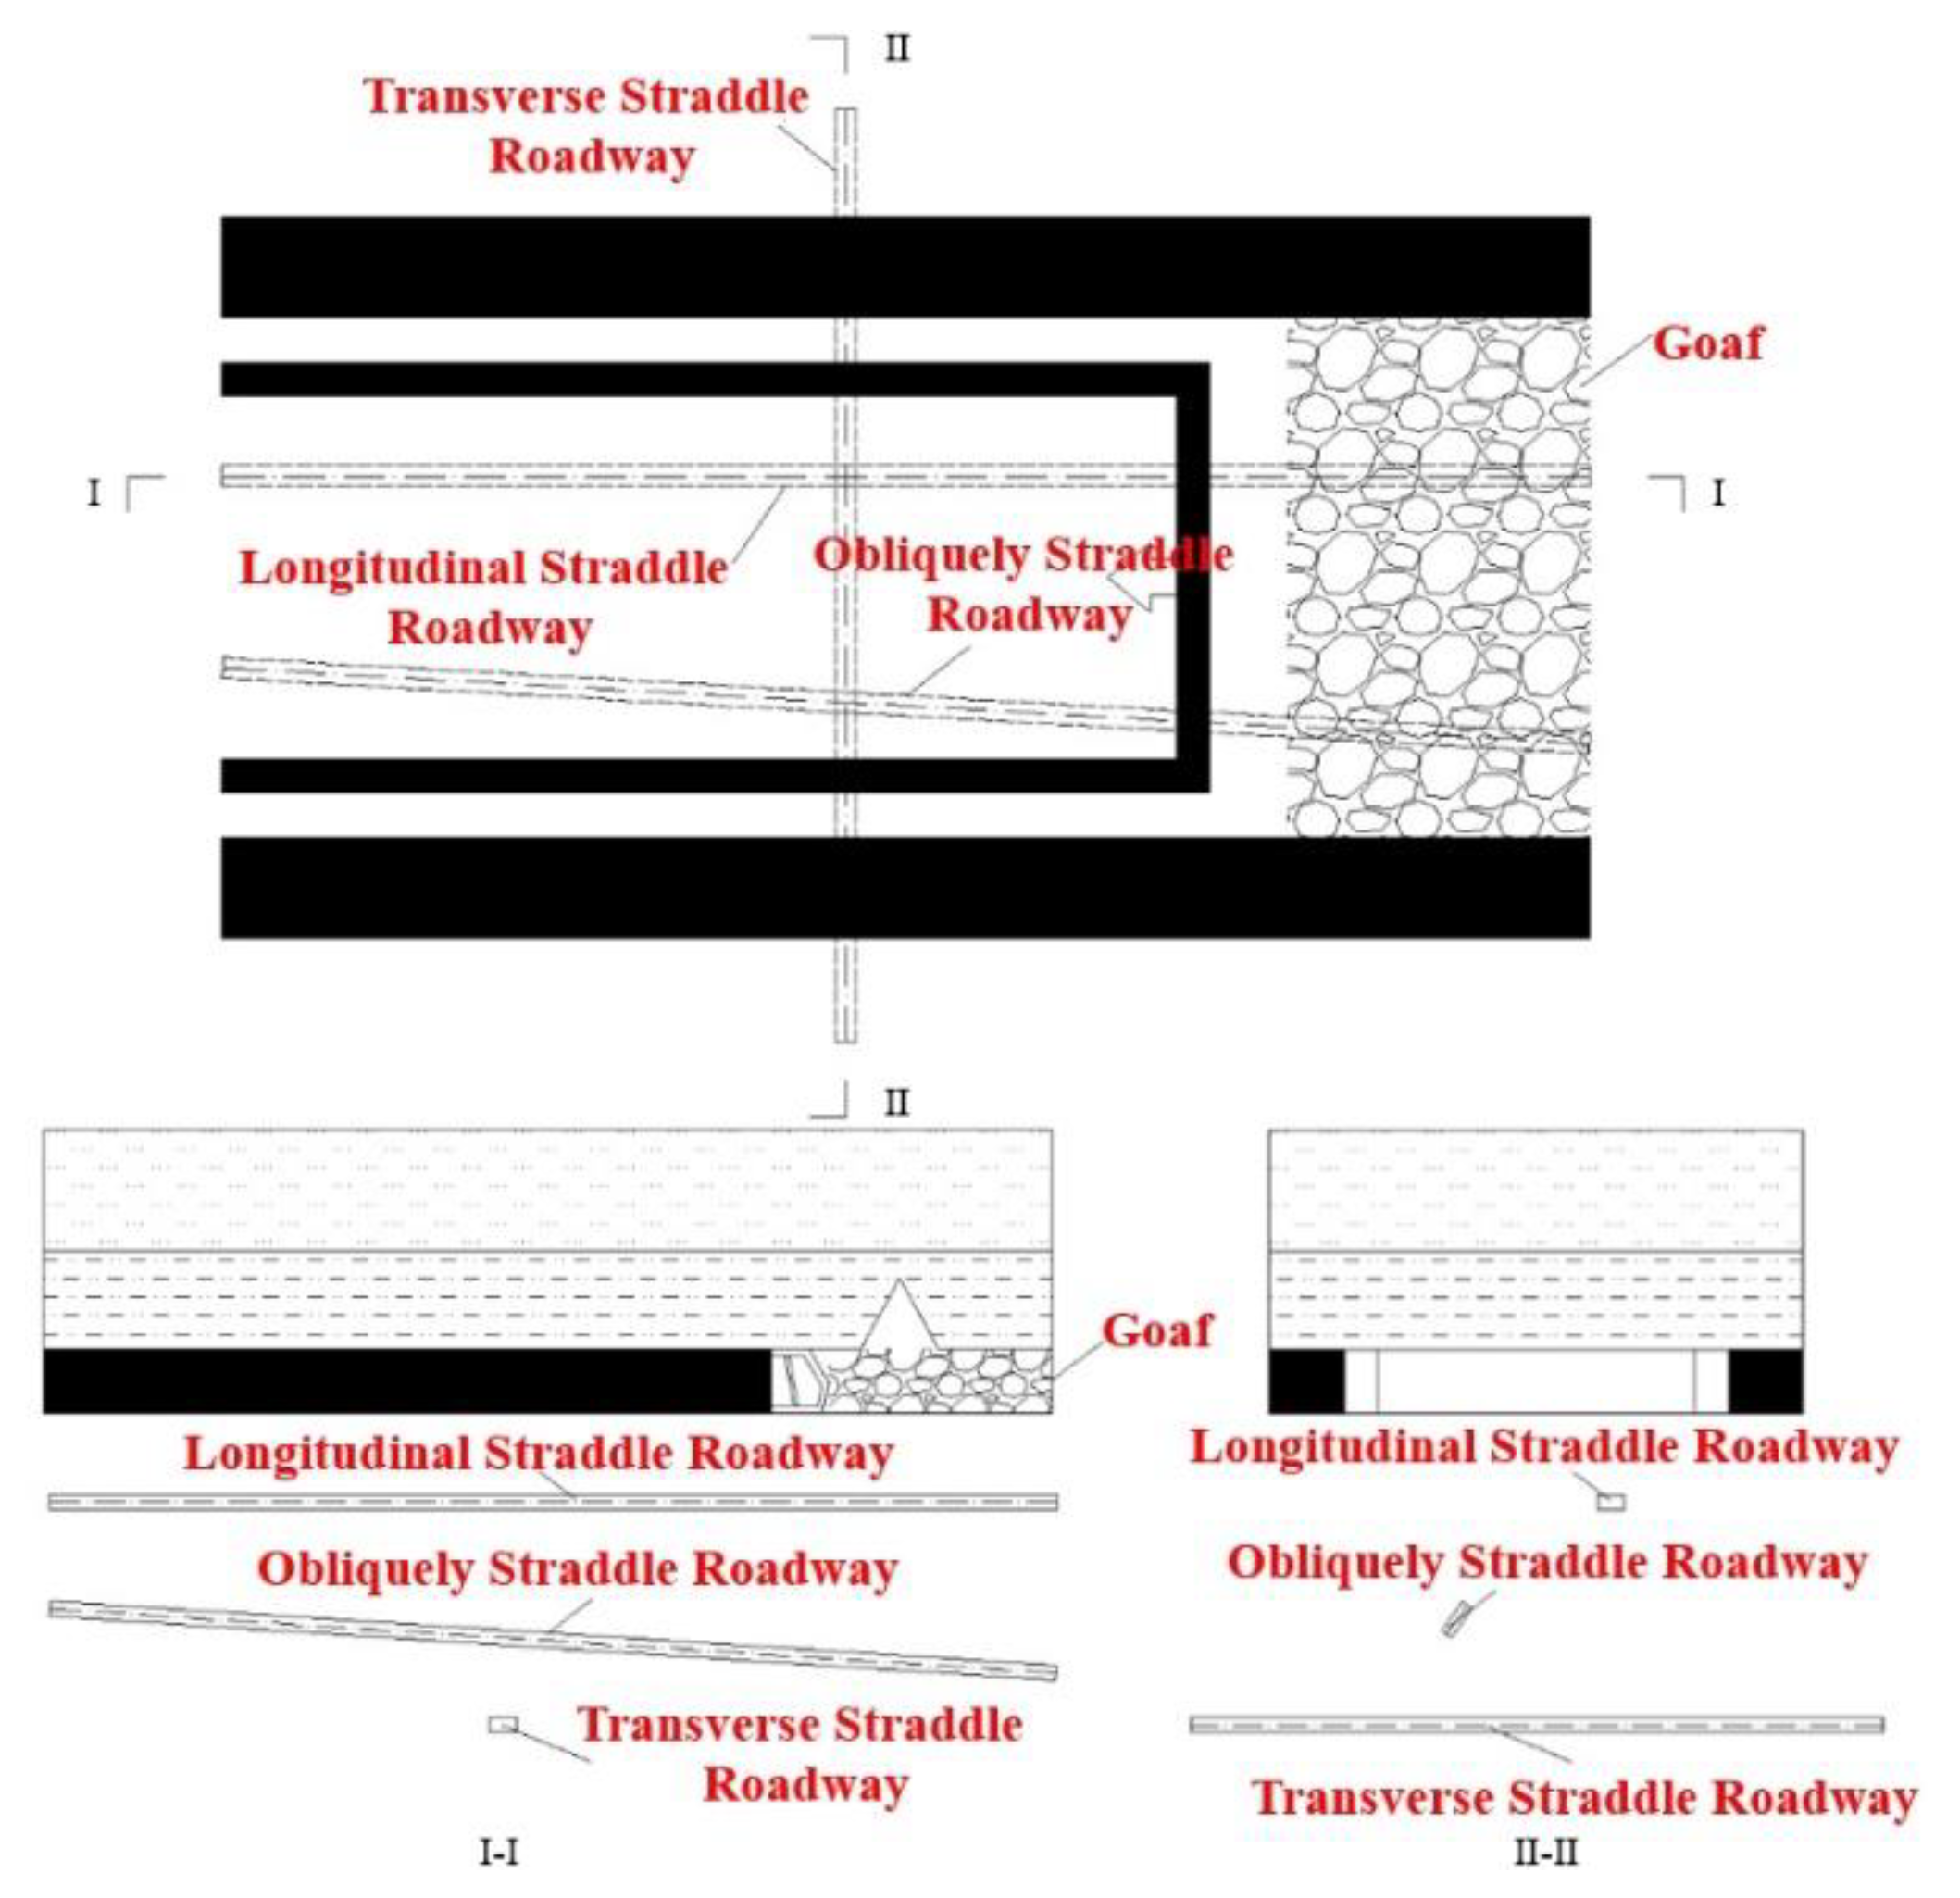
3.1.3. Influence of Position Relationship between Roadway and Overlying Working Face on Surrounding Rock Stability

In view of the particular position of the Dongsi transportation roadway, the working face and roadway in the joint roadway section are inclined across. Owing to the stability of the surrounding rock in the shed section, the deformation of the surrounding rock is small. In this study, the influence of the roadway on the surrounding rock deformation and failure was only analyzed under the lateral and lower conditions of the working face.
The horizontal distance between the 7# and 8# surface displacement measuring points and the track gateway is approximately 25 m, and the vertical distance is essentially the same as that of the overlying working face, wherein 7# is located at the lateral position of the overlying working face and 8# is located directly below the overlying working face. Because 7# and 8# are located in the newly excavated combined roadway section, the deformation law of the rock surrounding the roadway is quite different owing to the different position of the working face under the conditions of the support mode, same normal distance with the track gateway, and similar surrounding rock properties.
It can be seen from Figure 9 that the maximum deformation of the two sides of 7# measuring point is 70 mm, the maximum deformation velocity is 6 mm/D, and the average deformation velocity during mining is 2 mm/d. Moreover, the surrounding rock of the roadway is still not stable, and the deformation is still continuing after the working face passes through the measuring point about 160 m. The maximum approaching amount and velocity of roof and floor are 160 mm and 17 mm/d. After the working face passes this measuring point, the lateral abutment pressure still has a great influence on the deformation and failure of the surrounding rock of the roadway, and the average moving speed of the two sides can still reach 4 mm/d. The maximum deformation of both sides of the roadway at 8# measuring point is 9 mm, the maximum deformation velocity is about 1.5 mm/d, and the average deformation velocity affected by mining is 0.6 mm/d. When the working face passes the measuring point about 60 m, the surrounding rock begins to become stable, and the maximum approaching amount and velocity of roof and floor are 17 mm and 1.5 mm/d respectively. After the overlying working face crosses this point, the residual abutment pressure of goaf has little influence on the surrounding rock deformation, and when the working face has been mined for about 70 m, the surrounding rock of roadway has been stable.

3.1.4. Influence of Support Form and Strength on Surrounding Rock Stability

According to the support mode of the Dongsi main transportation roadway, the original support at the 10# measuring point was scaffolding support with a shed distance of 600 mm, and two rows of bracing bars were constructed. The roadway at the 9# measuring point is supported by bolt and anchor cable. The bolt specification is Φ20 × 2.2 m, the spacing between the rows is 700 × 700 mm, the specification of the anchor cable is 18 mm × 6.3 m, the spacing between the rows is 1400 × 1400 mm, and the arrangement form of the anchor cable is 3–0-3. The measuring points 9# and 10# are located under the working face, and the surface displacement and deformation law are shown in Figure 10.
As can be seen in Figure 10, when the roadway is supported by bolt and cable and the overlying working face is directly above the 9# measuring point, the slope starts being affected by the mining stress and the maximum deformation velocity is only 1 mm/d. When the working face passes the measuring point at approximately 70 m, the surrounding rock deformation velocity is 0.5 mm/d, which indicates that the roadway gradually becomes stable. The distance between the 10# measuring point and the working face is 90 m, owing to the influence of mining. When the working face crosses the measuring point at 50 m, its deformation speed can still reach 2 mm/d, which indicates that the rock surrounding the roadway is still affected by mining.

3.2. Simulation of Surrounding Rock Stability for Inclined Span Roadway under Different Support Conditions

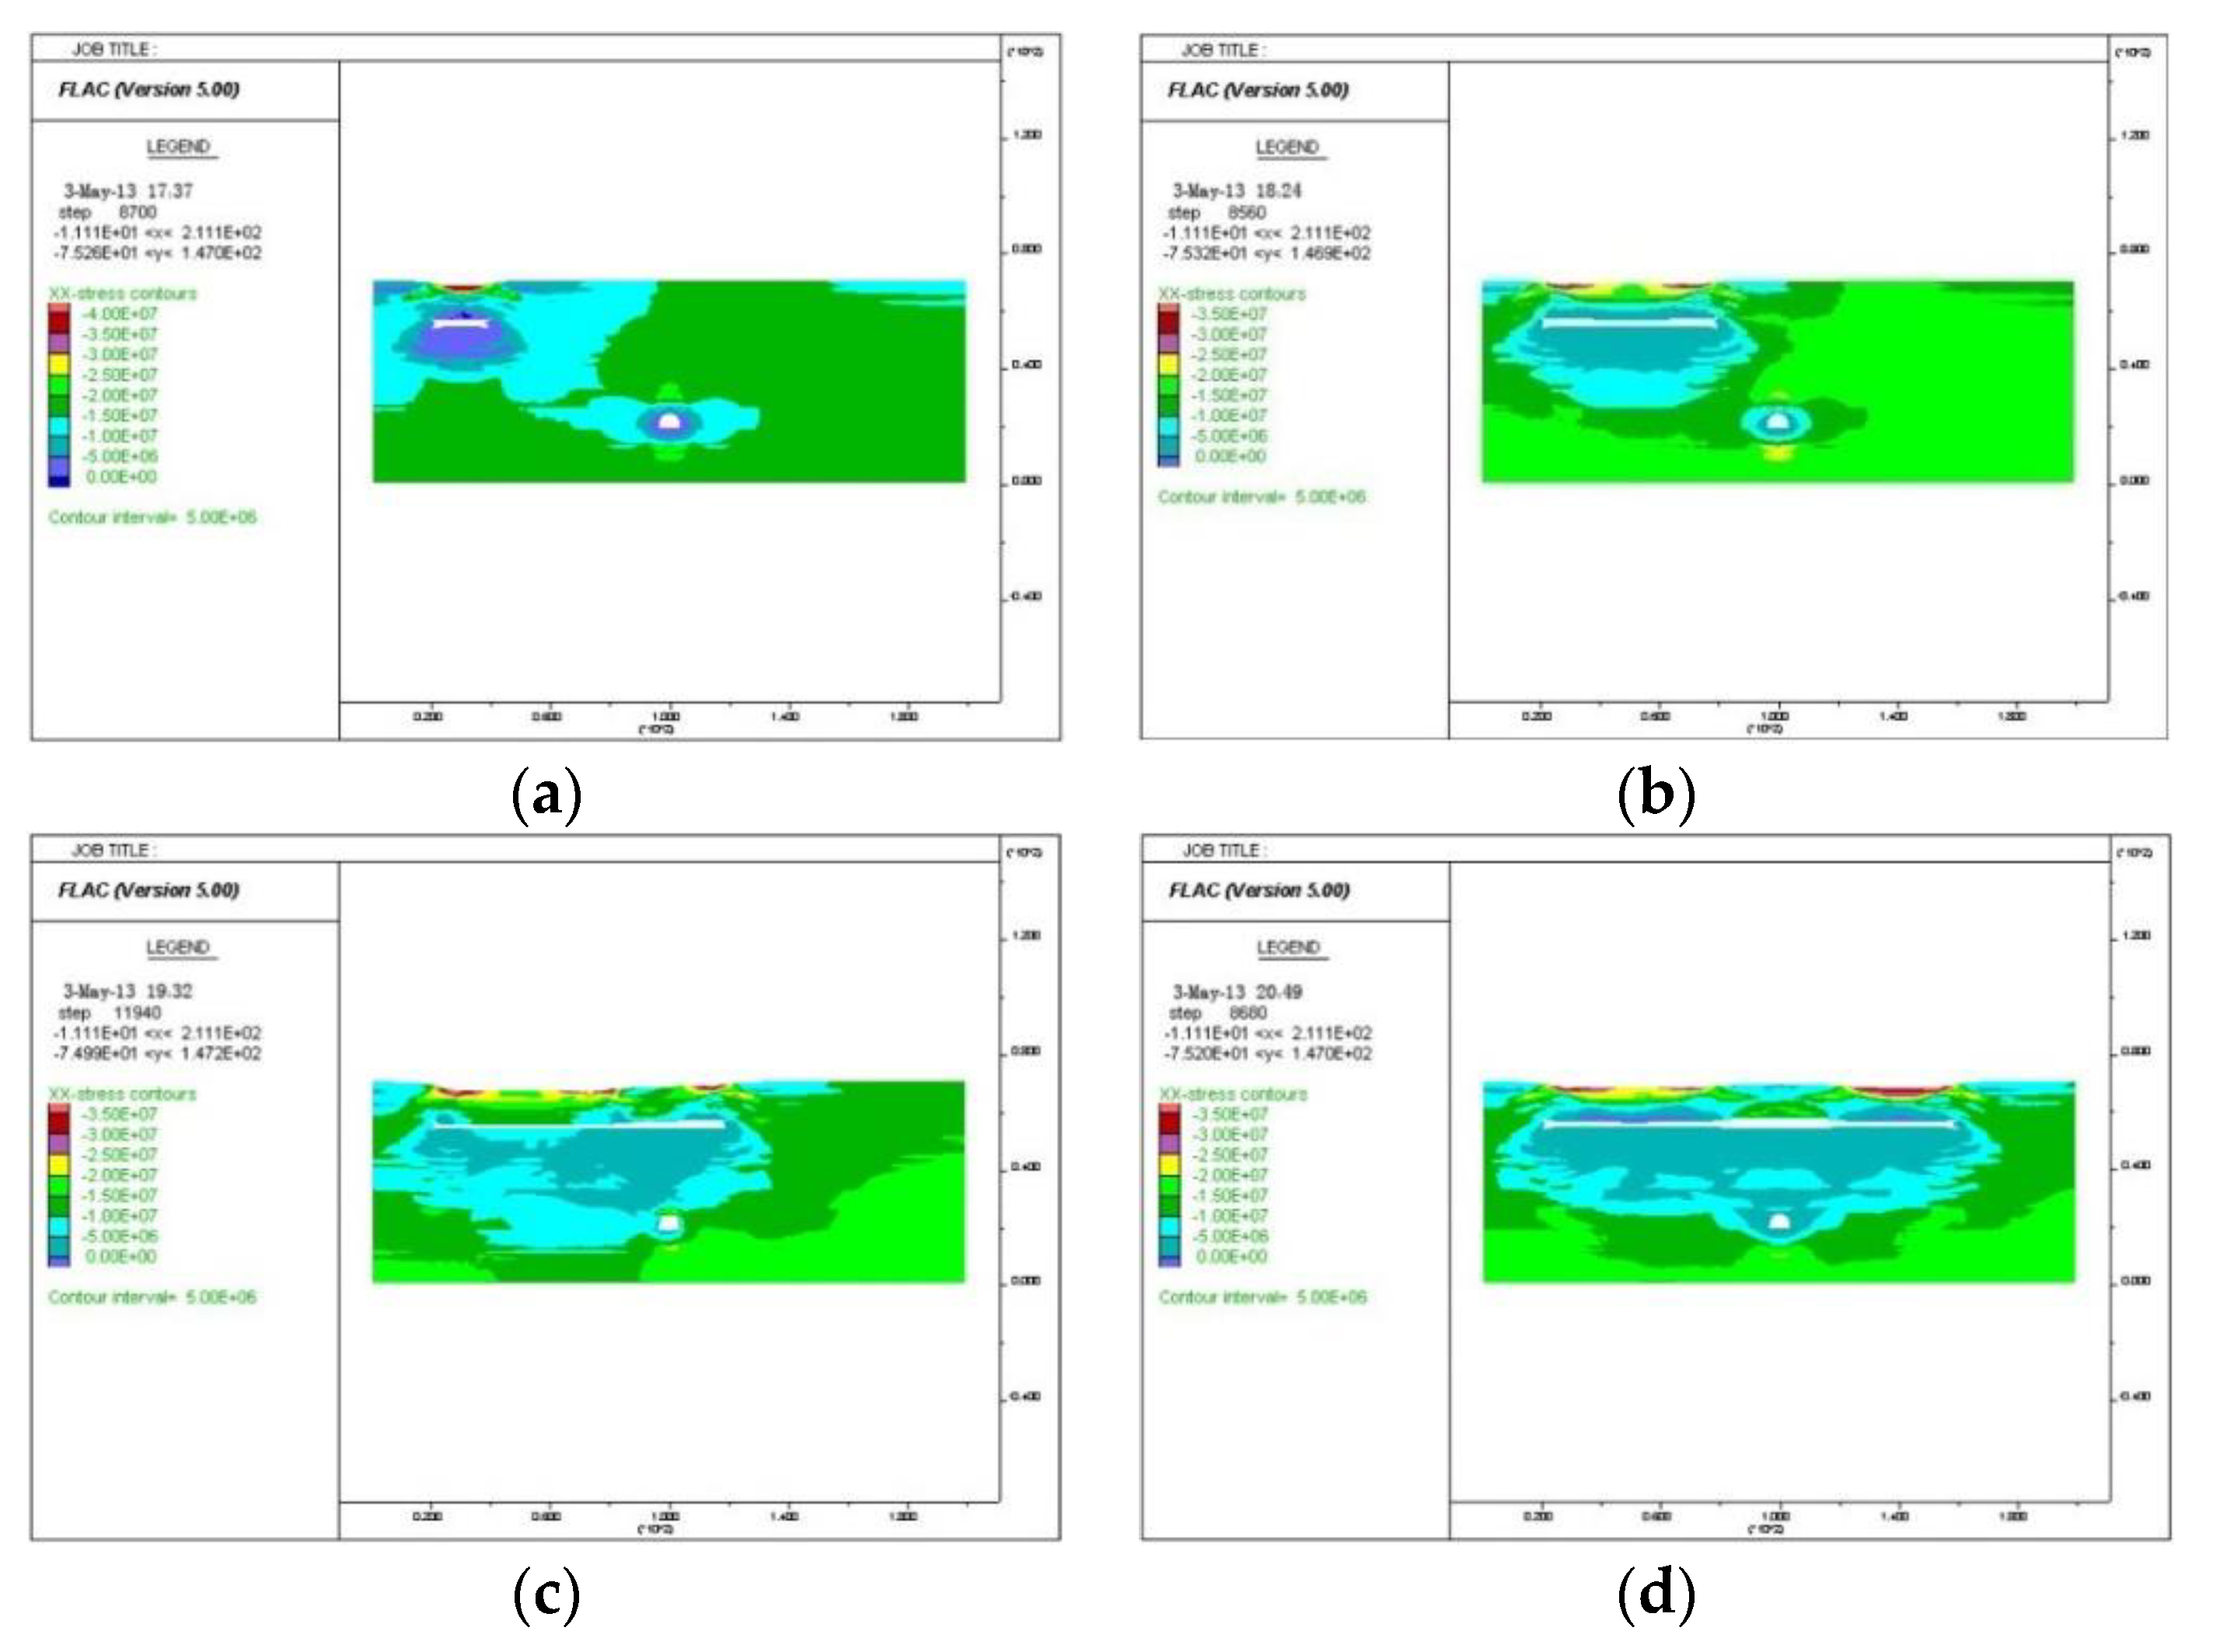
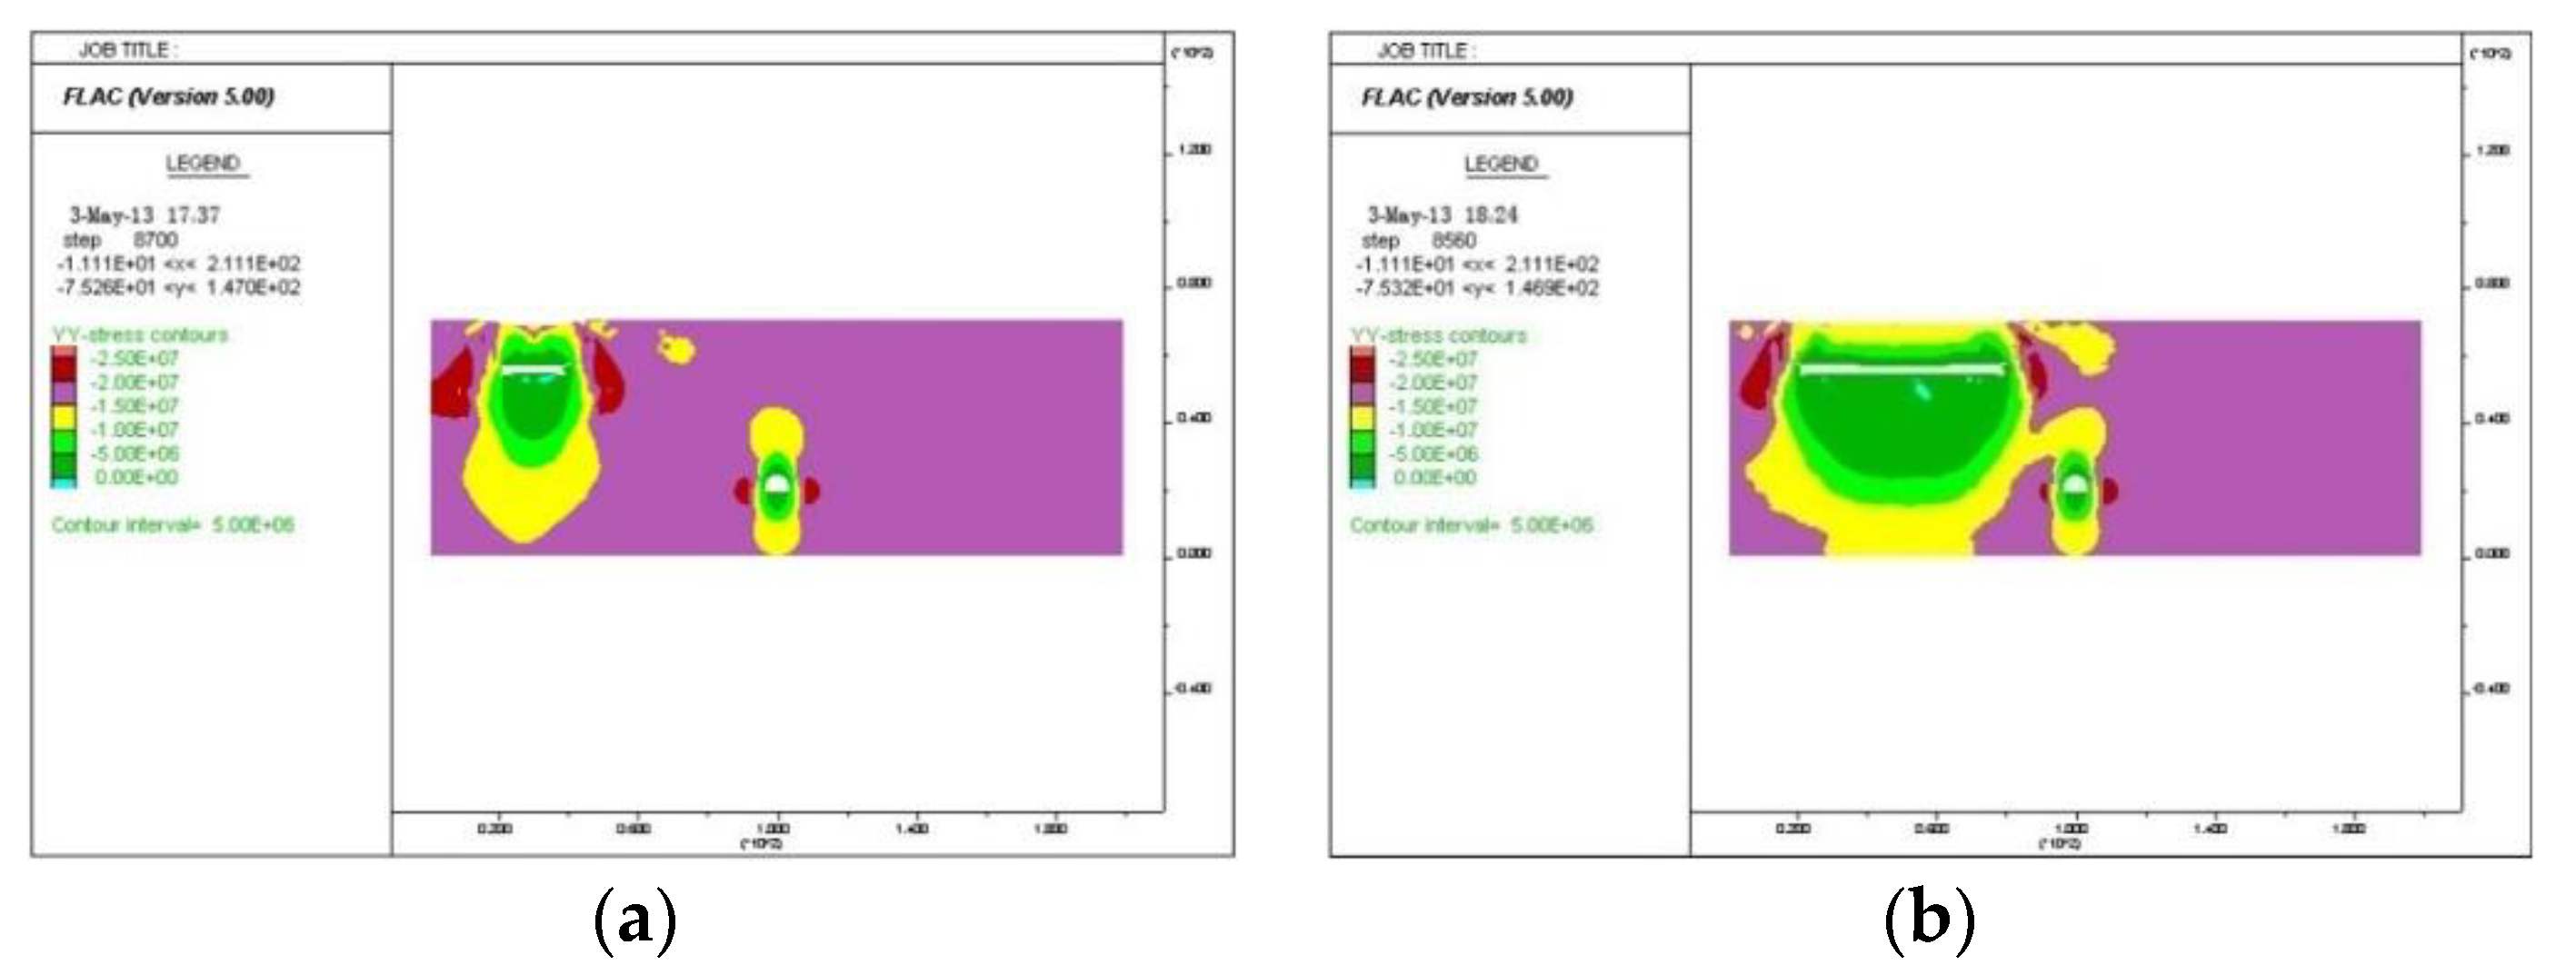
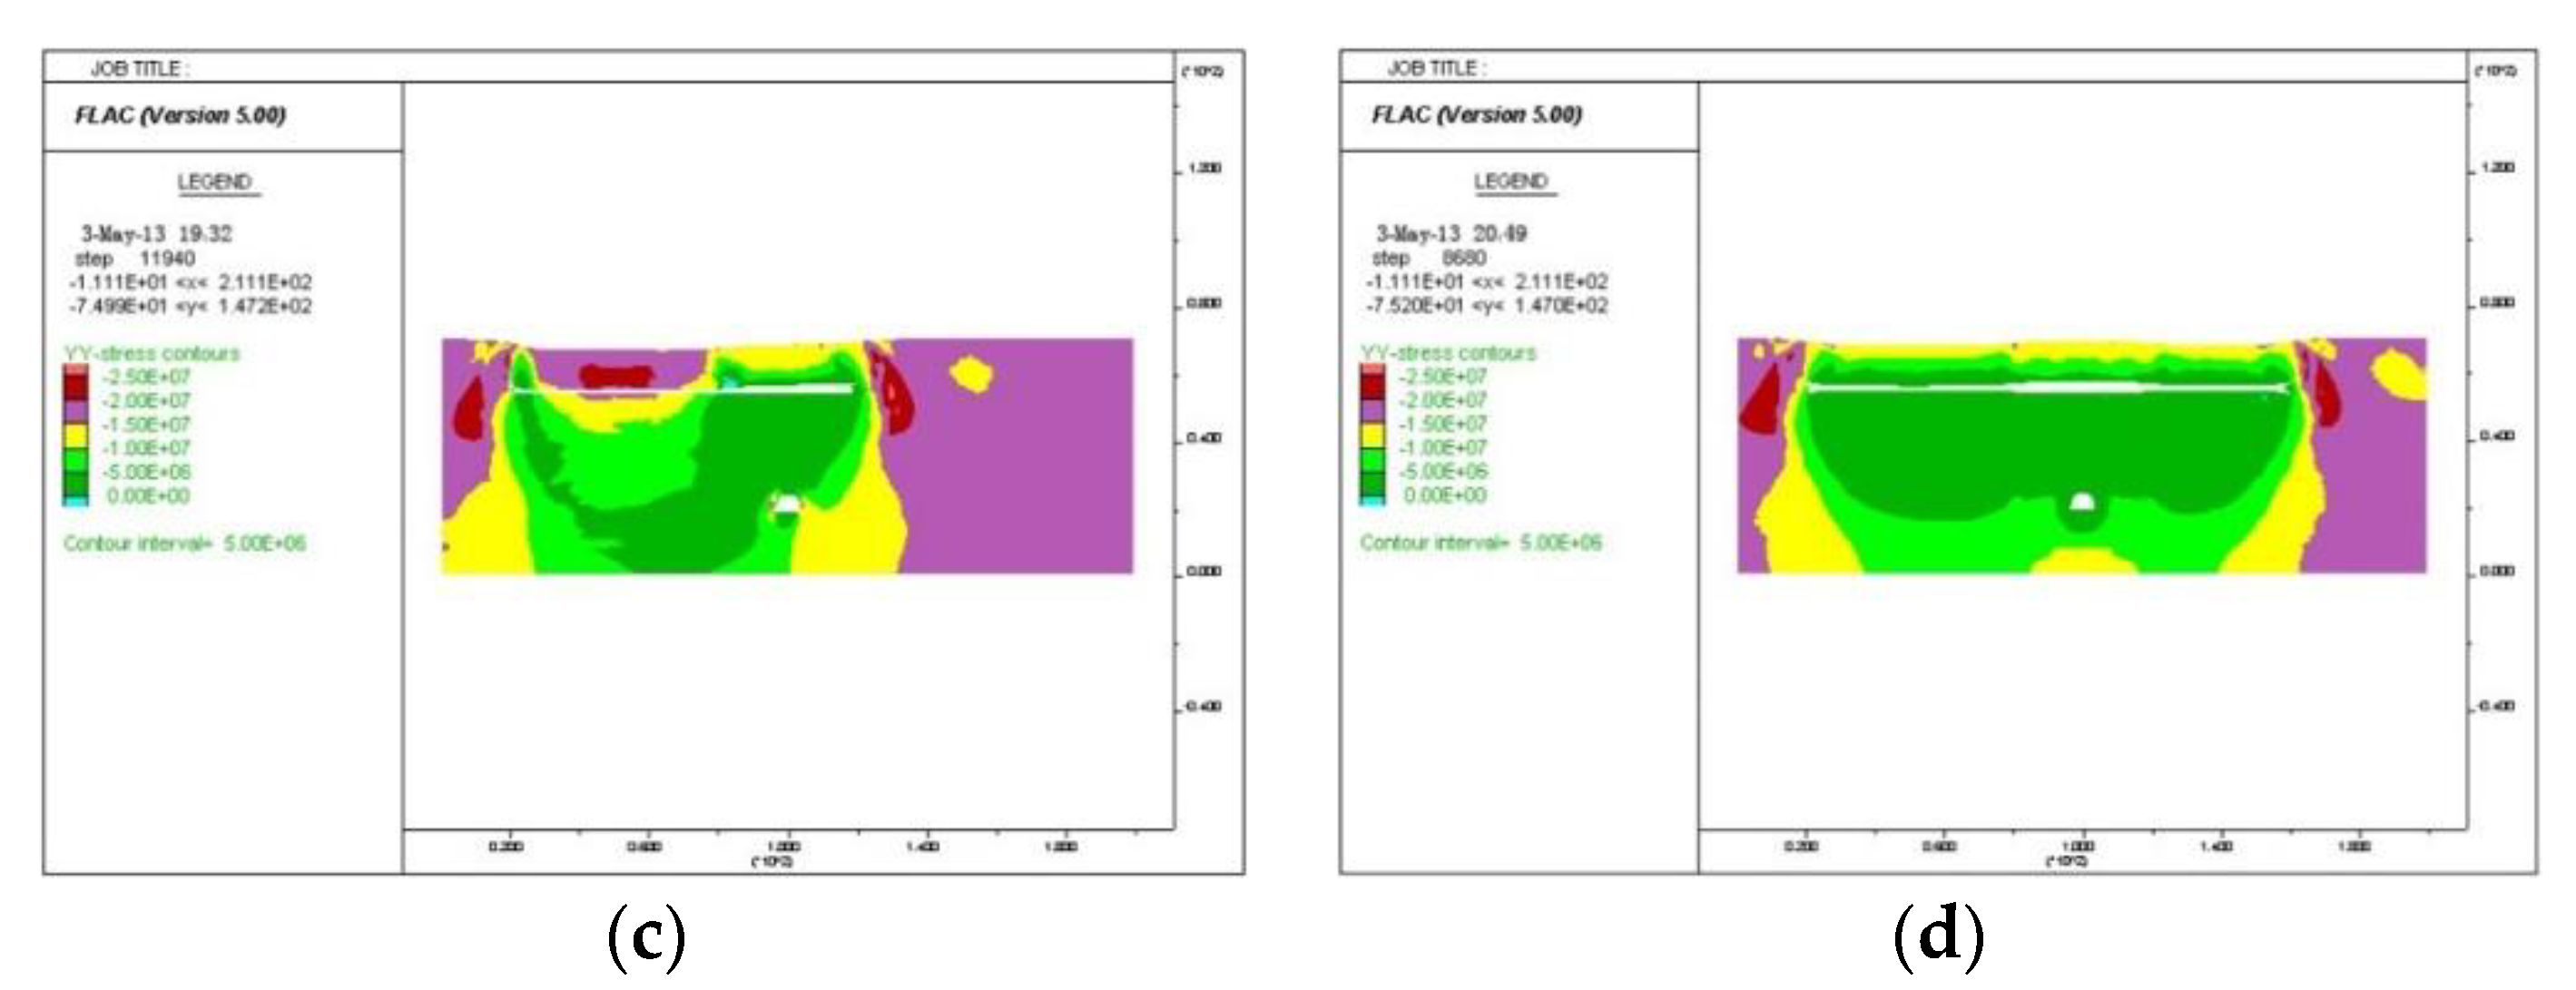
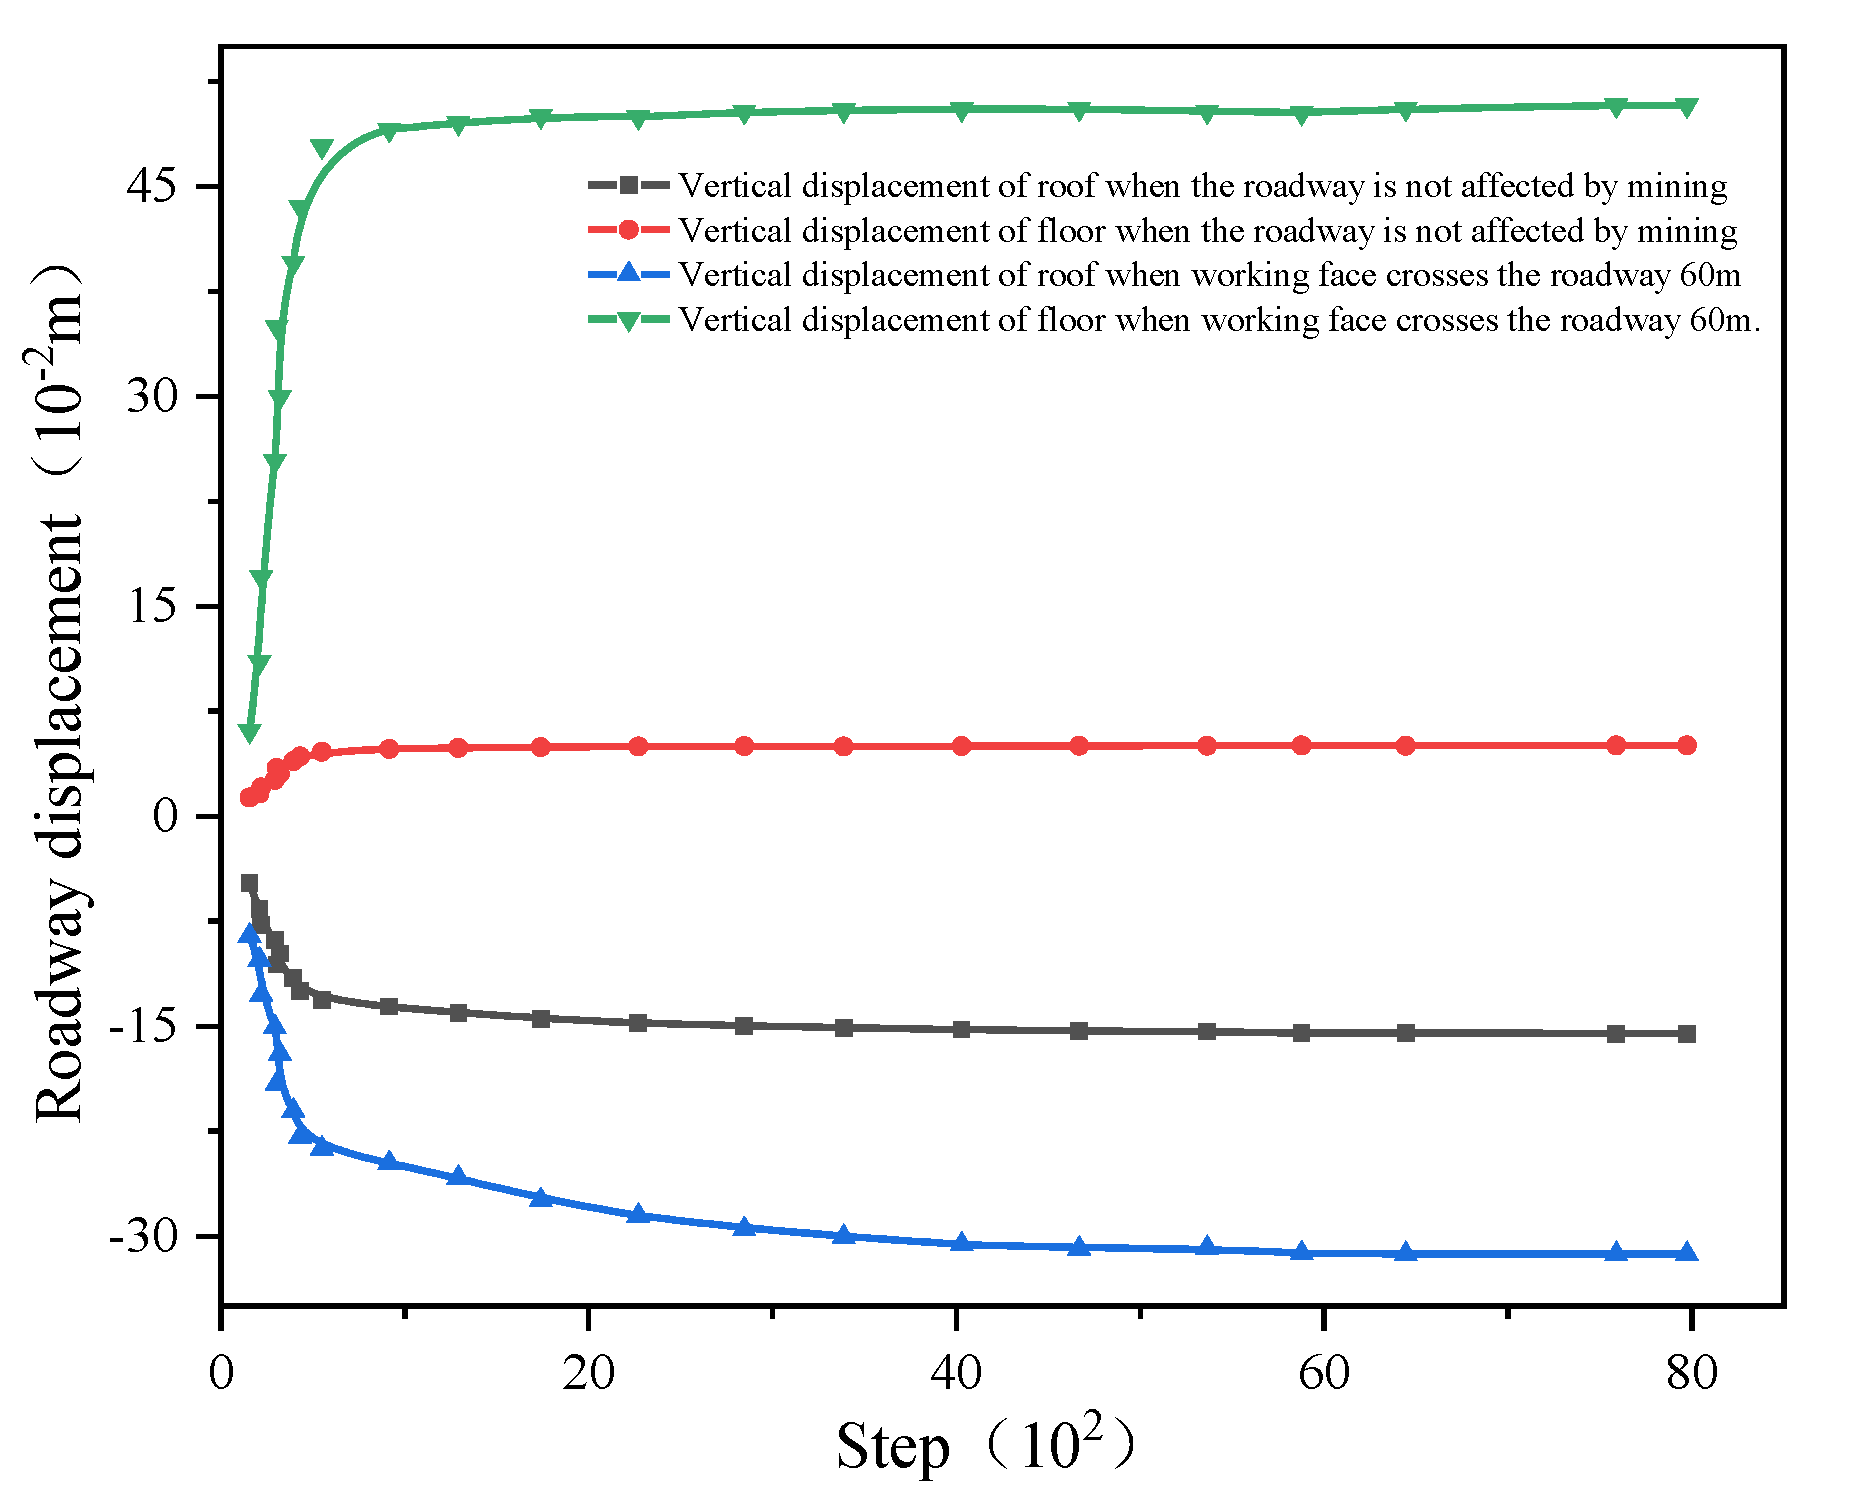
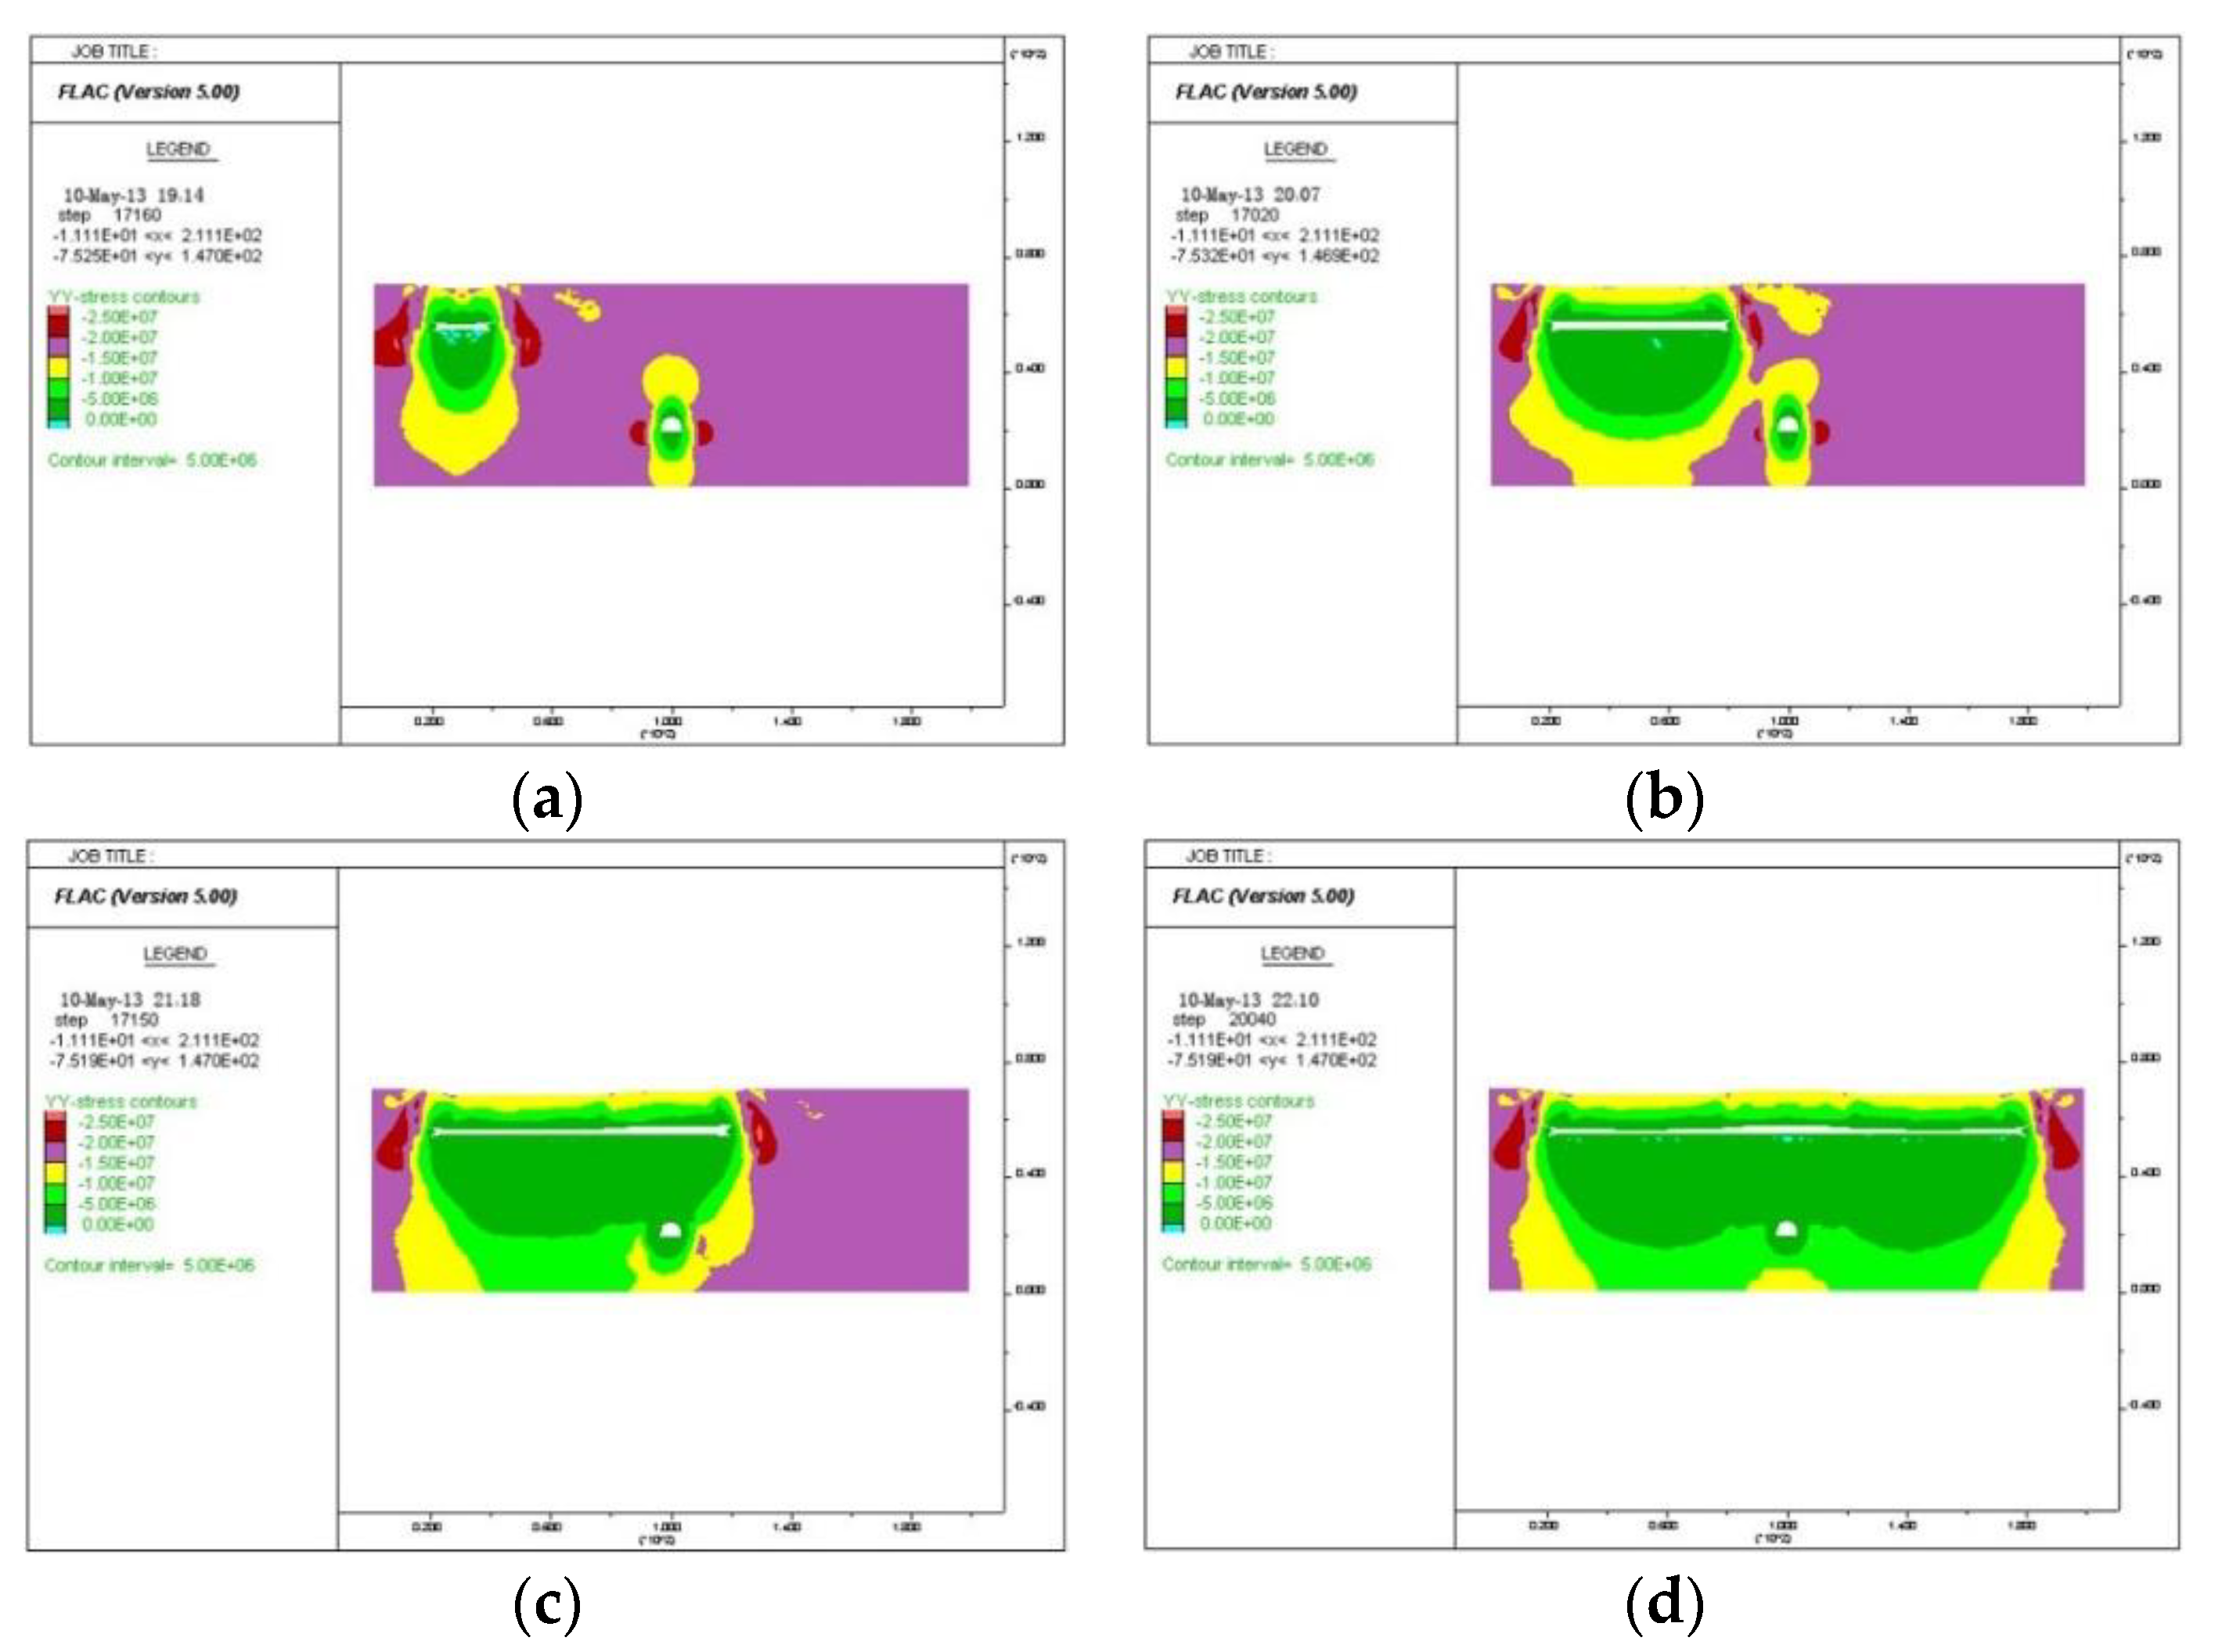
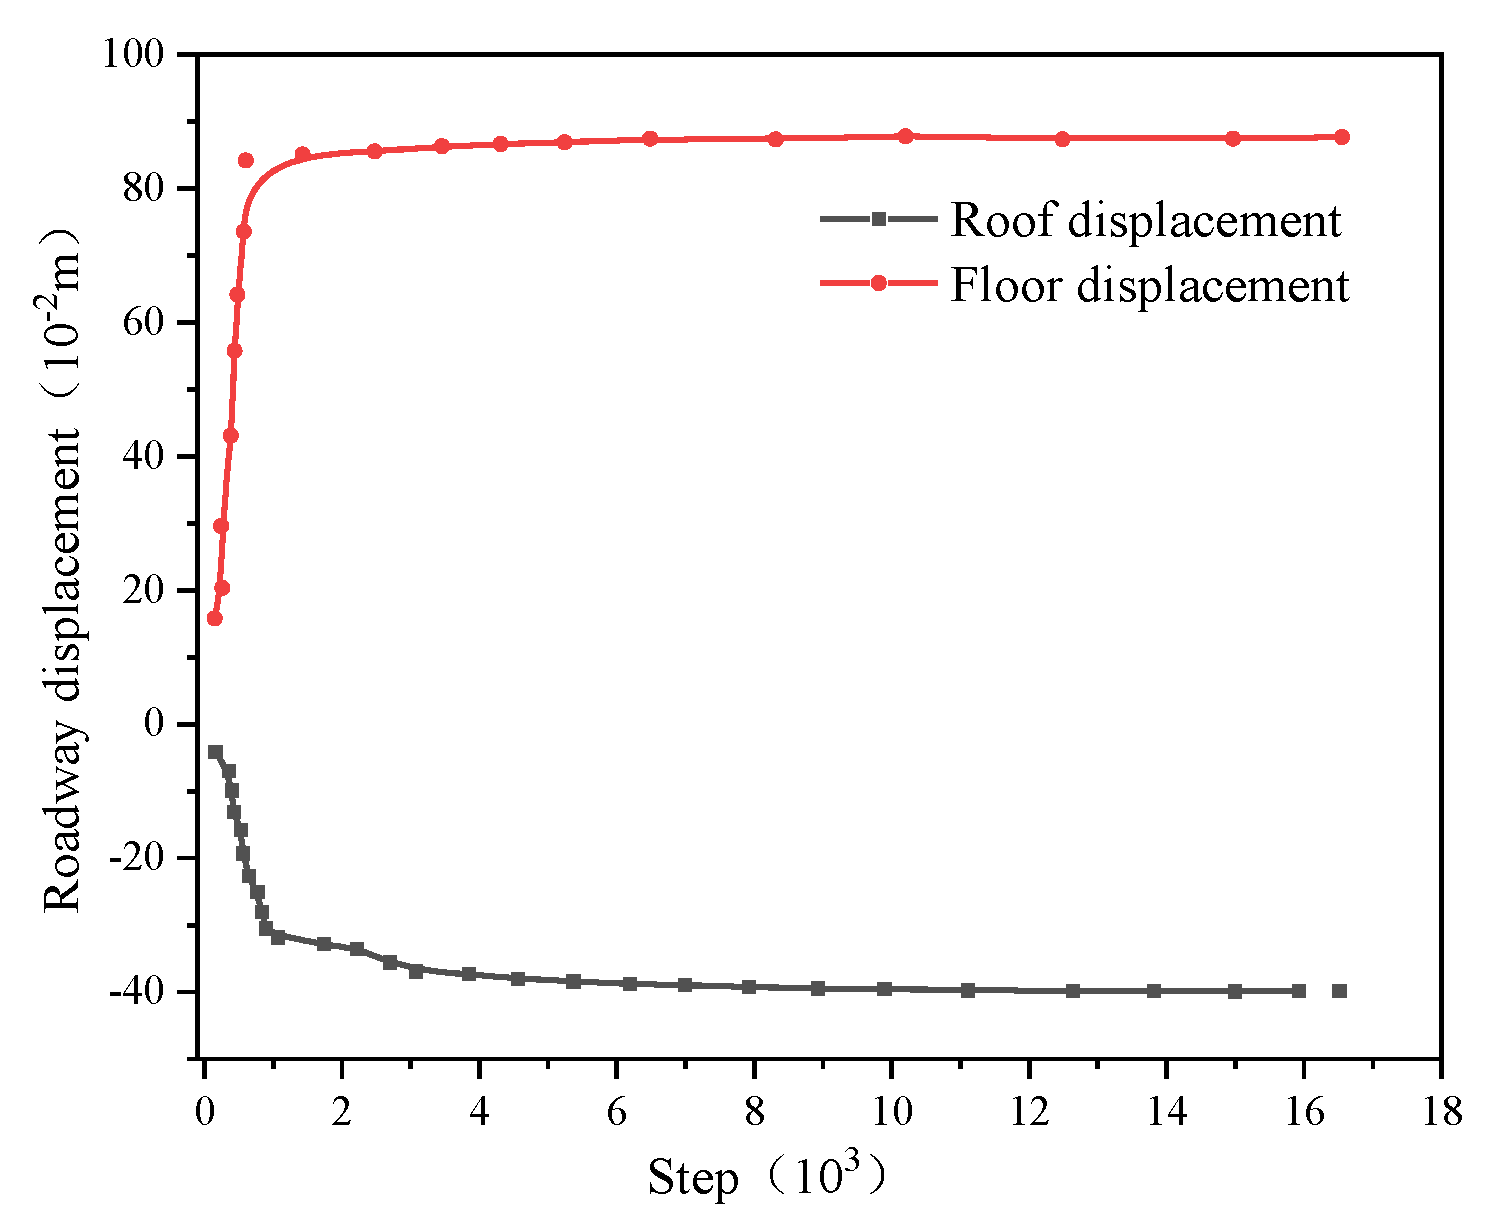
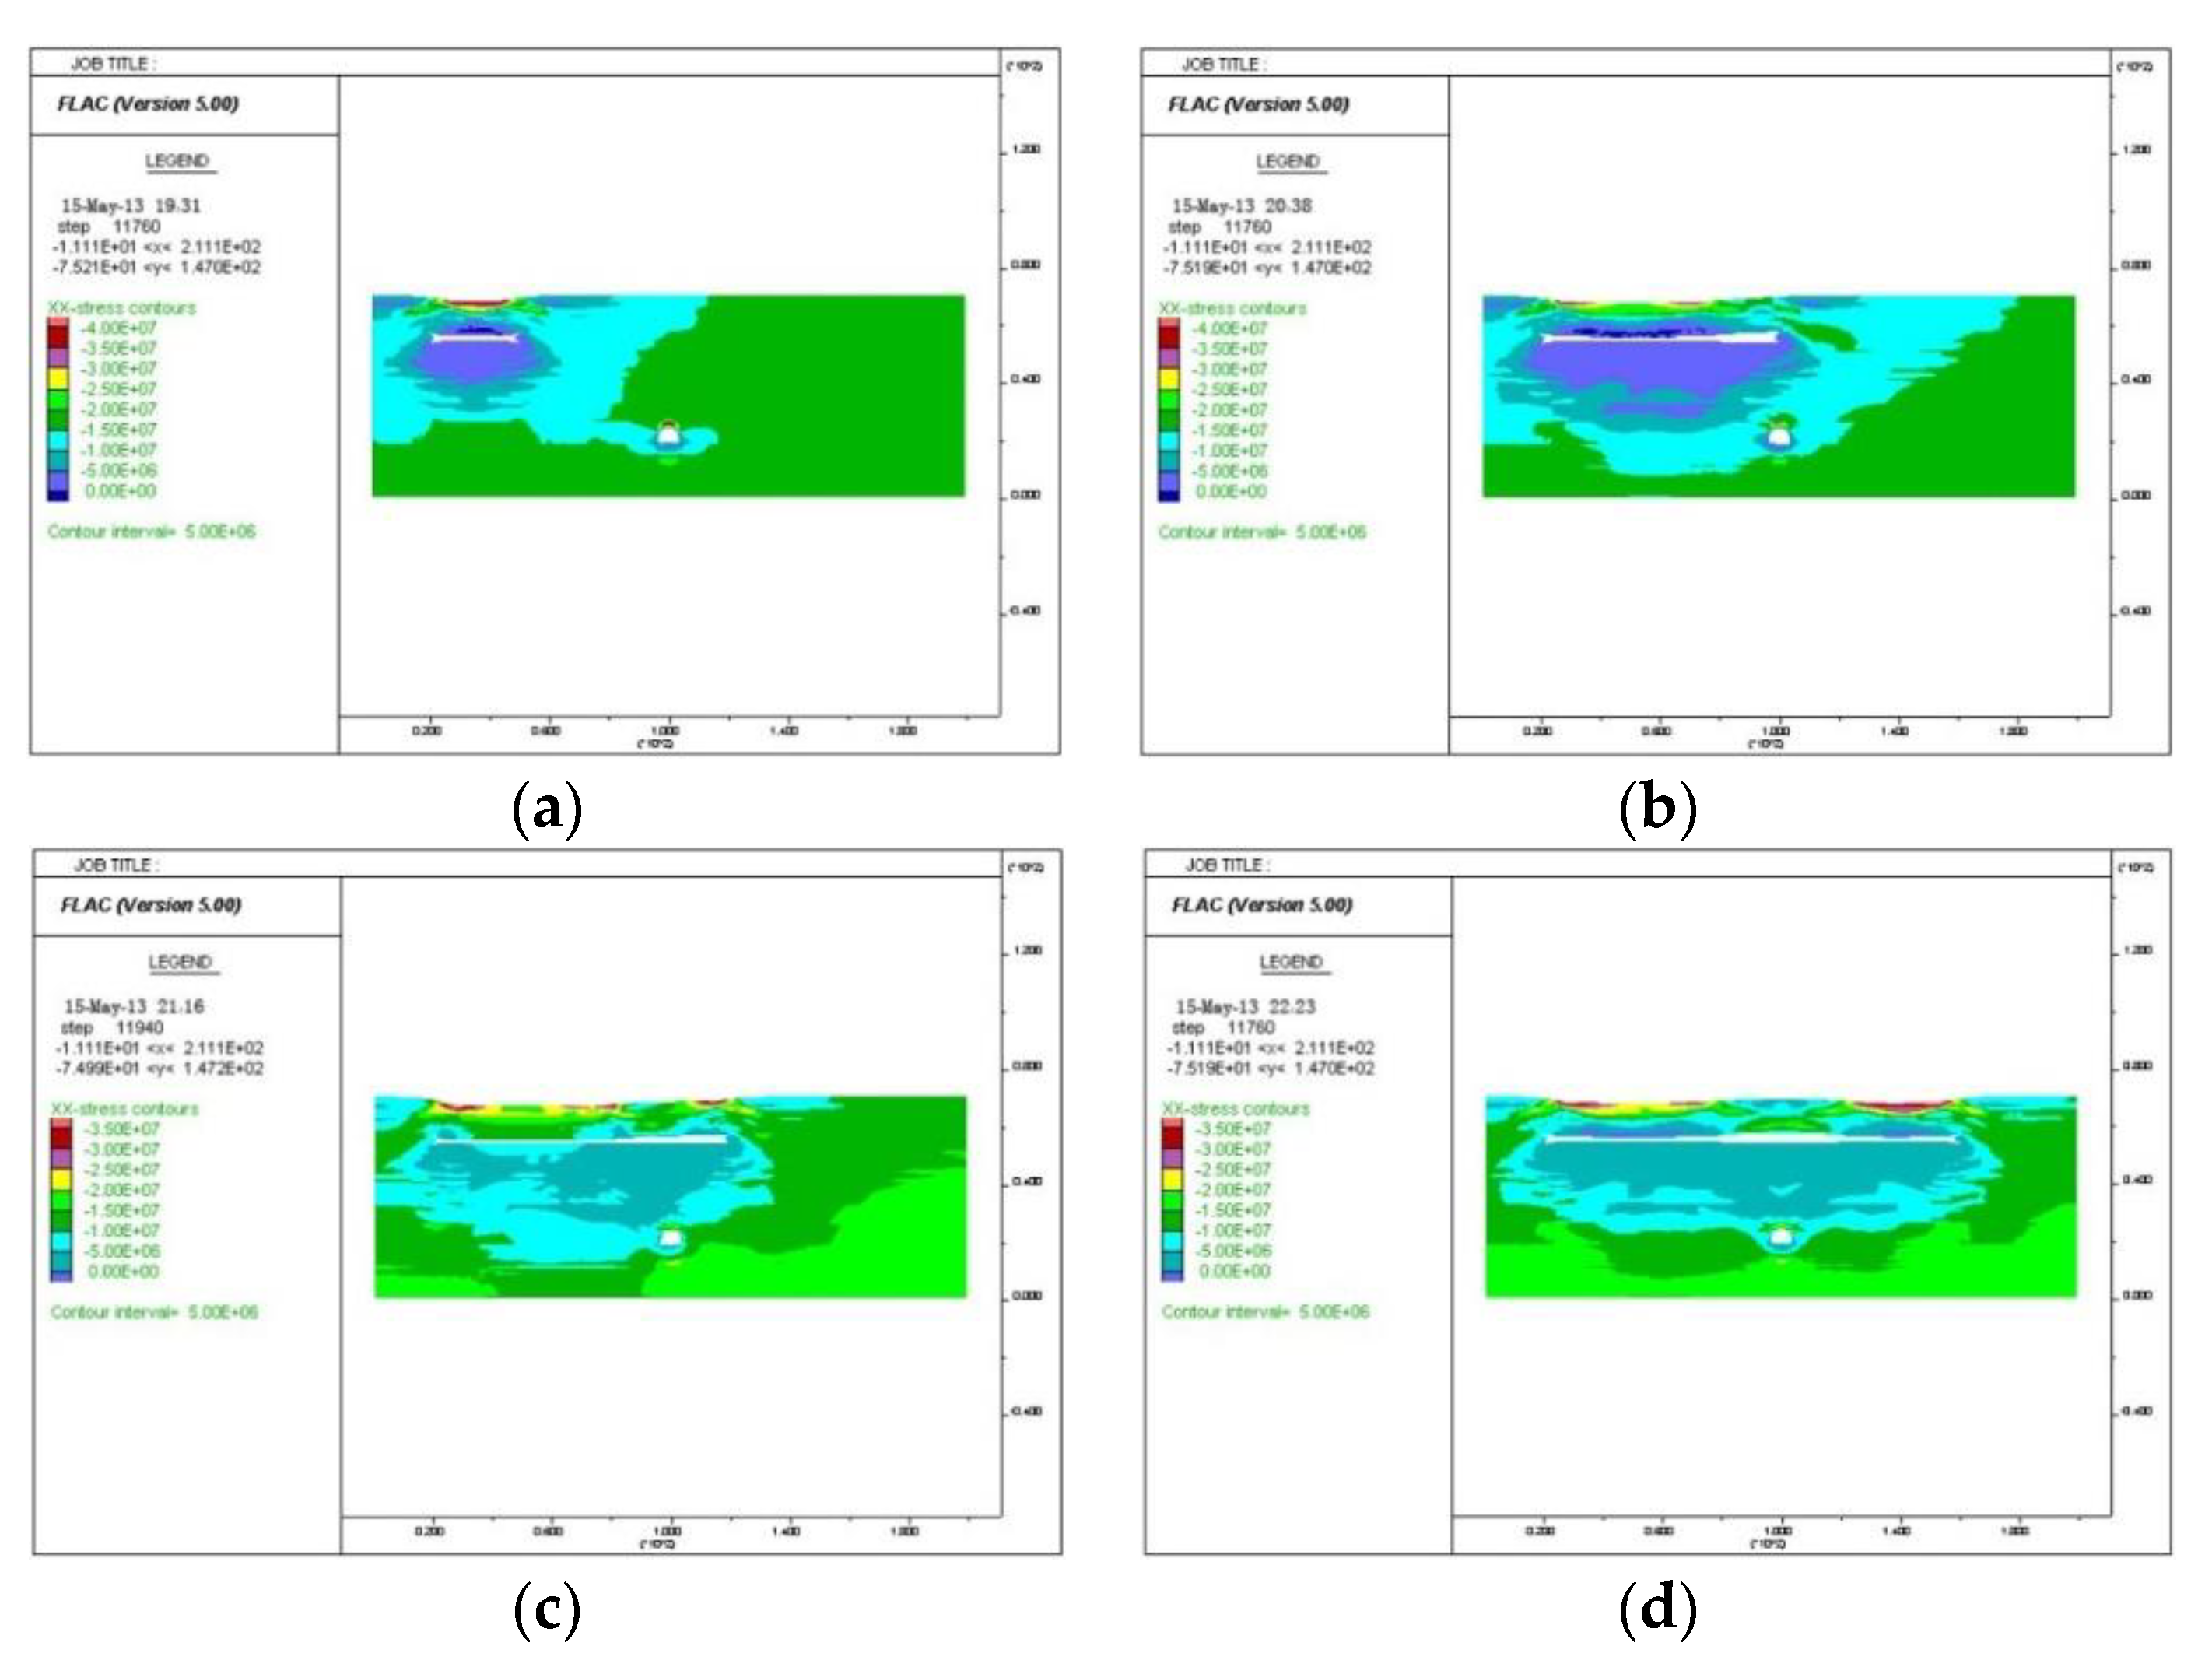
3.2.1. Stress and Deformation of Rock Surrounding the Roadway Supported by Original Bolt under Mining Influence

In the process of coal seam mining, the relative positions of the roadway and the working face can be divided into three types according to the different distances between the roadway and the working face: in front of the working face, directly below the working face, and behind the working face. Therefore, the mining influence can be divided into the advance mining influence, mining process influence, and lagging mining influence. To elucidate the influence degree of mining at different roadway positions, combined with the advance progress of the working face, the deformation failure and stress distribution characteristics of the rock surrounding the roadway were simulated with consideration to the roadway being 60 and 20 m away from the working face, and the positions of 20 and 60 m across the roadway. The stress field distribution and surrounding rock deformation are shown in Figure 11, Figure 12 and Figure 13.
As can be seen in Figure 11 and Figure 12, the horizontal stress around the roadway was approximately 5.0 MPa and the vertical stress was approximately 2.5 MPa when there was no mining influence. When the working face advanced, the horizontal stress around the roadway became 10 MPa and the vertical stress was 5 MPa. When the horizontal distance between the working face and the roadway was 60 m, the advanced stress started exerting its influence, and the effect was obvious. When the working face crossed the roadway at 20 m, the horizontal stress and vertical stress of the roadway were still very high, which indicates that the influence of mining was unstable. When the working face crossed the roadway at 60 m, the horizontal and vertical stress values remained essentially unchanged, which indicates that the influence of mining on the rock surrounding the roadway had become stable. As can be seen in Figure 13, when there was not mining influence, the roadway roof subsidence was approximately 140 mm and the floor heave was approximately 50 mm. When the working face advanced and crossed the roadway at 60 m, the roadway roof subsidence reached 300 mm and the floor heave reached approximately 500 mm. As can be seen, the original support strength of the roadway no longer satisfied the needs of upper working face mining.

3.2.2. Stress and Deformation of Rock Surrounding the Lower Roadway under Different Optimized Support Schemes

To ensure that the roadway can continue to be used while bearing enormous mining stress, in this study, the two schemes of combined bolt and shed support and anchor–shotcreting–grouting (Anchor Cable + shotcreting + grouting) were designed and compared. The deformation and failure law of the roadway and overlying strata, and the stress distribution characteristics of the surrounding rock brought about by the working face mining under different supporting forms, were analyzed with regard to the vertical distance of 30.3 m between the main roadway and the coal seam.
(1)
Simulation results and analysis of combined bolt and shed support.
The stress field distribution and deformation of the surrounding rock are shown in Figure 14, Figure 15 and Figure 16.
According to the stress distribution in Figure 14 and Figure 15, when the roadway was approximately 70 m away from the working face, the roadway was not affected by the mining of the overlying working face. When the working face was 60 m away from the roadway, the vertical stress of the roadway significantly increased, and the roadway started being affected by the mining of the overlying working face. Therefore, the maximum advance stress range was 60–70 m when the combined support of the bolt and shed was used. When there was no mining influence, the horizontal stress around the roadway was approximately 5.0 MPa and the vertical stress was approximately 2.5 MPa. After mining, the horizontal stress and vertical stress of the rock surrounding the roadway were approximately 10 and 5 MPa, respectively. Figure 16 shows the vertical displacement curve of the rock surrounding the roadway when the working face roadway crossed at 60 m. As can be clearly seen from the figure, the maximum roof subsidence and floor heave of the roadway were approximately 350 and 800 mm, respectively, as the upper working face advanced. Obviously, the combined support of the bolt and shed could not effectively control the deformation of the surrounding rock.
(2)
Simulation results and analysis for anchor–shotcreting–grouting support.
The stress field distribution and deformation of the surrounding rock are shown in Figure 17, Figure 18 and Figure 19.
As can be clearly seen in Figure 17 and Figure 18, when the working face was 60 m away from the roadway, the roadway was not affected by mining. When the advancing distance was 50 m from the roadway, the roadway was already within the influence range of advanced mining in the upper coal seam. Therefore, it can be inferred that the maximum influence range of the mining advance stress was 50–60 m. When the working face crossed the roadway at 20 m, the roadway was still in the area influenced by mining. When the working face crossed the roadway at 40 m, the roadway was essentially not affected by the mining; when the working face crossed the roadway at 60 m, the stress did not change. Therefore, the influence area of the mining lag was approximately 20–40 m. The horizontal stress and vertical stress value of the rock surrounding the roadway did not obviously change compared with the combined bolt and shed support, which is approximately 5–10 MPa. The vertical stress distribution clearly shows that the bolt and shotcreting reinforcement can provide sufficient bearing capacity to the rock surrounding the roadway, and maintain its stability under large stress. Figure 19 shows the vertical displacement when the working face crossed the roadway at 60 m. As can be seen in the figure, when the upper working face was mined, the roof subsidence of the roadway was approximately 40 mm, that is, 1/8 of the combined bolt and shed support. Additionally, the floor heave was approximately 250 mm, which is 1/3 of the combined bolt and shed support. From the above analysis, it follows that the bolting and shotcreting support measures greatly improved the bearing capacity and stability of the rock surrounding the roadway.

3.3. Discussion

For the roof and floor, the surrounding rock properties greatly varied within the influence range of mining. The lithology of the rock surrounding the roadway was stress-transmission-oriented, and stress concentration could easily occur in parts with poor lithology, which is a key factor in roadway deformation and failure. The roof lithology of the Dongsi transportation roadway has hard characteristics, and the roof essentially did not sink under the mining influence of the 1762(3) working face. However, the surrounding rock properties at the floor are poor and the floor heave was severe after mining, accounting for 95% of the roof and floor displacement; the maximum floor heave speed was 16 mm/d. For the cross-mining roadway, when the distance between the roadway and the working face was large, the roof was not affected by mining owing to the rapid attenuation of mining stress. When the distance between the roadway and the working face was small, the mining stress attenuation was slow and still exerted great influence on the deformation and failure of the surrounding rock when it was transmitted to the floor roadway. Owing to the action of the roof, the stress was transferred to two sides and squeezed in the interior of the roadway, which lead to the inner extrusion of the shed legs and upward movement of the roof. Therefore, the vertical distance between the roadway and the working face was different, and the influence of the mining stress on the roof of the roadway floor was also different, particularly on the two sides. When the vertical distance from the overlying working face was the same, and the horizontal distance from the working face edge or coal pillar was different, the deformation and damage degree of the rock surrounding the roadway was also very different. For the 5# measuring point, the horizontal distance between the working face edge and the overlying working face was relatively large, which weakens the influence of the stress concentrated at the edge of the working face on the roadway. Moreover, the horizontal distance between the 6# measuring point and the overlying working face was only 18 m. The stress concentration of the surrounding rock was very high, owing to the severe deformation and damage of the rock surrounding the roadway. Therefore, the influence degree of the deformation of the rock surrounding the roadway decreased with the increase of the horizontal distance, and the influence degree on the roof and floor was much greater than that on the two sides. The data obtained from the monitoring points reveal that the vertical mining influence range of the working face was approximately 30–40 m, and the influence range of the horizontal mining was approximately 50–60 m.
In the lower and lateral part of the working face, when the horizontal distance between the roadway and the edge of the overlying working face or coal pillar was large, the influence of the stress concentrated around the working face edge or coal pillar on the floor roadway was weak, and the deformation of the rock surrounding the roadway was very small. When the roadway was close to the edge of the working face or the coal pillar, the floor roadway was in the strong mining influence range and the stress concentration degree of the rock surrounding the roadway was very high, which led to the severe deformation and failure of the roadway. When the relative position of the roadway and overlying working face was different, the influence degree of the mining stress caused by the working face on the rock surrounding the roadway was significant. In the lateral position of the working face, the stress could reach 2–3 times the stress of the original rock. Under the action of such high stress, the rock surrounding the roadway is prone to brittle failure. The rock surrounding the working face has a great impact on the surrounding rock for a long time after the working face is mined, which leads to the large deformation of the surrounding rock. Under the goal of the working face, the increase coefficient of the abutment pressure is typically less than 1. Because the abutment pressure is very small after the working face is mined, it does not influence the deformation of the rock surrounding the roadway, and tends to become stable soon thereafter. Hence, there is a big difference between 7# and 8#.
Based on the in situ ground pressure test and numerical simulation analysis, it was found that the bolt and cable support can effectively control the deformation of the roadway side, and that the shed support has no obvious control effect on the side. When the bolt and cable support is used, the mechanical properties of the surrounding rock are effectively improved, and the anti-deformation ability of the surrounding rock is enhanced. Generally, in the factors affecting the deformation and failure of the rock surrounding the cross-mining roadway, the internal structure of the surrounding rock and the nature of the rock mass determine the ability of the surrounding rock to bear the mining stress, and the vertical or horizontal distance between the roadway and the overlying working face determines the magnitude and degree of the mining influence on the roadway. The relationship between the position of the roadway and the working face determines the area affected by mining, and the supporting form and strength determine the bearing strength of the roadway affected by mining and its adaptability to the dynamic pressure roadway. However, under the original support conditions, the Dongsi main transportation roadway deformation was severe, and the combined effect of the bolt and shed support was not satisfactory. During the mining process of the upper coal seam, the vertical stress is concentrated on both sides of the roadway, and the horizontal stress is concentrated on the roof and floor of the roadway. The ground pressure behavior is severe, and the original support cannot effectively control the deformation of the rock surrounding the roadway. Hence, it is necessary to adopt high-strength support to control the surrounding rock deformation in time. Based on in situ test and theoretical analysis, the reasonable support scheme should be considered from two aspects of surrounding rock modification and support strengthening. First of all, bolt and cable support is used to improve the prophase support strength, control the deformation of shallow surrounding rock and eliminate the separation phenomenon as far as possible, further grouting to improve the internal structure of surrounding rock, improve the bearing strength of surrounding rock, and weaken the development degree of internal cracks in surrounding rock. Finally, surface shotcreting can improve the surface fragmentation of roadway, further improve the overall bearing capacity of support structure, and effectively control the surrounding rock deformation. When using “bolt shotcreting” to strengthen the support, the anchor cable can play an active role in controlling the deformation of the surrounding rock. Moreover, the anchoring depth is large, the bearing capacity is high, and a great pre-tightening force can be exerted. Grouting can consolidate the broken rock mass, improve the mechanical properties of the surrounding rock structure, and improve the overall strength of the surrounding rock to increase its bearing capacity, which plays an important role in ensuring the stability of the rock surrounding the Dongsi transportation roadway. At the same time, passive support should be added in time to ensure the safety of production.

4. Industrial Tests

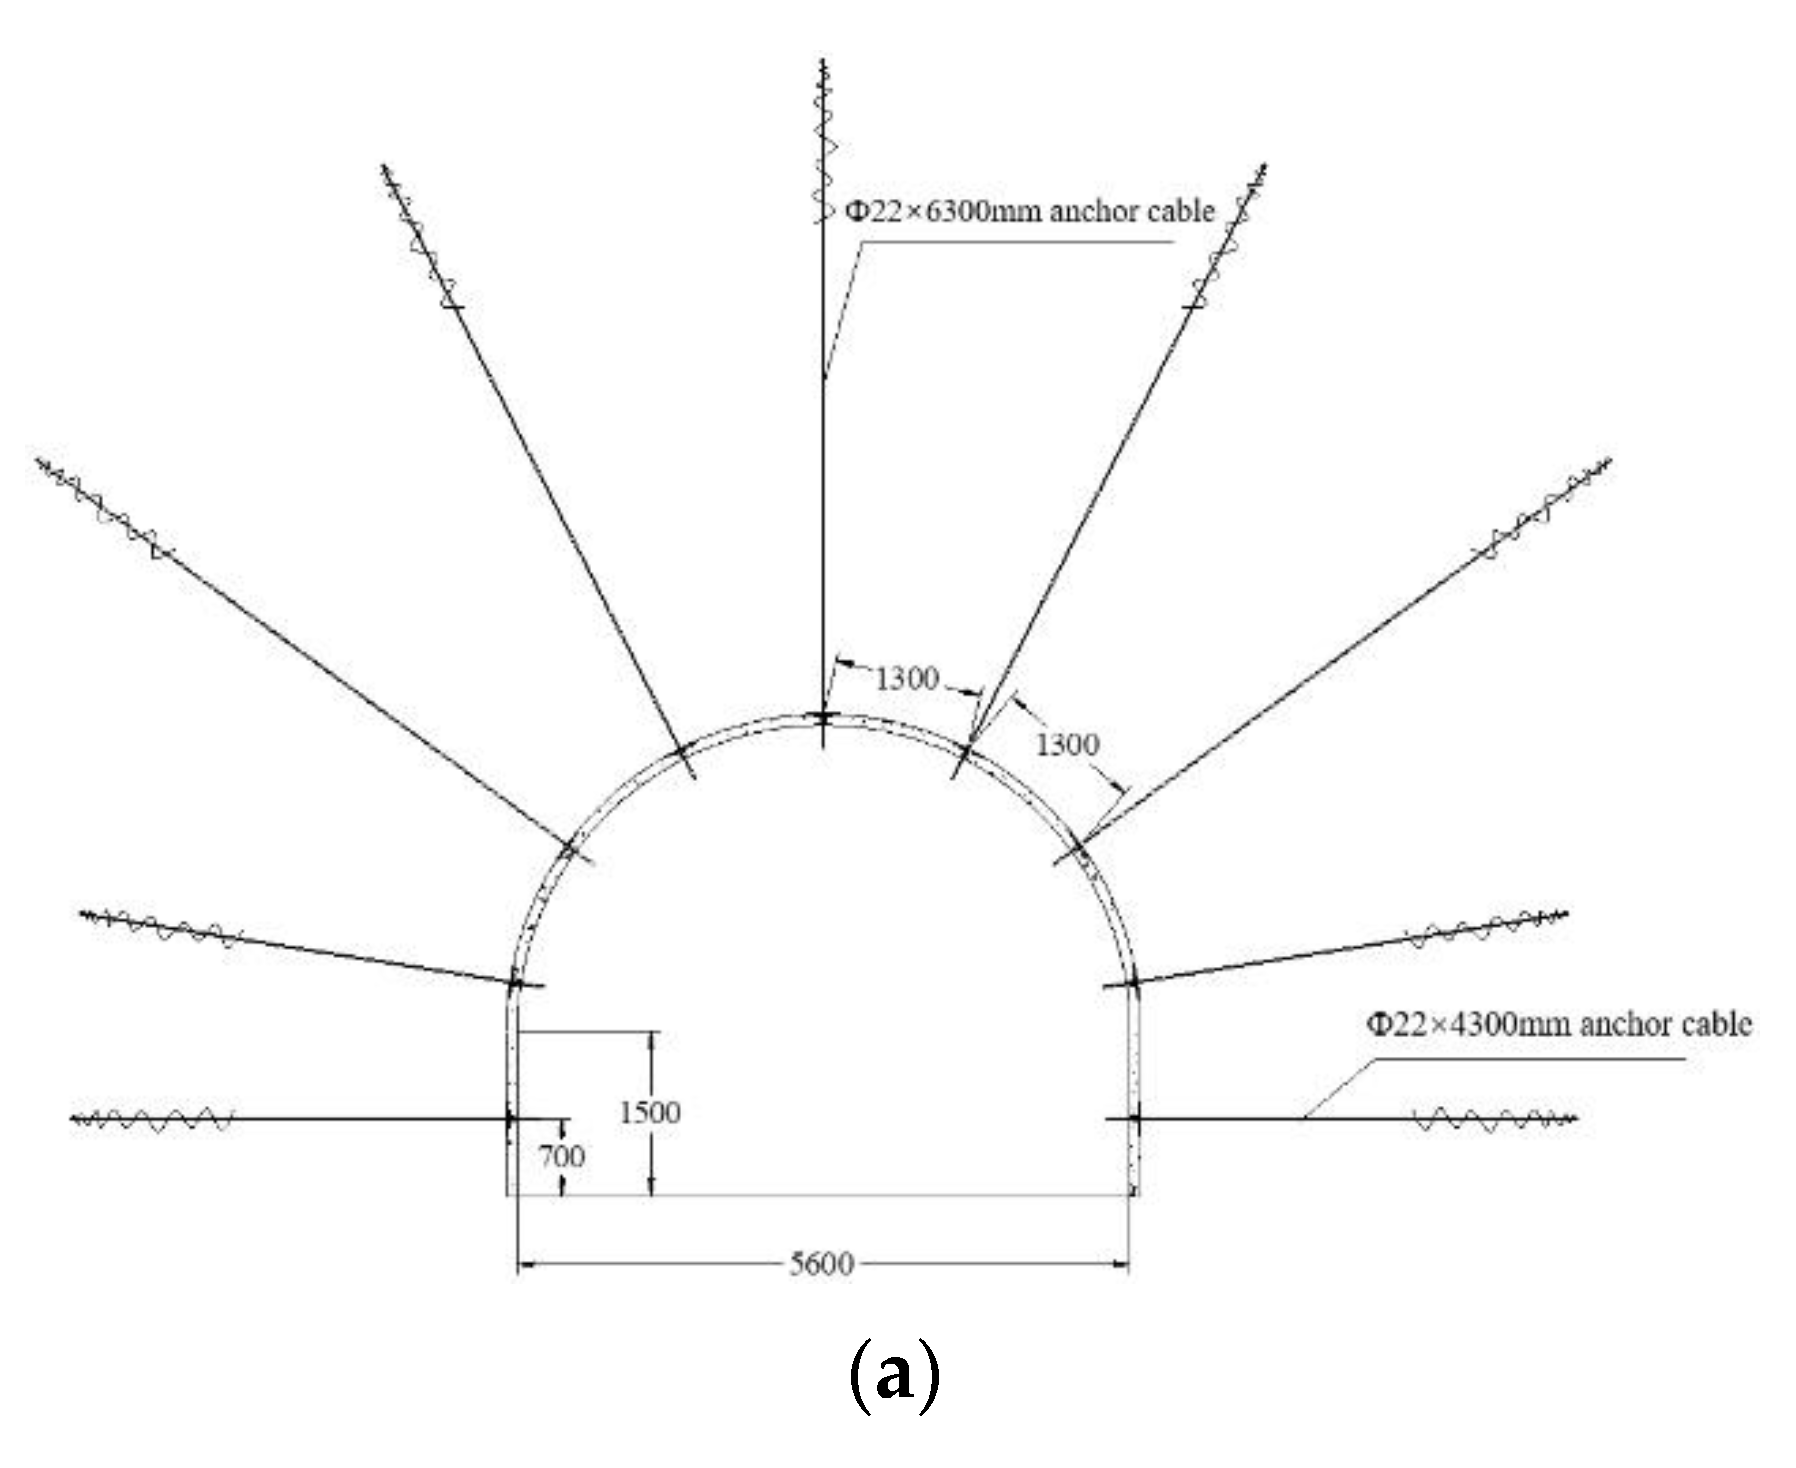
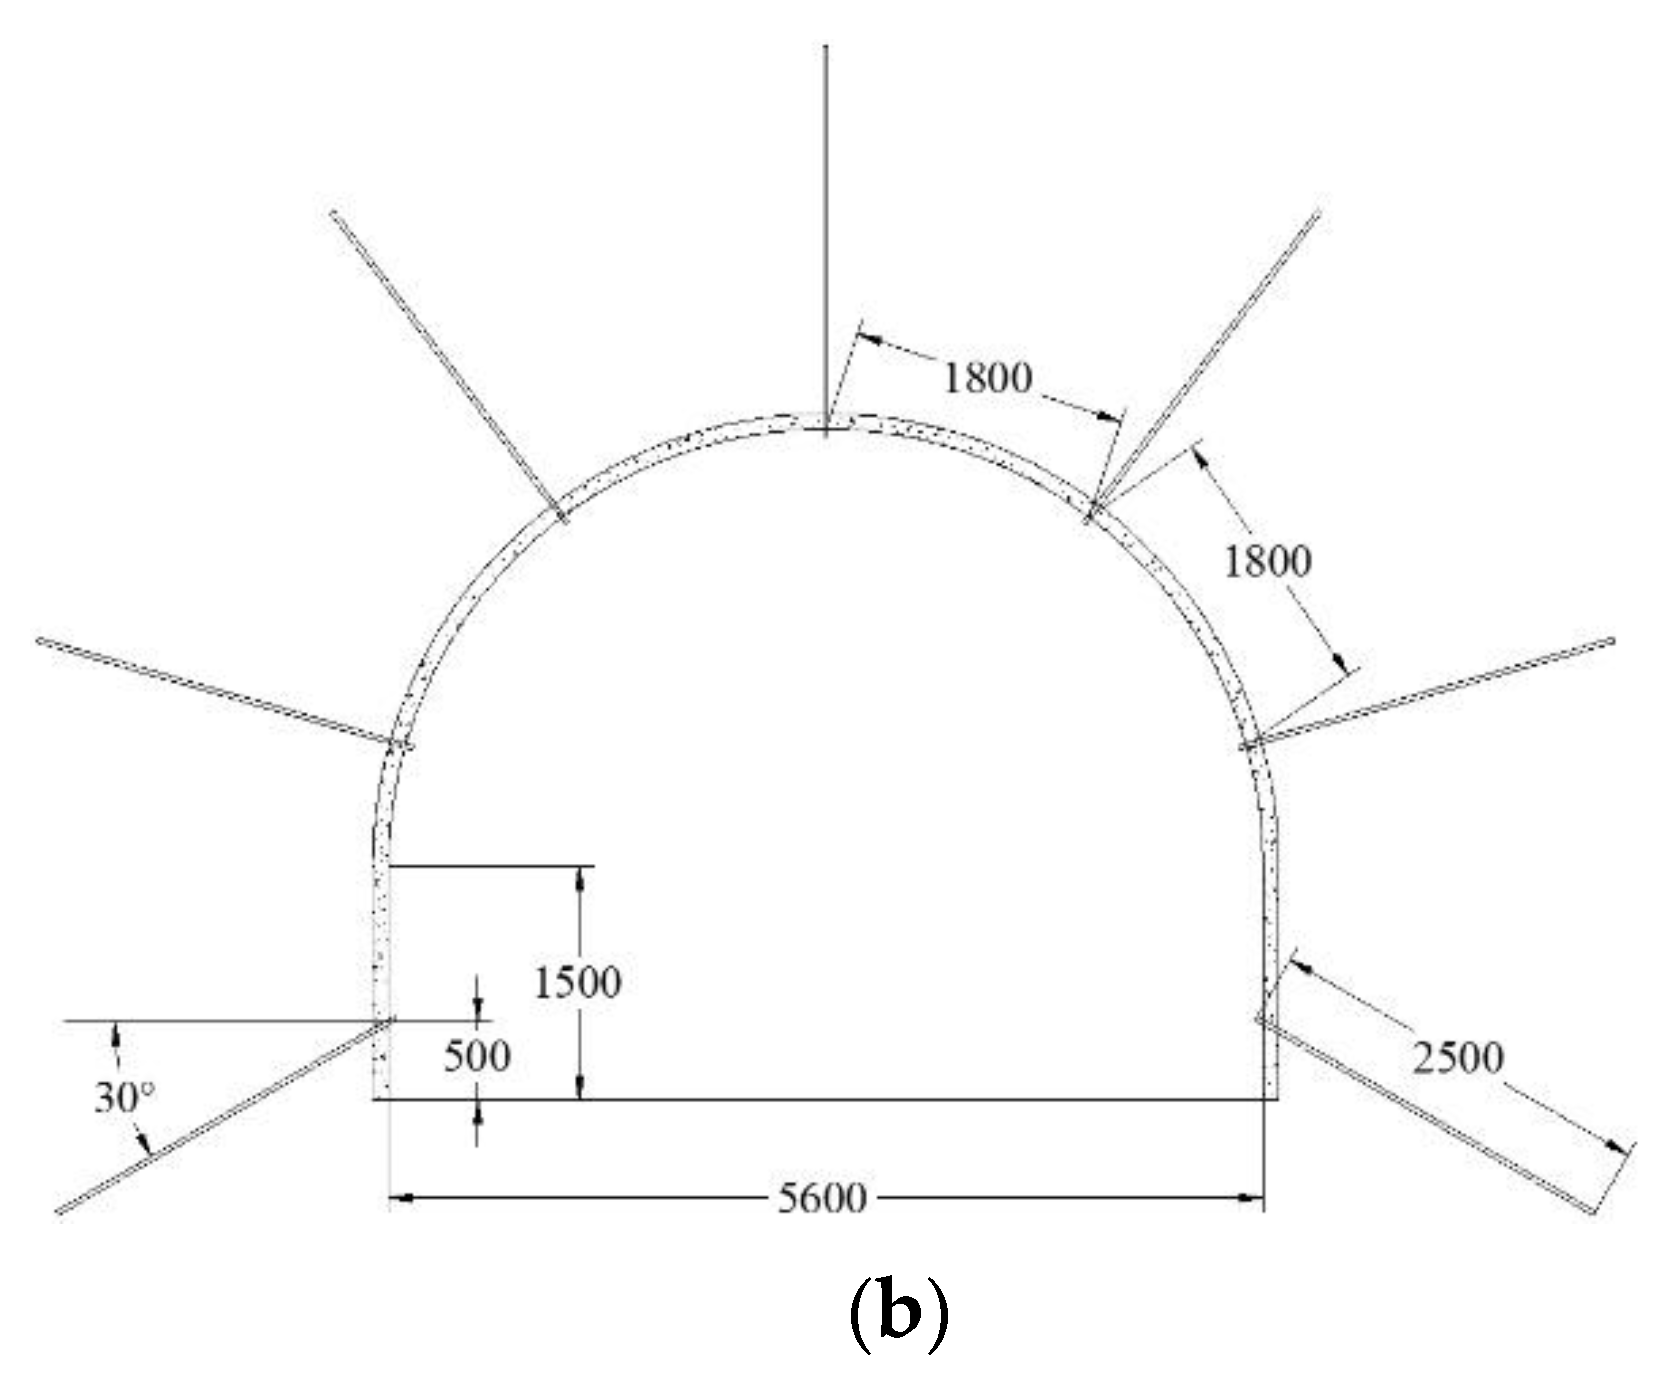
4.1. Support Scheme Design

Based on the above analysis, the optimized support scheme design adopts bolt-shotcreting-grouting to reinforce the main roadway. For the bolt support section and shed support section, the support scheme and parameters are the same, but the construction sequence of each support measure is different. The bolt-supported roadway adopts roof anchor cable→shotcreting→shallow grouting, while the shed supporting the roadway adopts shotcreting→shallow grouting→roof anchor cable. The specific supporting parameters are as follows.
For the key parts of the roadway, nine sets of high-prestressed single anchor cables were arranged at the roof and side of the roadway, and a Φ300-mm-disc anchor cable tray was equipped. The roof is made of a Φ21.8 mm × 6.3 m steel strand with hole depth of 6.0 m. The two sides are made of a steel strand with specification of Φ21.8 mm × 4.3 m with a hole depth of 4.0 m. One roll of k2360 and three rolls of z2360 resin cartridge were used for each hole of the roof anchor cable, and one roll of k2360 and two rolls of z2360 resin cartridge were used for the side anchor cable. The pre-tightening force was 80–100 kN, and the anchoring force was not less than 200 kN. The row spacing between the anchor cables was 1300 × 1000 mm, as shown in Figure 20a.
The U-shaped steel shed and rock surrounding the roadway were closed by shotcrete. The thickness of the shotcrete should be 70–100 mm. The concrete ratio was cement with sand:gravel = 1:2:2. To ensure the grouting effect, the U-shaped steel shed must be completely closed. After spraying, the concrete should be watered and maintained to improve the strength of the shotcrete layer.
The grouting material was sulfoaluminate cement with a water cement ratio of 0.85–1.0, and was used to seal large cracks and reinforce the shallow fractured surrounding rock mass. The length of the grouting pipe was 2.5 m, and the grouting pressure was generally not more than 3.0 MPa. The grouting amount was not subjected to a large amount of slurry leakage. The grouting sequence was as follows: low pressure grouting was successively carried out from the grouting hole at the bottom corner of the roadway until the space behind the U-shaped steel shed wall was filled. As shown in Figure 20b, the details of the parameters are as follows:
(1) The grouting section and the anchor cable construction section were arranged at intervals. An air hammer was used to drill holes. Each section was arranged with seven holes, and the spacing between the rows was 1800 × 1000 mm. The grouting pipe at the side was 500 mm away from the roadway floor, and the construction was carried out with a downward inclination of 30°. The drill diameter was Φ = 42 mm, and the grouting hole depth was 3.0 m;
(2) The length of the grouting bolt was 2.5 m, the front hole diameter was 8 mm, and the back-end hole diameter was 4 mm. The sealing material was hollow quick setting cement roll, and the sealing depth was 0.3 m.

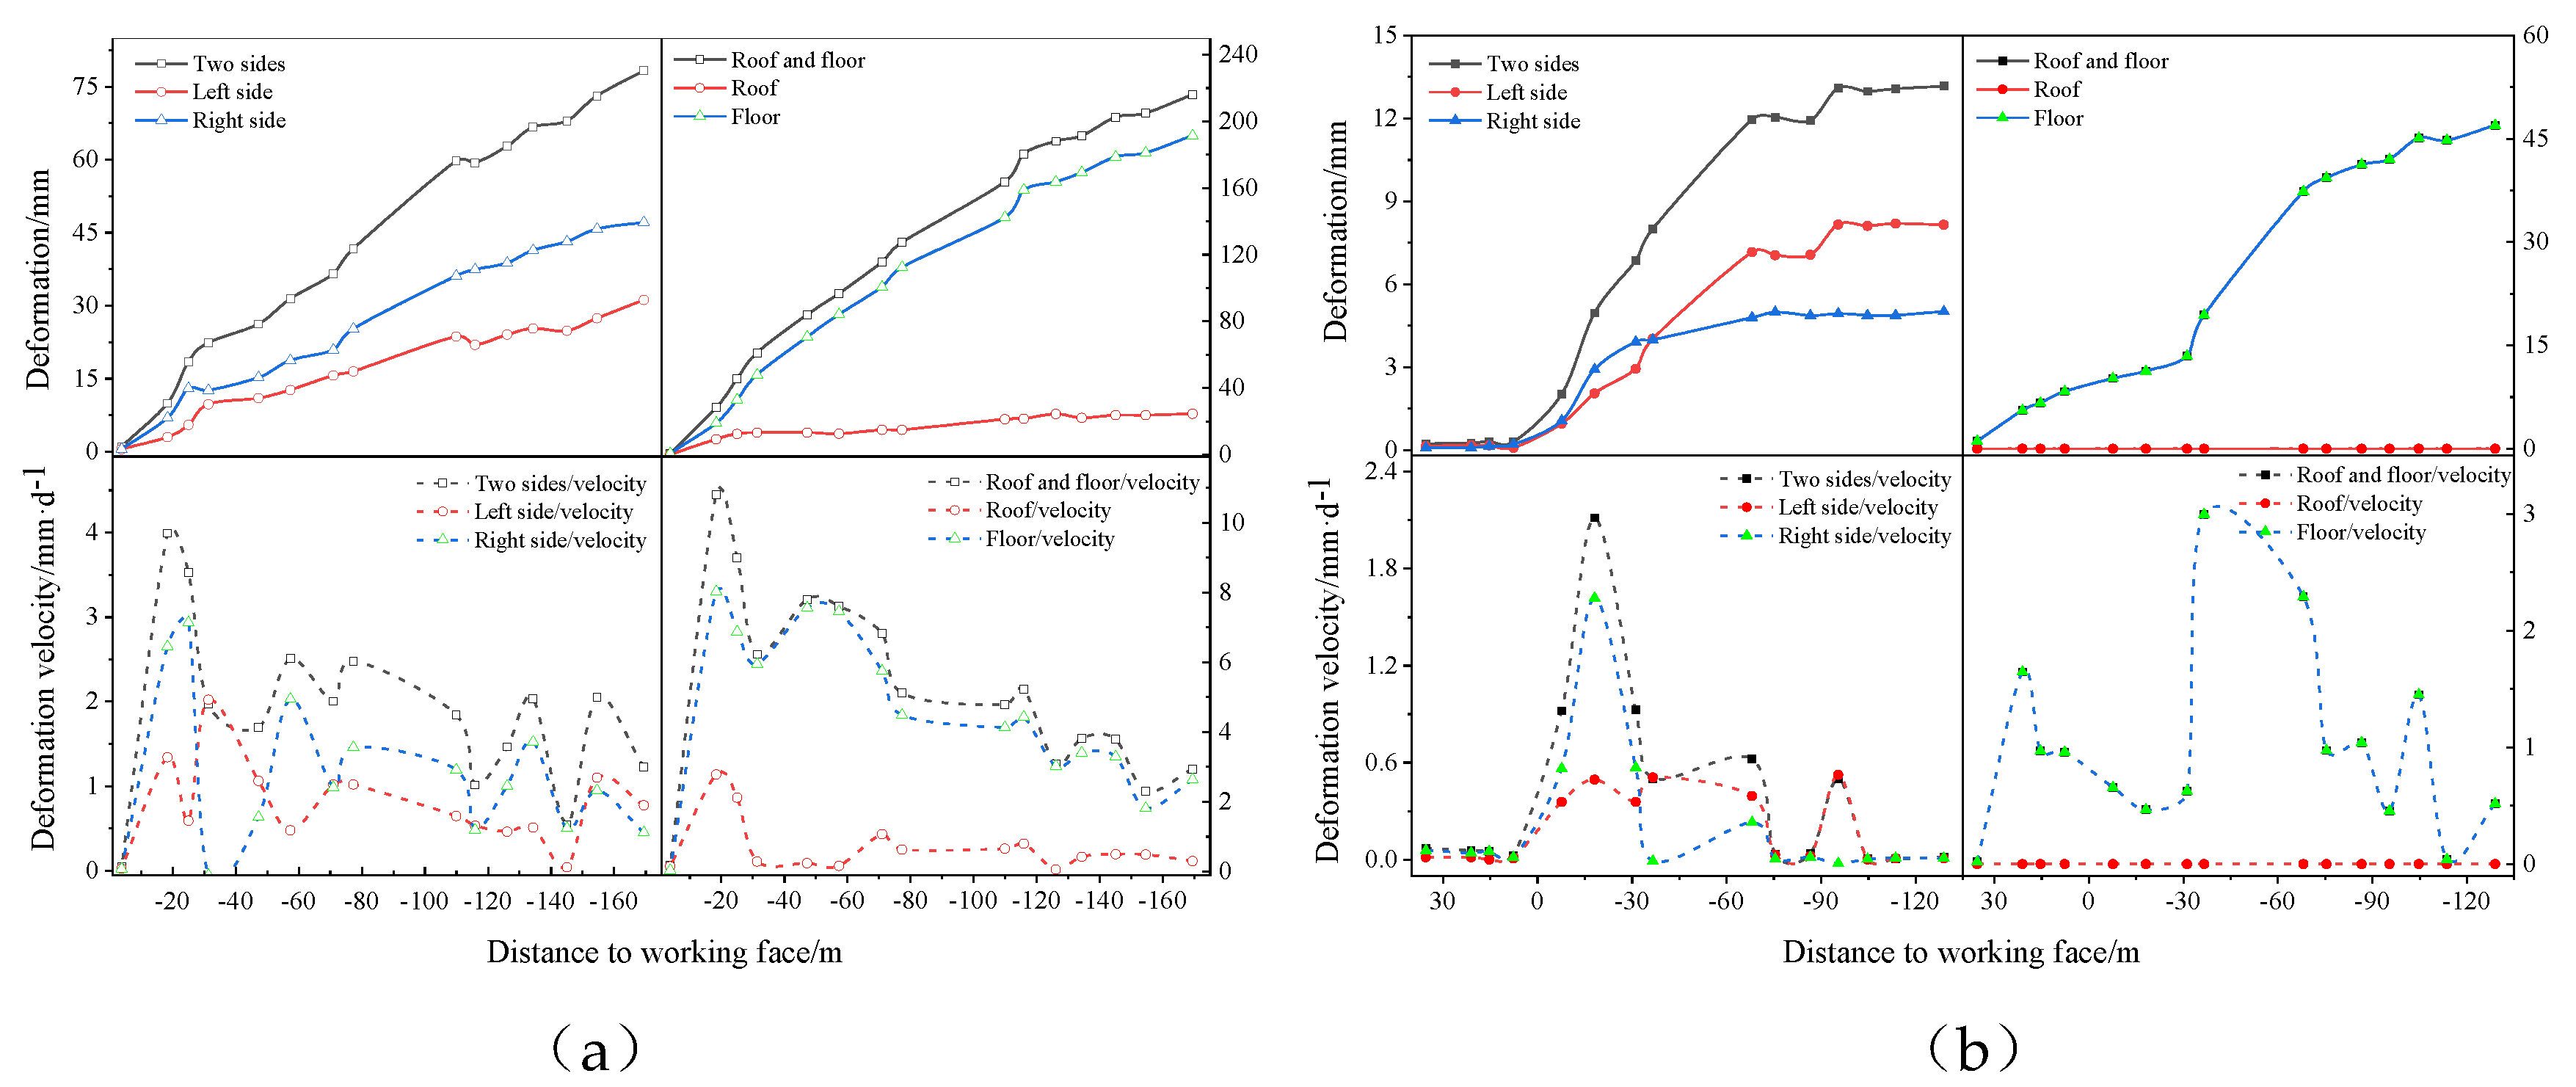
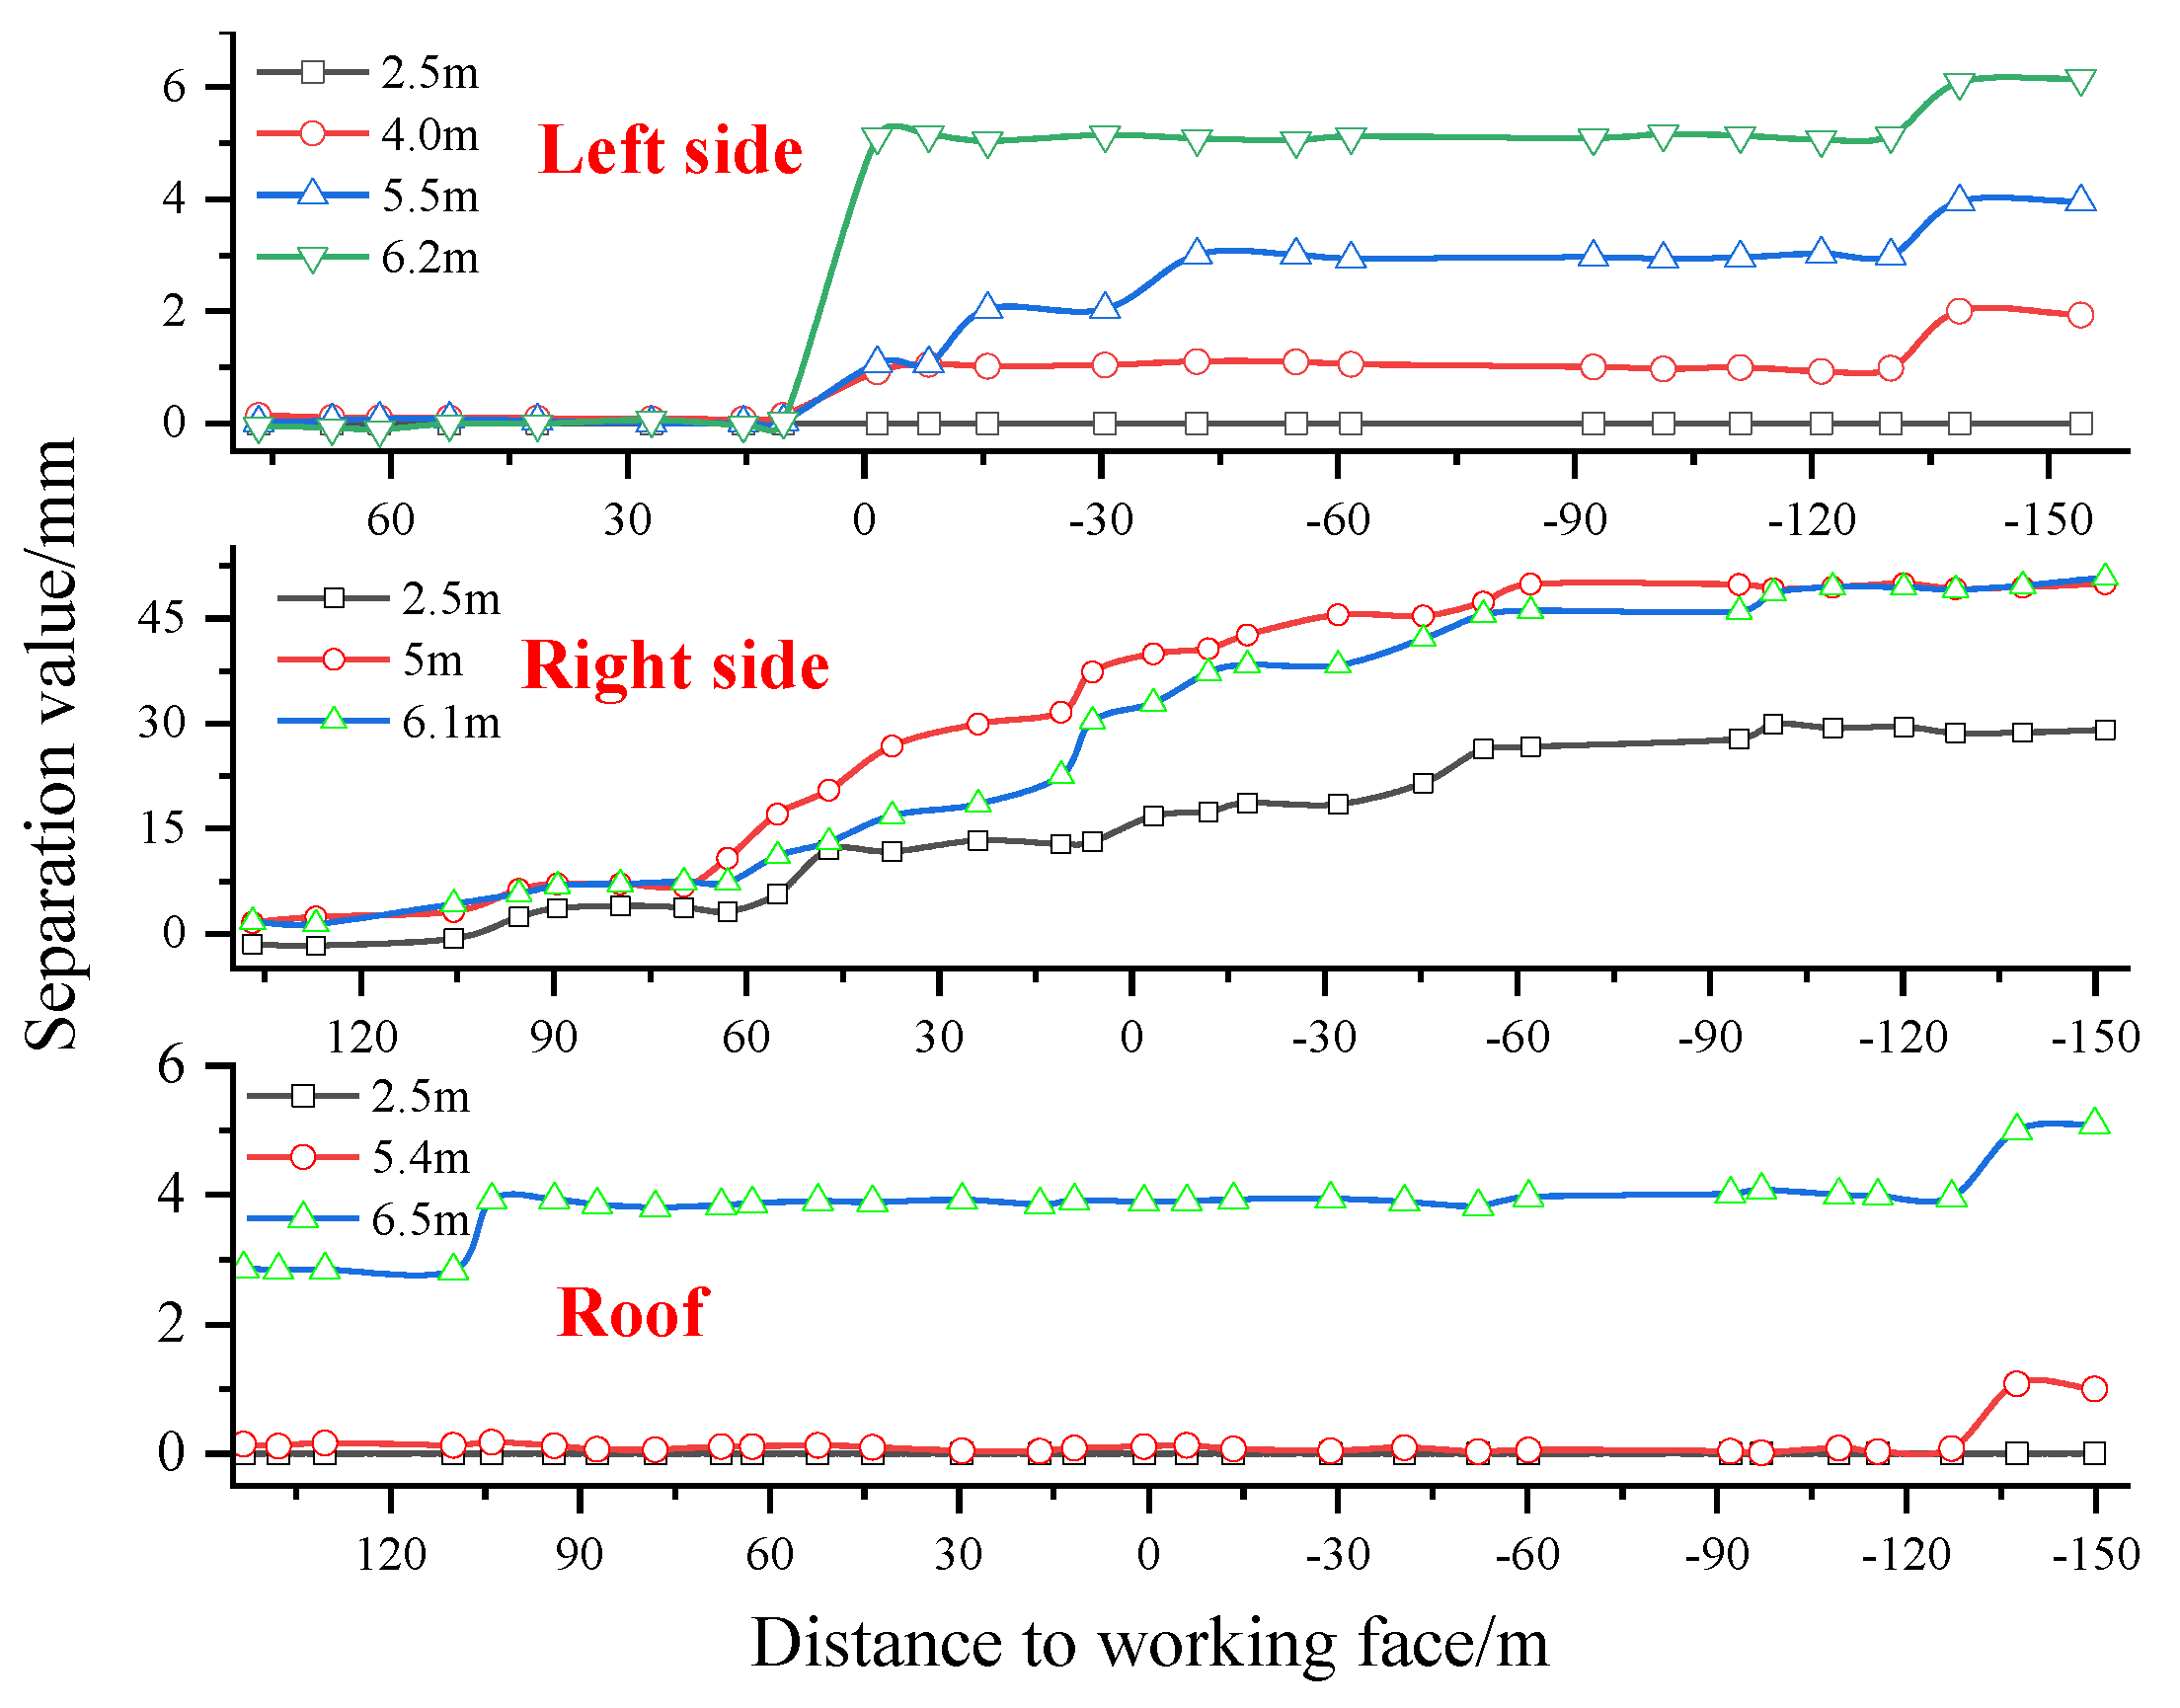
4.2. Monitoring Results

According to the layout diagram of the measuring points shown in Figure 3, the surface displacement measuring points 11# and 12# were both arranged in the roadway of the air intake section. The distance between the two measuring points was 60 m and the points were approximately 30 m away from the upper mining face. After the reinforcement of the Dongsi transportation roadway with the combined bolt–shotcrete–grouting support, the deformation amount and deformation velocity curve of the roadway side, roof, and floor are shown in Figure 21. Furthermore, the deep surrounding rock near the 11# measuring point was monitored to master the deep layer separation of the surrounding rock. The separation value of the side and roof with the distance of the working face under different depths is shown in Figure 22.
As can be seen in Figure 21, the cumulative deformation of the 11# surface displacement measuring point was 80 mm, and after the working face passed the point at approximately 170 m, the deformation speed of the side was approximately 2 mm/d and the roadway deformation was still unstable. The accumulated deformation of the 12# measuring point was approximately 13 mm only when the point was 10 m away from the working face. When the working face passed 70 m, the rock surrounding the roadway began to stabilize. The accumulated deformation of the 11# and 12# measuring points was 200 and 50 mm, respectively, after the working face was pushed, and the deformation of the roadway roof and floor at the two measuring points was still ongoing. From the deformation velocity of the roof and floor, the maximum moving velocity of the 11# and 12# measuring points was 11 and 3mm/d, respectively. After the 12# measuring point was pushed over 100 m, the average moving speed of the top and bottom plate was only 0.5 mm/d. However, 170 m after measuring point 11#, the deformation speed could still reach 4 mm/d. After the working face was pushed over the range of 130 m, from the two measuring points to the end of the observation, the maximum cumulative deformation on both sides of the roadway was 80 mm, the maximum cumulative deformation of the roof and floor was 200 mm, the maximum deformation velocity of the two sides and the roof and floor was 2 and 4 mm/d, respectively. The working face continued to advance, the mining stress effect was not obvious, and the surrounding rock deformation tended toward stability, which satisfied the needs of production.
As can be seen from the two sides of the roadway and roof separation in Figure 22, the left side was within the range of 0–6.2 m, the layer separation value was 6 mm, and there was no layer separation within the range of 0–2.5 m. In the range of 0–5 m, the separation value of the right side was 51 mm. In the range of 0–2.5 m, the separation value was 29 mm and accounted for 57% of the total separation value. In the range of 5–6.1 m, there was no separation for the right side of the surrounding rock. Additionally, there was no layer separation in the range of 0–5.4 m near the roof, but there was separation of 5 mm in the range of 5.4–6.5 m. As can be seen, the layer separation of the right side of the roadway is much larger than that of the left side, which confirms that the deformation of the right side of the roadway was larger than that of the left side, to a certain extent. The rock surrounding the roadway roof is hard and does not get affected by mining. Therefore, the separation layer of the roadway roof was small. The surrounding rock at the floor of the roadway was fractured and had poor integrity, owing to the great effect exerted by mining, which can easily cause heave to the surrounding rock of the floor.
Based on a large amount of on-site monitoring data combined with numerical simulation methods, this paper has carried out research on the stability of the surrounding rock of the floor roadway of the diagonally spanning working face. There are few studies on this type of roadway. In the process of advancing the overlying working face, the influence range of bearing pressure is large and the time is long. Compared with the transverse straddle roadway and longitudinal straddle roadway, the distance between the floor roadway and the working face of the obliquely straddle working face is changing, and the deformation affected by mining is more complex. In the support design of this kind of roadway, more reference may be made to transverse straddle roadways and longitudinal straddle roadways. In this paper, based on the field monitoring and numerical simulation research, the laws of mining disturbance, surrounding rock deformation, stress release and transfer, and fracture expansion of this kind of roadway in the process of advancing the working face were described in more detail, which is more accurate. We carried out support scheme design and optimization according to local conditions to lay a foundation, and, compared with the original support method, the improved support scheme carried out targeted optimization design (based on mining influence and deformation characteristics), and more effectively combined the mutual coupling between the surrounding rock and anchor cable, rather than separate passive support, so as to provide reference and reference for the design of surrounding rock support scheme of floor roadway in similar obliquely straddle working face in this mine and even other mining areas.

5. Conclusions

The main conclusions drawn from this study are as follows:
(1) According to the geological conditions of the Dongsi main transportation roadway and its spatial relationship with the overlying 1762(3) working face, the laws of four key factors influencing the stability of the rock surrounding the roadway were obtained through theoretical and practical analysis. The results reveal that the surrounding rock properties of the roof and floor vary greatly within the mining influence range, and the rocks surrounding the two sides exhibit regional differences. The range of the vertical mining influence on the floor rock roadway is approximately 3040 m, and that of horizontal mining is approximately 50–60 m. The results reveal that the rock surrounding the lateral roadway is greatly affected by mining, while the lower roadway is less affected. The bolt cable support effectively controls the deformation of the roadway side, and the shed support has no obvious control effect on the side;
(2) Using the FLAC2D numerical software, the deformation and failure of the rock surrounding the inclined span working face and the dynamic pressure of the rock floor of the roadway were simulated and analyzed using different support forms. Before and after the working face mining, the influence range of the roadway mining was 60–110 m. The original support conditions of the roadway deformation were severe, and the combined effect of the bolt and shed support was not satisfactory. The use of anchor-shotcreting-grouting (the strength grade of shotcrete is C20, and the cement used for grouting is 425# grade ordinary portland cement) to strengthen the support significantly improved the surrounding rock conditions and strengthened the surrounding rock;
(3) The anchor–shotcreting–grouting support scheme is proposed and was successfully applied in practice. The ground pressure observation of the test roadway revealed the following: The cumulative deformation of the two sides of the roadway was 80 mm; the cumulative deformation of the roof and floor was 200 mm; the working face continued to advance; the mining stress effect was not obvious; the surrounding rock separation value was small; and the surrounding rock integrity was good. Finally, the deformation tended toward stability, which satisfied the production requirements.

Author Contributions

Data curation, J.K. and N.Z.; formal analysis, J.K. and P.W.; funding acquisition, J.K. and X.X.; investigation, B.W.; methodology, J.K. and B.W.; project administration, J.K., N.Z. and X.X.; software, P.W. and B.W.; writing—original draft, P.W.; writing—review and editing, J.K., P.W. and N.Z. All authors have read and agreed to the published version of the manuscript.

Funding

This work is supported by the National Natural Science Foundation of China (52074263,52034007), the Fundamental Research Funds for the Central Universities (2014QNA47) and the Postgraduate Research and Practice Innovation Program of Jiangsu Province (KYCX21_2332).

Institutional Review Board Statement

Not applicable.

Informed Consent Statement

Not applicable.

Data Availability Statement

Data is contained within the article.

Conflicts of Interest

The authors declare no conflict of interest.

References

  1. Kang, H.P. Support technologies for deep and complex roadways in underground coal mines: A review. Int. J. Coal Sci. Technol. 2014, 1, 261–277. [Google Scholar] [CrossRef] [Green Version]
  2. Zhang, N.; Xue, F.; Zhang, N.C.; Feng, X.W. Patterns and security technologies for co-extraction of coal and gas in deep mines without entry pillars. Int. J. Coal Sci. Technol. 2015, 2, 66–75. [Google Scholar] [CrossRef] [Green Version]
  3. Wang, G.F.; Pang, Y.H. Surrounding rock control theory and longwall mining technology innovation. Energy Sci. Eng. 2017, 4, 301–309. [Google Scholar] [CrossRef] [Green Version]
  4. Palchik, V. Formation of fractured zones in overburden due to longwall mining. Environ. Geol. 2003, 1, 28–38. [Google Scholar] [CrossRef]
  5. Wang, H.W.; Jiang, Y.D.; Xue, S.; Shen, B.T.; Wang, C.; Lv, J.G.; Yang, T. Assessment of excavation damaged zone around roadways under dynamic pressure induced by an active mining process. Int. J. Rock Mech. Min. Sci. 2015, 77, 265–277. [Google Scholar] [CrossRef]
  6. Qin, D.D.; Wang, X.F.; Zhang, D.S.; Chen, X.Y. Study on Surrounding Rock-Bearing Structure and Associated Control Mechanism of Deep Soft Rock Roadway Under Dynamic Pressure. Sustainability 2019, 11, 1892. [Google Scholar] [CrossRef] [Green Version]
  7. Prusek, S.; Masny, W. Analysis of damage to underground workings and their supports caused by dynamic phenomena. J. Min. Sci. 2015, 1, 63–72. [Google Scholar] [CrossRef]
  8. Yao, Q.L.; Zhou, J.; Li, Y.N.; Tan, Y.M.; Jiang, Z.G. Distribution of Side Abutment Stress in Roadway Subjected to Dynamic Pressure and Its Engineering Application. Shock Vib. 2015, 2015, 929836. [Google Scholar]
  9. Lu, S.L.; Sun, Y.L.; Jiang, Y.D. Position of floor rock roadway and adjacent coal seam roadway and cross mining pressure behavior law. Coal Sci. Technol. 1994, 22, 27–31. [Google Scholar]
  10. Mo, S.; Sheffield, P.; Corbett, P.; Ramandi, H.L.; Oh, J.; Canbulat, I.; Saydam, S. A numerical investigation into floor buckling mechanisms in underground coal mine roadways. Tunn. Undergr. Space Technol. 2020, 103, 103497. [Google Scholar] [CrossRef]
  11. Zhang, X.C.; Li, D.Y.; Chen, S.H.; Li, D.S.; Fan, D.W. Stability Prediction and Control of Surrounding Rocks for Roadway Affected by Overhead Mining. J. Min. Eng. 2008, 25, 361–365. [Google Scholar]
  12. Zhang, P.S.; Lin, D.C.; Yang, J.; Wang, M.H. Numerical Simulation of Deep Varied Interval Riding Mining Roadway Stability Based on Time-effect of Rock. J. Shandong Univ. Sci. Technol. (Nat. Sci.) 2012, 31, 10–14. [Google Scholar]
  13. Hebblewhite, B.K.; Lu, T. Geomechanical behaviour of laminated, weak coal mine roof strata and the implications for a ground reinforcement strategy. Int. J. Rock Mech. Min. Sci. 2004, 1, 147–157. [Google Scholar] [CrossRef]
  14. Lu, X.; Zheng, Y.S.; Yan, M.C.; Li, W.; Cao, S.L. Study on ground pressure behavior and support technology of short distance over mining roadway. Coal Technol. 2019, 38, 47–50. [Google Scholar]
  15. Malkowski, P.; Ostrowski, L.; Bachanek, P. Modelling the small throw fault effect on the stability of a mining roadway and its verification by in situ investigation. Energies 2017, 12, 2082. [Google Scholar]
  16. Sun, Z.H.; Xie, W.B.; Zhang, J.W.; Cheng, X.J. Surrounding rock deformation regularity and control technology of soft rock roadway in floor during across mining. Coal Technol. 2016, 35, 65–67. [Google Scholar]
  17. Gabet, T.; Malecot, Y.; Daudeville, L. Triaxial behaviour of concrete under high stresses: Influence of the loading path on compaction and limit states. Cem. Concr. Res. 2008, 38, 403–412. [Google Scholar] [CrossRef]
  18. Okubo, S.; Fukui, K.; Hashiba, K. Development of a transparent triaxial cell and observation of rock deformation in compression and creep tests. Int. J. Rock Mech. Min. Sci. 2008, 45, 351–361. [Google Scholar] [CrossRef]
  19. Chang, C.; Haimson, B. Waveform analysis in mitigation of blast-induced vibrations. J. Geophys. Res.-Solid Earth 2000, 105, 18999–19013. [Google Scholar] [CrossRef]
  20. Haimson, B.C.; Chang, C.D. True triaxial strength of the KTB amphibolite under borehole wall conditions and its use to estimate the maximum horizontal in situ stress. J. Geophys. Res.-Solid Earth 2002, 107, 2257. [Google Scholar] [CrossRef]
  21. Ning, S. Research on Surrounding Rock Deformation and Sectional Control Technology of Roadway Crossing through Passage. Master’s Thesis, Shandong University of Science and Technology, Qingdao, China, 2019. [Google Scholar]
  22. Zha, W.H.; Fu, X.M.; Yu, J.Y. Dynamic stepping and segmenting control and reinforcement technology of deep longitudinal spanning roadway. Saf. Coal Mines 2013, 44, 100–103. [Google Scholar]
  23. Xu, B.G.; Wang, K. Study on pre—reinforcement technology of roadway affected by contugous overhead mining. Coal Sci. Technol. 2020, 48, 194–199. [Google Scholar]
  24. Zhang, Z.Y. Study on the Support Law of the Right-Angle Trapezoidal Plate Breakage and Stress Propagation to the Floor. Master’s Thesis, Shandong University of Science and Technology, Qingdao, China, 2017. [Google Scholar]
  25. Konicek, P.; Soucek, K.; Stas, L.; Singh, R. Long-hole destress blasting for rockburst control during deep underground coal mining. Int. J. Rock Mech. Min. Sci. 2013, 61, 141–153. [Google Scholar] [CrossRef]
  26. Xiong, L.J. Control Technical Research on the Stability of Wall Rock under the Deep Lose Continuous Roadway Passed by Working Face. Master’s Thesis, AnHui University of Science and Technology, Huainan, China, 2013. [Google Scholar]
  27. Li, X.H.; Yao, Q.L.; Zhang, N.; Wang, D.Y.; Zheng, X.G.; Ding, X.L. Numerical Simulation of Stability of Surrounding Rock in High Horizontal Stress Roadw ay Under Overhead Mining. J. Min. Saf. Eng. 2008, 25, 420–425. [Google Scholar]
  28. Majdi, A.; Hassani, F.P.; Nasiri, M.Y. Prediction of the height of destressed zone above the mined panel roof in longwall coal mining. Int. J. Coal Geol. 2012, 98, 62–72. [Google Scholar] [CrossRef]
  29. Hu, X.Y.; Zhang, H.L.; Zhang, L.G. Analysis on Stress Concentration Factors of Roadway Surrounding Rock Affected by Cross Mining. Chin. J. Undergr. Space Eng. 2015, 11, 658–664. [Google Scholar]
  30. Li, Y.Y. Study on the Technology of Surrounding Rock Control in Floor Roadway under Repeated Overhead Mining. Master’s Thesis, China University of Mining and Technology, Xuzhou, China, 2015. [Google Scholar]
  31. Jiang, J.Q.; Han, J.S.; Feng, Z.Q. Sub classification of surrounding rock structure stability of cross mining roadway and its application. J. Eng. Geol. 1999, 7, 321–326. [Google Scholar]
  32. Zhang, J.C.; Liu, T.Q. On the depth and distribution characteristics of coal seam floor mining fracture zone. J. China Coal Soc. 1990, 15, 46–55. [Google Scholar]
  33. Liu, T.Q. Influence and control engineering of mining rock mass and its application. J. China Coal Soc. 1995, 20, 1–5. [Google Scholar]
  34. Li, G.C.; Ma, C.Q.; Zhang, N.; Wang, P.P.; Ma, R. Research on failure characteristics and control measures of roadways affected by multiple overhead mining in Huaibei mining area. J. Min. Saf. Eng. 2013, 30, 181–187. [Google Scholar]
  35. Yuan, A.Y.; Yang, Z.Y.; Yang, Y.M. Across Mechanical Analysis and Control Technology of Surrounding Rock of Roadway Under the Influence of Dynamic Pressure. Met. Mine 2016, 2, 47–50. [Google Scholar]
  36. Guo, Y.; Zheng, X.G.; Guo, G.Y.; Zhao, Q.F.; Zhou, W.; An, T.L. Study on deformation failure and control of surrounding rock in soft rock roadway in close range coal seam with overhead mining. J. Min. Saf. Eng. 2018, 35, 56–63. [Google Scholar]
  37. Zhang, H.L.; Wang, L.G. Computation of Mining Induced Floor Additional Stress and Its Application. J. Min. Saf. Eng. 2011, 28, 288–292. [Google Scholar]
  38. Xie, W.B.; Shi, Z.F.; Yin, S.J. Stability Analysis of Surrounding Rock Masses of Roadway Under Overhead Mining. Chin. J. Rock Mech. Eng. 2004, 23, 1986–1991. [Google Scholar]
  39. Zhu, Q.H. Mechanics Analysis of Surrounding Rock Deformation of Roadway Affected by Deep Riding Mining and Its Stability Control. Ph.D. Thesis, China University of Mining and Technology, Xuzhou, China, 2012. [Google Scholar]
  40. Zhang, C.; Zhang, L.Y.; Li, K.; Li, M. Numerical Simulation of Rock Mass Stability in Mining Dynamic Pressure Straddling. J. Xuzhou Inst. Technol. (Nat. Sci. Ed.) 2011, 26, 40–46. [Google Scholar]
  41. Ma, X.Z. Application of large rigidity coupling support technology in high stress cross mining roadway. Energy Technol. Manag. 2011, 2, 62–64. [Google Scholar]
Figure 1. Layout diagram of rock roadway under overhead mining.
Energies 14 05759 g001
Figure 2. Mine general situation and roadway deformation.
Energies 14 05759 g002
Figure 3. Layout of measuring points.
Energies 14 05759 g003
Figure 4. Numerical simulation model.
Energies 14 05759 g004
Figure 5. Comparison of deformation amount and deformation velocity of roadway surrounding rock (a) measuring point 2# (b) measuring point 1#.
Energies 14 05759 g005
Figure 6. Borehole peep imaging.
Energies 14 05759 g006
Figure 7. Comparison of deformation amount and deformation velocity of roadway surrounding rock (a) measuring point 3# (b) measuring point 4#.
Energies 14 05759 g007
Figure 8. Comparison of deformation velocity of roadway surrounding rock (a) measuring point 5# (b) measuring point 6#.
Energies 14 05759 g008
Figure 9. Comparison of deformation amount and deformation velocity of roadway surrounding rock (a) measuring point 7# (b) measuring point 8#.
Energies 14 05759 g009
Figure 10. Comparison of deformation amount and deformation velocity of roadway surrounding rock (a) measuring point 9# (b) measuring point 10#.
Energies 14 05759 g010
Figure 11. Horizontal stress distribution of roadway surrounding rock during bolt support. (a) Working face is 60 m away from the roadway. (b) Working face is 20 m away from the roadway. (c) Working face spans the roadway 20 m. (d) Working face spans the roadway 60 m.
Energies 14 05759 g011
Figure 12. Vertical stress distribution of roadway surrounding rock during bolt support. (a) Working face is 60 m away from the roadway. (b) Working face is 20 m away from the roadway. (c) Working face spans the roadway 20 m. (d) Working face spans the roadway 60 m.
Energies 14 05759 g012aEnergies 14 05759 g012b
Figure 13. Roadway displacement.
Energies 14 05759 g013
Figure 14. Horizontal stress distribution of surrounding rock of roadway supported by bolt and shed. (a) Working face is 60 m away from the roadway. (b) Working face is 20 m away from the roadway. (c) Working face spans the roadway 20 m. (d) Working face spans the roadway 60 m.
Energies 14 05759 g014
Figure 15. Vertical stress distribution of surrounding rock of roadway supported by bolt and shed. (a) Working face is 60 m away from the roadway. (b) Working face is 20 m away from the roadway. (c) Working face spans the roadway 20 m. (d) Working face spans the roadway 60 m.
Energies 14 05759 g015
Figure 16. Vertical displacement of working face when crossing roadway 60 m.
Energies 14 05759 g016
Figure 17. Horizontal stress distribution of surrounding rock of roadway supported by anchor–shotcreting–grouting support. (a) Working face is 60 m away from the roadway. (b) Working face is 0 m away from the roadway. (c) Working face spans the roadway 20 m. (d) Working face spans the roadway 60 m.
Energies 14 05759 g017
Figure 18. Vertical stress distribution of surrounding rock of roadway supported by anchor–shotcreting–grouting support. (a) Working face is 60 m away from the roadway. (b) Working face is 0 m away from the roadway. (c) Working face spans the roadway 20 m. (d) Working face spans the roadway 60 m.
Energies 14 05759 g018
Figure 19. Vertical displacement of working face when crossing roadway 60 m.
Energies 14 05759 g019
Figure 20. Schematic diagram of support scheme (mm). (a) Arrangement of side and roof anchor cables (b) Grouting reinforcement parameter.
Energies 14 05759 g020aEnergies 14 05759 g020b
Figure 21. Deformation amount and deformation velocity of roadway surrounding rock (a) measuring point 11# (b) measuring point 12#.
Energies 14 05759 g021
Figure 22. Surrounding rock separation near measuring point 11#.
Energies 14 05759 g022
Table 1. Reference table of rock mechanics parameters.
NameBulk Modulus (GPa)Shear Modulus (GPa)Density (kg/m3)Cohesion (MPa)Friction Angle (°)
Sandstone7.34.22400235
Siltstone8.15.125002.129
Mudstone3.22.7424001.225
Coal seam2.41.3713500.823
Publisher’s Note: MDPI stays neutral with regard to jurisdictional claims in published maps and institutional affiliations.

