Article

CFD Simulation of a 3D Solar Chimney Integrated with an Axial Turbine for Power Generation

by
Suad Hassan Danook
1,
Hussein A. Z. AL-bonsrulah
2,*,
Ishak Hashim
3,* and
Dhinakaran Veeman
4
1
Kirkuk Technical College, Northen Technical University, Kirkuk 36001, Iraq
2
Department of Mechanical Engineering, Faculty of Engineering, Kufa University, Najaf 54002, Iraq
3
Department of Mathematical Sciences, Faculty of Science & Technology, Universiti Kebangsaan Malaysia, Bangi 43600, Selangor, Malaysia
4
Centre for Computational Mechanics, Chennai Institute of Technology, Chennai 600069, India
*
Authors to whom correspondence should be addressed.
Energies 2021, 14(18), 5771; https://doi.org/10.3390/en14185771
Submission received: 11 August 2021 / Revised: 29 August 2021 / Accepted: 6 September 2021 / Published: 13 September 2021

Abstract

:
The solar chimney is one of the uninvestigated areas in the possible selection in the field of renewable solar energy utilization. CFD can be demonstrated as a useful tool of figure confidence in the design and employment of a solar chimney. A realistic numerical model for a solar-based updraft power plant for power generation was established through this research work. Iraqi weather in Kirkuk, northern Iraq was considered for this case study. A three-dimensional (3D) simulation of the main geometric dimensions of the Spanish, Manzanares model integrated with a real turbine was performed using computational fluid dynamics (CFD). The turbulent model of RNG k-e, the nongrey discrete coordinate (DO) radiation model, and the solar raytracing algorithm were used. It was observed that the air velocity below the turbine was graded according to the seasons of the year and was at its maximum in July with 18.28 m/s due to the high ambient temperature, and the lowest value was recorded in January with 8.64 m/s. The overall average daily and monthly energy production values for the Kirkuk system were higher than those of the Kubang system, with values of 310 kWh/day and 9314 kWh/month, respectively, for the Kirkuk system, and 246 kWh/day and 7398 kWh/month, respectively, for the Kubang system. The simulation results showed that the electricity generation from the Kirkuk city power plant varied seasonally to be at its maximum value of 14,424 kWh/month in July. This research work will help to determine the possibility of producing electricity in this Kirkuk city, which would then contribute in a great way to reduce the cash spent on electricity.

1. Introduction

Over the past couple of centuries, the technology of solar energy has been considered a sustainable and clean source of energy [1,2]. Over the years, huge advancements have been made in building solar photovoltaic systems, while, at the same time, generating electricity from fossil fuels such as coal or oil damages our environment, as well as the effects of nuclear power plants in various locations [3]. Therefore, we must stay away from these nonrenewable and unsustainable energy sources and seek alternatives [4]. Many developed nations, such as Iraq, cannot completely rely on these common procedures, recognizing the adverse impact of emissions of carbon dioxide, and must try to utilize other types of green and sustainable energy sources. In addition, with a decent measure of downpour in our nation, hydropower is additionally one of our power generation sources, and we have a decent measure of daylight through the entire year that can be utilized to gather solar-based energy, so the need for an environmentally friendly electric power generation method is clear and will expand in the near future. With regard to considering the other energy sources to contribute to the total energy need in the country, the alternative energy must be sustainable and have the lowest environmental effect.
An updraft solar chimney is another alternative sustainable source of renewable energy for areas rich in sunlight, as it can also be taken as a substitution for the solar PV system. The main advantage of solar updraft over PV panels is that it is able to produce the solar energy 24 h a day even after sunset [5]. The PV system is a technology that absorbs radiation from sunlight to be converted in an environmentally friendly way, similar to plants that utilize chlorophyll for photosynthesis by sunlight to deliver the energy needed for these plants to grow. Around 14.4% of the sun’s light escapes from the atmospheric filtering of the Earth and then falls down to the ground where it can then be collected; however, this is almost 2800 times more than our energy needs [6]. The first prototype of a solar chimney was installed in Manzanares, Spain, in 1982 and worked continuously for approximately seven years with a maximum output power of 50 kW [7].
This solar chimney was built with a tower diameter and height of 10.16 m and 194.6 m, respectively, coupled with an axial turbine located 9 m above ground inside the chimney. The radius of the collector and inlet height were 122 m and 1.85 m, respectively. The conceptual standards and the fundamental test outcomes of the Manzanares power plant model were recorded by Haaf et al. [7]. After the capability of the solar updraft tower innovation was explained, tests of the system’s potential capacity and investigations of framework execution were conducted. To solve the energy and Navier–Stokes equations in a steady state for the natural convection using the finite volume method, Bernardes et al. [8] implemented the first CFD code simulation. At that point, the first endeavors to simulate a solar updraft tower using commercial CFD software was conducted by Pastohr et al. [9]. CFD simulations were progressively conducted to replicate the heat transfer and fluid flow inside the solar updraft tower system.
Chung and Gholamalizadeh [10] developed a numerical-based model of a solar chimney power plant by performing a 3D simulation of the engineering standards for the Manzanares prototype coupled with a real turbine implemented using computational fluid dynamics (CFD). The RNG k-e model was considered to mimic the turbulence of the flow, with discrete ordinates (DO) as a radiation model. They also conducted a simpler simulation by using the reverse fan model to check for pressure drop. The results revealed that, in comparison with the pressure drop of the real turbine model, the model of the reverse fan showed almost the same performance with a lower pressure drop of 43.7%. Their study offered a very precise approach for predicting the solar chimney performance by considering all the system’s phenomena.
Bouabidi et al. [11] studied numerically the solar chimney power plant under the weather conditions of Tunisia. They performed many test simulations to analyze the effect of chimney diameter. They studied the characteristics of the flowing air with various diameters. Simulation results revealed that the air flow velocity increased with the chimney diameter. As a result, the solar chimney efficiency increased with the diameter. Hence, the solar chimney power plant was thought to be an effective way to utilize the solar energy in Tunisia. Rabehi et al. [12] designed and simulated the solar chimney power plant using the ANSYS Fluent software by considering the reverse fan model. For three locations in the solar chimney power plant: the solar chimney, solar collector, and the turbine, a mathematical model was written that explains the air flow and heat transfer. As an example of a numerical simulation that includes a turbine model, the Spanish model was chosen. During turbine operation and in the absence of load, simulation outcomes were compared. Furthermore, the influence of the action of the turbine and the effect of the pressure drop across the turbine and solar radiation were studied, and the results showed that the variation in solar radiation had a direct impact on the properties of flow and heat transfer. At the same time, the effect on the efficiency of the collector of the turbine pressure drop was marginal, although it had a major impact on the output of electricity.
Ismail et al. [13] performed a computational analysis to examine possible changes to the properties of air flow and heat transfer in relation to a traditional solar chimney device by using unsuccessful (negative) flow control methods. Through this research, it was found that the rise in the number of unsuccessful controllers contributed to a 7% increase in the maximum speed at the chimney entrance. Djaouida et al. [14] presented a numerical study of the station of the solar chimney. To test the air flow characteristics of the prototype power plant from the solar chimneys in Manzanares, Spain, numerical simulations were performed. To control the power output from this factory, a secure and dynamic method was developed. To accomplish this, by adding a secondary complex roof in the current main complex, they modified the reference station model. The results of this study showed that the construction of the secondary collector roof achieved good efficiency for the station in terms of power generation from the primary load.
Hassan et al. [15] conducted a numerical analysis using the ANSYS Fluent software, which involved investigating the effects that occur when adjusting the slope of the solar collector of the device and also the angle of diffraction of the chimney on power output from the solar chimney device. The validation of device simulation with the experimental results recorded on the prototype for the Manzanares station in Spain was included in the scope of their research. The findings indicated that through the higher incline of the collector, there was a steady rise in air velocity. However, when the tilt of the collector was above 6°, it was found that the airflow was not constant and that, under the collector, air recycling was due to density gradients resulting from the irregular temperature distribution that could prevent air from entering the chimney. The findings showed that the use of the 10° chimney spacing angle resulted in a significant speed increase from 9.1 m/s to 11.6 m/s, which was projected to increase energy production by 108%. A higher output potential can be achieved by using a diverged chimney with the lowest height of the chimney and the minimum diameter of the collector, compared to other approaches to increase the performance of the device, such as raising the height of the chimneys and the diameter of the collector.
Guo et al. [16] suggested a solar chimney three-dimensional numerical model with solar radiation, solar load, and a turbine model, and then tested it first using experimental data for Spain’s original solar chimney model. It was then used to analyze in detail the effect of solar radiation, the turbine’s pressure differential, and the air temperature on the system’s output. The results showed that in numerical simulations, heat transfer by radiation must be taken into account. Otherwise, there would be very little loss of heat. The effects of solar radiation and the turbine differential pressure on the output of the station were also visible and important. The results also showed that the difference in atmospheric temperature had little influence on the high temperature of the air, but that its influence on the flow and velocity of the air was apparent. The power output of the plant within the daily temperature range was found not to be highly dependent on the ambient temperature.
Das and Chandramohan [17] developed a three-dimensional numerical model for a solar chimney station to estimate and evaluate flow and efficiency parameters. They studied the effects of geometric variables such as the chimney height and the solar collector roof angle. The radiation disturbance model (RNG) was used to address the governing equations, and discrete ordinates (DO) were used. The results showed that, at the cost of reducing the air temperature, the air velocity was increased by adjusting the angle of the roof of the solar collector. When the chimney length rose from 3 to 8 m, a 31% speed increase was observed. The average efficiency at 0.00354%, chimney efficiency at 0.0465%, and solar collector efficiency at 81.4% were calculated, plus the power output of 0.255 watts.
Lu et al. proposed an air turbine design technique, taking into account an ideal turbine lowering in pressure for the solar chimney power station, based on the lifting design method for the hydraulic turbine with an axial flow pump impeller. Numerical simulations were carried out to examine the viability of the current turbine design technique in improving system output performance for the Spanish prototype system incorporation of the turbine impeller, as well as the effect on turbine performance of solar radiation. The results showed that the turbine performance enhanced with the design technique provided. The maximum turbine power output was 53.49 kW, which is 30.46% higher than that of the Spanish prototype, and the turbine was less sensitive to rotational speed. The Spanish Prototype solar chimney power plant (SCPP) is the mostly used system, and the same was utilized in the study to validate the results of the numerical simulation due to its performance [18,19,20,21].
Mohamed et al. observed the improvement of reliability and expansion by an efficient design of the Solar Chemistry Power Plant (SCPP) components. As the turbine is an essential component of the SCPP, a comparison study of three distinct models of the SCPP turbine was conducted. These designs are based on the so-called flow matrix (MTFM), the classic theory of the blade element (BET), and the change in the BET-based model to consider the turbine enclosure conduit. Numerical simulations of the whole SCPP unit utilizing the ANSYS CFX v18.1 computer fluid dynamics module were carried out in the analysis. The numerical results of the three designs demonstrated that the modified BET design had the maximum production capacity as compared to the other two. This research provided advice on the design and execution of SCPPs [22].
Zuo et al. developed an economic interpretation model for a solar fireplace power plant combining desalination and waste heat (SCPPDW) and a solar fireplace wind power plant combining marine desolation and waste heat (WSCPPDW). The economic performance of the two systems and WSCPPDW was investigated based on the net present value (NPV) approach after optimization. The inclusion of a wind surcharge system resulted in a 42.8% and 102.5% rise in net revenues (NET) and NPV, respectively. The annual NET of the two systems increased with time and the annual NPV climbed initially and subsequently dropped. The power and freshwater output of WSCPPDW were enhanced by 455.8% and 11.7%, respectively, after sequences for the optimization of turbine rotation, nozzle longitudinal, chimney outlet radius, and mixing section length. Total net revenue (TNET) and net present value (TNPV) grew correspondingly by 183.4% and 442.8% [23].
Milad et al. conducted an experiment on the influence on the performance of the solar chemistry power plant (SCPP) of geometric factors such as the roof collector angle (B), chimney divergence angle (A), and wind speed. A new airflow model for the collector, turbine, and chimney via all SCPP components was introduced. The geometry and operating circumstances of the SCPP prototype constructed in Manzanares were examined in the present model to validate the current model and verify the accuracy of the existing model by comparing the achieved results with the measured data of the SCPP prototype. The parametric research was conducted on different a and b components. The results demonstrated that the SCPP power output rose by b to a given a. It was also recommended that in the range of 0.7–0.85, the ratio of the decrease in the turbine pressure to the total pressure potential be chosen to achieve the optimal output of the SCPP. In addition, this study showed a significant rise in wind speed [24].
Ajeet et al. examined the potential design changes to enhance their extremely poor energy conversion efficiency with a third component, called the bell-mount inlet, as well as two key components: a collector and a chimney, to improve the thermal performance of the system. The results showed that the air velocity might significantly increase by about 270% when the collector, the chimney, and efficient bell-mouth integration modifications are suitable and, therefore, significantly improve the turbine power output compared to conventional power supplies. Further studies on the physics behind such a large air-speed increase showed that a novel design, which is completely lacking in conventional designs, showed a high overall pressure potential or static pressure recovery along its chimney height. The architecture of the experiment was further analyzed using a 50 kW power station. The results demonstrated that for the same collector area and chimney height of the old design, the new system could produce electricity up to 1738 kW. The concept presented was small, powerful, and a step toward the viability of the solar device [25]. Computational fluid dynamics was used to analyze the hydrodynamics parameters of the solar chimney power plant to understand the heat and fluid flow [26].
There are considerable research reports on the computational study of solar chimney power plants to analyze the different parameters to enhance the performance [27,28,29], impact of chimney geometry [30], influence of baffles [31], and chimney configurations [32]. However, the exploration of the solar-based upgraded power plant with a realistic power plant model and environmental conditions of particular regions has not been concentrated on much in the research [33,34]. Hence, an initiative was taken through this research work to establish a realistic numerical model for a solar updraft power plant for power generation and to take into account a case study of Iraqi weather in Kirkuk, northern Iraq. The turbulent model of RNG k-e, the nongrey discrete coordinate (DO) radiation model, and the solar raytracing algorithm were used to successfully develop a realistic numerical model using computational fluid dynamics. All solution conditions of the presented system depend on the atmosphere where the radiation from the sun has a major impact on the results of the study. Kirkuk city, northern Iraq, with a latitude of 46.35 and longitude of 44.39, was considered as a case study in order to determine the possibility of producing electricity in this city, which would then contribute in a great way to reduce the cash spent on the electricity.

2. Methodology of Simulation

2.1. Numerical Procedure

Numerical simulation is one of the important tools to study any transportation phenomenon that involves heat, fluid, and mass flow. The model of the presented solar chimney (cf. Figure 1) corresponding to the dimensions of the main Spanish prototype was modeled in the Design Modular software of ANSYS Fluent. A four-bladed wind turbine with the FX W-151-A blade profile was modeled at the chimney base. Table 1 shows the parameters of the blade section at different rotor radii in detail. To model the interaction between the turbine and airflow, a multiple reference frame (MRF) was employed.
The mesh was performed according to the model as in Figure 2 in the same ANSYS Mesher software. Due to the large model and the presence of the turbine, generating the mesh is a complicated task and requires a large number of elements and nodes, especially in some important locations such as the turbine and the curved zone between the collector and the tower. A mesh independence study was performed to check the appropriate number of cells for achieving mesh-segmentation independent of the results.
Meshing is one of the important components to obtain accurate results in numerical simulation. In order to simulate the Spanish power plant, a mesh containing 1,000,000 elements was considered to obtain the results accurately. In order to capture the large gradients appearing near the blades, the computational domain was discretized with a structure mesh with fine elements, and coarse meshing was followed far away from the blades.
The simulation was carried out using the numerical finite volume method for solving Navier–Stokes equations and the laws of mass and energy conservation with a commercial software Ansys Fluent, product of Ansys, Inc. Pennsylvania, USA. Furthermore, to describe the relationship between pressure and velocity, the COUPLE algorithm was used; the RNG turbulence model k-e was selected to describe the flow, and the body force weighted algorithm was selected as a tool for estimating the pressure limit. As for the other equations, with second-order upwind algorithms, they were all considered. In order to obtain more accurate results, all numerical calculations were solved using the double precision choice. For all equations, the iteration error was set to the 10−5 limit and for the energy equation, to 10−8.

2.2. Governing Equation

Due to the buoyancy force, whose intensity is generally determined by the Rayleigh number, the flow in the solar chimney power plants occurs. In the literature, it is typically stated that, as in the case of the Spanish prototype, the Rayleigh number in the solar chimney power plants is often higher than 1010, so the internal air flow must be turbulent. The RNG kappa-epsilon turbulence model was used accordingly. In the present analysis, the following assumptions were considered as the basis for the solution: steady-state method for fluid flow and heat transfer, Boussinesq approximation for air density, convection and radiation losses are thermal losses from the solar collector, and air flow is turbulent where most chimney systems are so.
The continuity, momentum, energy, and the standard k-epsilon equations can be written as [11]:
Continuity equation:
( ρ v ) = 0 .
Energy equation:
( v ( ρ E + p ) = ( k e f f T + ( μ [ ( v + v T ) 2 3 v I ] v ) ) + S h
Momentum equation:
( ρ v v ) = p + ( μ [ ( v + v T ) 2 3 v I ] ) + ρ g
K-e equations: to calculate the kinetic energy due to the generated disturbance (k) and the rate of dissipation (ε—the rate of conversion of the disturbance to heat by molecular viscosity), Equations (4) and (5) are used.
x i ( ρ k u i ) = x j [ ( μ + μ t δ k ) k x j ] + G k + G b ρ ε   Y M
x i ( ρ ε u i ) = x j [ ( μ + μ t δ ε ) ε x j ] + C 1 ε ε k ( G k + C 3 ε G b ) C 2 ε ρ ε 2 k
where v = u i + v j + w k is the velocity vector, and u, v, and w are the velocity components in the x, y, and z directions, respectively, ρ is the mass density, µ is the viscosity, t is time, T is the temperature, P is the pressure, and g is the gravitational acceleration. Gk is the generation of turbulent kinetic energy resulting from the average velocity gradients; and GB is the generation of turbulent kinetic energy due to buoyancy. C1e, C2e, and C3e are constants. dk and de are the turbulent Prandtl numbers for k and e, respectively. The constants of the model have the following default values: C 1 ε = 1.44 , C 2 ε = 1.92 , C 3 ε = 0.09 , δ k = 1.0 , δ ε = 1.3 .

2.3. Boundary Conditions

Table 2 shows all the boundary conditions of the system being studied. The depth of the ground at 5 m was allocated in the computational domain as temperature and was set to be the same as ambient temperature. The collector was coated with a 4 mm thick, semi-transparent glass material. The surface of the collector was set to convection along with the radiation involved in solar radiation, and the coefficient of heat transfer (10 W/m2 K) was considered [16]. The inlet pressure was allocated to the collector entrance, which is equal to that of atmospheric pressure. As for the tower, its outlet was set as a pressure outlet, which was also equal to the pressure of the atmosphere. A multi-block grid for the numerical model was developed. This mesh consisted of three distinct zones linked before and after the turbine by the interface between the turbine zone and the zone before and after it. With nonconformal mesh interfaces, Fluent is able to perform calculations [11]. As for the turbine, in this research, the four-bladed axial turbine was modeled. To deal with this type of turbine in the CFD simulation, we used the in-built MRF model prepared by the Ansys software. The MRF model is an approximation estimate in the steady-state analysis, which provides for many applications, such as turbomachinery, a rational method of fluid flow. With this model, for areas with moving parts, motion equations are updated to be transformed from equations with a fixed reference frame to a moving reference frame.

3. Calibration of Numerical Model

A solar chimney pilot plant, which was designed and constructed in Manzanares, Spain [35], was considered to evaluate the findings of the present work of the Kirkuk power plant, Iraq. The reason for considering the Spanish model was due to its performance, and many researchers have considered this model in their research. In order to validate the present model, three parameters, the Pressure Drop at Turbine, Air Velocity at Turbine, and Collector Outlet Temperature (K), were considered.
A pressure drop of 80 Pa around the turbine, an air velocity of 8.8 m/s, and a collector outlet temperature of approximately 310.5 K at a solar radiation intensity of 850 W/m2 h were observed [35]. The simulation performed with the same solar radiation intensity predicted that the turbine pressure difference was approximately 81.5 Pa, the air velocity at the tower entrance was approximately 9 m/s, and the collector outlet temperature was 310.15 K, as shown in Figure 3, which shows that the numerical results were well in agreement with the measured data (see Table 3).

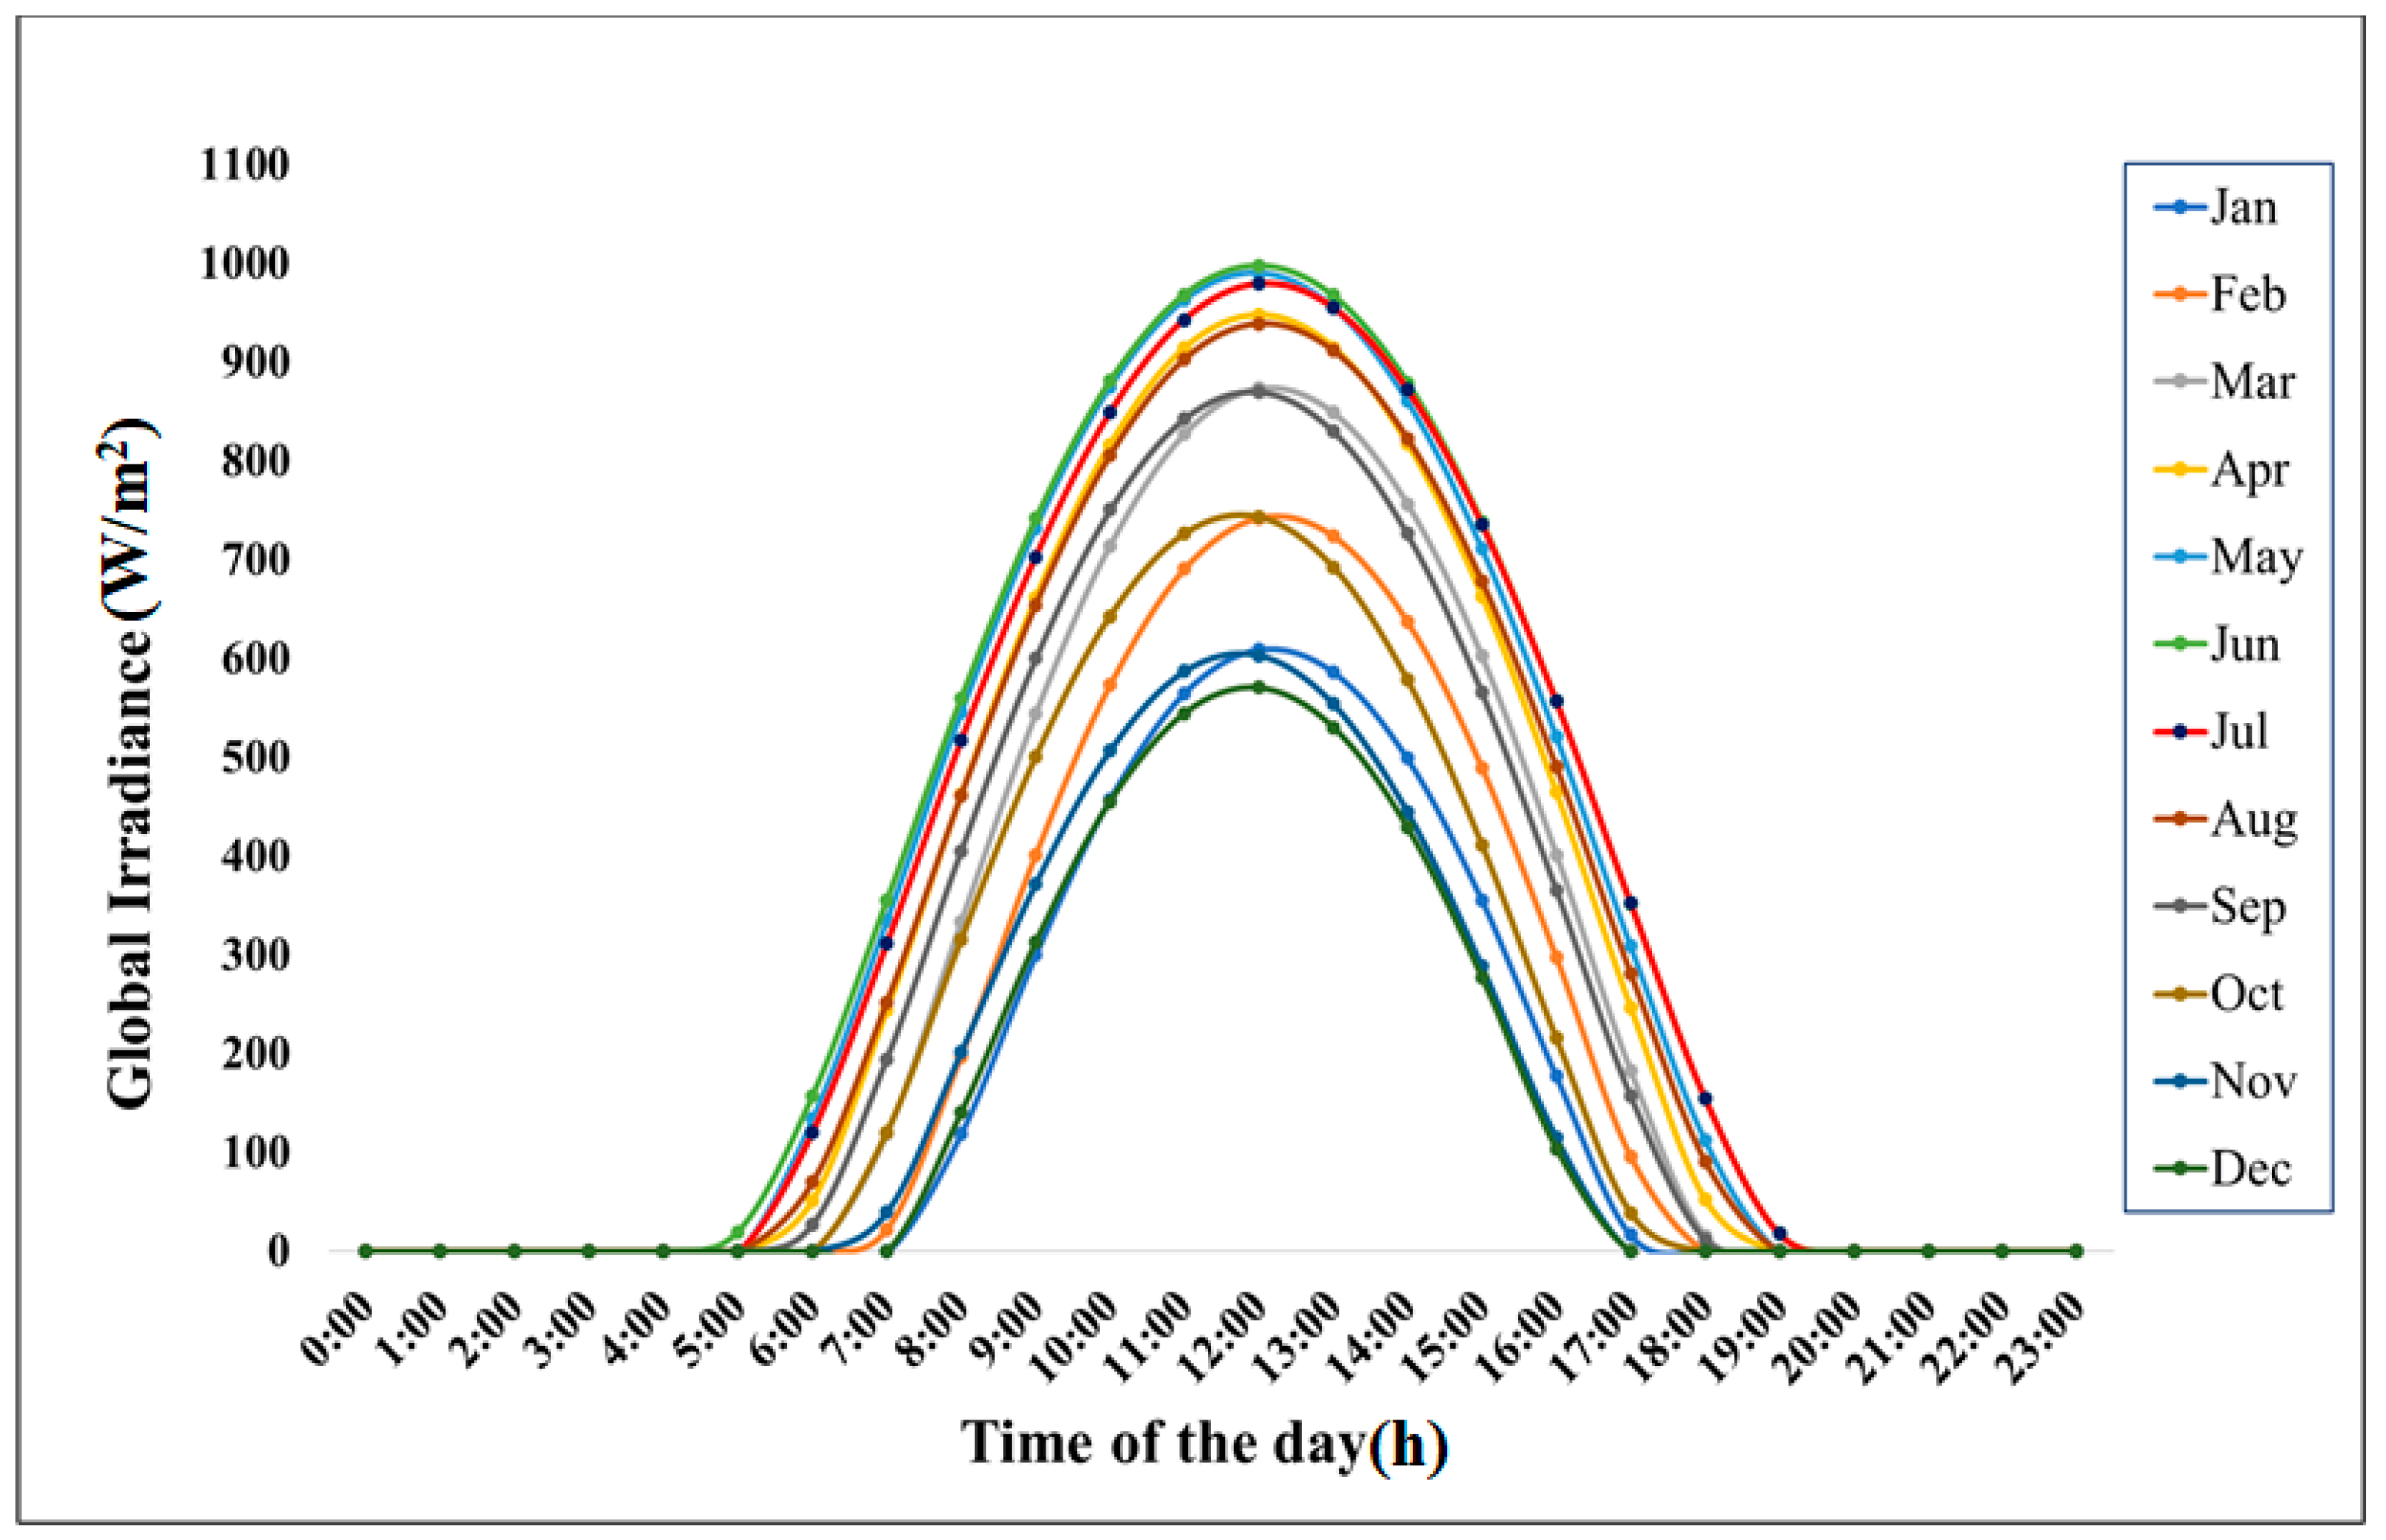
4. Weather Data for Numerical Simulation

In order to reflect the study for whole year, a total of twelve simulations were carried out considering that the climate conditions data were adapted for simulation from the famous and accredited site PVGIS [36].
Figure 4 shows the hourly solar radiation intensity during the day for all months of the year. It was observed that the solar radiation intensity was always the maximum value at 12:00 to 1:00 PM, and it was shown that June had the highest value of incident radiation, approximately 1000 W/m2. Figure 5 shows the ambient air temperature from 6:00 in the morning until 12:00 at night for each month of the year. The figure shows that the ambient air temperature was highest in July.

5. Results and Discussion

A numerical model was established in order to determine the possibility of producing electricity in Kirkuk city, northern Iraq. A three-dimensional (3D) simulation of the main geometric dimensions of the Spanish, Manzanares model integrated with a real turbine was performed using computational fluid dynamics (CFD).
Figure 6 explains the exact solar radiation falling on the system, which is depicted as a heat flux on the absorbing plate of the system after the transmission of radiation from the glass cover, and the purpose of this figure is merely to demonstrate the heat flux and the areas of shadow produced. This shows the power of the solar system used in ANSYS Fluent, which is the Solar Load Model. The figure shows the heat flux produced for all the months of the year, and for the time of 8:00 a.m., this hour was considered because this thermal flux and the shade were clearer, as it was noted that there was no shade for the solar chimney in the early period of January, due to the slight height of the sun; however, the shade of the chimney became visible and the length of the shade increased as the sun rose due to the progression in the months and the increase in the sun beam. Scale was not considered in Figure 6. However, it has been given here to show the sun beam and how it changes around the year, depicted by the chimney shadow, starting from January in which the chimney shadow is barely seen, until December. This gives an idea of how the solar load works in Ansys.

5.1. Velocity at Chimney Base

Figure 7 shows the velocity distribution for the aforementioned months along the diameter of the chimney. It appears that the highest velocity is in July, because the ambient air temperature that is entering the collector has the highest value in this month and also the high amount of solar radiation absorbed in this month. High solar radiation means reducing the air density and, thus, increasing its velocity, so the solar radiation has a fundamental effect on the air velocity.
Figure 8 shows the average velocity along the chimney diameter, and it shows that the maximum average velocity was in July with a value of 18.28 m/s and the lowest value was recorded in January, of 8.64 m/s.

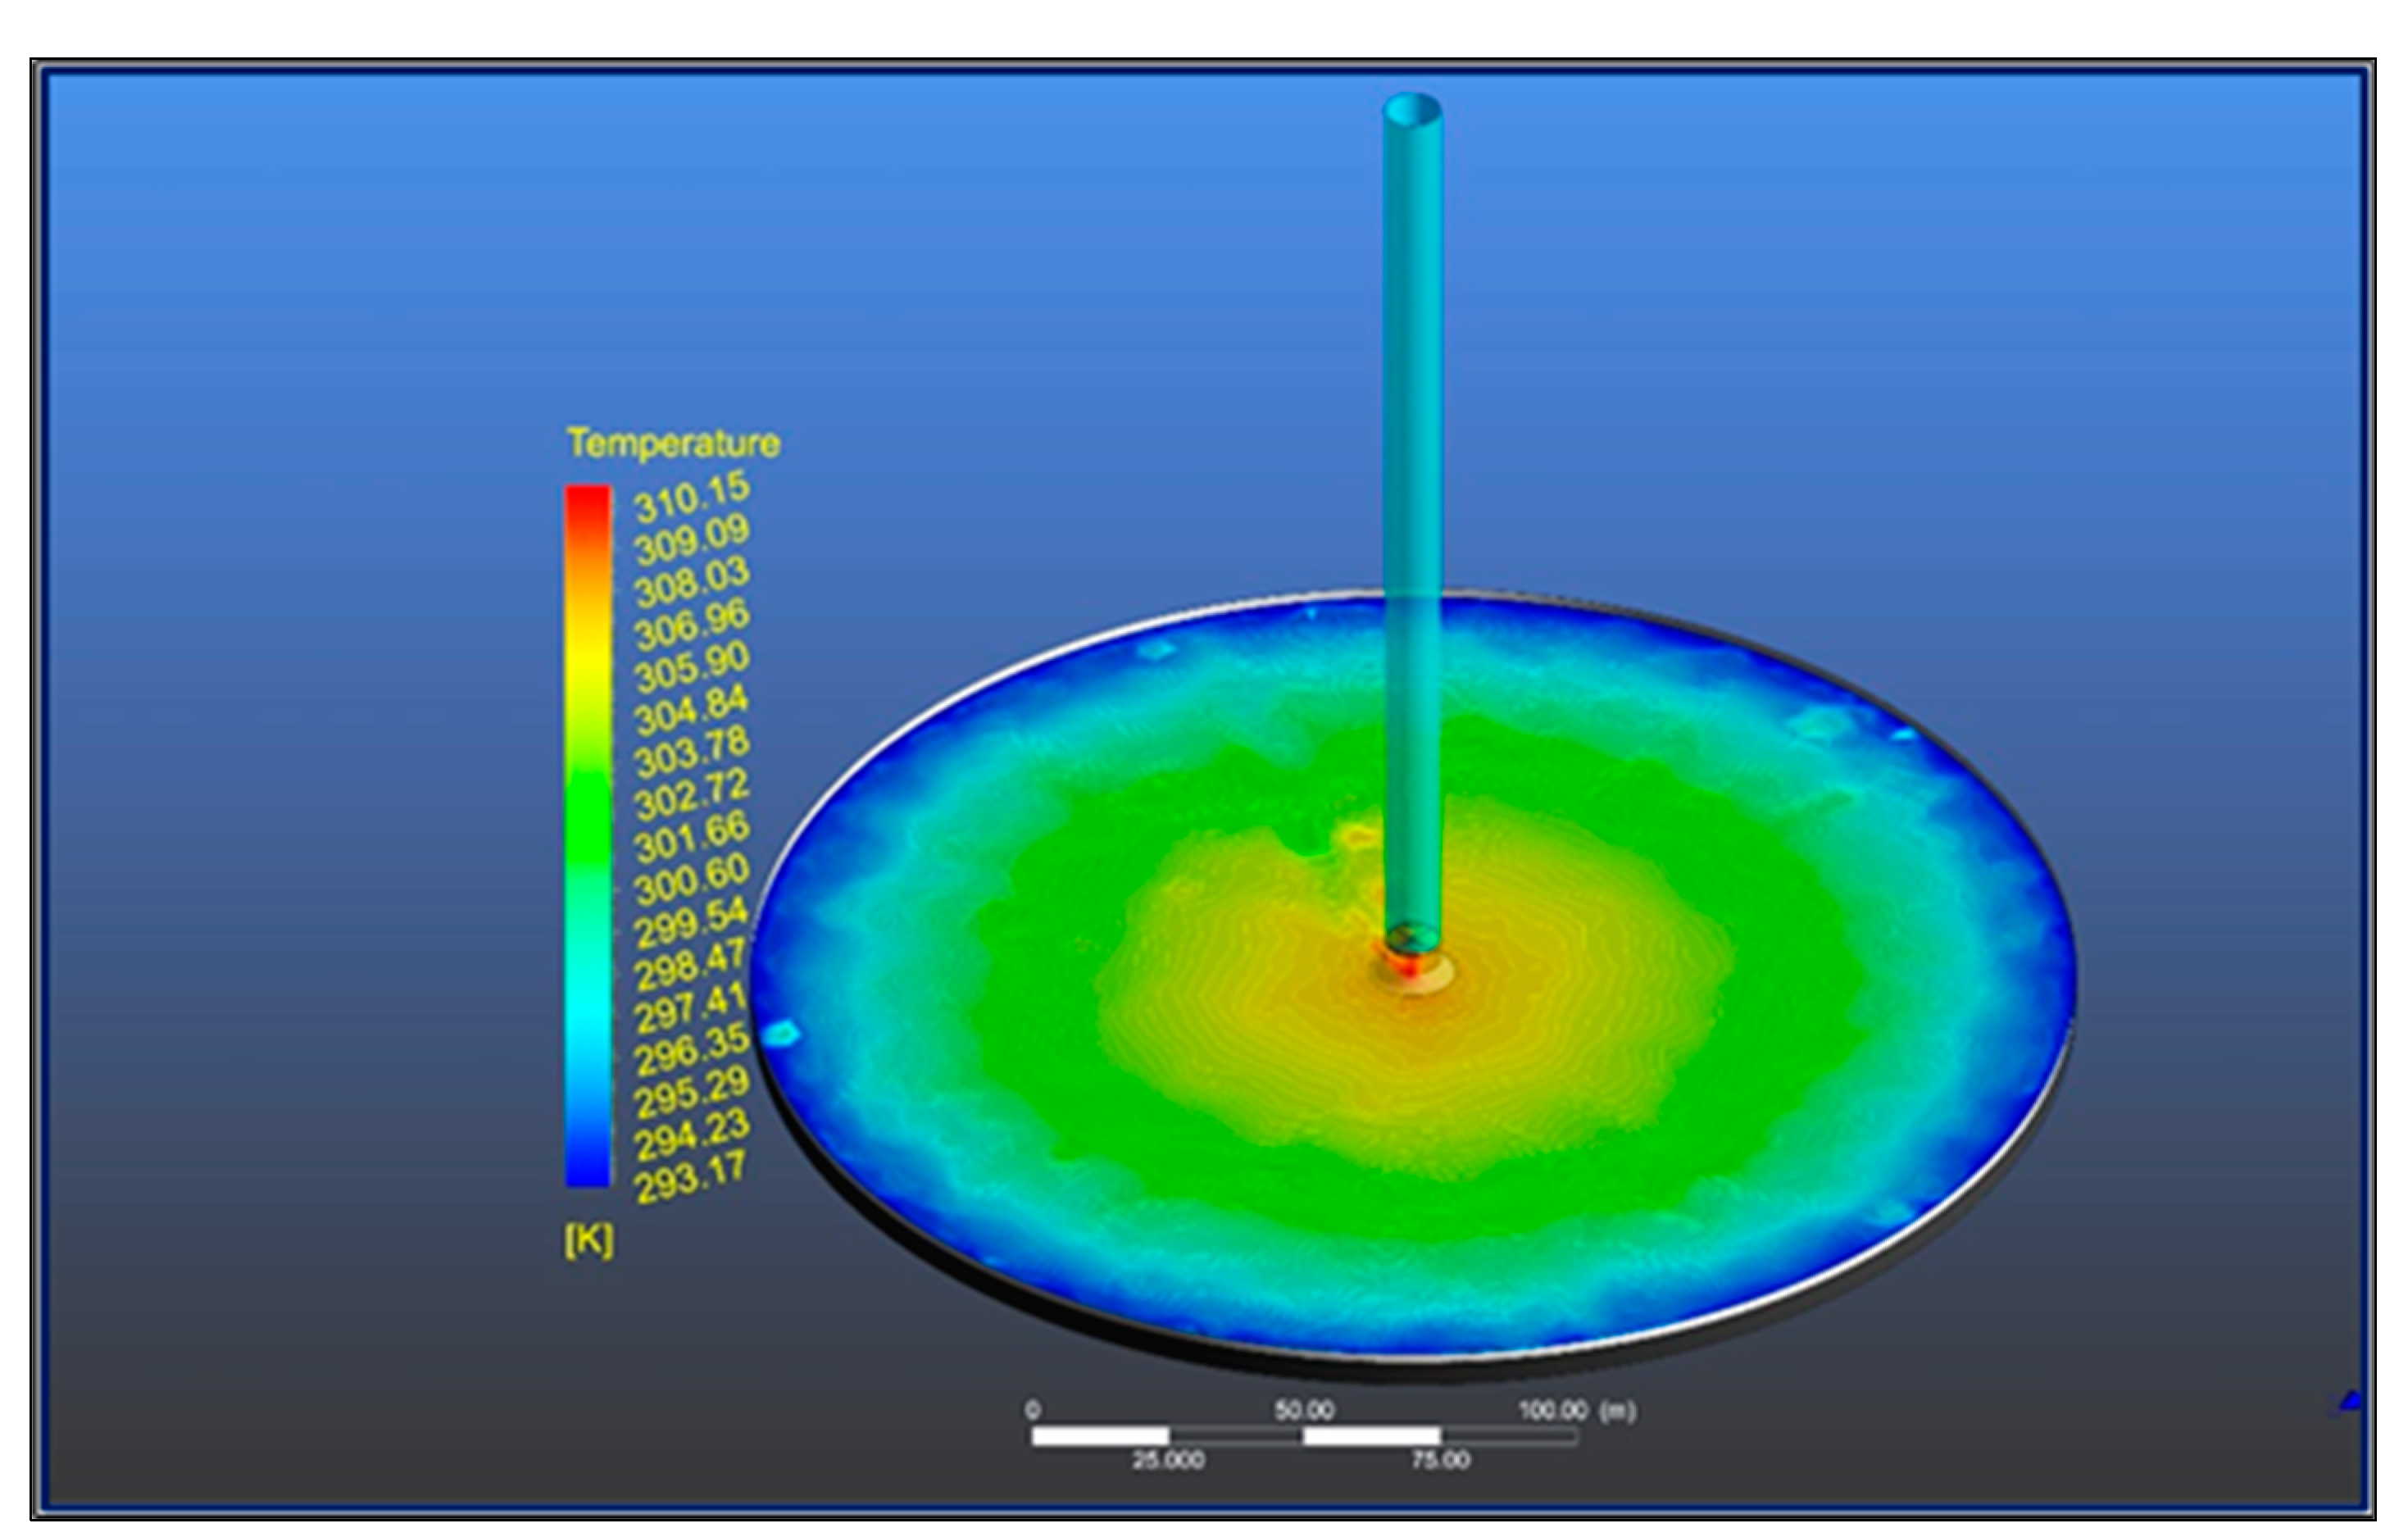
5.2. Temperature Inside the Collector

Figure 9 shows the distribution of all temperature values for all months, and along the diameter of the solar collector, it appears that the air temperature gradually increases from the entrance of the collector until it reaches the chimney entry or collector exit region.
It is noticed that the highest value is 329.5 K in the month of July due to the high ambient temperature, which is more than in the remaining months, and the maximum value is noticed at the middle of the collector, that is, under the inlet region of the chimney, and the reason is that the air molecules here are in a state of collision from all sides; therefore, the generated heat increases and the air temperature rises. Figure 10 shows the average temperature values along the diameter of the solar collector for all months of the year.

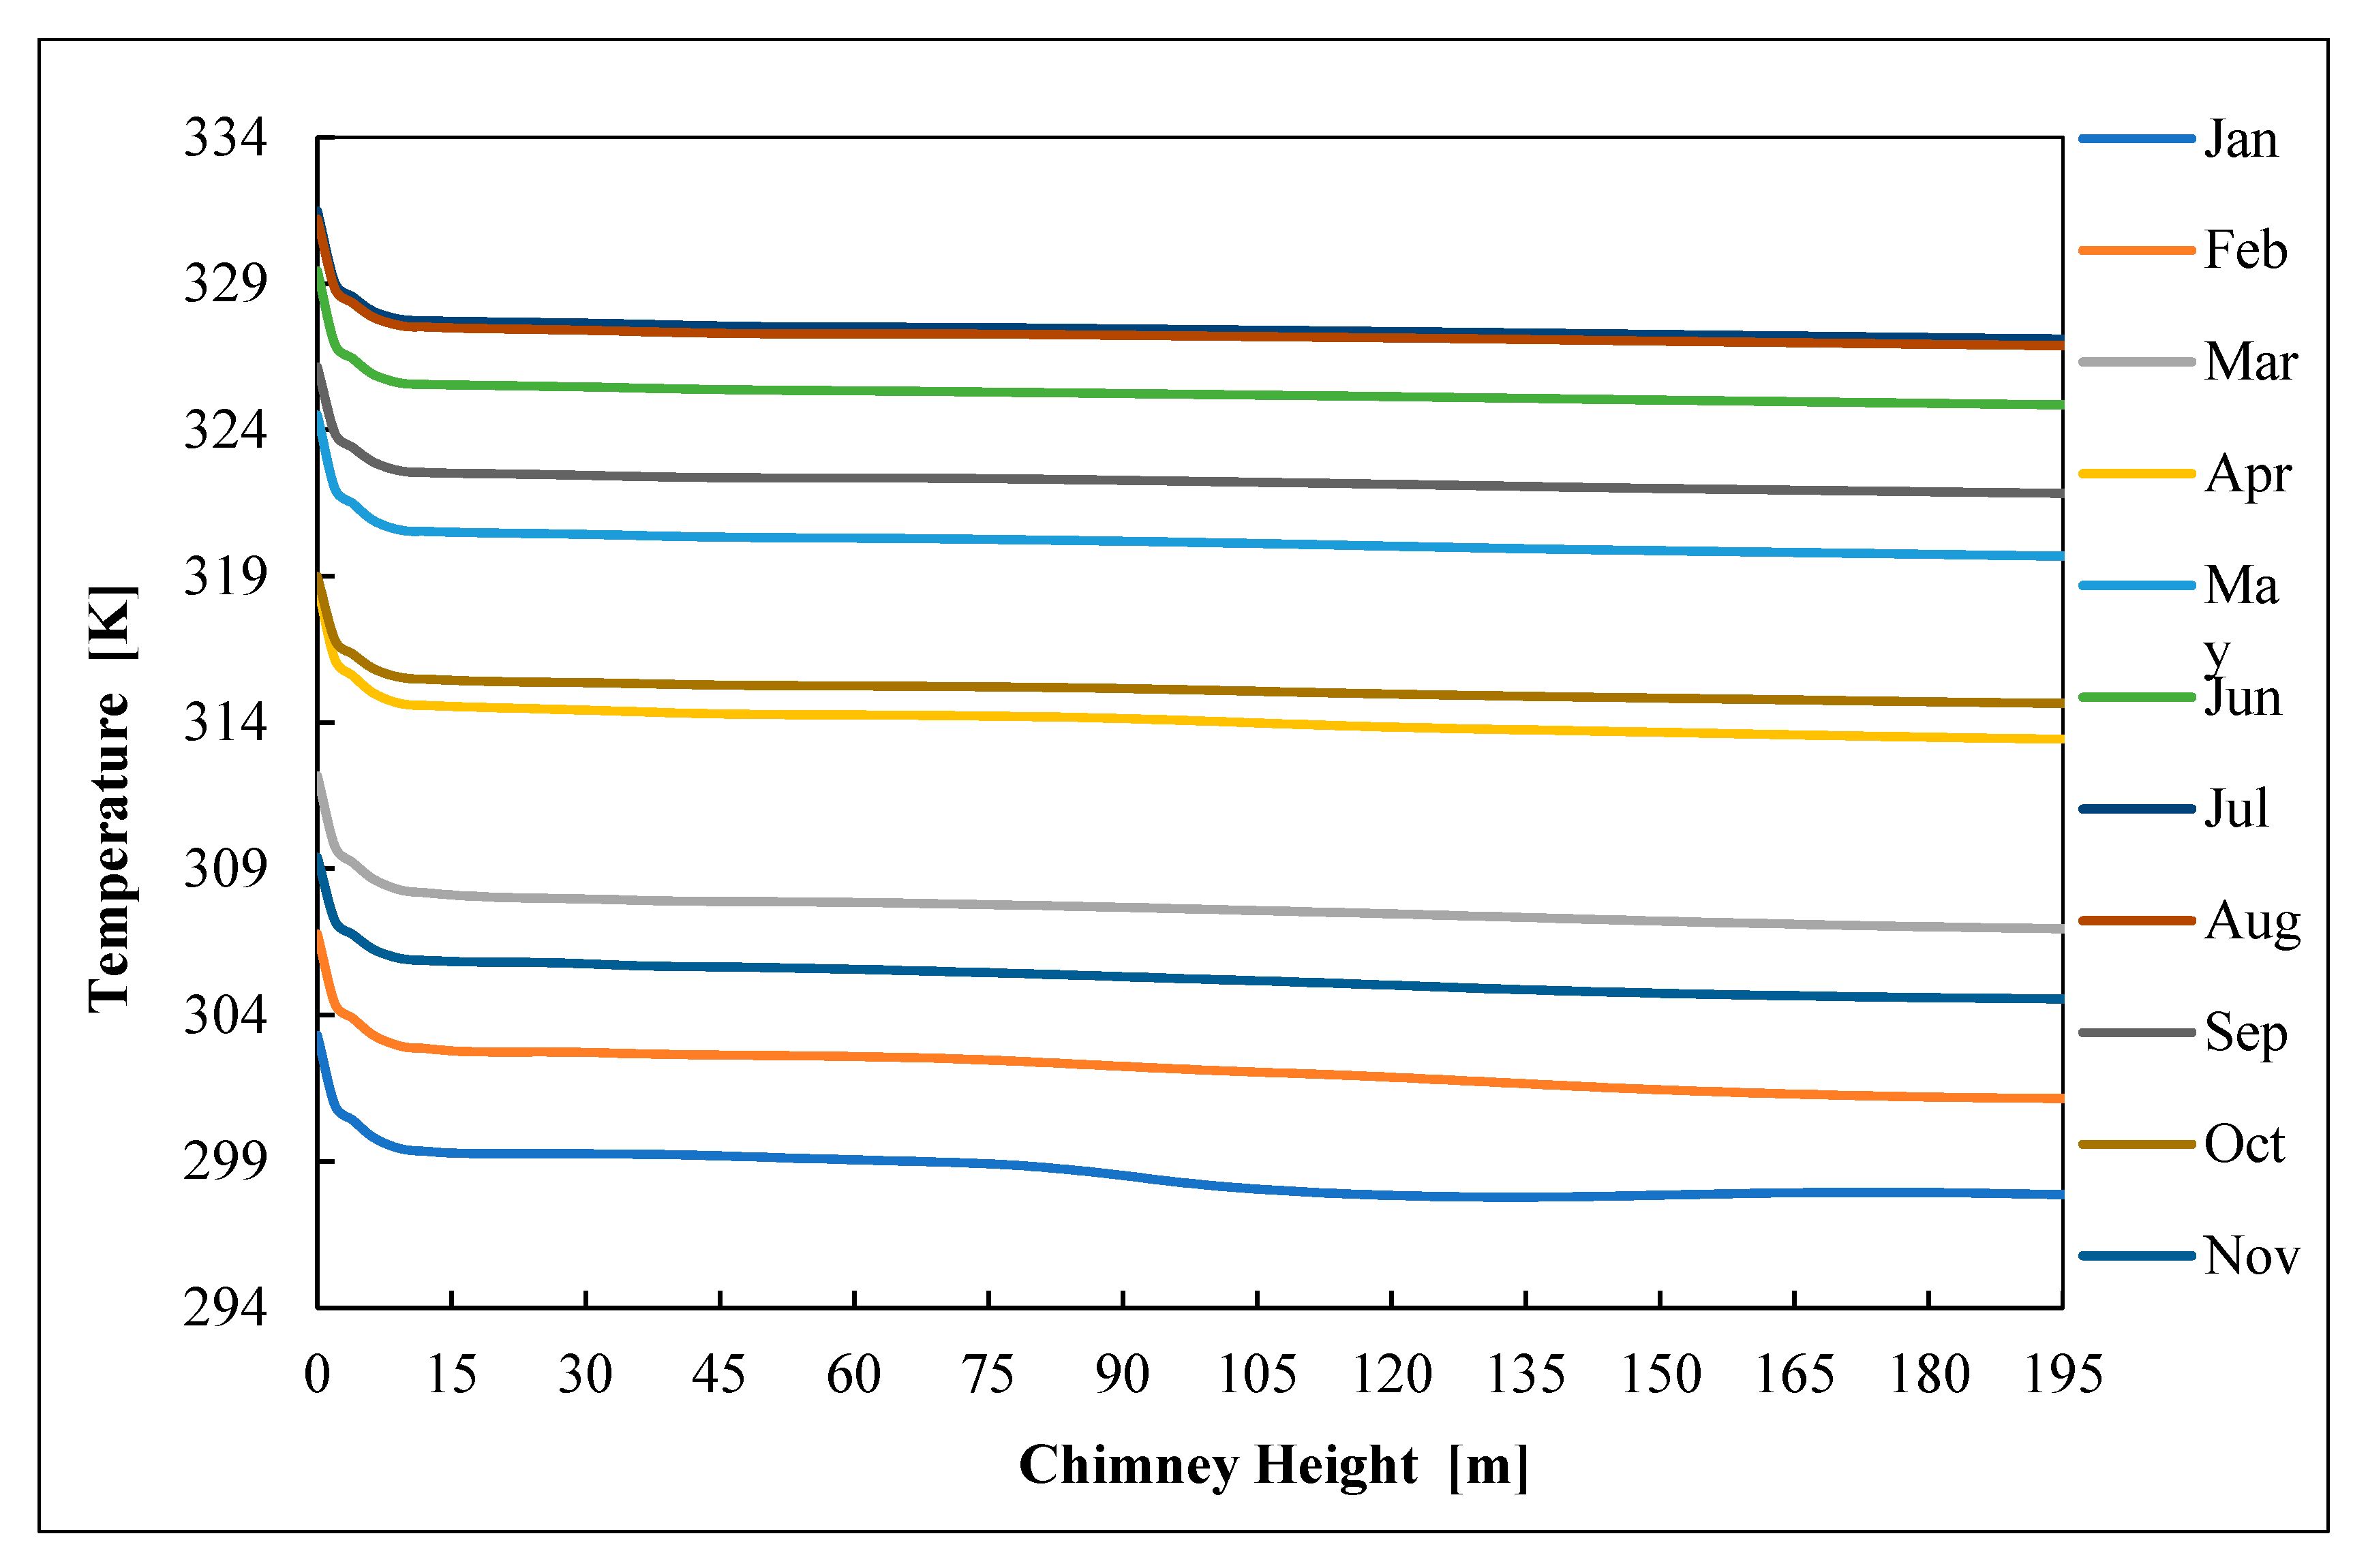
5.3. Temperature Inside the Chimney

Figure 11 shows the average distribution of temperatures along the chimney height for all months of the year. The figure shows that the temperature is at its highest value at the outlet of the solar collector, but then progressively decreases until the air comes out of the chimney. After going through the wind turbine, the temperature of the air flow steadily decreases in the chimney, because of some losses that occur through the wall of the chimney, and the gradual transformation of the enthalpy into the potential energy of gravity, which is energy stored in the fluid as a result of the effect of the Earth’s gravitational force on the turbine.

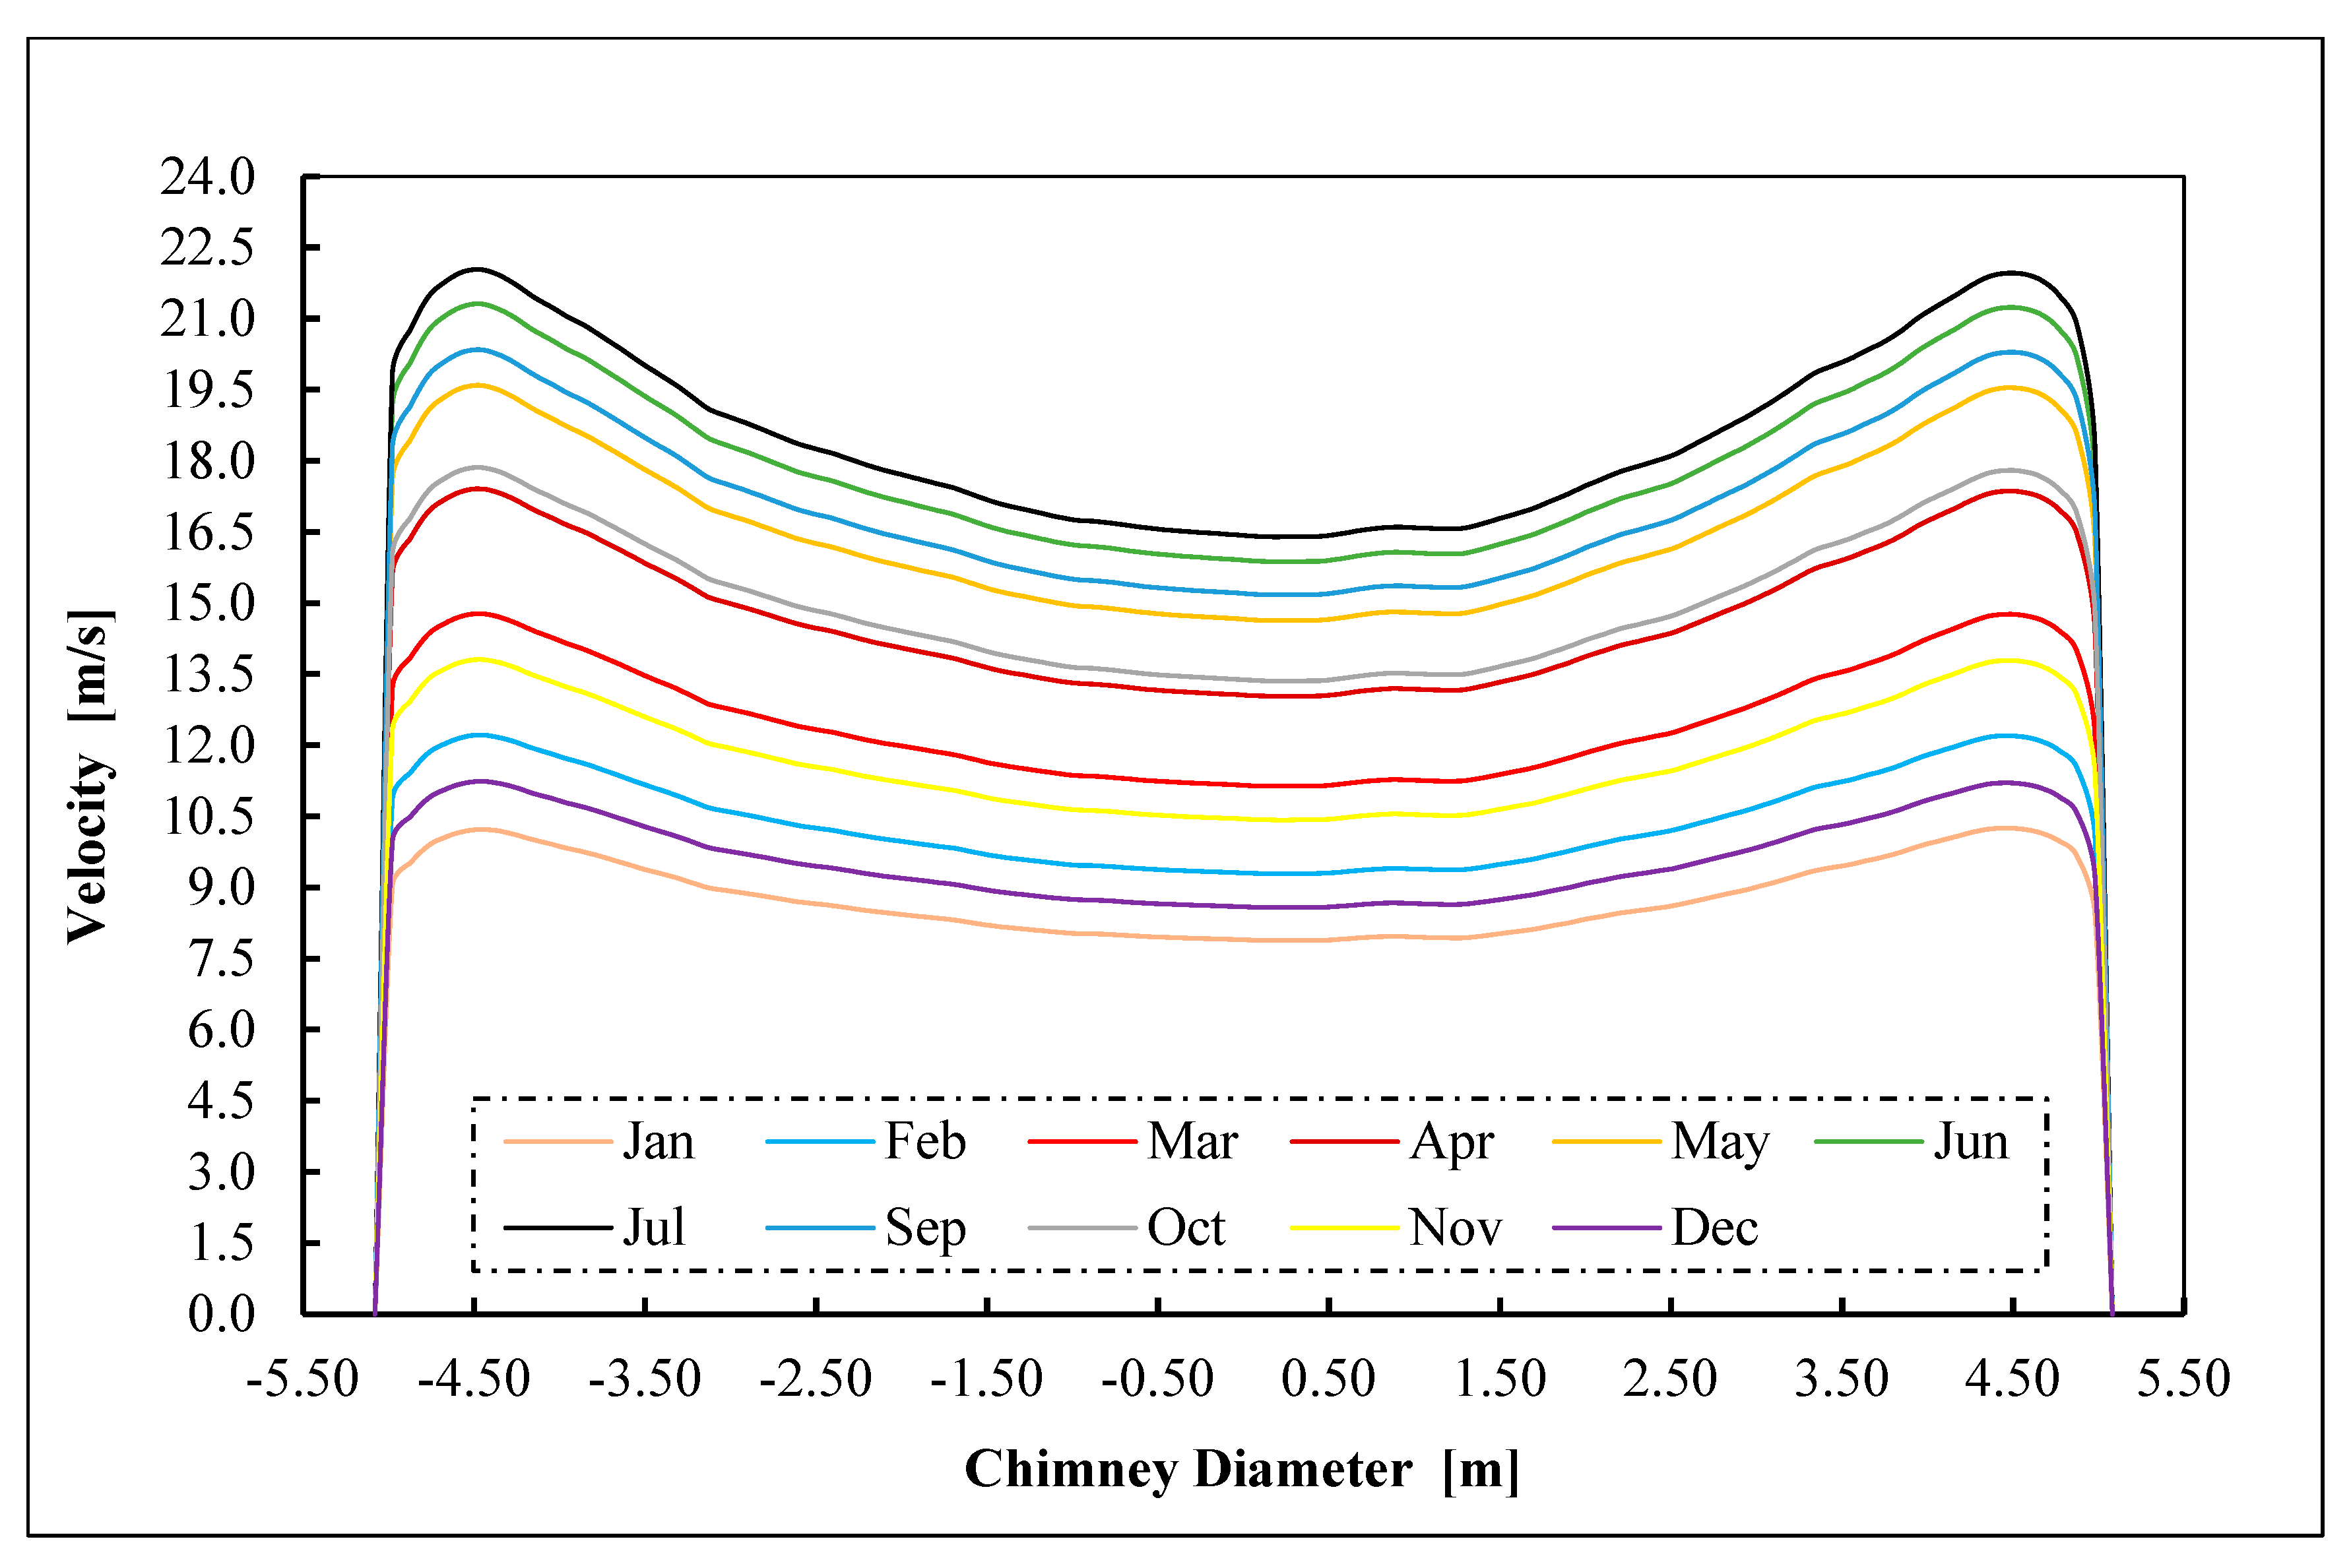
5.4. Velocity Inside the Chimney

Figure 12 indicates the average distribution of velocity throughout the height of the chimney for all months during the year, and it appears that as the air flow rises and eventually grows in the chimney, the flow velocity in the chimney decreases slightly; essentially, the air flow velocity at different points in the chimney is the same as the average air flow velocity in the chimney, and the decrease in air flow velocity in the chimney, which is observed in the figure below, is caused by the air flow colliding with the base of the wind turbine, and consequently, its velocity drops slightly.

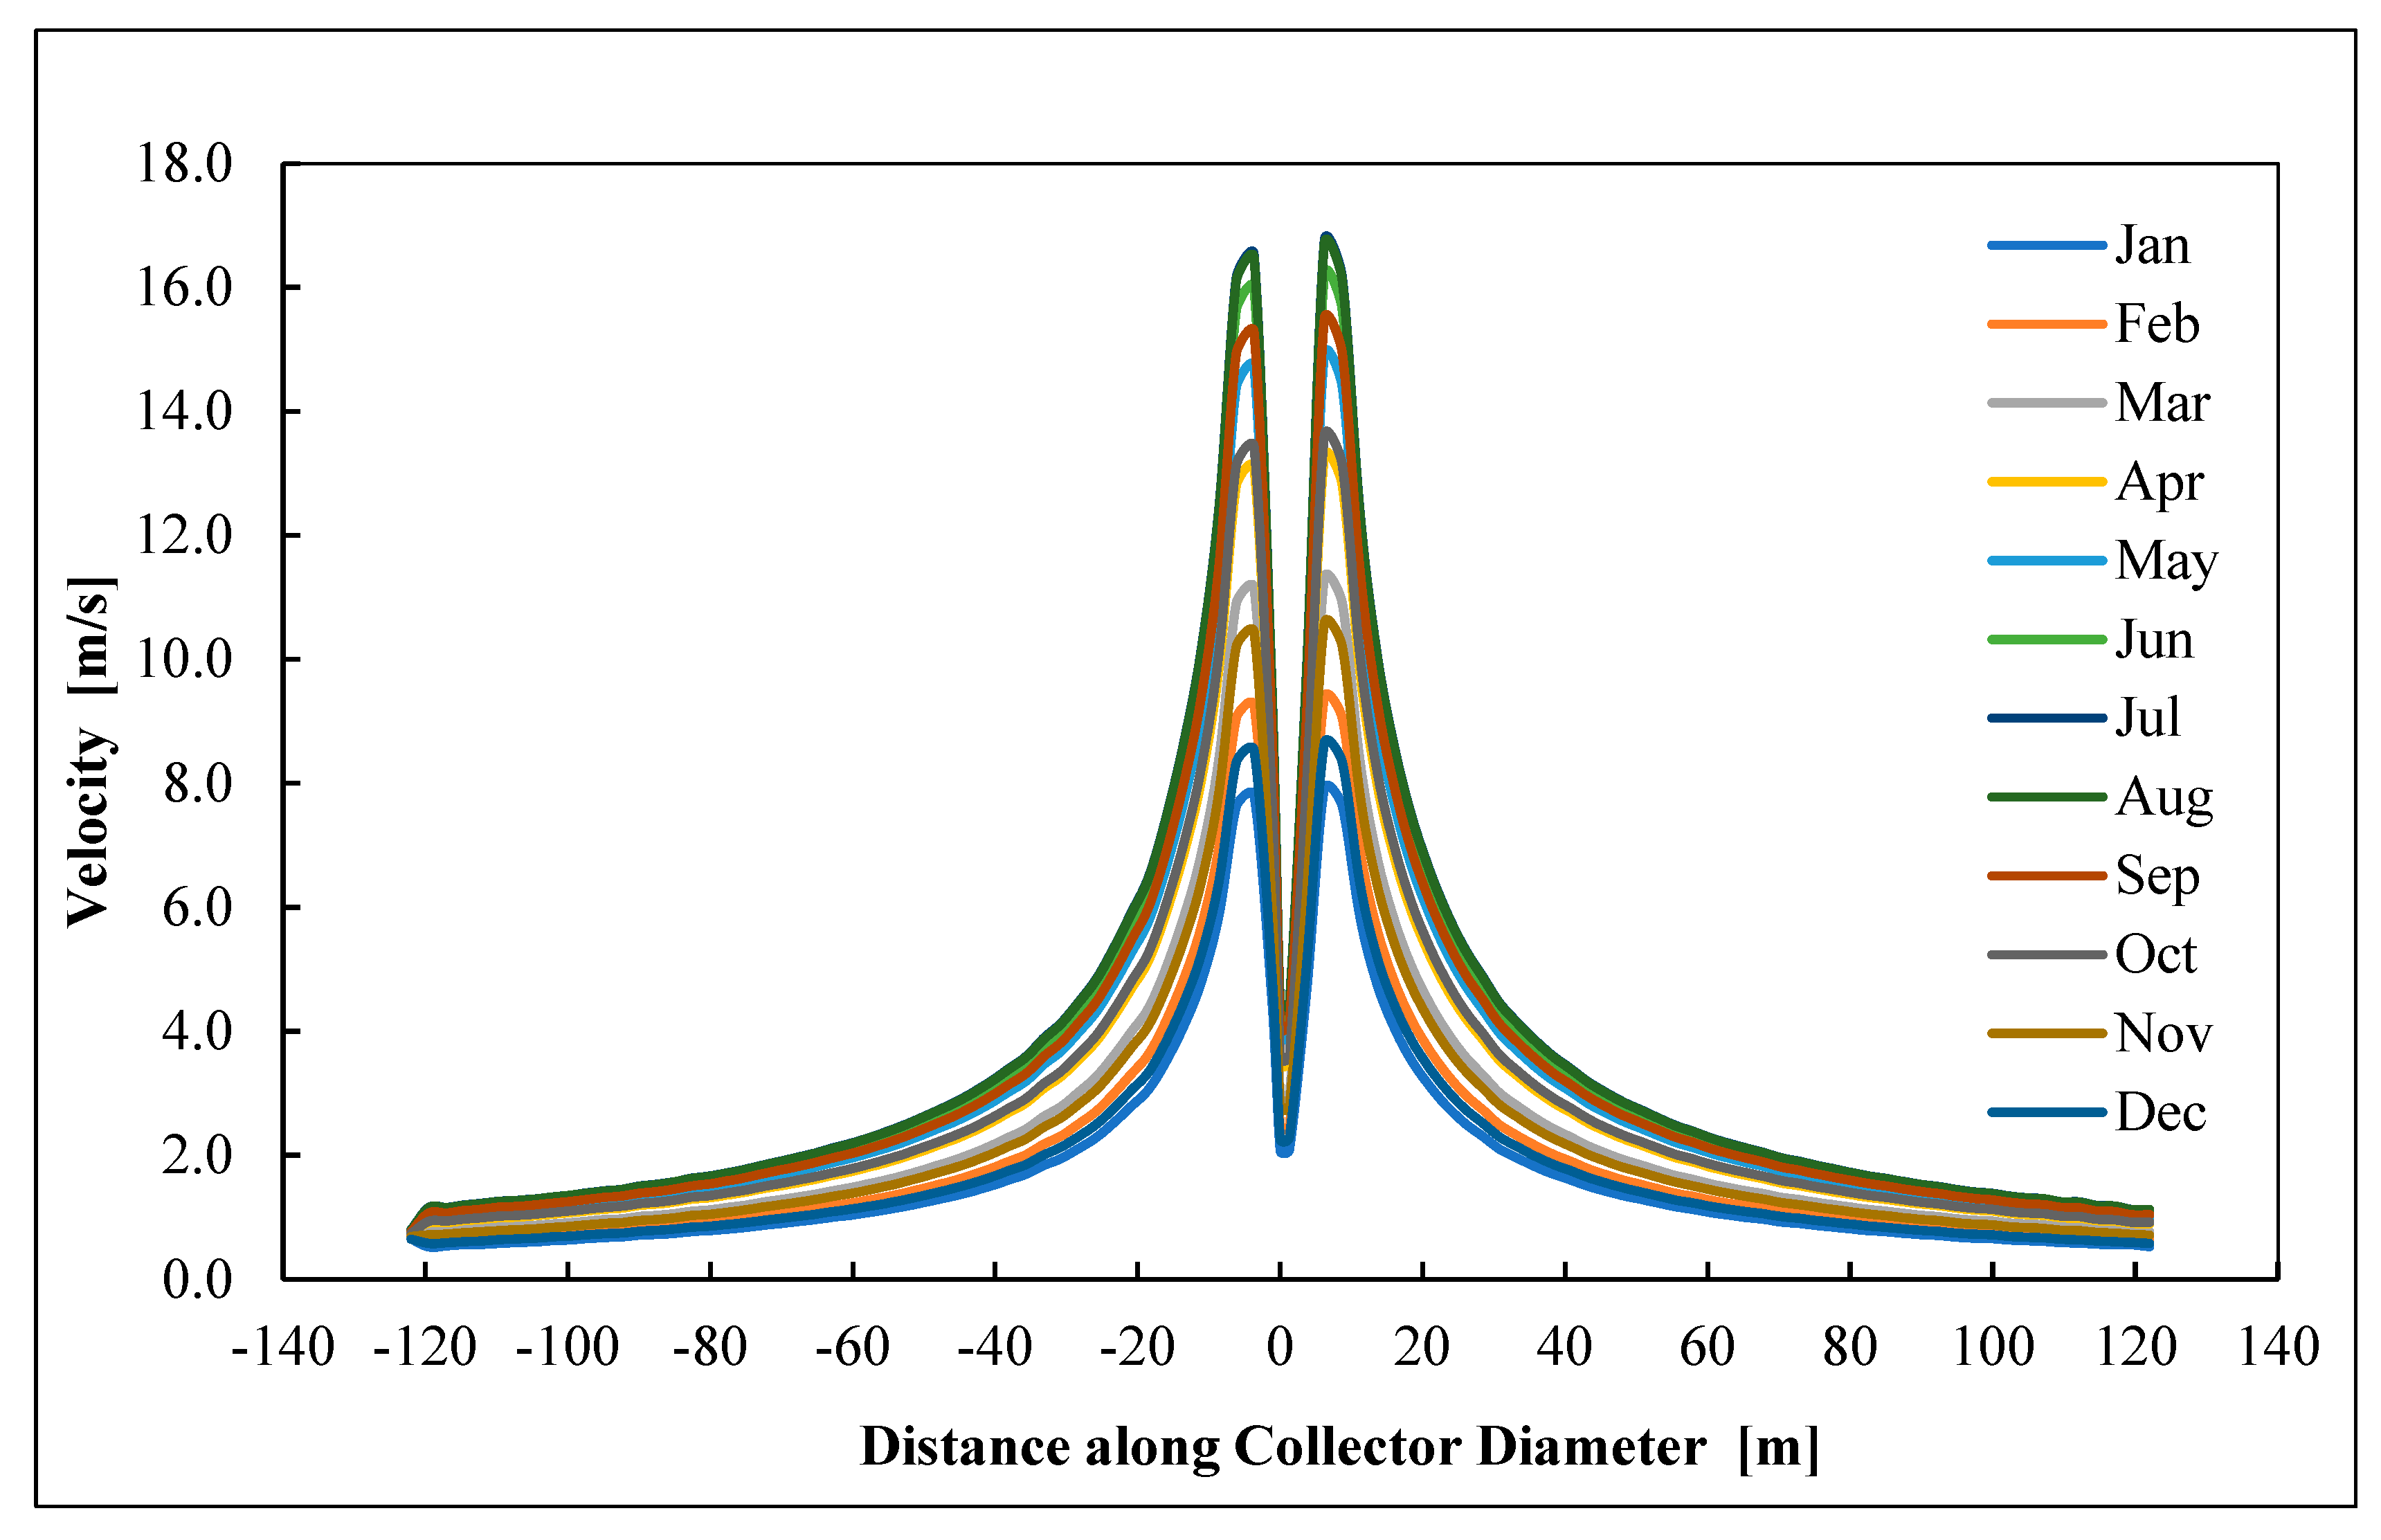
5.5. Velocity along Collector Diameter

Figure 13 shows the distribution of velocity inside the solar collector as the velocity slowly increases inside the collector until it reaches the entrance to the chimney, which can be considered as a constant pressure heat absorption mechanism. The air flow is reduced because of the sharp decrease in the cross-sectional area of the air flow in the transition that forms between the collector and the chimney; hence, the velocity is greatly increased. The average velocity values for the described months along the solar collector are shown in Figure 14.

5.6. Power Output

There are two types of power to explain after analyzing the results, which are explained as follows:
(a)
Reversible power. In Figure 15, the kinetic energy available from the system, called the reversible power of the system, is shown. This power is known to be the maximum power that can be achieved in the region of the turbine, which depends on the turbine’s volumetric flow rate and pressure difference.
It is observed from Figure 15 that the maximum power of 99.45 KW can be gained approximately in the month of July of the year, which is attributed to the air velocity entering the chimney, which is 18.28 m/s at its maximum value in that month. Figure 16 demonstrates the average daily kinetic energy generated for all months of the year.
(b)
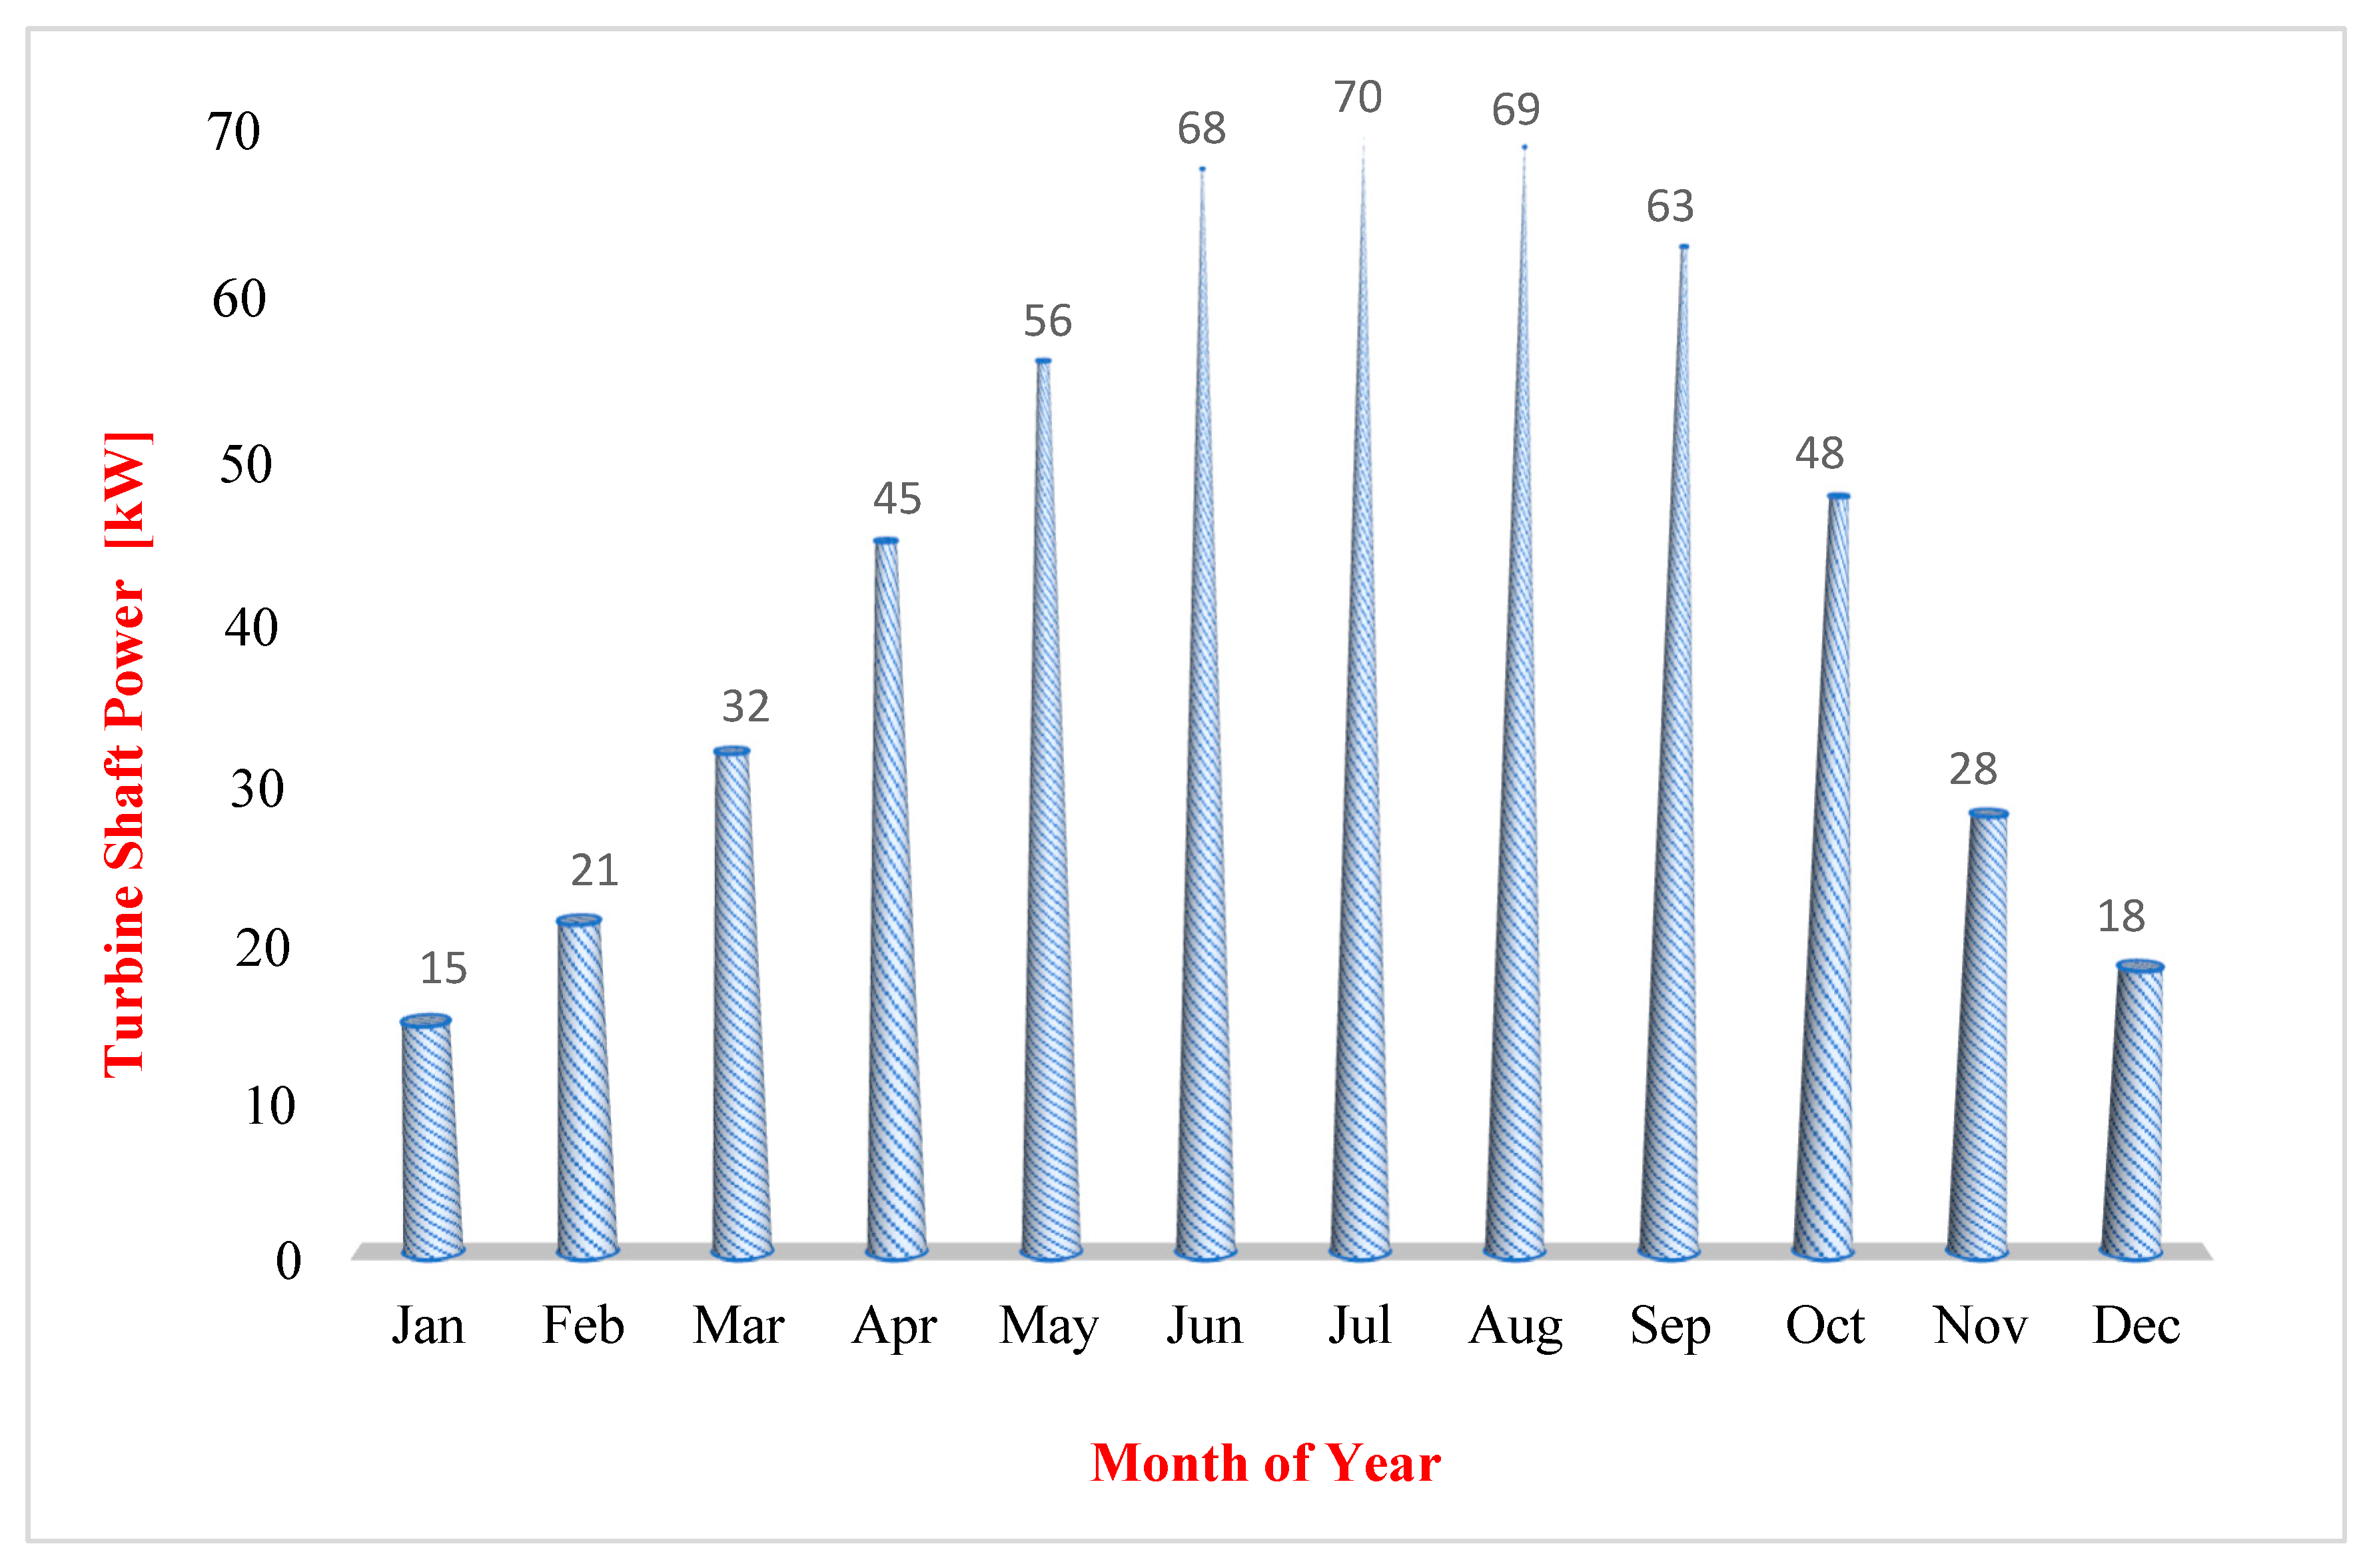
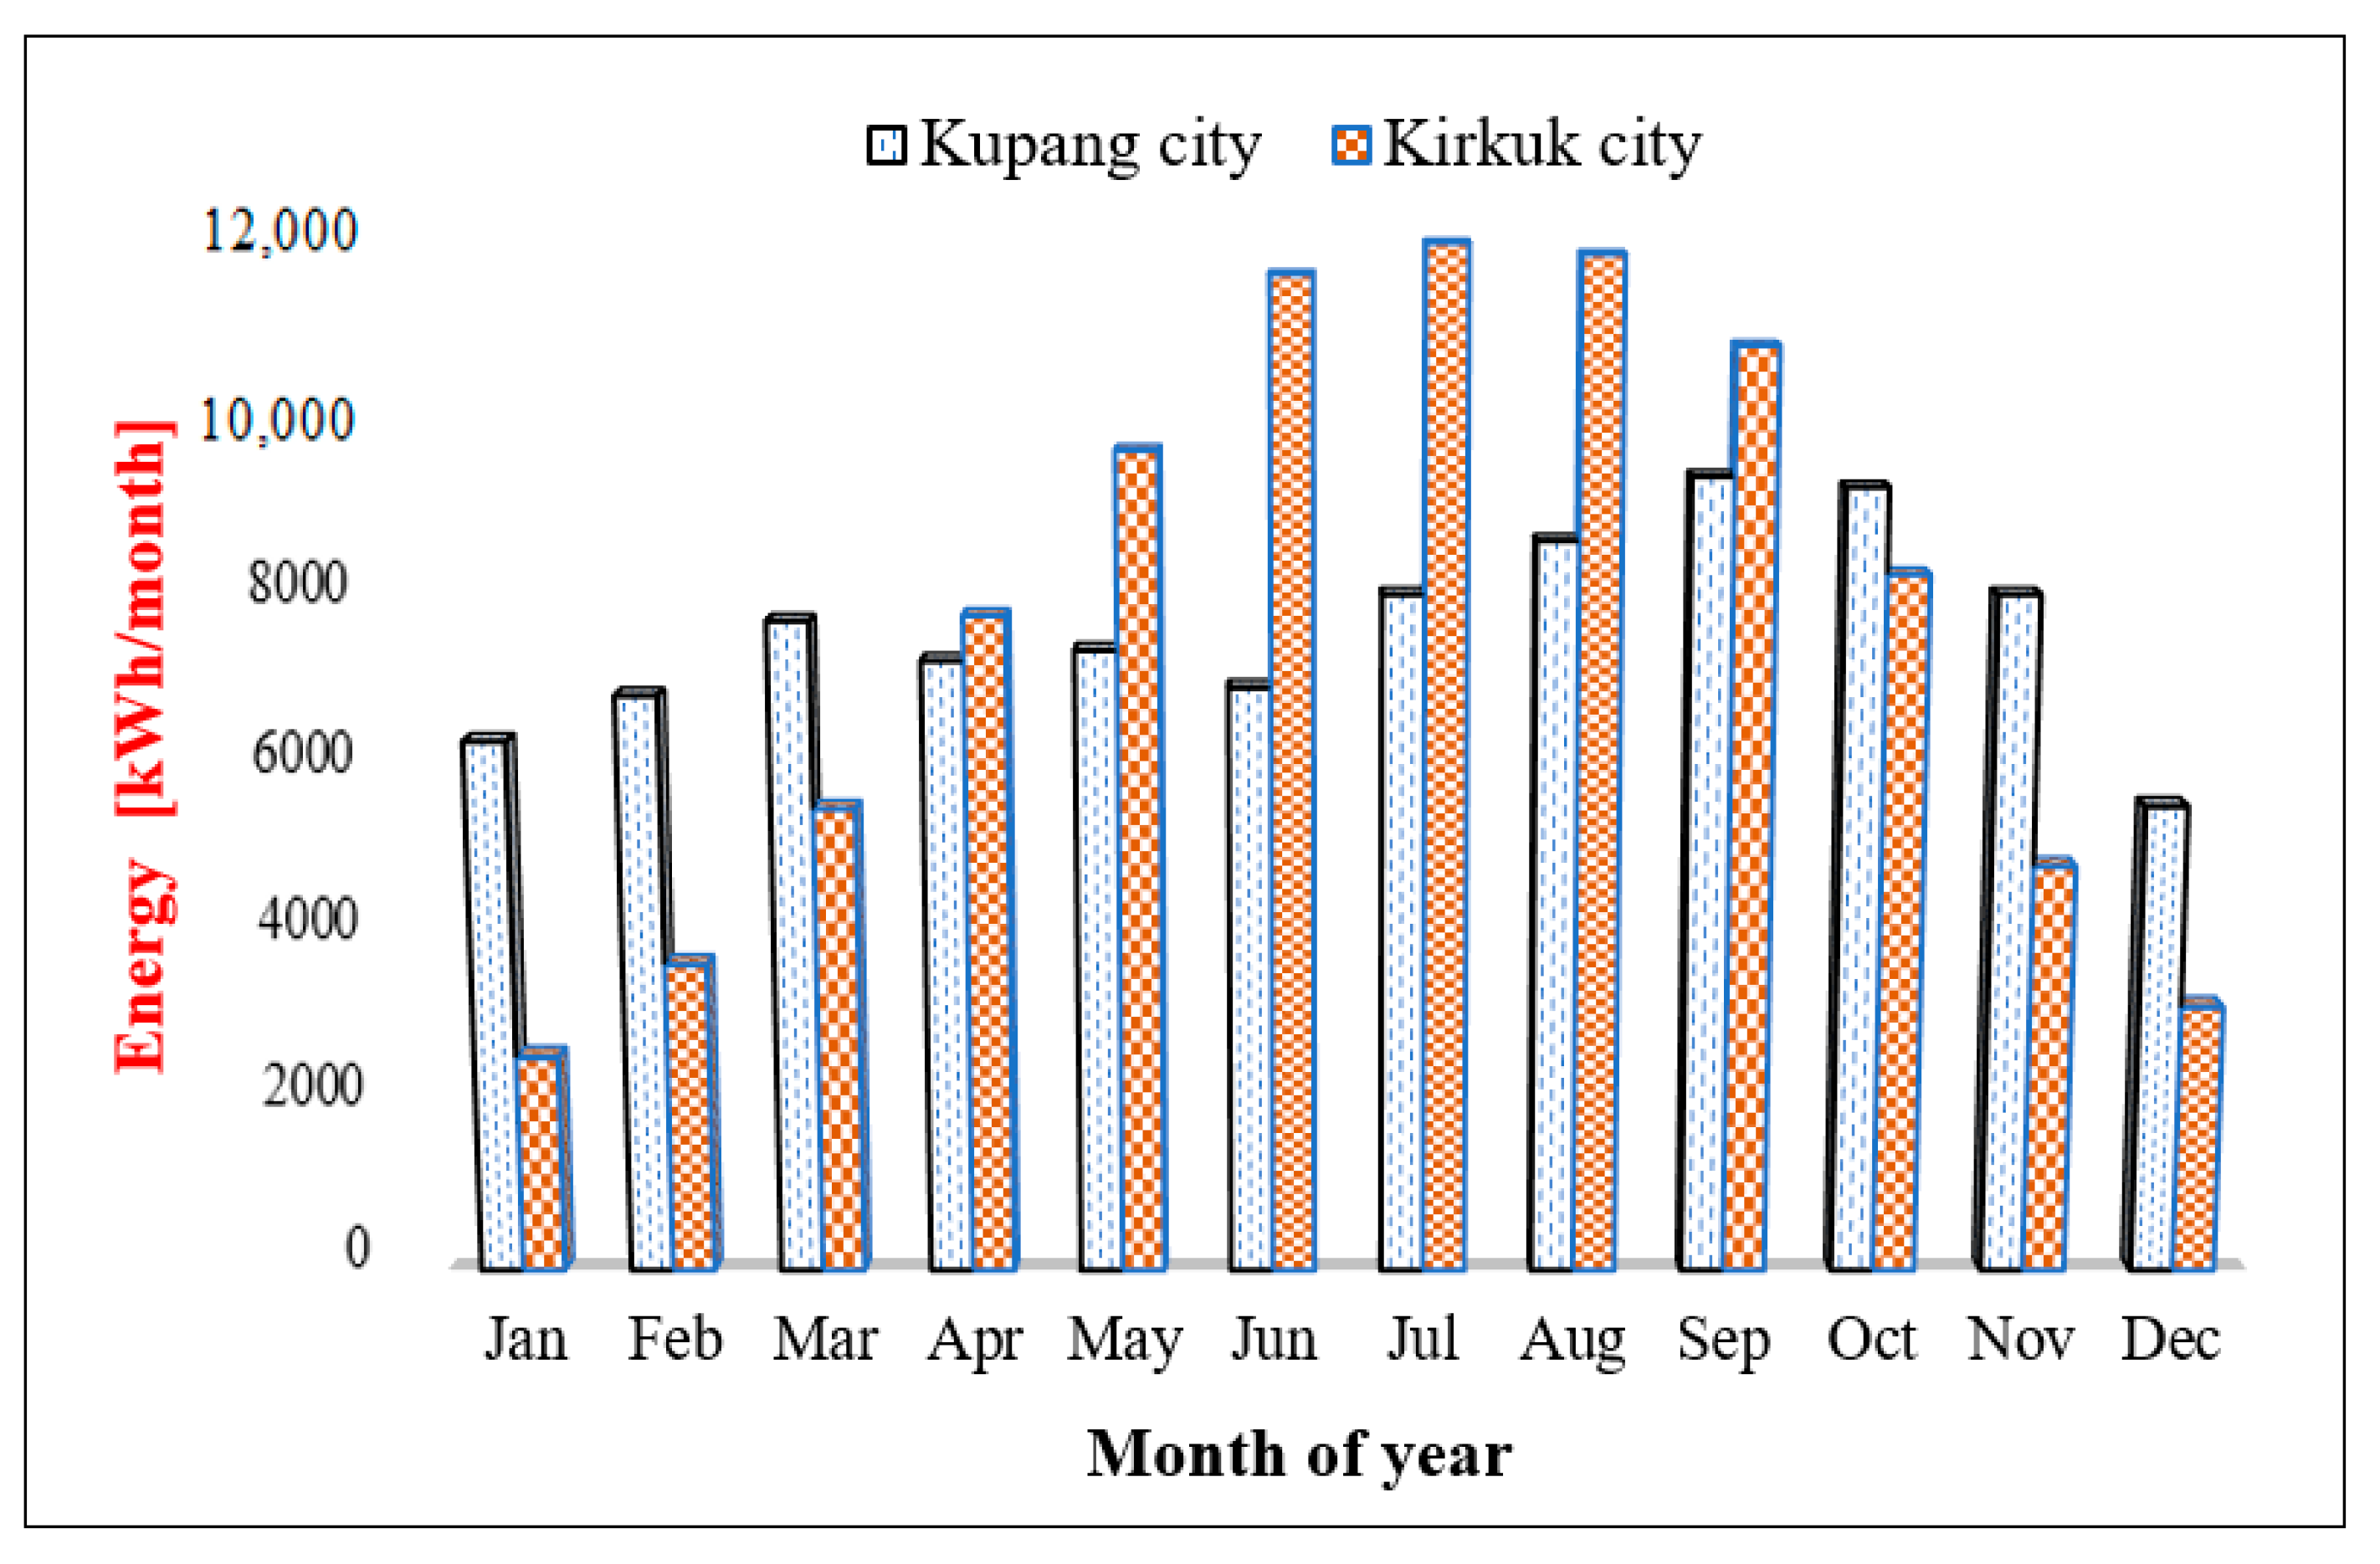
Actual turbine power. The actual power resulting from the wind turbine mounted at the chimney base is shown in Figure 17. The result is that the maximum usable power of the turbine is multiplied by the efficiency of the turbine, which is lower than the reversible power due to the nonideal efficiency of the turbine and the losses in the rotation shaft. The daily electrical energy generated by the wind turbine for all months is shown in Figure 18.
Figure 17. Actual power produced from the turbine for all months of the year.
Energies 14 05771 g017
Figure 18. Daily energy produced from the turbine for all months of the year.
Energies 14 05771 g018
A theoretical study was conducted by researchers Hafizh et al. [37] in Indonesia. They studied the performance of the solar chimney system in several cities and for each month and concluded that the city of Kubang is the best city to produce electricity from the solar chimney with the maximum daily production estimated at 304 kWh/day and the maximum monthly production estimated at 9120 kWh/month.
The average daily and monthly energy production values of Kubang, Indonesia and Kirkuk, Iraq (Current system) were compared and are presented in the Figure 19 and Figure 20, respectively. It is observed that the overall average daily and monthly energy production values for the Kirkuk system are higher than those of the Kubang system, with values of 310 kWh/day and 9314 kWh/month for the Kirkuk system, respectively, and 246 kWh/day and 7398 kWh/month for the Kubang system, respectively.

6. Conclusions

The solar chimney is one of the uninvestigated areas in the possible selection in the field of renewable solar energy utilization. CFD can be demonstrated to be a useful tool of figure confidence in the design and employment of a solar chimney. In this study, the performance of a solar chimney power plant was numerically investigated. A model of the solar chimney power plant was designed in a three-dimensional form using the ANSYS Fluent software by taking the real dimensions of the main system located in Manzanares, Spain. The simulation was conducted by taking into consideration the atmospheres of Kirkuk city in the north of Iraq as a case study. In this simulation, the different seasons of the year were studied. The following conclusions have been drawn from this research.
  • The numerical simulation in this examination gave a good agreement with results of the Manzanares power plant.
  • It was observed that the maximum temperature in the collector outlet was 329.05 K in summer in the month of July due to the high solar radiation and ambient temperature in this month.
  • The results also showed that the maximum air velocity at the turbine was graded according to the seasons of the year and it was observed as 18.28 m/s in July due to the high ambient temperature in this month.
  • The overall average daily and monthly energy production for the Kirkuk system were found to be 310 kWh/day and 9314 kWh/month, respectively.
  • The final and the most important yield required from this system was to check its productivity of electricity, and it was found that the electricity produced from the system of Kirkuk city varied to be a maximum of 14,424 kWh/month in July.

Author Contributions

H.A.Z.A.-b.: Methodology, Original drafting (corresponding author); S.H.D.: Validation, Analysis, Data Curation; I.H.: Methodology, Visualization, Review & Editing; D.V.: Review & Editing. All authors have read and agreed to the published version of the manuscript.

Funding

This research was funded by Universiti Kebangsaan Malaysia, grant number GP-2021-K006388.

Institutional Review Board Statement

Not applicable.

Informed Consent Statement

Not applicable.

Data Availability Statement

Not applicable.

Acknowledgments

We are grateful to the reviewers for comments that helped improve the quality of the paper. I.H. acknowledges the grant # from Universiti Kebangsaan Malaysia.

Conflicts of Interest

The authors declare no conflict of interest.

References

  1. Owusu, P.A.; Asumadu-Sarkodie, S. A review of renewable energy sources, sustainability issues and climate change mitigation. Cogent Eng. 2016, 3, 1167990. [Google Scholar] [CrossRef]
  2. Wang, H.; Yang, X.; Lou, Q.; Xu, X. Achieving a Sustainable Development Process by Deployment of Solar PV Power in ASEAN: A SWOT Analysis. Processes 2021, 9, 630. [Google Scholar] [CrossRef]
  3. Durganjali, C.S.; Bethanabhotla, S.; Kasina, S.; Radhika, S. Recent Developments and Future Advancements in Solar Panels Technology. J. Physics Conf. Ser. 2020, 1495, 012018. [Google Scholar] [CrossRef]
  4. Ahuja, D.; Tatsutani, M. Sustainable energy for developing countries. S.A.P.I.EN.S. Surv. Perspect. Integr. Environ. Soc. 2009, 2, 1. [Google Scholar]
  5. Dhahri, A.; Omri, A. A review of solar chimney power generation technology. Int. J. Eng. Adv. Technol. 2013, 2, 1–17. [Google Scholar] [CrossRef]
  6. Pasad, D. Solar Power; The Images Publishing Group Pty Ltd.: New York, NY, USA; Earthscan: London, UK, 2005. [Google Scholar]
  7. Bergermann Solar. Solar Updraft Tower; Schlaich Bergermann Solar GmbH: Stuttgart, Germany, 2011. [Google Scholar]
  8. von Backström, T.; Gannon, A. Solar chimney turbine characteristics. Sol. Energy 2004, 76, 235–241. [Google Scholar] [CrossRef]
  9. Kazem, H.A.; Chaichan, M.T. Status and future prospects of renewable energy in Iraq. Renew. Sustain. Energy Rev. 2012, 16, 6007–6012. [Google Scholar] [CrossRef]
  10. Gholamalizadeh, E.; Chung, J.D. Analysis of fluid flow and heat transfer on a solar updraft tower power plant coupled with a wind turbine using computational fluid dynamics. Appl. Therm. Eng. 2017, 126, 548–558. [Google Scholar] [CrossRef]
  11. Bouabidi, A.; Nasraoui, H.; Ayadi, A.; Driss, Z.; Abid, M.S. Numerical analysis of chimney diameter effect on the fluid flow and the heat transfer characteristics within the solar tower. Energy Sources Part A Recover. Util. Environ. Eff. 2019, 41, 2494–2506. [Google Scholar] [CrossRef]
  12. Rabehi, R.; Chaker, A.; Aouachria, Z.; Tingzhen, M. CFD analysis on the performance of a solar chimney power plant system: Case study in Algeria. Int. J. Green Energy 2017, 14, 971–982. [Google Scholar] [CrossRef]
  13. Ismail, A.; Hamed, A.M.; Hussin, A.M.T.A.E. Numerical modeling for a solar chimney. J. Al-Azhar Univ. Eng. Sect. 2019, 14, 87–98. [Google Scholar] [CrossRef] [Green Version]
  14. Djaouida, B.; Aouachria, Z.; Benmachiche, A.H.; Ali, S. Controlling power output of solar chimney power plant according to demand. Int. J. Ambient. Energy 2018, 41, 1467–1481. [Google Scholar] [CrossRef]
  15. Hassan, A.; Ali, M.; Waqas, A. Numerical investigation on performance of solar chimney power plant by varying collector slope and chimney diverging angle. Energy 2018, 142, 411–425. [Google Scholar] [CrossRef]
  16. Guo, P.; Li, J.-Y.; Wang, Y. Numerical simulations of solar chimney power plant with radiation model. Renew. Energy 2014, 62, 24–30. [Google Scholar] [CrossRef]
  17. Das, P.; Chandramohan, V.P. CFD analysis on flow and performance parameters estimation of solar updraft tower (SUT) plant varying its geometrical configurations. Energy Sources Part A Recover. Util. Environ. Eff. 2018, 40, 1532–1546. [Google Scholar] [CrossRef]
  18. Zuo, L.; Dai, P.; Yan, Z.; Li, C.; Zheng, Y.; Ge, Y. Design and optimization of turbine for solar chimney power plant based on lifting design method of axial-flow hydraulic turbine impeller. Renew. Energy 2021, 171, 799–811. [Google Scholar] [CrossRef]
  19. De_Richter, R.; Ming, T.; Davies, P.; Liu, W.; Caillol, S. Removal of non-CO2 greenhouse gases by large-scale atmospheric solar photocatalysis. Prog. Energy Combust. Sci. 2017, 60, 68–96. [Google Scholar] [CrossRef]
  20. dos Santos Bernardes, M.A. Solar chimney power plants–developments and advancements. Sol. Energy 2010, 84, 953–978. [Google Scholar] [CrossRef] [Green Version]
  21. Chikere, A.O.; Al-Kayiem, H.H.; Karim, Z.A.A. Review on the Enhancement Techniques and Introduction of an Alternate Enhancement Technique of Solar Chimney Power Plant. J. Appl. Sci. 2011, 11, 1877–1884. [Google Scholar] [CrossRef] [Green Version]
  22. Esmail, M.F.; A-Elmagid, W.; Mekhail, T.; Al-Helal, I.; Shady, M. A numerical comparative study of axial flow turbines for solar chimney power plant. Case Stud. Therm. Eng. 2021, 26, 101046. [Google Scholar] [CrossRef]
  23. Zuo, L.; Liu, Z.; Dai, P.; Qu, N.; Ding, L.; Zheng, Y.; Ge, Y. Economic performance evaluation of the wind supercharging solar chimney power plant combining desalination and waste heat after parameter optimization. Energy 2021, 227, 120496. [Google Scholar] [CrossRef]
  24. Setareh, M. Comprehensive mathematical study on solar chimney powerplant. Renew. Energy 2021, 175, 470–485. [Google Scholar] [CrossRef]
  25. Singh, A.P.; Kumar, A.; Singh, O. A novel concept of integrating bell-mouth inlet in converging-diverging solar chimney power plant. Renew. Energy 2020, 169, 318–334. [Google Scholar] [CrossRef]
  26. Torabi, R.M.; Hosseini, M.; Akbari, O.A.; Afrouzi, H.H.; Toghraie, D.; Kashani, A.; Alizadeh, A. Investigation the performance of solar chimney power plant for improving the efficiency and increasing the outlet power of turbines using computational fluid dynamics. Energy Rep. 2021, 7, 4555–4565. [Google Scholar] [CrossRef]
  27. Semai, H.; Bouhdjar, A. Effect of slope tower angle and thermal storage media on flexibility solar chimney power plant performance. Environ. Prog. Sustain. Energy 2021, e13646. [Google Scholar] [CrossRef]
  28. Cuce, E.; Saxena, A.; Cuce, P.M.; Sen, H.; Guo, S.; Sudhakar, K. Performance assessment of solar chimney power plants with the impacts of divergent and convergent chimney geometry. Int. J. Low-Carbon Technol. 2021, ctaa097. [Google Scholar] [CrossRef]
  29. Ali, S.; Djaouida, B.; Benmachiche, A.H.; Aouachria, Z. Performance analysis of a solar chimney power plant system in two Algeria regions. Int. J. Ambient. Energy 2021, 1–12. [Google Scholar] [CrossRef]
  30. Semai, H.; Bouhdjar, A. Impact of the chimney geometry on the power output of solar chimney power plant. Thermophys. Aeromechanics 2021, 28, 291–303. [Google Scholar] [CrossRef]
  31. Wang, H.; Chen, J.; Dai, P.; Zhang, F.; Li, Q. Simulation and Experimental Study of the Influence of the Baffles on Solar Chimney Power Plant System. Processes 2021, 9, 902. [Google Scholar] [CrossRef]
  32. Arzpeyma, M.; Mekhilef, S.; Newaz, K.M.S.; Horan, B.; Seyedmahmoudian, M.; Akram, N.; Stojcevski, A.; Alnaimat, F.; Mathew, B. Numerical simulation of the effect of chimney configuration on the performance of a solar chimney power plant. J. Therm. Anal. Calorim. 2021, 1–15. [Google Scholar] [CrossRef]
  33. Guo, P.; Li, J.; Wang, Y.; Wang, Y. Numerical study on the performance of a solar chimney power plant. Energy Convers. Manag. 2015, 105, 197–205. [Google Scholar] [CrossRef]
  34. Ming, T.; Liu, W.; Pan, Y.; Xu, G. Numerical analysis of flow and heat transfer characteristics in solar chimney power plants with energy storage layer. Energy Convers. Manag. 2008, 49, 2872–2879. [Google Scholar] [CrossRef]
  35. Haaf, W. Solar Chimneys: Part II: Preliminary Test Results from the Manzanares Pilot Plant. Int. J. Sol. Energy 1984, 2, 141–161. [Google Scholar] [CrossRef]
  36. Huld, T.; Šúri, M.; Dunlop, E.; Albuisson, M.; Wald, L. Integration of HelioClim-1 database into PVGIS to estimate solar electricity potential in Africa. In Proceedings of the 20th European Photovoltaic Solar Energy Conference and Exhibition, Barcelona, Spain, 6–10 June 2005; pp. 2989–2992. [Google Scholar]
  37. Hafizh, H.; Shirato, H.; Yui, D. Performance Analysis of Solar Updraft Power Generator in Indonesia. KnE Eng. 2016, 1, 1–6. [Google Scholar] [CrossRef] [Green Version]
Figure 1. Schematic of the solar updraft tower.
Energies 14 05771 g001
Figure 2. Meshing for the following zones: (a) wind turbine, (b) transition region, and (c) whole system.
Energies 14 05771 g002
Figure 3. Temperature distribution within the collector for Manzanares conditions.
Energies 14 05771 g003
Figure 4. Solar radiation for all months of the year.
Energies 14 05771 g004
Figure 5. Ambient temperature for all months of the year.
Energies 14 05771 g005
Figure 6. Solar heat flux for all months of the year.
Energies 14 05771 g006
Figure 7. Velocity along chimney diameter for all months of the year.
Energies 14 05771 g007
Figure 8. Average velocity along chimney diameter for all months of the year.
Energies 14 05771 g008
Figure 9. Temperature along collector diameter for all months of the year.
Energies 14 05771 g009
Figure 10. Average temperature along collector diameter for all months of the year.
Energies 14 05771 g010
Figure 11. Average temperature along chimney height for all months of the year.
Energies 14 05771 g011
Figure 12. Average velocity along chimney height for all months of the year.
Energies 14 05771 g012
Figure 13. Velocity distribution along collector diameter for all months of the year.
Energies 14 05771 g013
Figure 14. Average velocity along collector diameter for all months of the year.
Energies 14 05771 g014
Figure 15. Reversible power available at the turbine for all months of the year.
Energies 14 05771 g015
Figure 16. Daily energy produced at the turbine for all months of the year.
Energies 14 05771 g016
Figure 19. Daily energy produced for Kupang city and this study.
Energies 14 05771 g019
Figure 20. Monthly energy produced for Kupang city and this study.
Energies 14 05771 g020
Table 1. Parameters of the blade profile (adapted with permission from Ref. [10], Copyright 2017, Elsevier).
r/RTwist Angle (Degree)Chord (m)
0.2113.71910.4682
0.2511.46650.4245
0.38.78140.3646
0.357.17990.3412
0.415.14630.3154
0.444.32470.3081
0.483.28730.2851
0.522.46660.27
0.581.55990.2525
0.610.99930.2411
0.660.43890.2296
0.7−0.03450.216
0.74−0.33440.2035
0.8−0.71960.1848
0.87−1.23460.1687
0.94−1.66240.147
1−2.13450.1299
Table 2. Boundary conditions of the simulation.
LocationTypeValue
Collector entrancePressure inletPgage = 0 Pa, Ta = 293 K
Collector outer surfaceWall (Glass)h = 10W/(m2.K), Ta = 293K,
Tsky = 0.0552 Ta1.5
Ground outer surfaceWall(Soil), Modelled as Opaque surfaceK = 1.83 (W/m-K) Cp = 2200 (J/kg-K), ρ = 1900 (kg/m3)
Ground inner surfaceWall(Soil), Modelled as Opaque surfaceK = 1.83 (W/m-K) Cp = 2200 (J/kg-K), ρ = 1900 (kg/m3)
Chimney wallWallAdiabatic
Chimney outletPressure outletPgage = 0 Pa
Turbine rotationFrame Motionω = 100 RPM
Table 3. Comparison between numerical simulation of Ref. [35] and present work.
At Solar Radiation of 850 W/m2Present ResultsRef. [35]Error (%)
Pressure Drop at Turbine (Pa)81.5801.87
Air Velocity at Turbine (m/s)98.82.2
Collector Outlet Temperature (K)310.15310.500.12
Publisher’s Note: MDPI stays neutral with regard to jurisdictional claims in published maps and institutional affiliations.

