Abstract
In Poland, a dynamic increase in the share of renewable energy sources in the national energy mix has been observed in recent years. Until now, these were mainly installations used for the needs of single-family houses and large-scale installations used on the RES auction market. However, due to the fact that the carbon footprint of the offered products is taken into account, this aspect is becoming more and more important. The carbon footprint can be offset by, among others, by covering the energy needs of the industrial plant by its own renewable energy sources. The article analyzes four sample electricity demand profiles of production plants operating in the mining industry, mainly located in Upper Silesia. Using statistical methods, the fitting of potential photovoltaic sources production profiles to the electricity consumption profiles in the analyzed case studies was checked. The analysis was carried out for each hour of the day and for the profiles weighted by the electricity price from the Polish Power Exchange on the Day-Ahead Market, because matching profiles at different hours has a different monetary value and, as a result, a different impact on operation costs. The highest correlation coefficient between electricity consumption and insolation on an annual basis was −0.29 in the Spearman rho-statistic for the case of M1 enterprise. On the other hand, the highest value at the level of 0.48 was achieved by the Pearson r-correlation coefficient determined on a monthly basis between the monetary value of electricity consumed and insolation in June for the M2 enterprise.
1. Introduction
The result of activities related to the implementation of the adopted climate provisions, such as the Kyoto Protocol, the Paris Agreement or the European Green Deal, is the global trend of decarbonization and an increase in the share of renewable energy sources in the energy mix [1,2]. The energy transformation most visible in the household and transport sector is equally dynamic in industry and, especially, in energy-intensive sectors (metallurgy, mining and cement production). One of the areas of activity, apart from technological changes aimed directly at improving energy efficiency, is increasing the share of renewable energy in the electrification of industrial plants [3]. In the context of the EU climate policy, this course of action should be considered favorable for the implementation of the adopted provisions. It could be perceived as the effective way to meet rising climate policymakers’ ambitions by reaching each EU country’s goal in share of renewable energy sources in electricity generation. At the same time, it creates a margin of independence for enterprises in the face of the expected further increase in electricity prices, especially in view of the recently observed drastic increase in the prices of CO2 emission allowances (Figure 1). In many sectors, the image-related issue of the carbon footprint is also gaining importance, which additionally creates conditions for an efficient transformation towards a zero-emission economy. In addition to economic benefits, the use of renewable energy sources—in particular, PV—in order to cover one’s own energy needs, may bring measurable environmental benefits by limiting the peak demand in the power grid [4], covered in Polish conditions by generation from conventional sources [5].
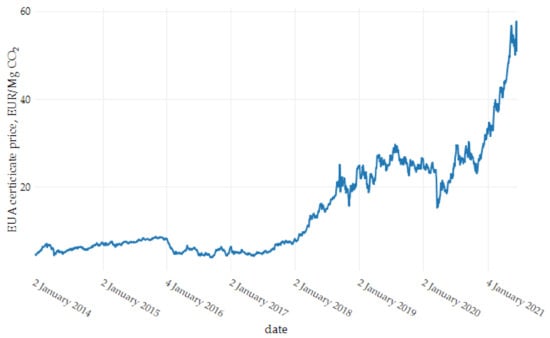
Figure 1.
EUA certificate prices in 2014–2021 [6].
This is particularly important for the energy transformation of countries such as Poland, whose energy mix is based on conventional sources powered mainly by solid fuels. Poland is characterized by average values of insolation in Europe, which, depending on the region, range from 900 to 1150 kWh/m2/year (in relation to a Typical Meteorological Year) [7].
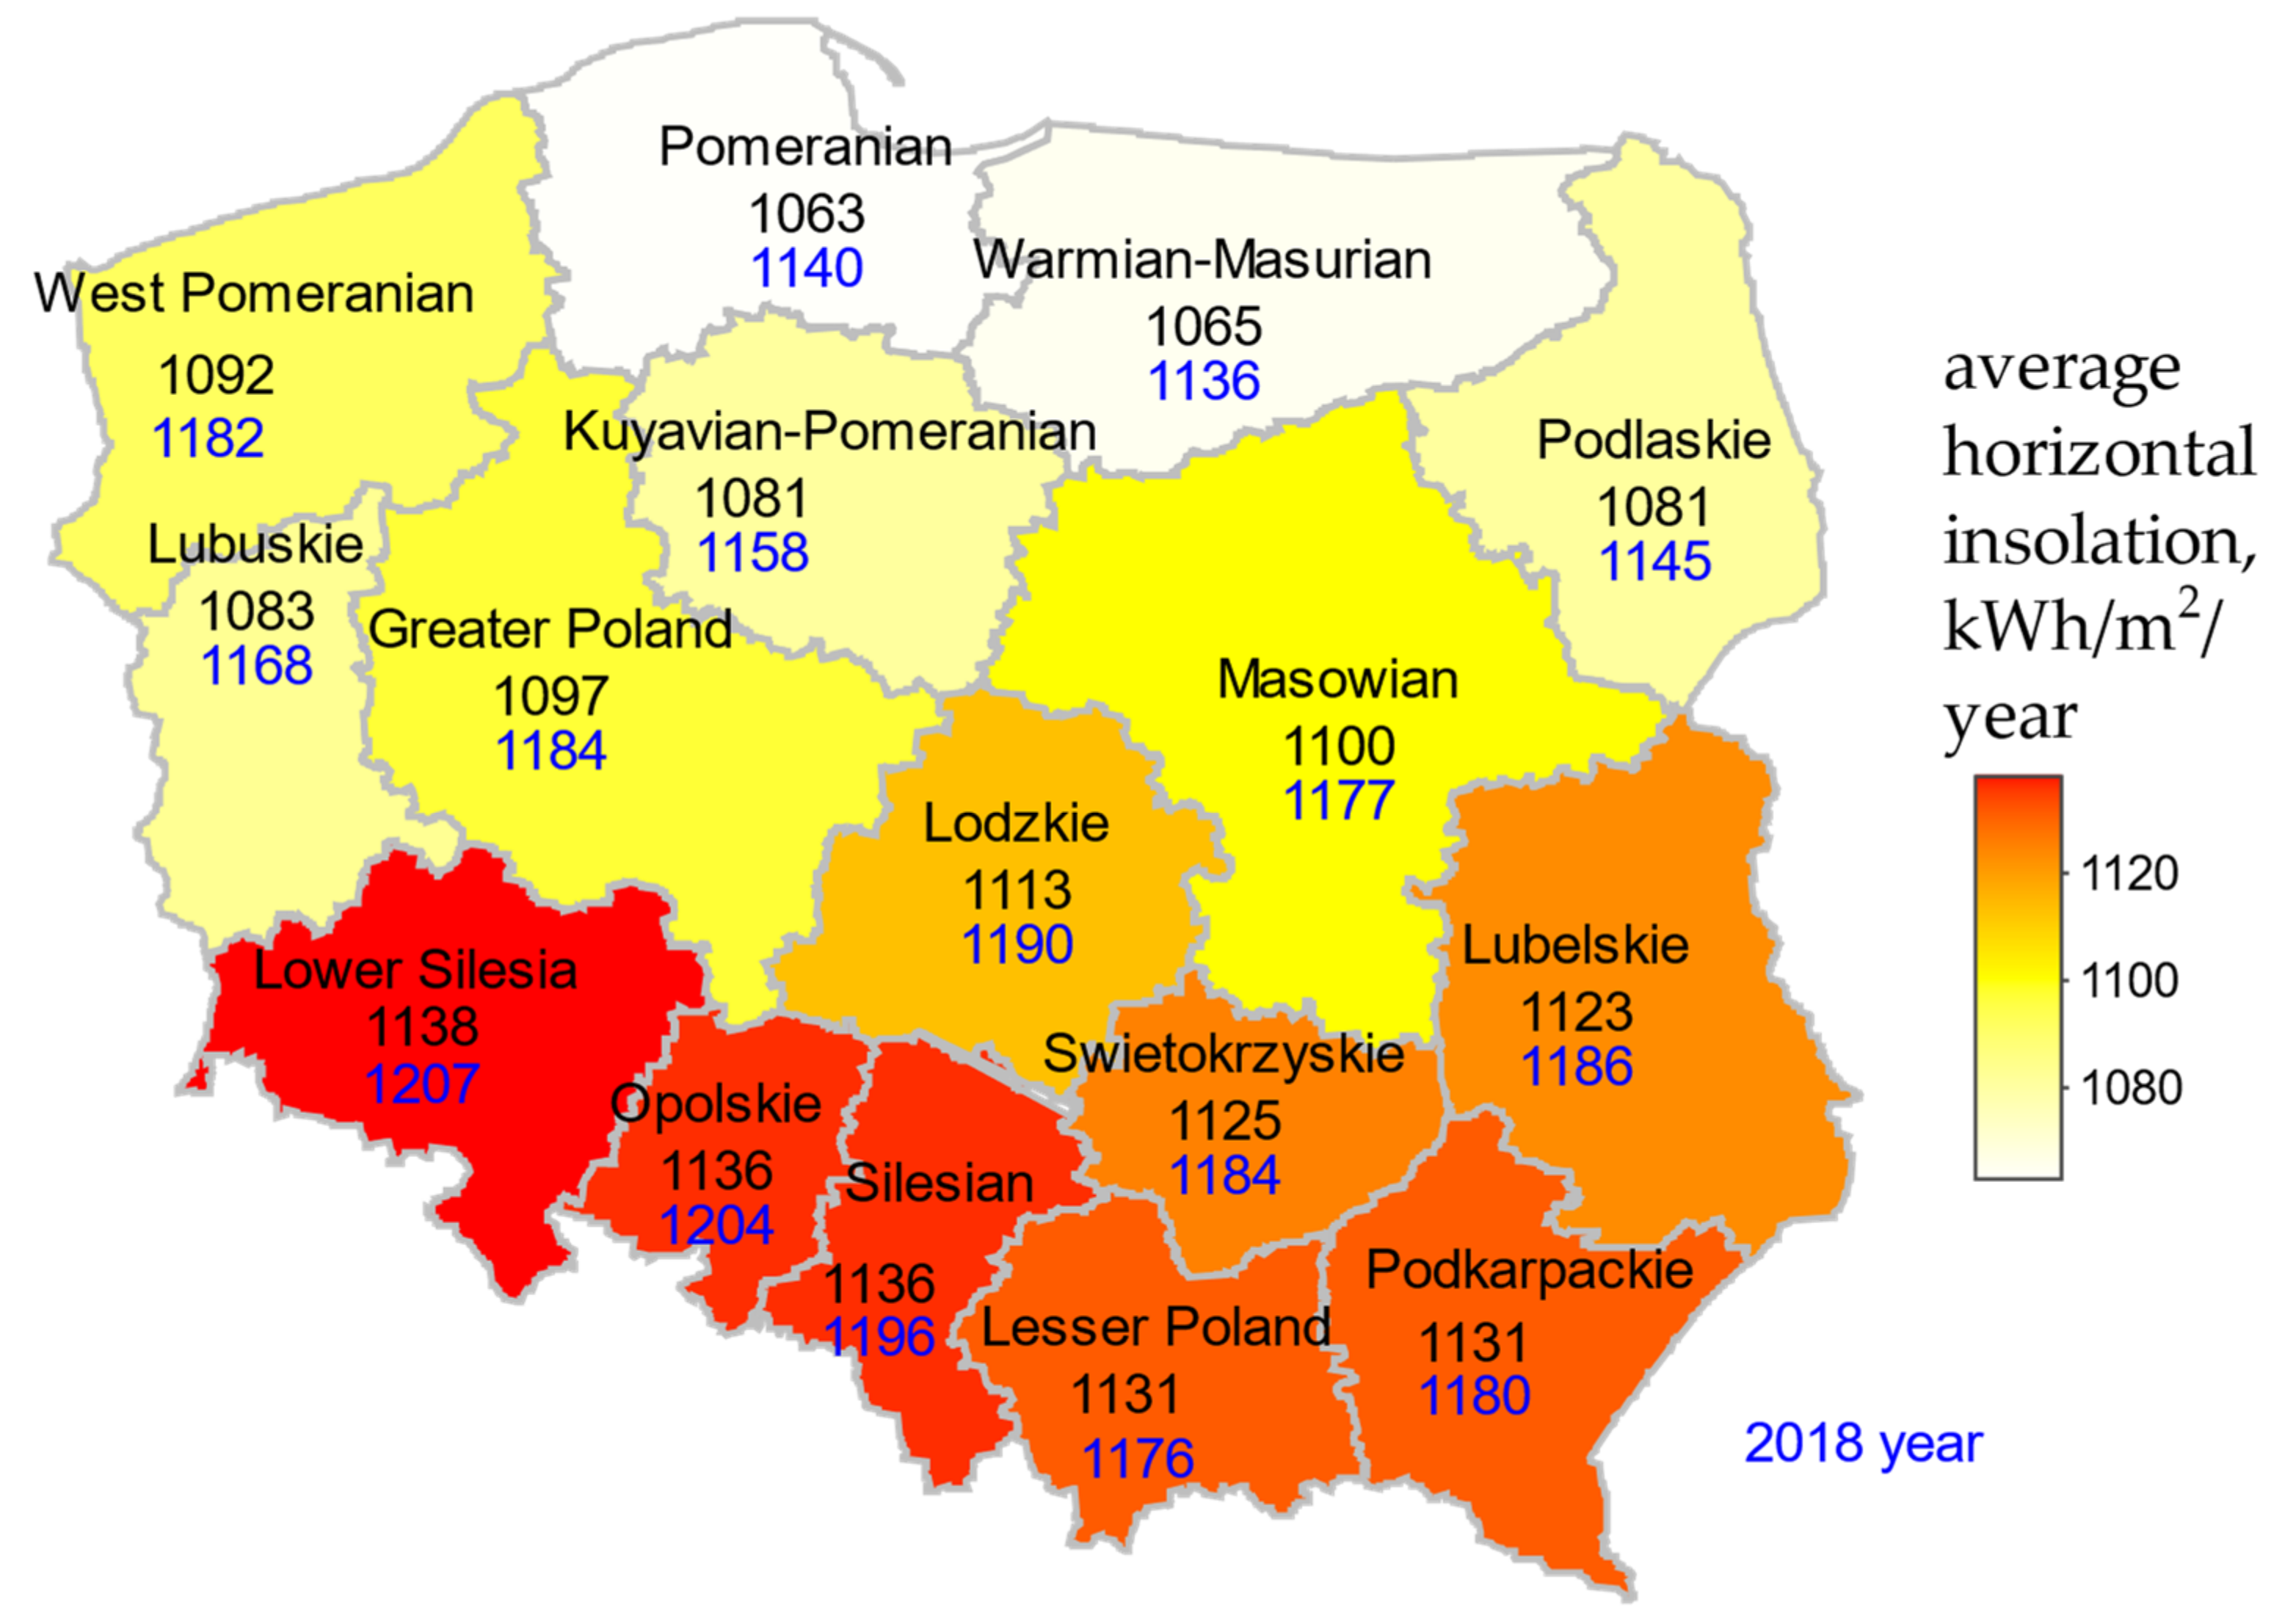
Technological advances in RES stimulates a decrease in capital expenditures. The current technology installation of renewable energy sources is less expensive than systems based on fossil fuels [8,9,10]. The largest decline in capital expenditures was recorded for PV solutions, which amounted to 82% in 2010–2019 [10]. PV sources have the greatest potential for replacing high-emission conventional sources. The diversity of insolation indicates a higher potential for the development of photovoltaics in the southern part of the country, where there are natural conditions conducive to achieving a higher productivity and economic efficiency of PV installations. The annual insolation values (based on the Era 5 Land website) in individual voivodships are presented in Figure 2.

Figure 2.
Horizontal insolation in Poland (for horizontal surfaces) for years: 2010–2019 (numbers in black) and 2018 (numbers in blue). Source: References [11,12].
However, despite the dynamic increase in the share of renewable energy sources in electricity generation, they are subject to limitations related to the dependence of their operating parameters on weather conditions (insolation, ambient temperature, wind speed, cloudiness, etc.) [13,14,15]. These restrictions imply from the point of view of the operator of the transmission network challenges of balancing demand and supply of energy from renewable sources unstable. On the one hand, this means the need for the effective cooperation of renewable energy sources with energy storage technologies [16,17]. However, their general availability and ability to solve the current problems of transmission network operators is, as of now, limited due to the required capital expenditures. Technological developments of energy storage solutions should gain progress. It seems to be crucial for increasing their affordability. On the other hand, RES weather limitations create challenges for network operators to maintain stable operating parameters of the transmission and distribution networks [18,19]. The need to maintain stability and modernization of the energy networks is particularly important due to the distributed nature of these sources. In order to prevent the generation of disturbances in the grid, sources such as PV installations should be balanced directly at the point of consumption of the energy they produce (households, housing cooperatives and enterprises) [20,21,22,23]. While the energy produced in the micro-installation will be consumed on an ongoing basis, in the case of the construction of PV installations with significant power, for the own needs of industrial recipients such as a mining plant, this consistency becomes particularly important. In view of the adopted climate obligations, hard coal mining in Poland will end before 2050, i.e., after the typical lifetime of PV installations (approx. 25–30 years) [22]. However, even with a drastic tightening of the climate policy, potential PV installations used for the needs of existing mining plants can supply electricity to mine water drainage and treatment stations, reducing the costs incurred after the mines’ closure [24].
This article analyzes four samples of electricity demand profiles of enterprises operating in the mining industry, located mainly in Upper Silesia. Using statistical methods, the matching of potential RES production profiles to the electricity consumption profiles in the analyzed case studies was examined.
The research was carried out in the RStudio® (RStudio: Boston, MA, USA) environment on hourly data from 2018 on electricity consumption (Figure 3 and Figure 4), electricity prices on the Day-Ahead Market in the Polish Power Exchange (Figure 5) and insolation (Figure 6).

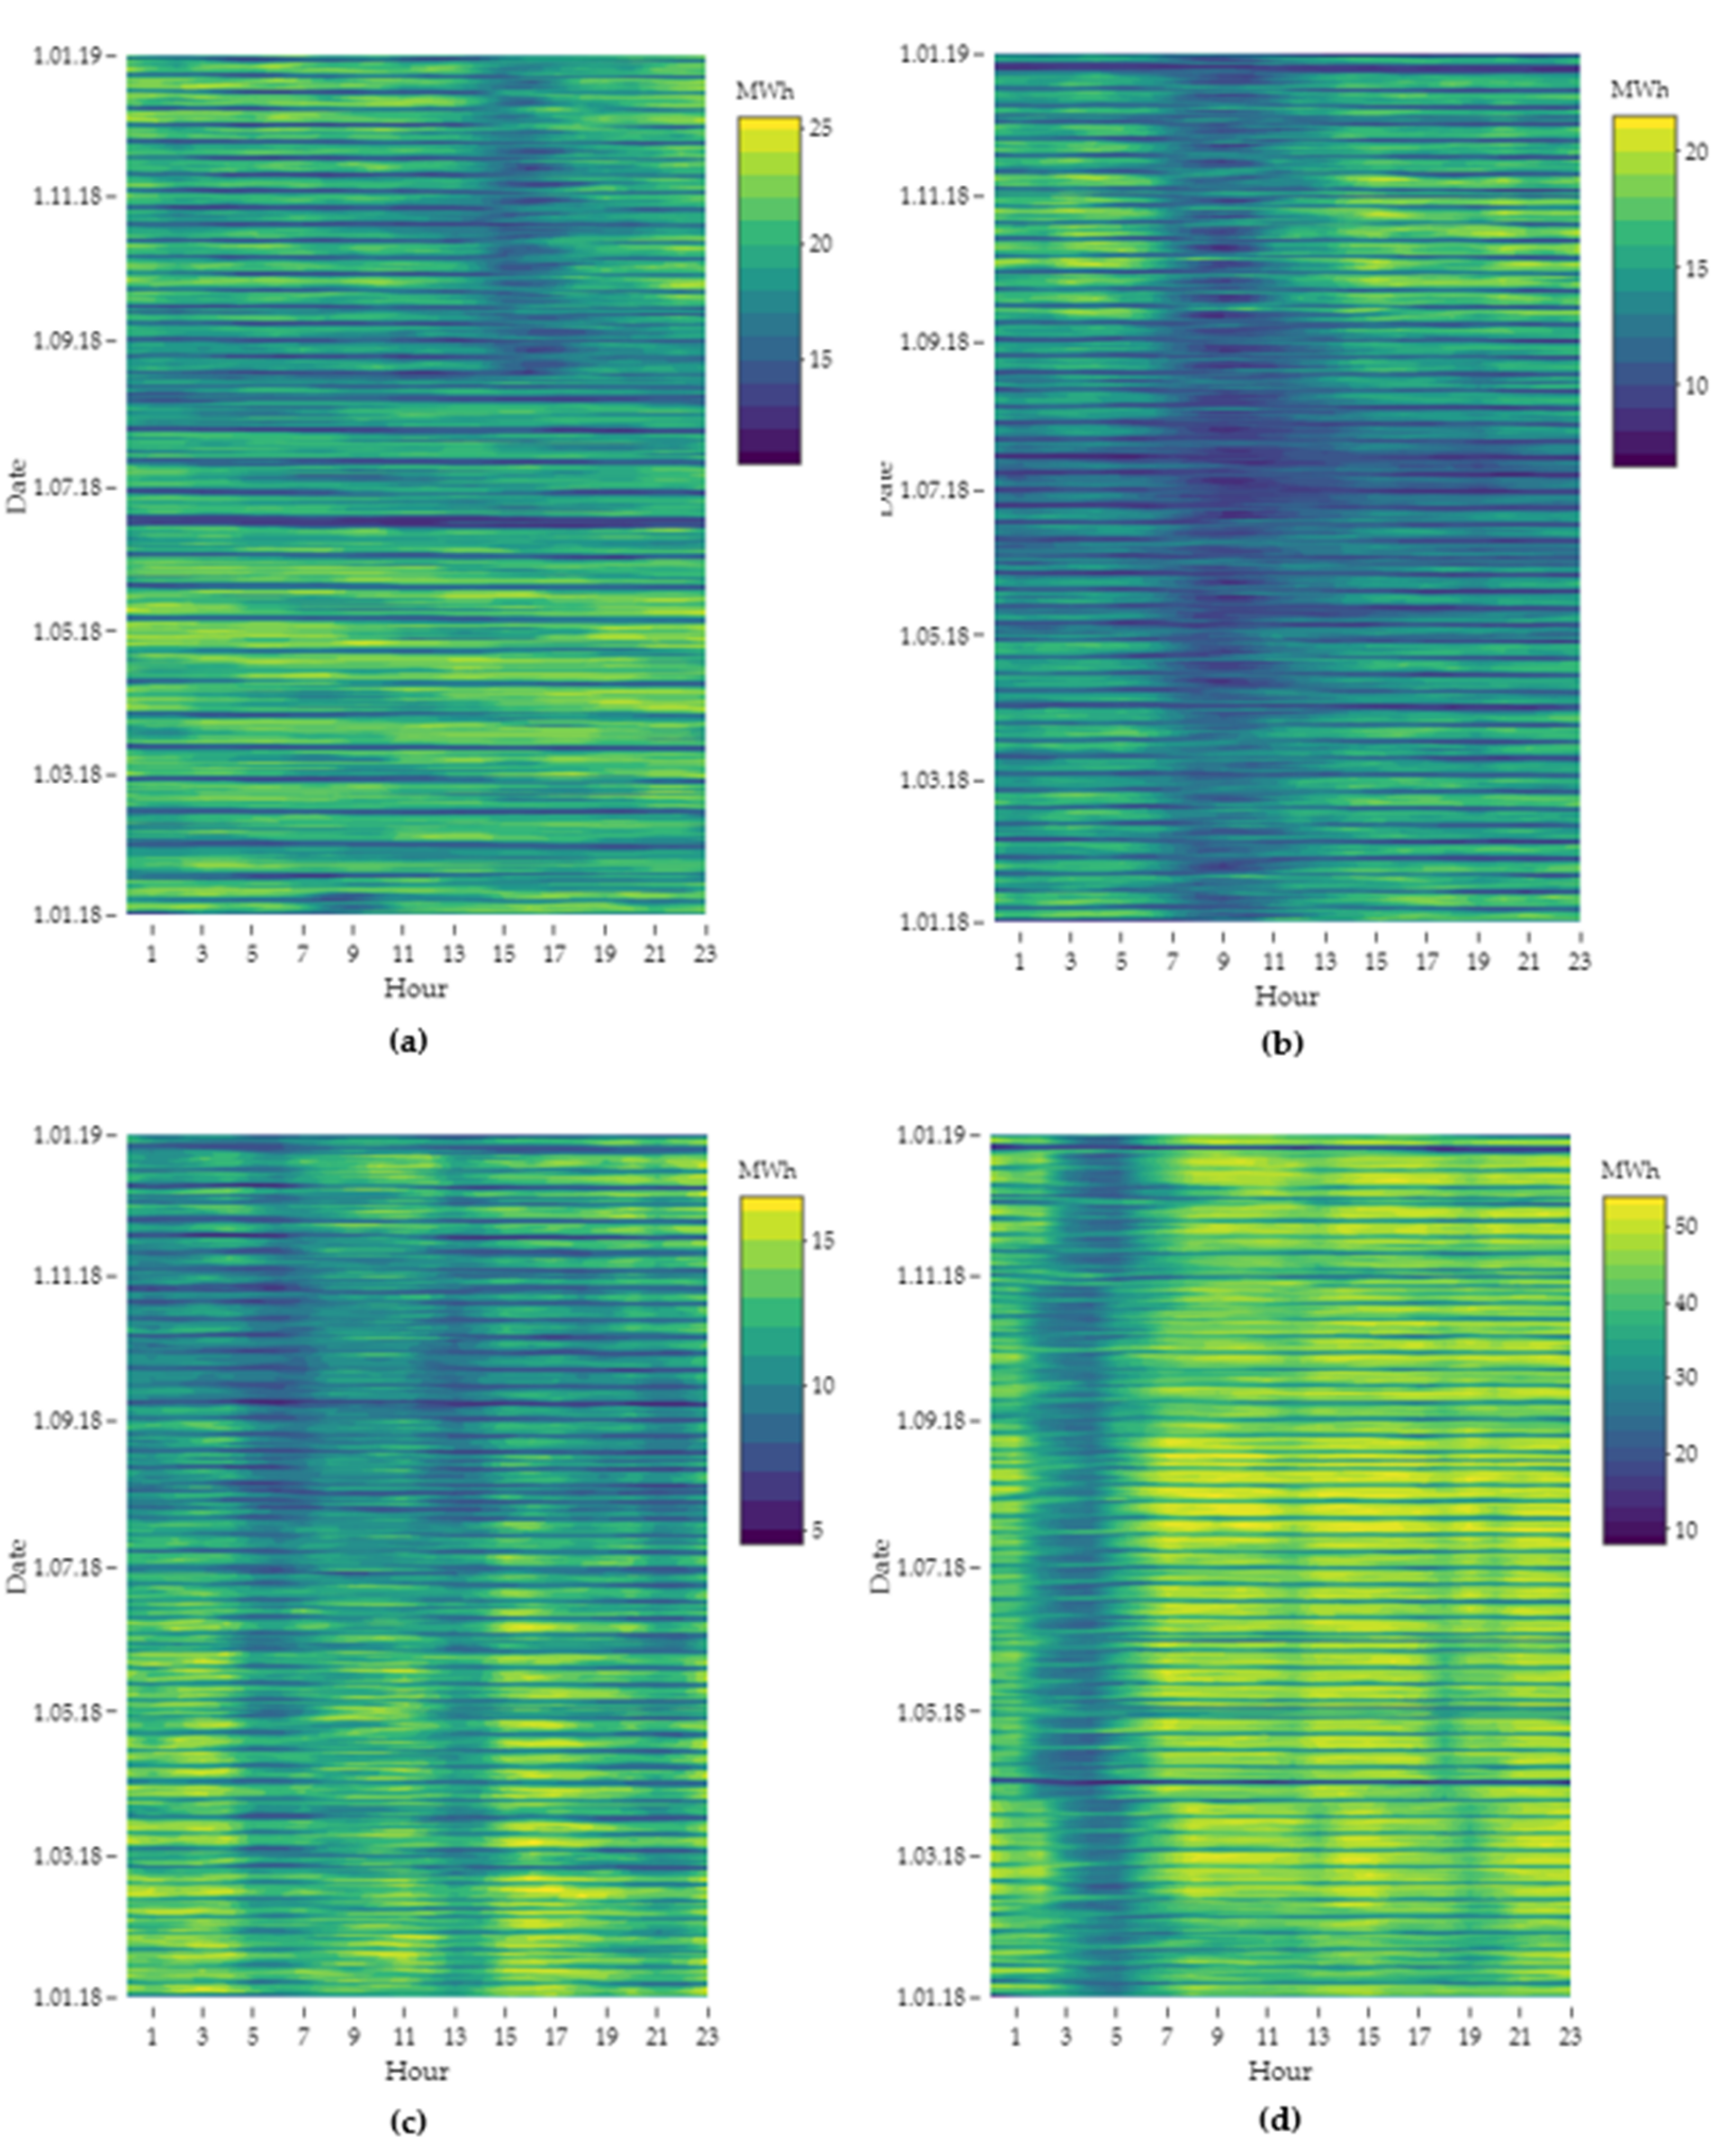
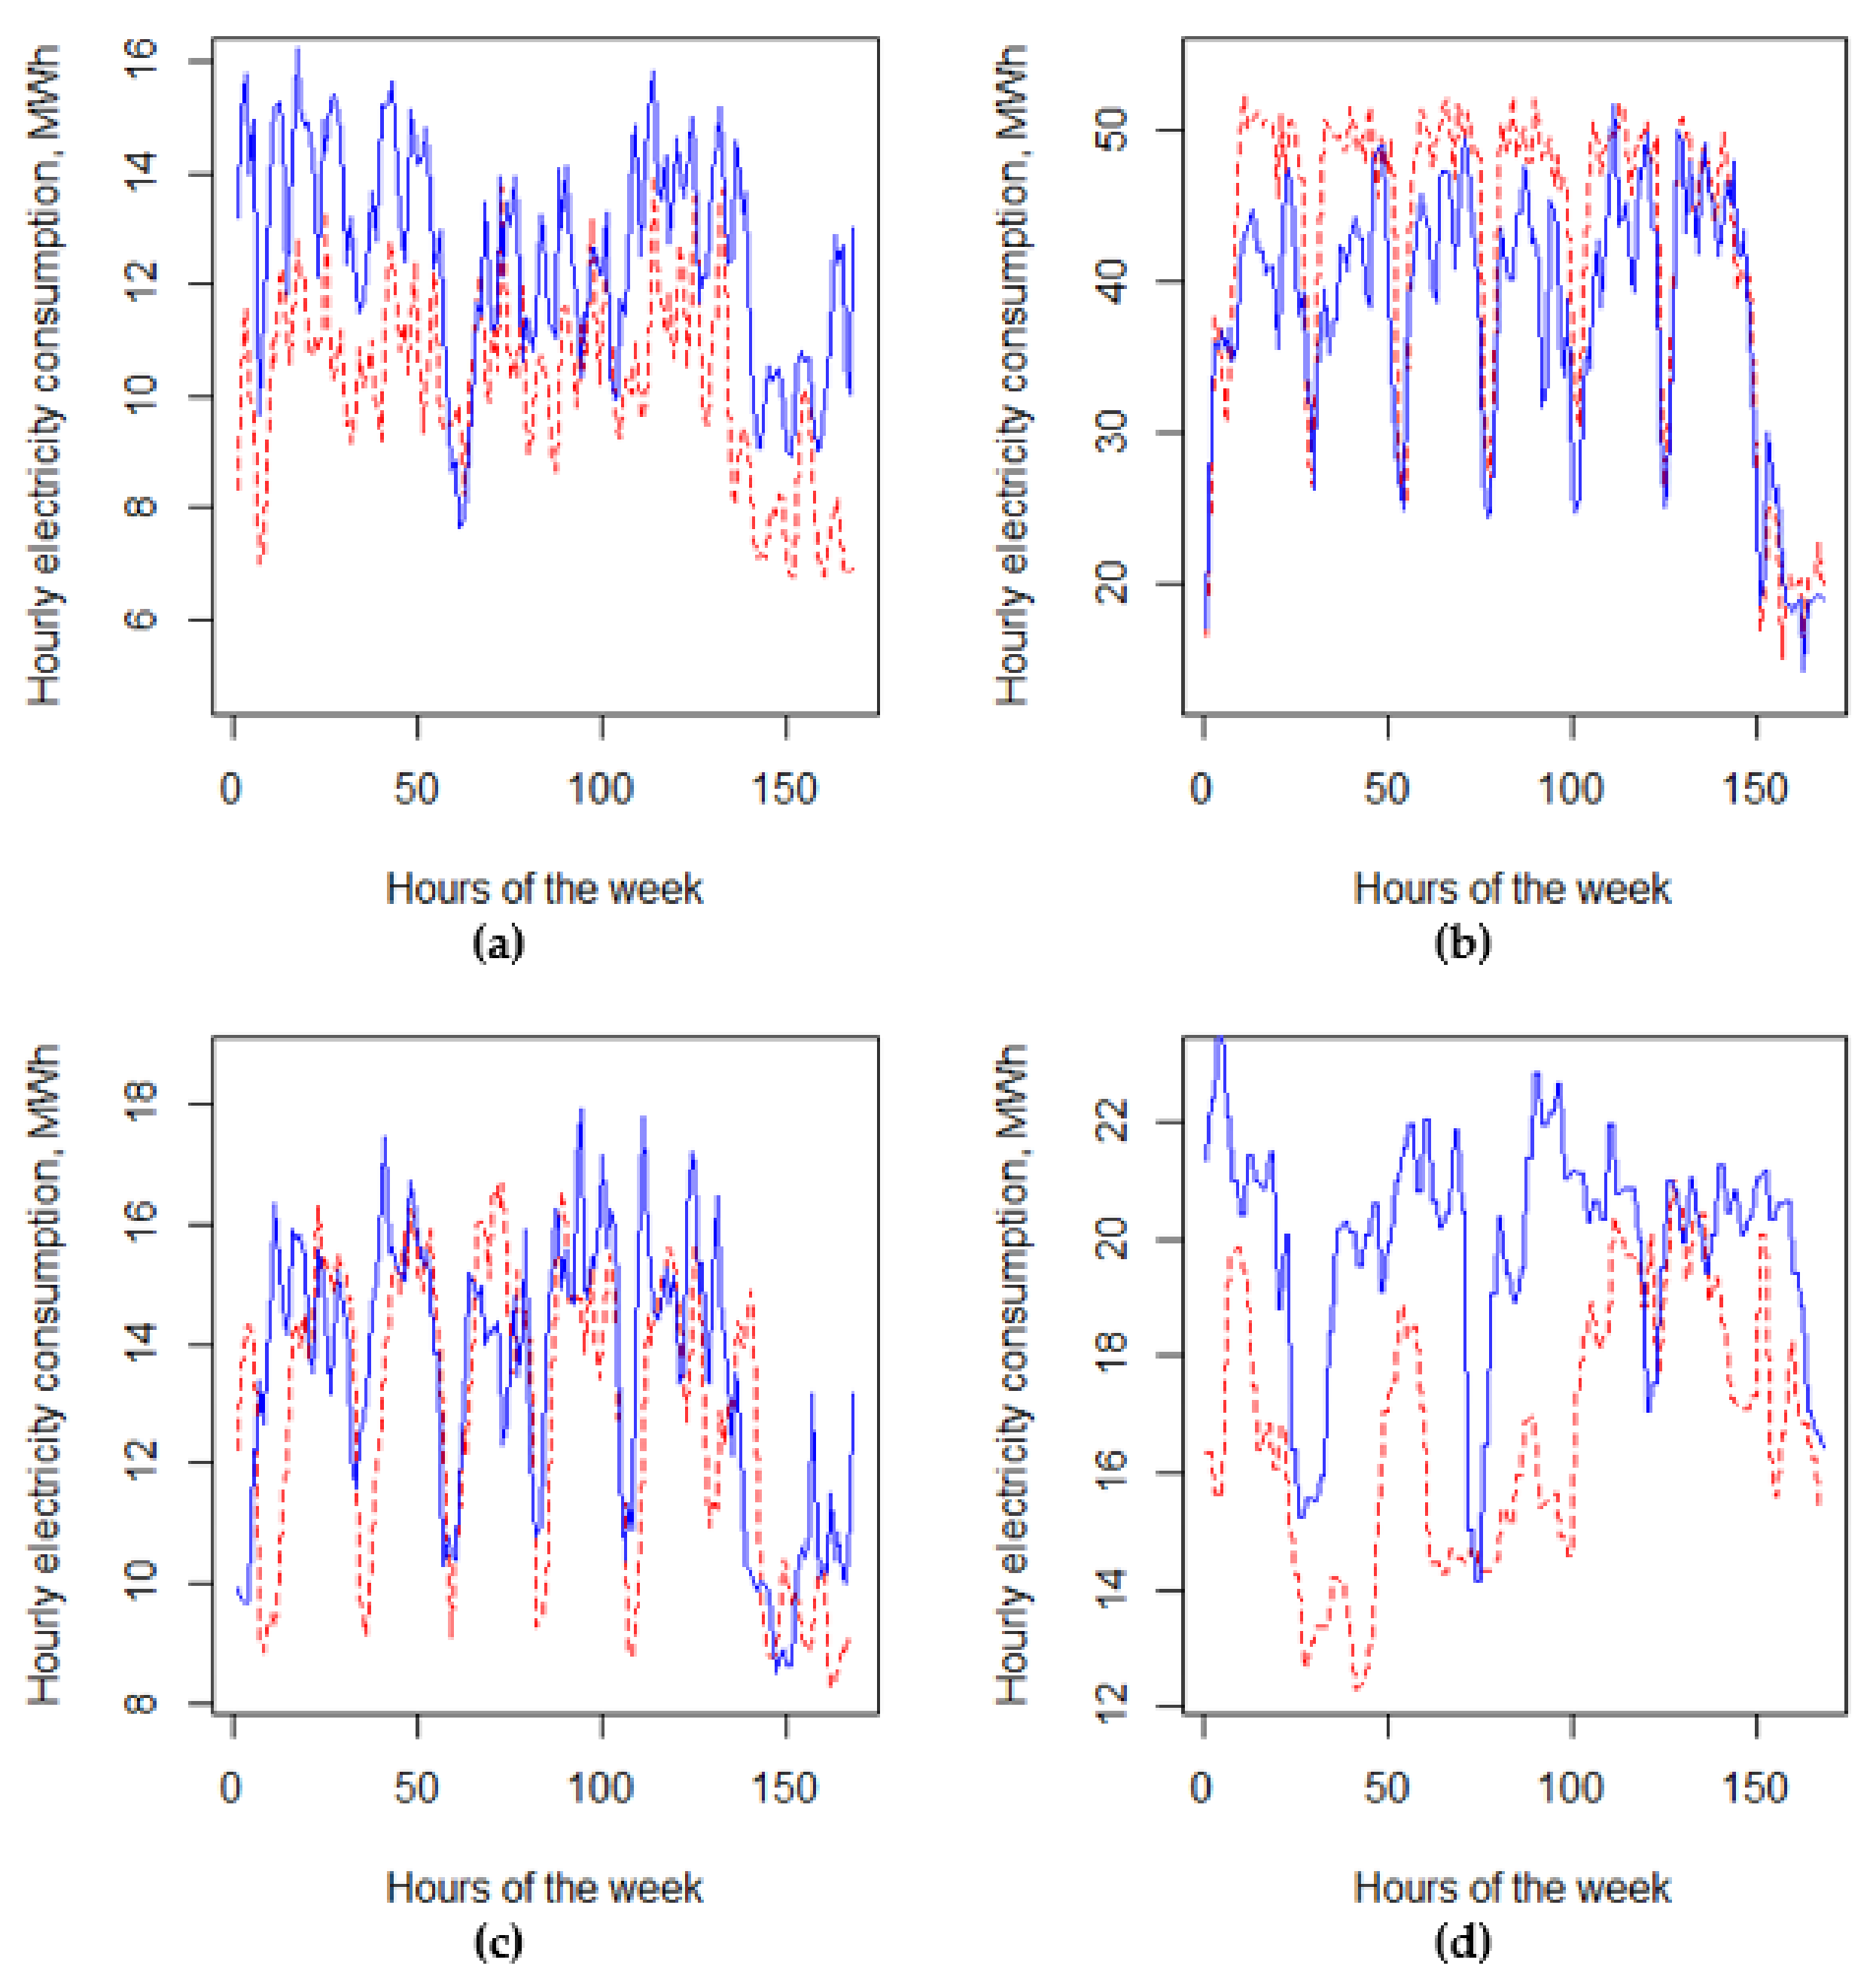
Figure 3.
Annual course of hourly electricity consumption for the analyzed case study: (a) M1, (b) M2, (c) M3 and (d) M4. Source: own study.
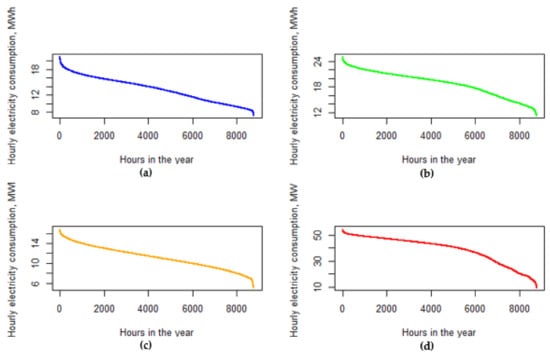
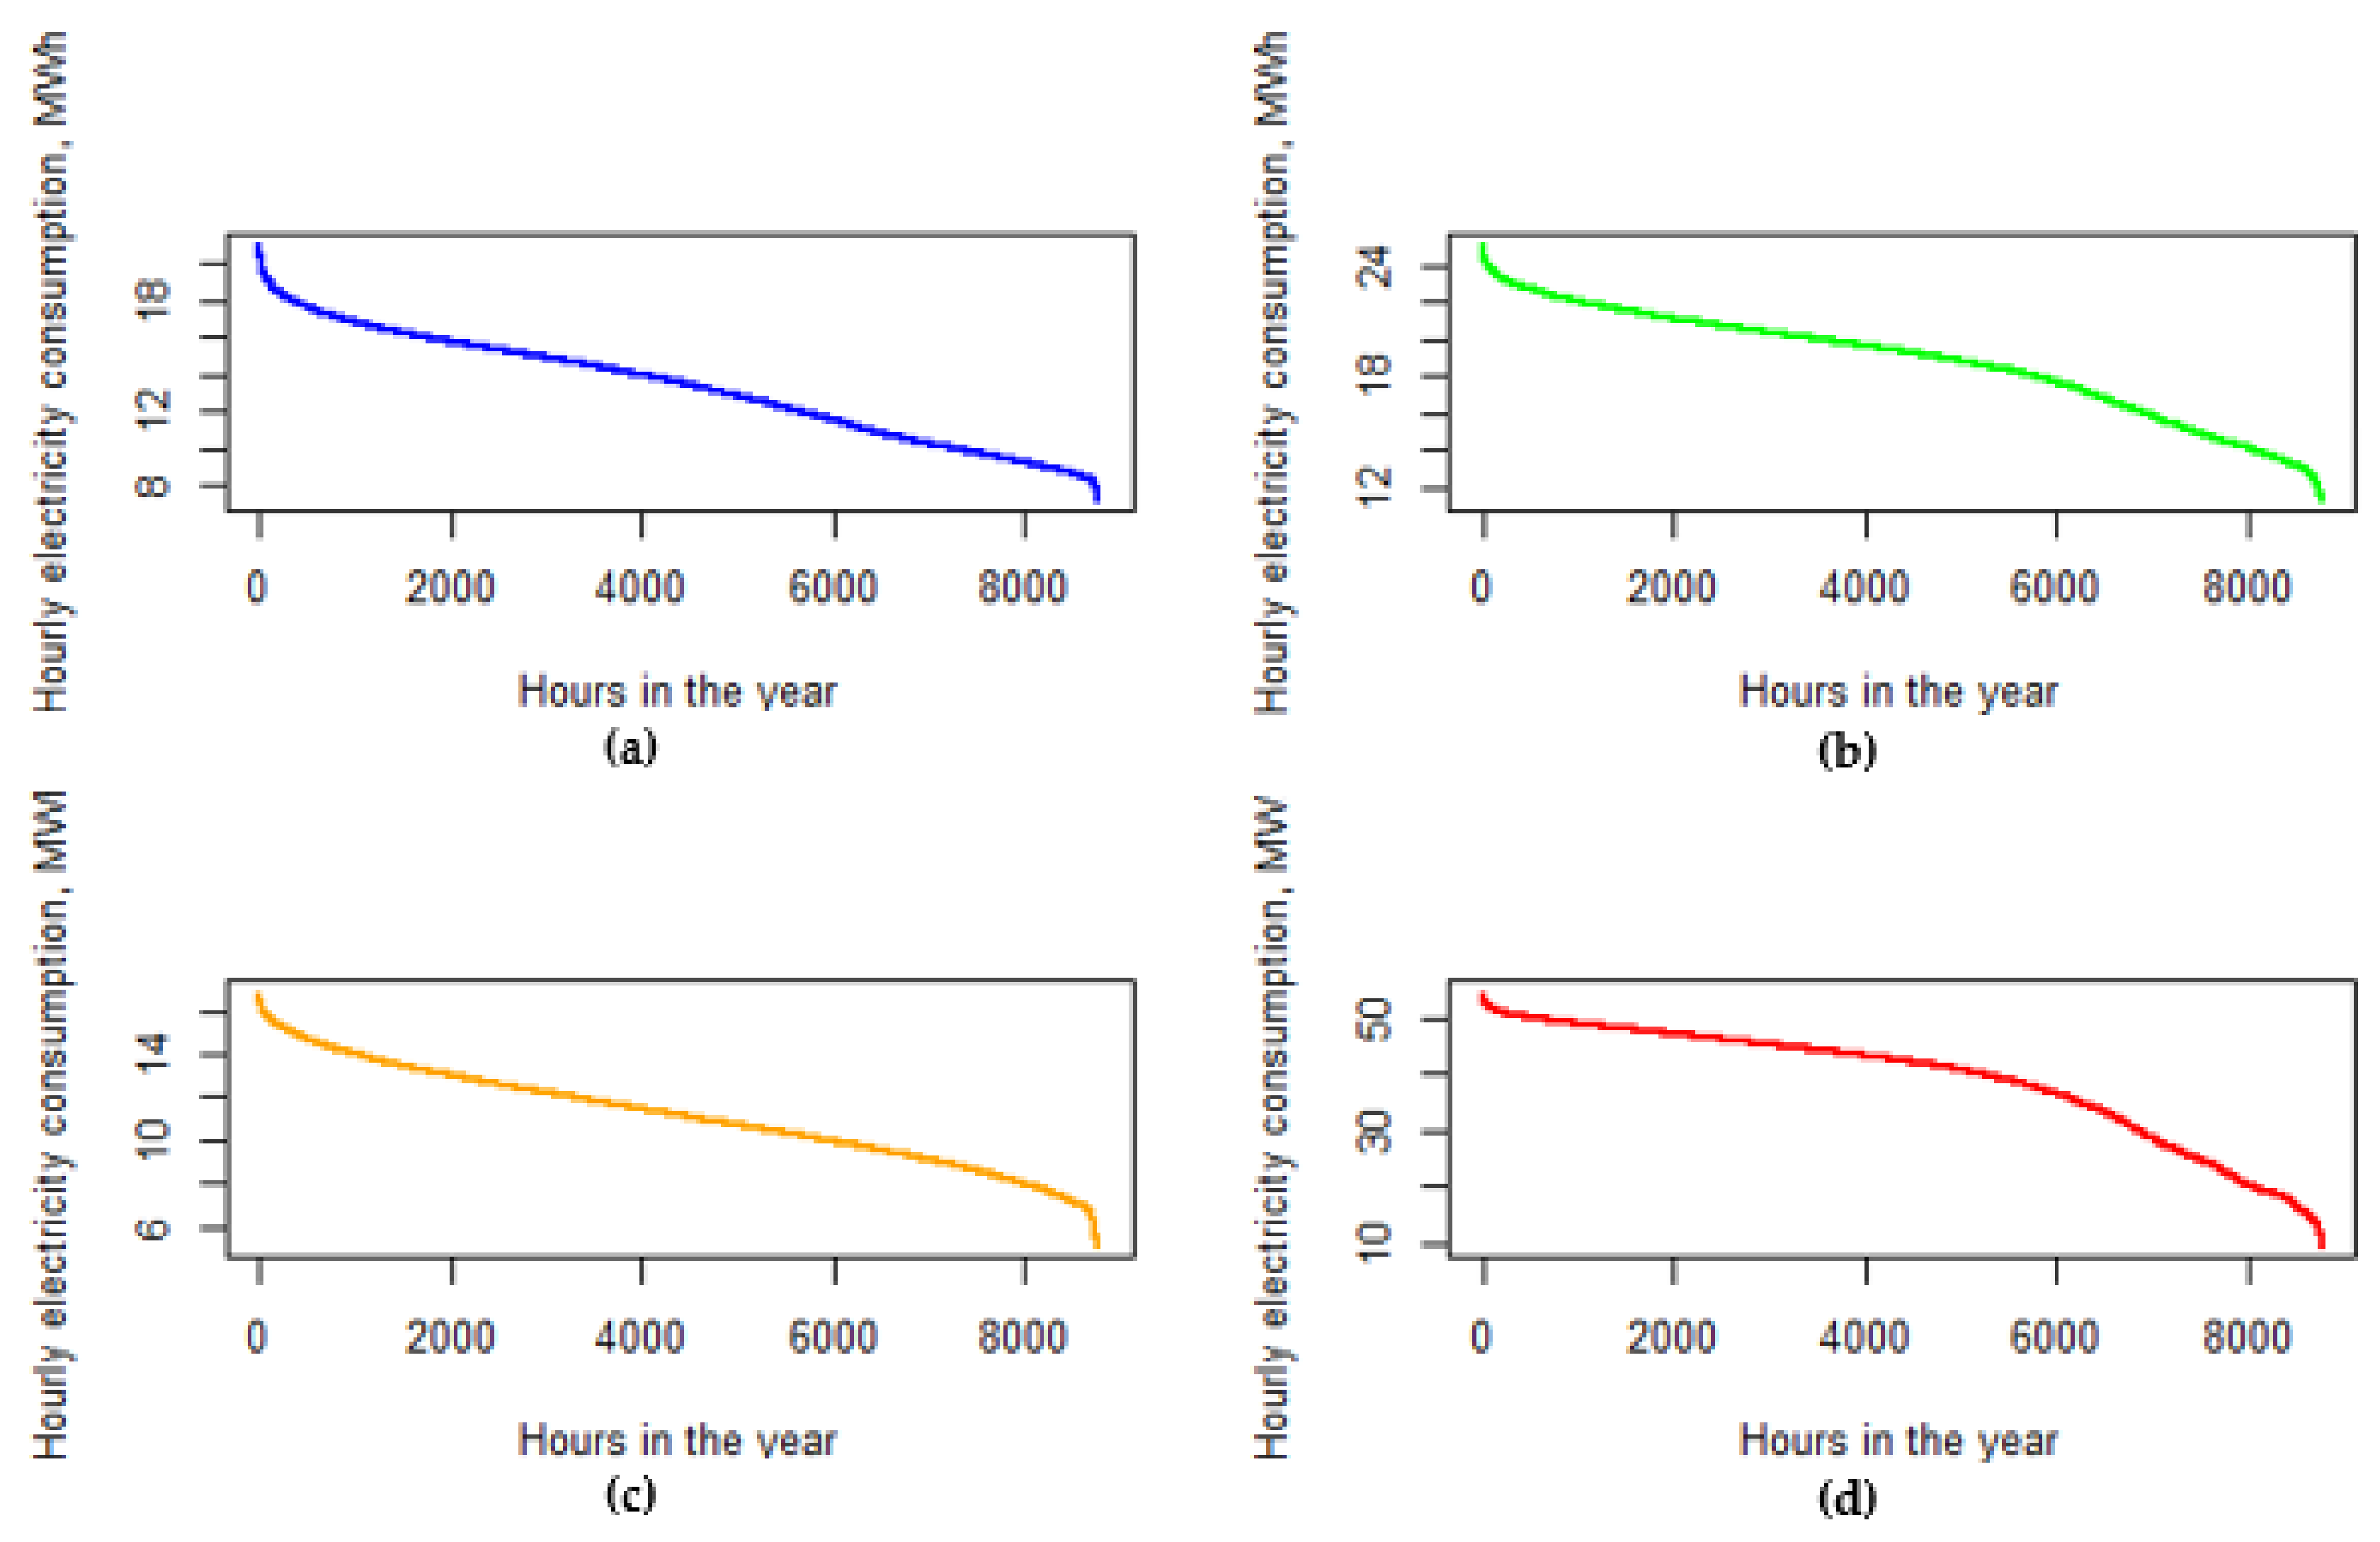
Figure 4.
Ordered values of hourly energy consumption for the analyzed case study: (a) M1, (b) M2, (c) M3 and (d) M4. Source: own study.

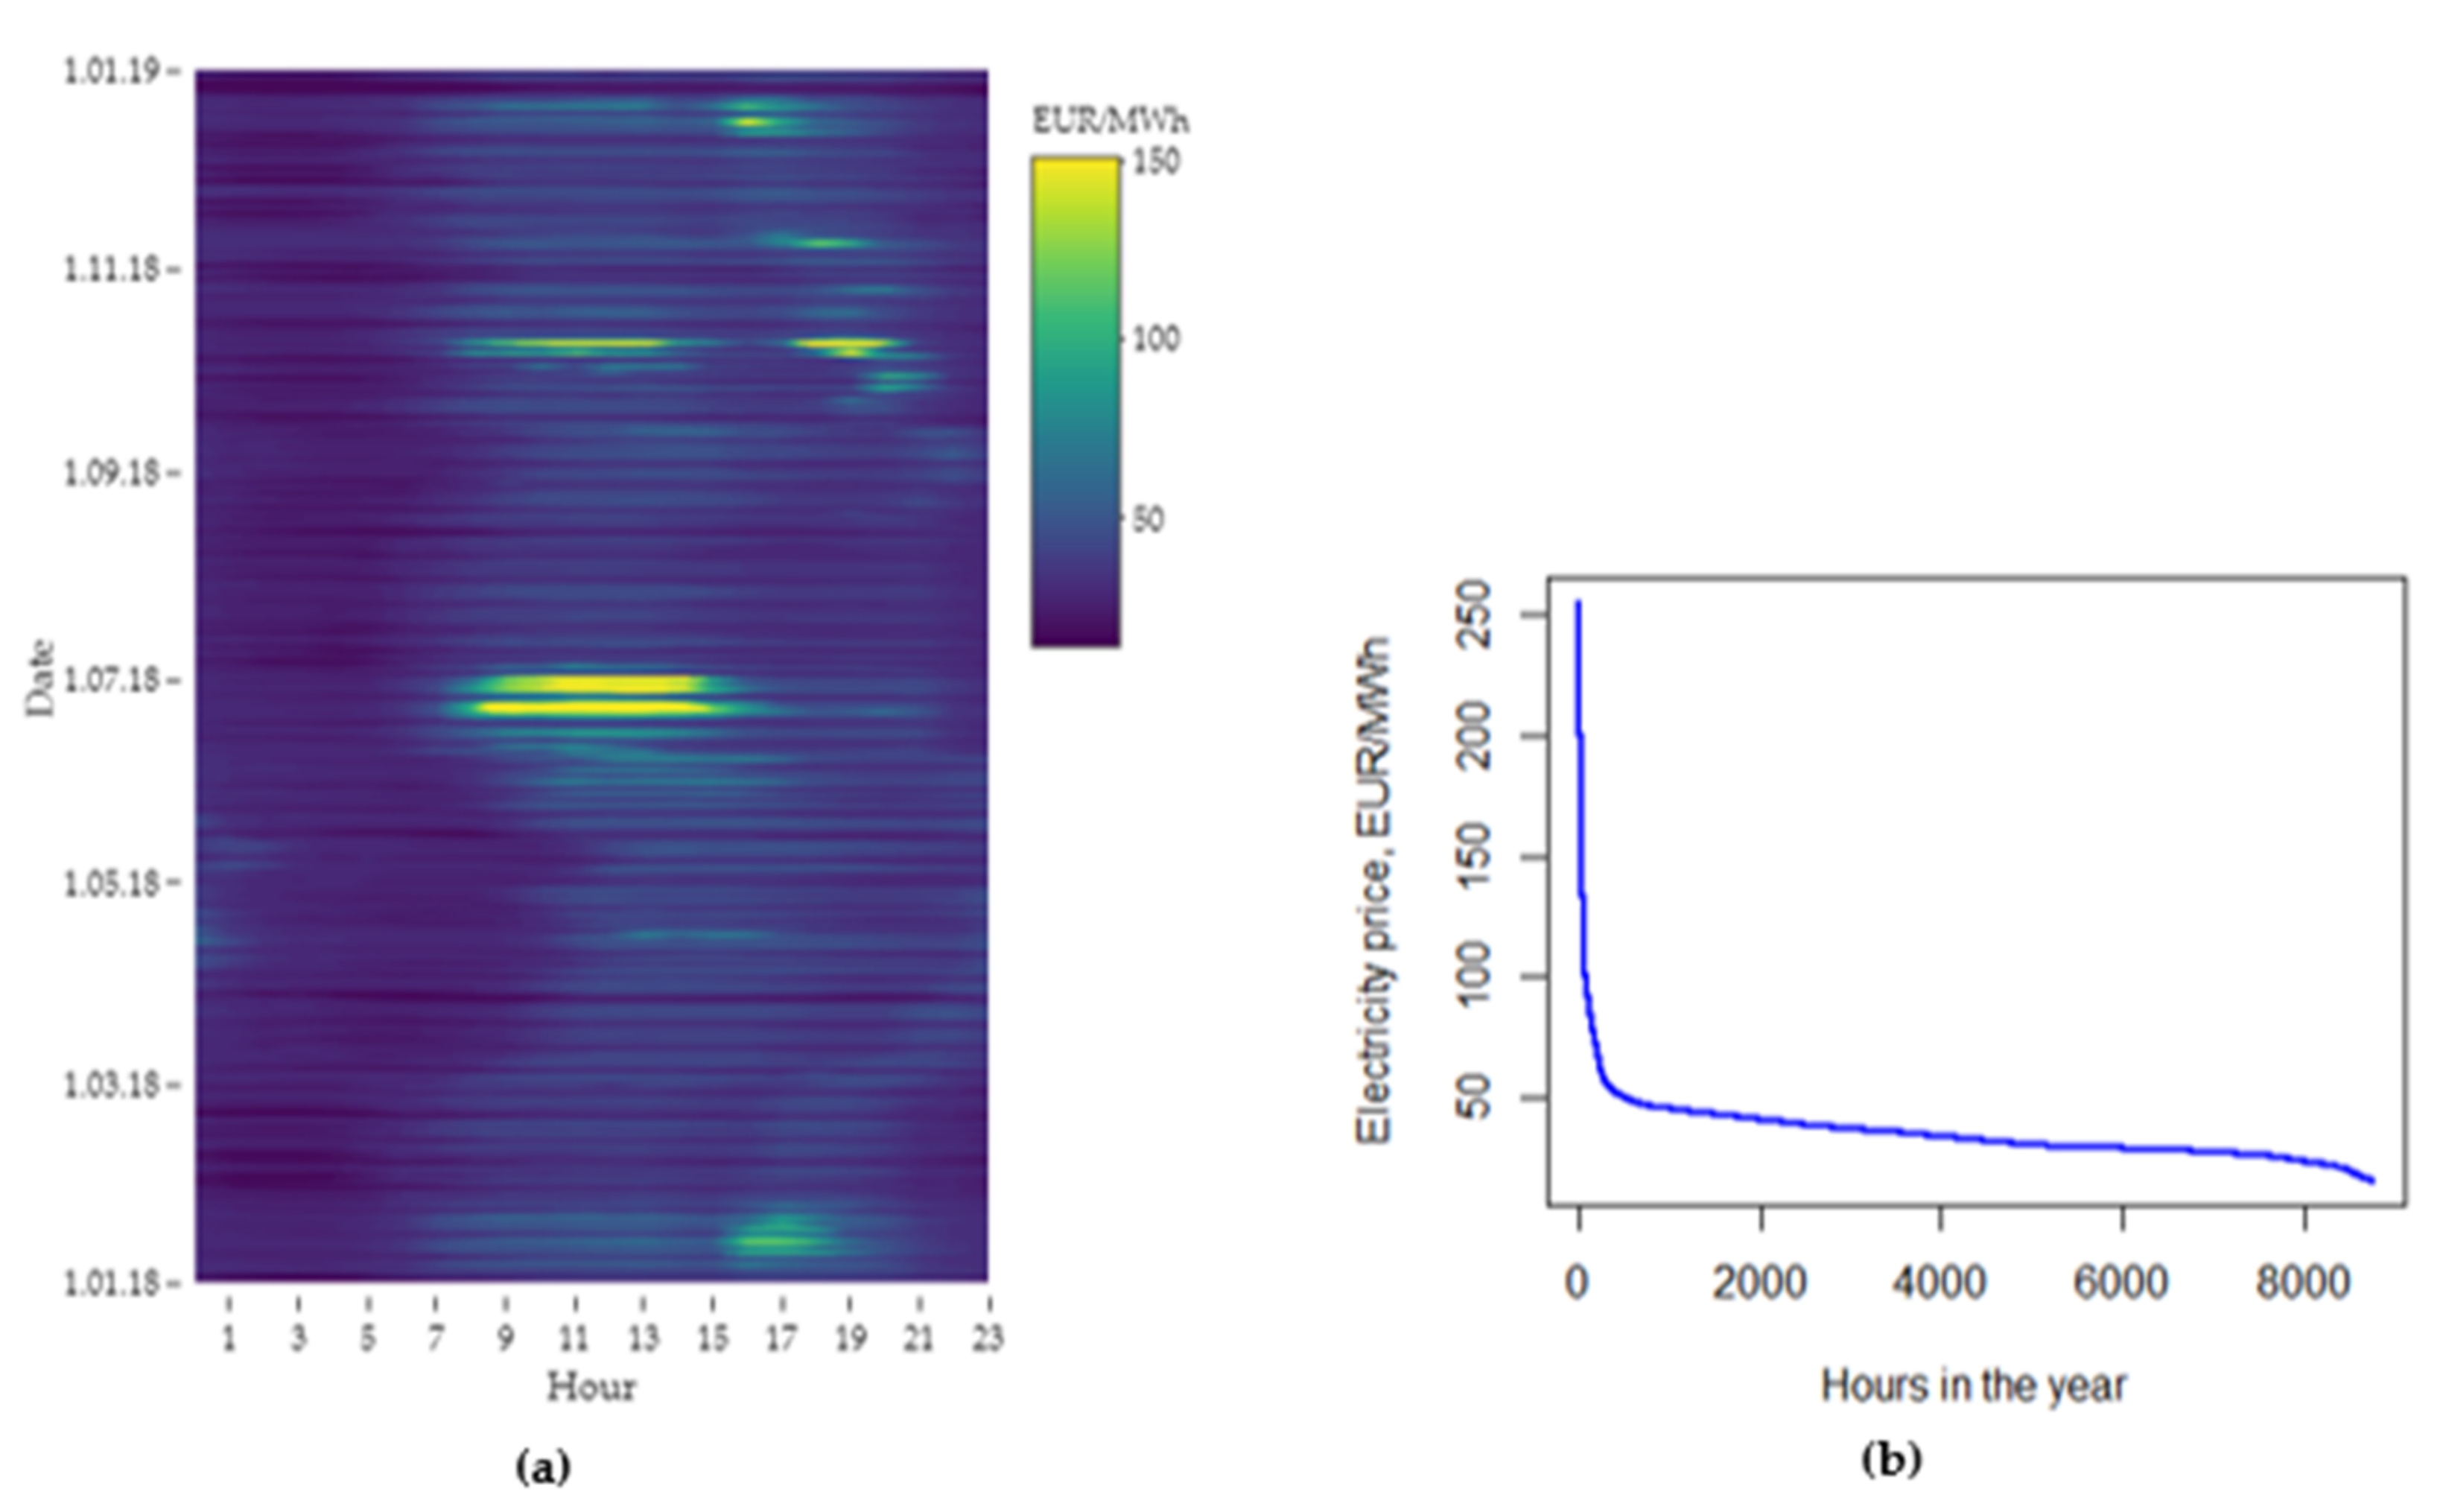
Figure 5.
(a) The annual pattern of electricity prices on the Day-Ahead Market in the Polish Power Exchange in analyzed period. (b) Ordered data of electricity prices on the Day-Ahead Market in the Polish Power Exchange in the analyzed period. Source: own study.
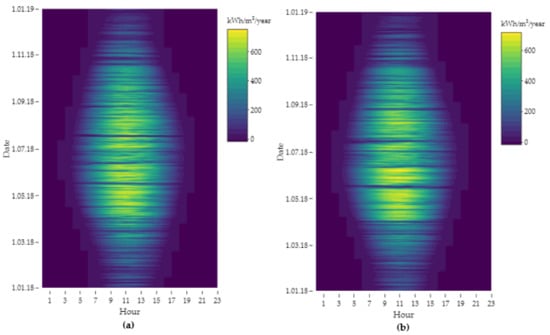
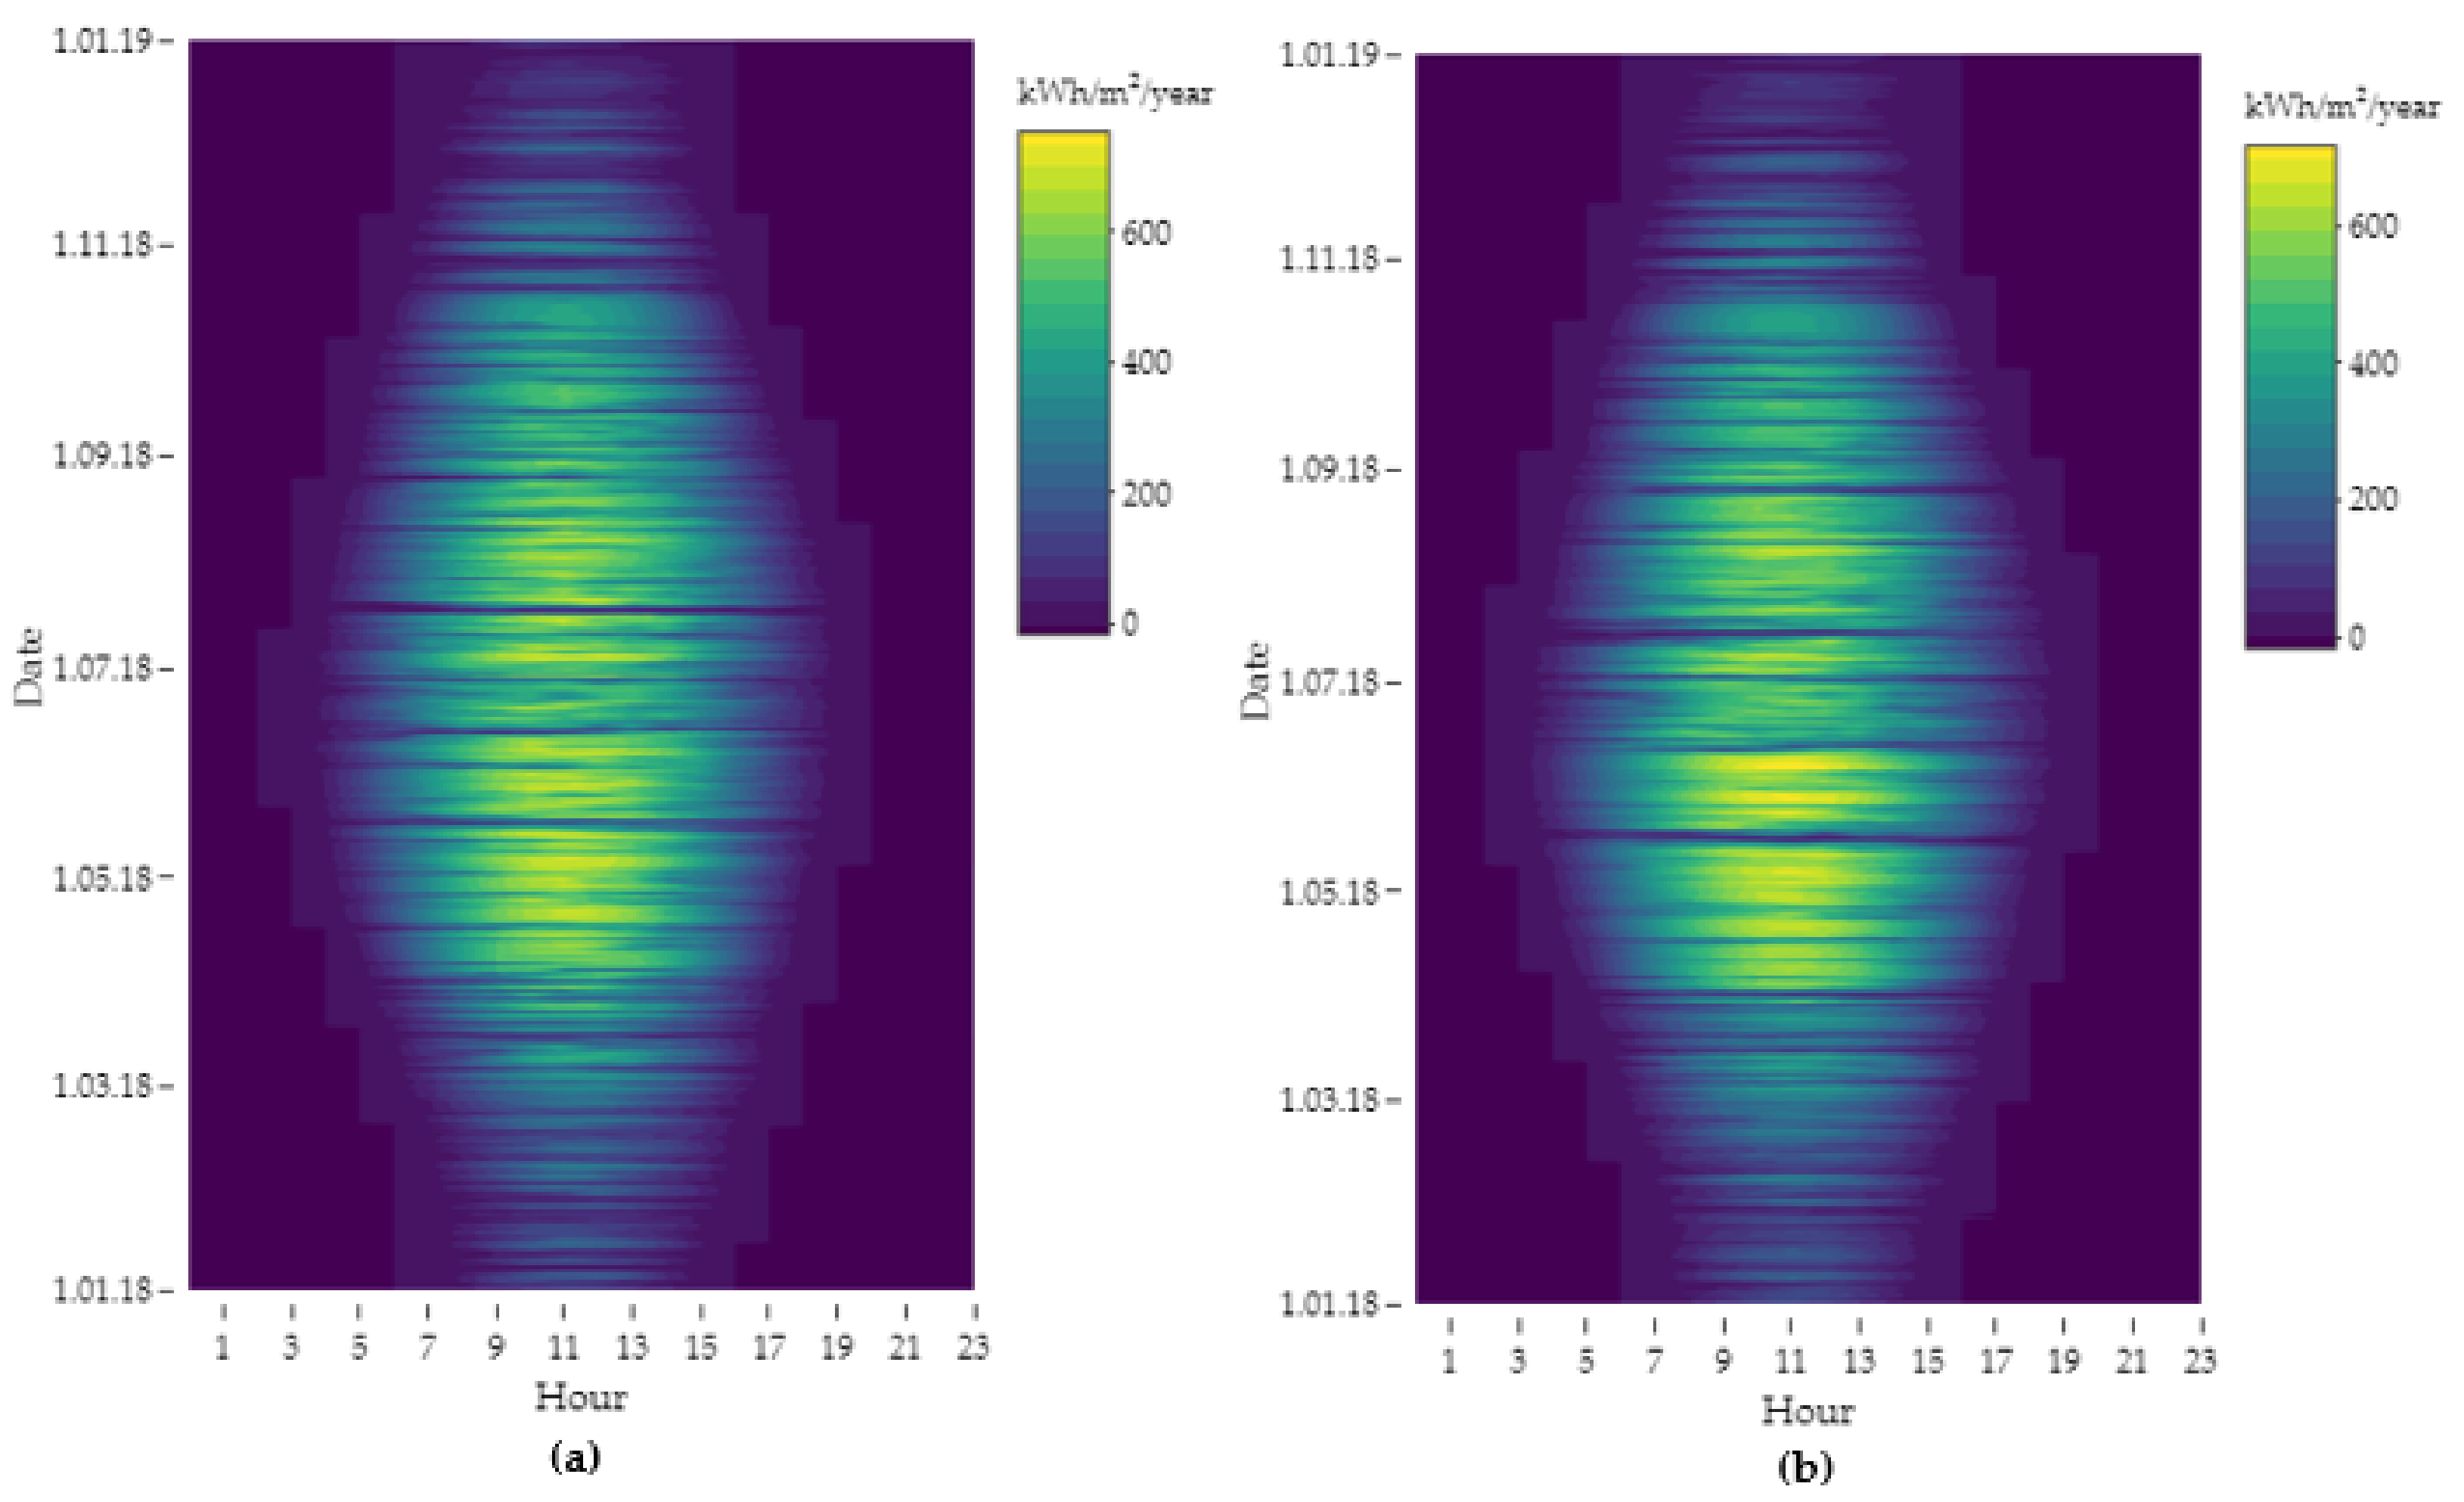
Figure 6.
Horizontal insolation for the location of the case study: (a) M1, M2, M3 and (b) M4. Source: own study.
2. Research Objects, Data Sources and Scope of Work
The aim of the article is to present the course of electricity consumption in industrial enterprises operating in the mining industry and to compare their electricity consumption profile with potential own PV sources in the context of their interaction and impact on the stability of the National Power System.
The research presented in this article has been focused on whether the connection of any PV capacity on the demand side in location of industrial customer will lead to a slight stabilization of the demand for electricity from the national power grid. A stable demand profile in conditions similar to the Polish ones in the energy sector based on conventional sources is preferred due to the limited scale of using balancing capacities. It is therefore desirable to achieve a flattened resultant profile of the electricity demand of a mining plant equipped with its own PV sources.
The data on electricity consumption was compared with the insolation conditions for the considered locations, assuming this variable as the only productivity driver of potential PV sources that would be used to cover own energy needs. The analyzed electricity consumption profiles were taken as representative for enterprises in the mining sector.
The source data was a set of measurement data with hourly resolution for 2018, concerning:
- electricity consumption in four analyzed enterprises: M1, M2, M3 and M4;
- horizontal insolation in places considered objects of research based on data ERA5-Land;
- electricity prices on the Day-Ahead Market on the Polish Power Exchange.
The enterprises constituting the case studies of this article were four hard coal mines located mainly in the area of Upper Silesia. Hourly data on electricity consumption was provided by the power departments of the mines. It is worth clarifying that the hourly resolution of the measurement data means that the given values of electricity consumption expressed in MWh are, in fact, the sums of the volumes consumed within 60 min. However, this consumption may well be the sum of the approximately constant minute values, as well as the result of the high consumption achieved in 20 min in the analyzed hour and a certain background level in the remaining 40 min (e.g., during a shift of working teams).
The annual pattern of the above-mentioned variables is shown in Figure 3, Figure 4, Figure 5 and Figure 6. In addition, Figure 7 shows the profiles of electricity consumption in the first week of February and August.

Figure 7.
The course of electricity consumption in the selected week of February and August for the analyzed case of the research object: (a) M1, (b) M2, (c) M3 and (d) M4. (blue solid line—February; red dashed line—August). Source: own study.
The analysis of Figure 3 indicates the existence of certain differences in the course of variation of hourly electricity consumption. These differences result, among others, from the specific conditions of production process carried out in individual mines.
Vertical, repetitive, relatively narrow areas with lower values of the observed variable occur in the periods of overlapping of production shifts (1 to 2 h). The wider vertical stripes, especially visible in the M2 mine between 7 and 11 a.m. and in the M4 mine between 3 and 6 a.m., represent a production–maintenance shift.
Blue horizontal stripes represent low electricity consumption on nonworking days. Characteristic of mines, M3 and M4 conduct mining on Saturdays and some holidays, which is reflected in maintaining the stability of larger electricity consumption on a weekly basis. The 1-h horizontal displacement visible in the M4 mine occurs due to lack of synchronization of the measuring system with the seasonal shift of local time in order to adjust to the zone time, which took place on 25 March and 28 October in 2018.
3. Research Methodology
3.1. The Choice of Research Method
The aim of the research was to determine the impact of the electricity consumption profile in mining plants on their cooperation with potential photovoltaic sources. For this reason, the research methods were sought among the statistical correlation tests.
Choosing the right statistical test and checking the fulfillment of its assumptions is extremely important from the point of view of the credibility and correctness of the interpretation of the results. The tests of the normality of the distribution are specific tests examining the compliance of the empirical distribution with the normal distribution—most often used in statistics, because many features have a distribution similar to it [25]. The assumption of normality is often required in the case of parametric statistical tests. On the other hand, nonparametric tests are free from such assumptions [26].
Existing algorithms provide for the testing of relatively small sample sizes. The most recommended for general applications is a parametric test of normality, Shapiro–Wilk. However, it may give erroneous results for samples larger than 2000 observations. Sources say that the most commonly used tests, i.e., Kolomogorov–Smirnov, gives reliable results for samples up to 100 observations, and Shapiro–Wilk in the algorithm implemented in the nortest library in R has been provided for the analysis of sample sizes from 3 to 5000 observations [27]. On the other hand, the random extraction of smaller samples from the sample of 8760 observations analyzed in this article for the purpose of applying the existing normality tests under the conditions of their applicability would be a bizarre practice.
Adoption of the null hypothesis of normal distribution should always be confirmed by a graphical representation of data [26]. Therefore, at the beginning of the study, the normality of the distributions of the analyzed variables was assessed, as it is one of the key assumptions necessary to select the test from among the parametric and nonparametric correlation tests. Due to the discussion taking place between researchers in the literature on the subject over the superiority of one test of the normality of distribution over the other and the optimal conditions for the application of individual tests, the nature of the distribution of variables was not determined by using compliance tests.
Adoption of the null hypothesis of normal distribution should always be confirmed by a graphical representation of the data [26]. Therefore, at the beginning of the study, the normality of the distributions of the analyzed variables was assessed, as it is one of the key assumptions necessary to select the test from among the parametric and nonparametric correlation tests. Due to the discussion taking place between researchers in the literature on the subject over the superiority of one tests of the normality of distribution over the other and the optimal conditions for the application of individual tests, the nature of the distribution of the variables was not determined by means of compliance tests. On the basis of the central limit theorem, there is also a situation where, even with a large sample size and the lack of normality of the variable in the population, the mean of the samples is subject to normal distribution. On the basis of the above theorem, one could therefore assume normal distribution as the correct one and apply the most popular parametric test of Pearson’s linear correlation. The value of the Pearson’s correlation score as a measure of the linear relationship between two variables, however, may be underestimated when there is a relationship between the variables, but the relationship is not linear. It may or may not give erroneous values and also lead to misinterpretation of the results in the case of noncompliance with assumptions of the distribution normality. It is also very susceptible to outliers.
After the initial identification of the lack of a linear relationship between the analyzed variables, it was expected to achieve higher values in the Spearman’s Rho test as a better measure of the degree of correlation of the variables, being the subject of this article. The use of nonparametric methods independent of the distribution of analyzed variables is also more convenient from the point of view of meeting the applicability conditions of the parametric statistical procedures. Spearman rho coefficient can be treated similarly to Pearson’s linear correlation coefficient, i.e., in terms of the percentage of explained variations. The main difference is that the Spearman rho statistic value is calculated based on ranks.
In light of the foregoing considerations, due to large sample size used for the needs of the present study, correlations between the variables using the most intuitive parametric Pearson r correlation test and its nonparametric equivalent, Spearman rho, were carried out [28].
As part of the study, the normality of the distribution of the studied variables was assessed using:
- a graphical representation of the distribution of statistical data by:
- ○
- histograms in the form of a combined plot with a normal distribution probability density plot;
- ○
- whisker frame plots for visualizing the scattering of variables.
- a standard set of descriptive statistics within the summary function, additionally extended by the coefficients of skewness and kurtosis of the distribution using the e1071 library, as well as the variance and standard deviation.
3.2. The Course of the Research Process
In the next stage of the research process, the visualization and multidimensional analysis of the electric energy consumption profiles in the examined objects were conducted. First, the general characteristics of the electricity consumption per year were determined. In a further step, we designated courses in descending order to visualize the frequency of the particular values of the hourly electricity demand. Then, due to the significant share of air-conditioning devices in electricity consumption, profiles for the example weeks in the summer and winter months were determined.
Correlation matrices, as the end product of research, were developed in two contexts, i.e.:
- environmental efficiency of the use of their own PV sources to cover the demand for electricity due to the reduction of the emission intensity of the domestic power industry based mainly on fossil fuels;
- economic efficiency of the potentially used PV installation and its significance for the independence of the cost of operations from electricity price increases. In the condition of the national energy mix, due to the volatility of the prices of CO2 emission rights, which is difficult to predict, it is of particular importance from the point of view of an industrial customer.
The result of the first area of research is the correlation matrices comparing the electricity consumption profiles of the research objects with the electricity production profiles of the potential PV sources. The PV productivity was defined, in a simplified manner, solely on the basis of the historical insolation conditions for the considered locations. The result of the second part of the research was the correlation matrices weighted by the price of electricity on the Day-Ahead Market, taking into account the critical peak hours for the entire day in relation to the differences in the values of the electricity volumes consumed during the day. The occurrence of hours with the highest electricity prices was observed in the conditions of the Polish power grids in a particular way between 9 a.m. and 5 p.m. in the summer months (Figure 5).
The correlation matrices were organized in such a way as to investigate how the electricity generation profiles of a potential RES source fit into the electricity consumption profiles of individual research objects to cover their own energy needs. This approach was also chosen for its utility in a wide range of potentially installed PV capacities. With the low power of the installation, self-consumption of the produced energy will almost always occur [24], while, with the rescaling of the installation, the degree of self-consumption of electricity decreases and, at the same time, the self-sufficiency increases [29,30]. Regardless of the power of installation, the degree of correlation of the profile, while maintaining the conditions for which they were drawn, remains approximately constant.
4. Results
4.1. Descriptive Statistics of the Analyzed Variables
The results of the summarizing function summary give an overview of the nature of empirical distribution of the analyzed variables. Table 1 presents descriptive statistics, as well as the measures of dispersion and shape of distribution, of the electricity consumption variables in four analyzed cases of underground mines, solar radiation conditions in the considered locations and electricity prices in the analyzed period, i.e., 2018.

Table 1.
Descriptive statistics of the analyzed variables for 4 analyzed research objects and insolation in their locations and electricity prices in 2018.
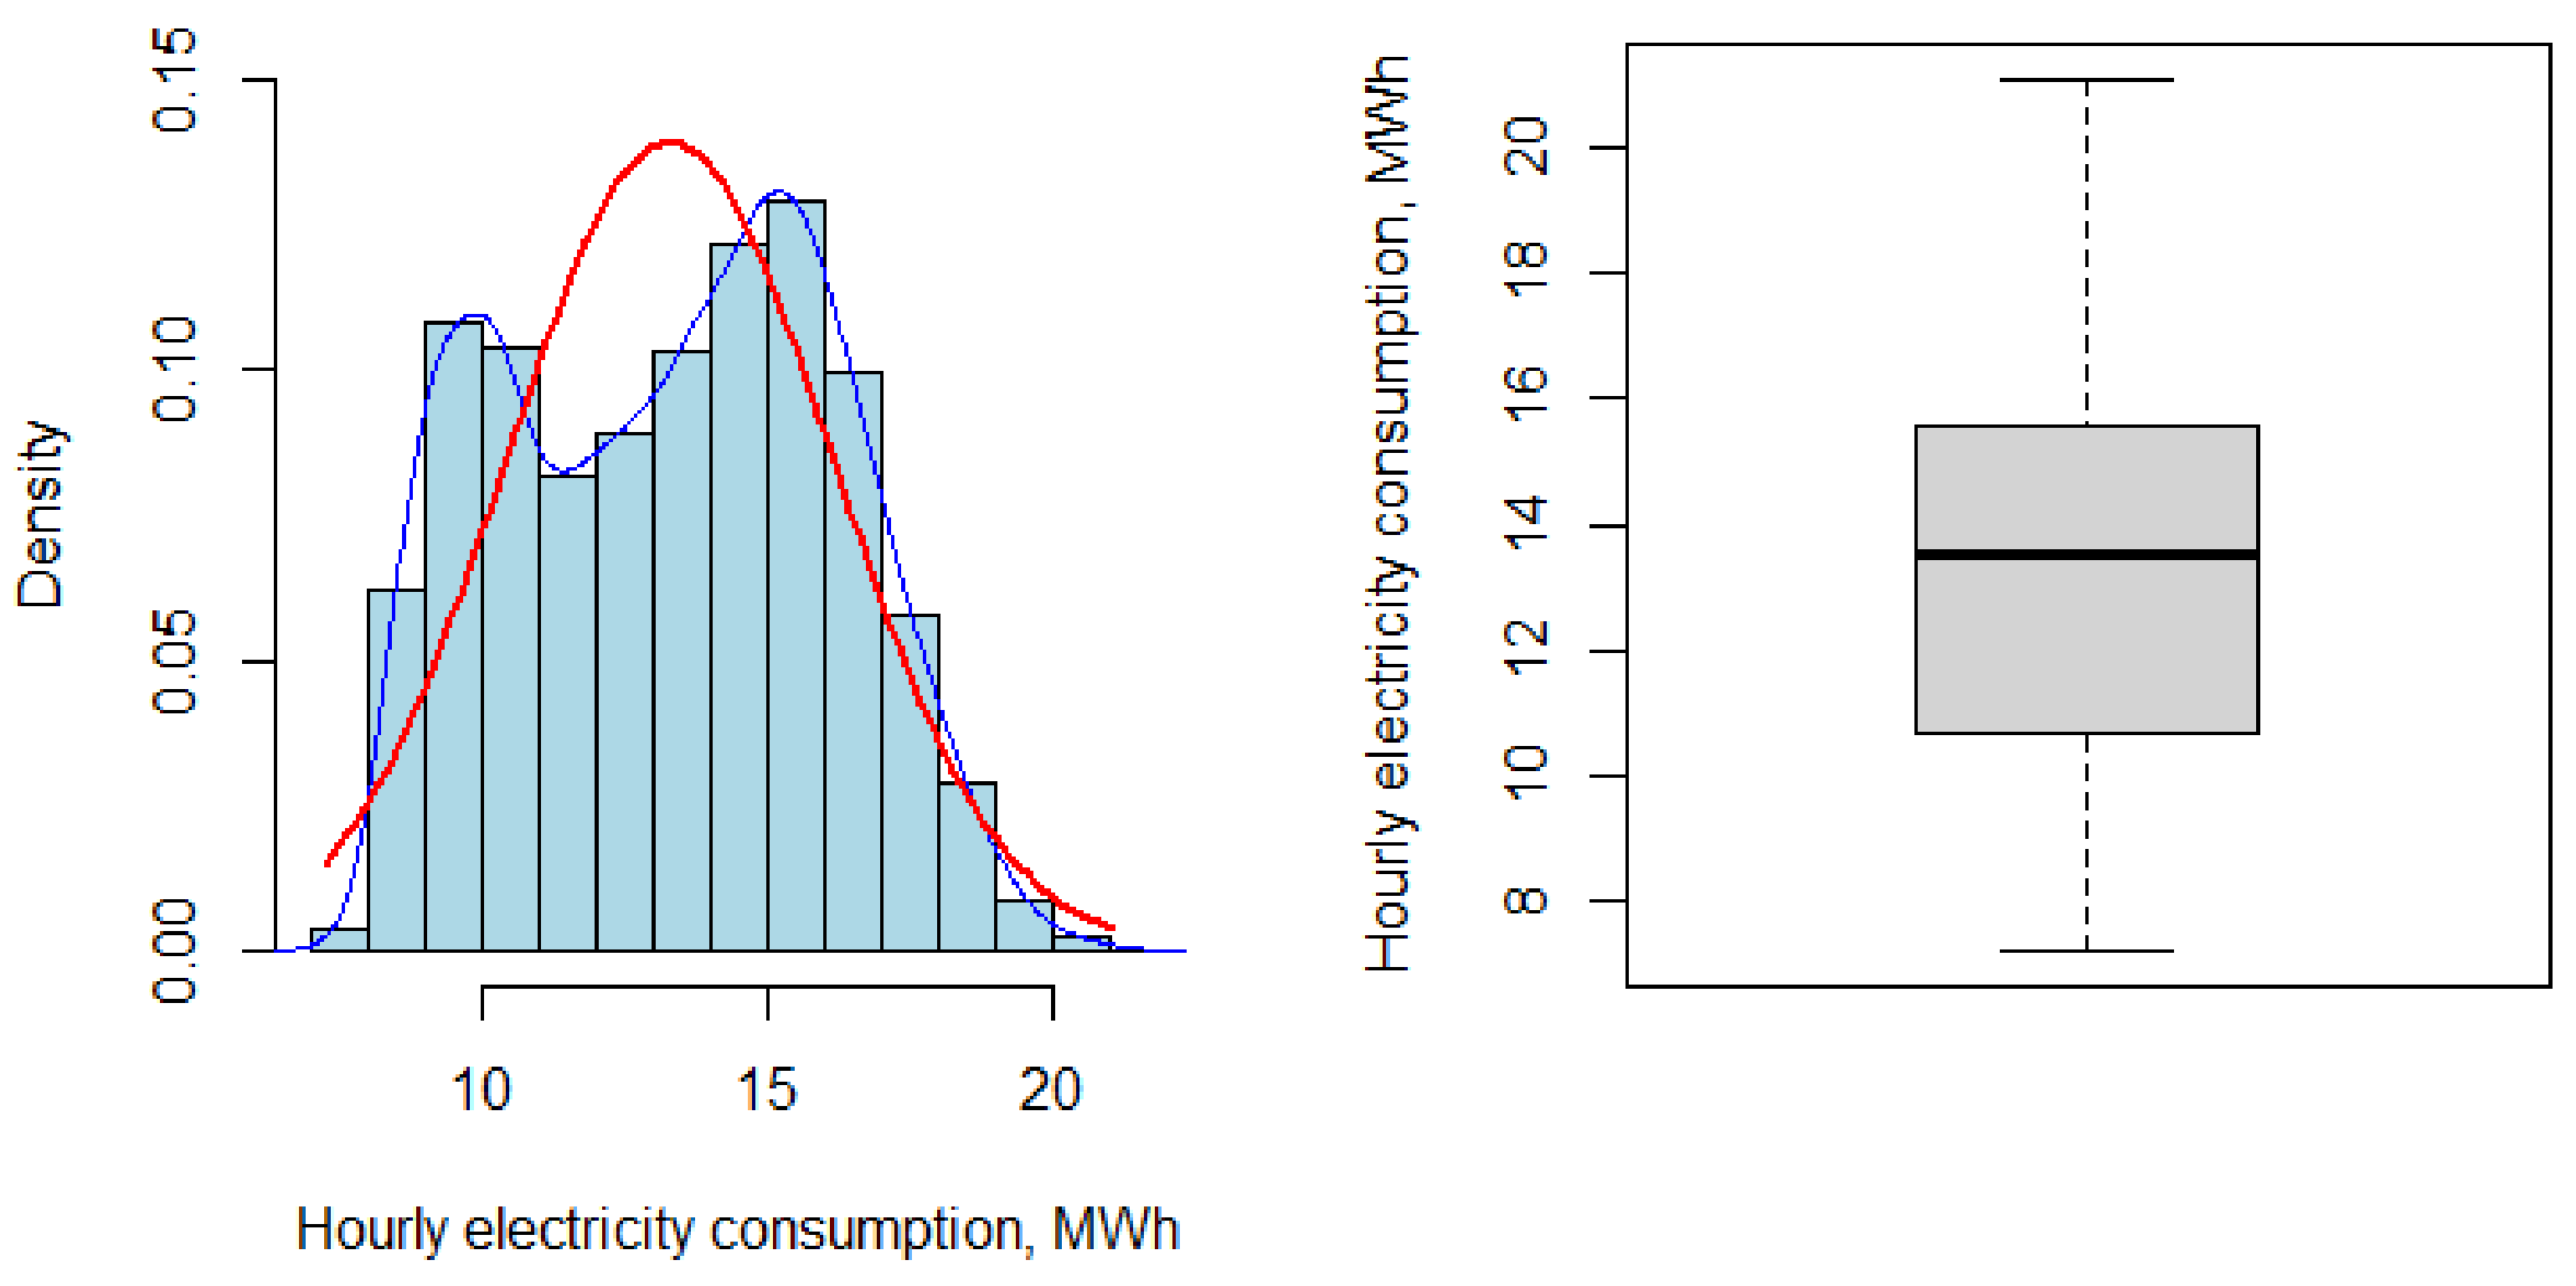
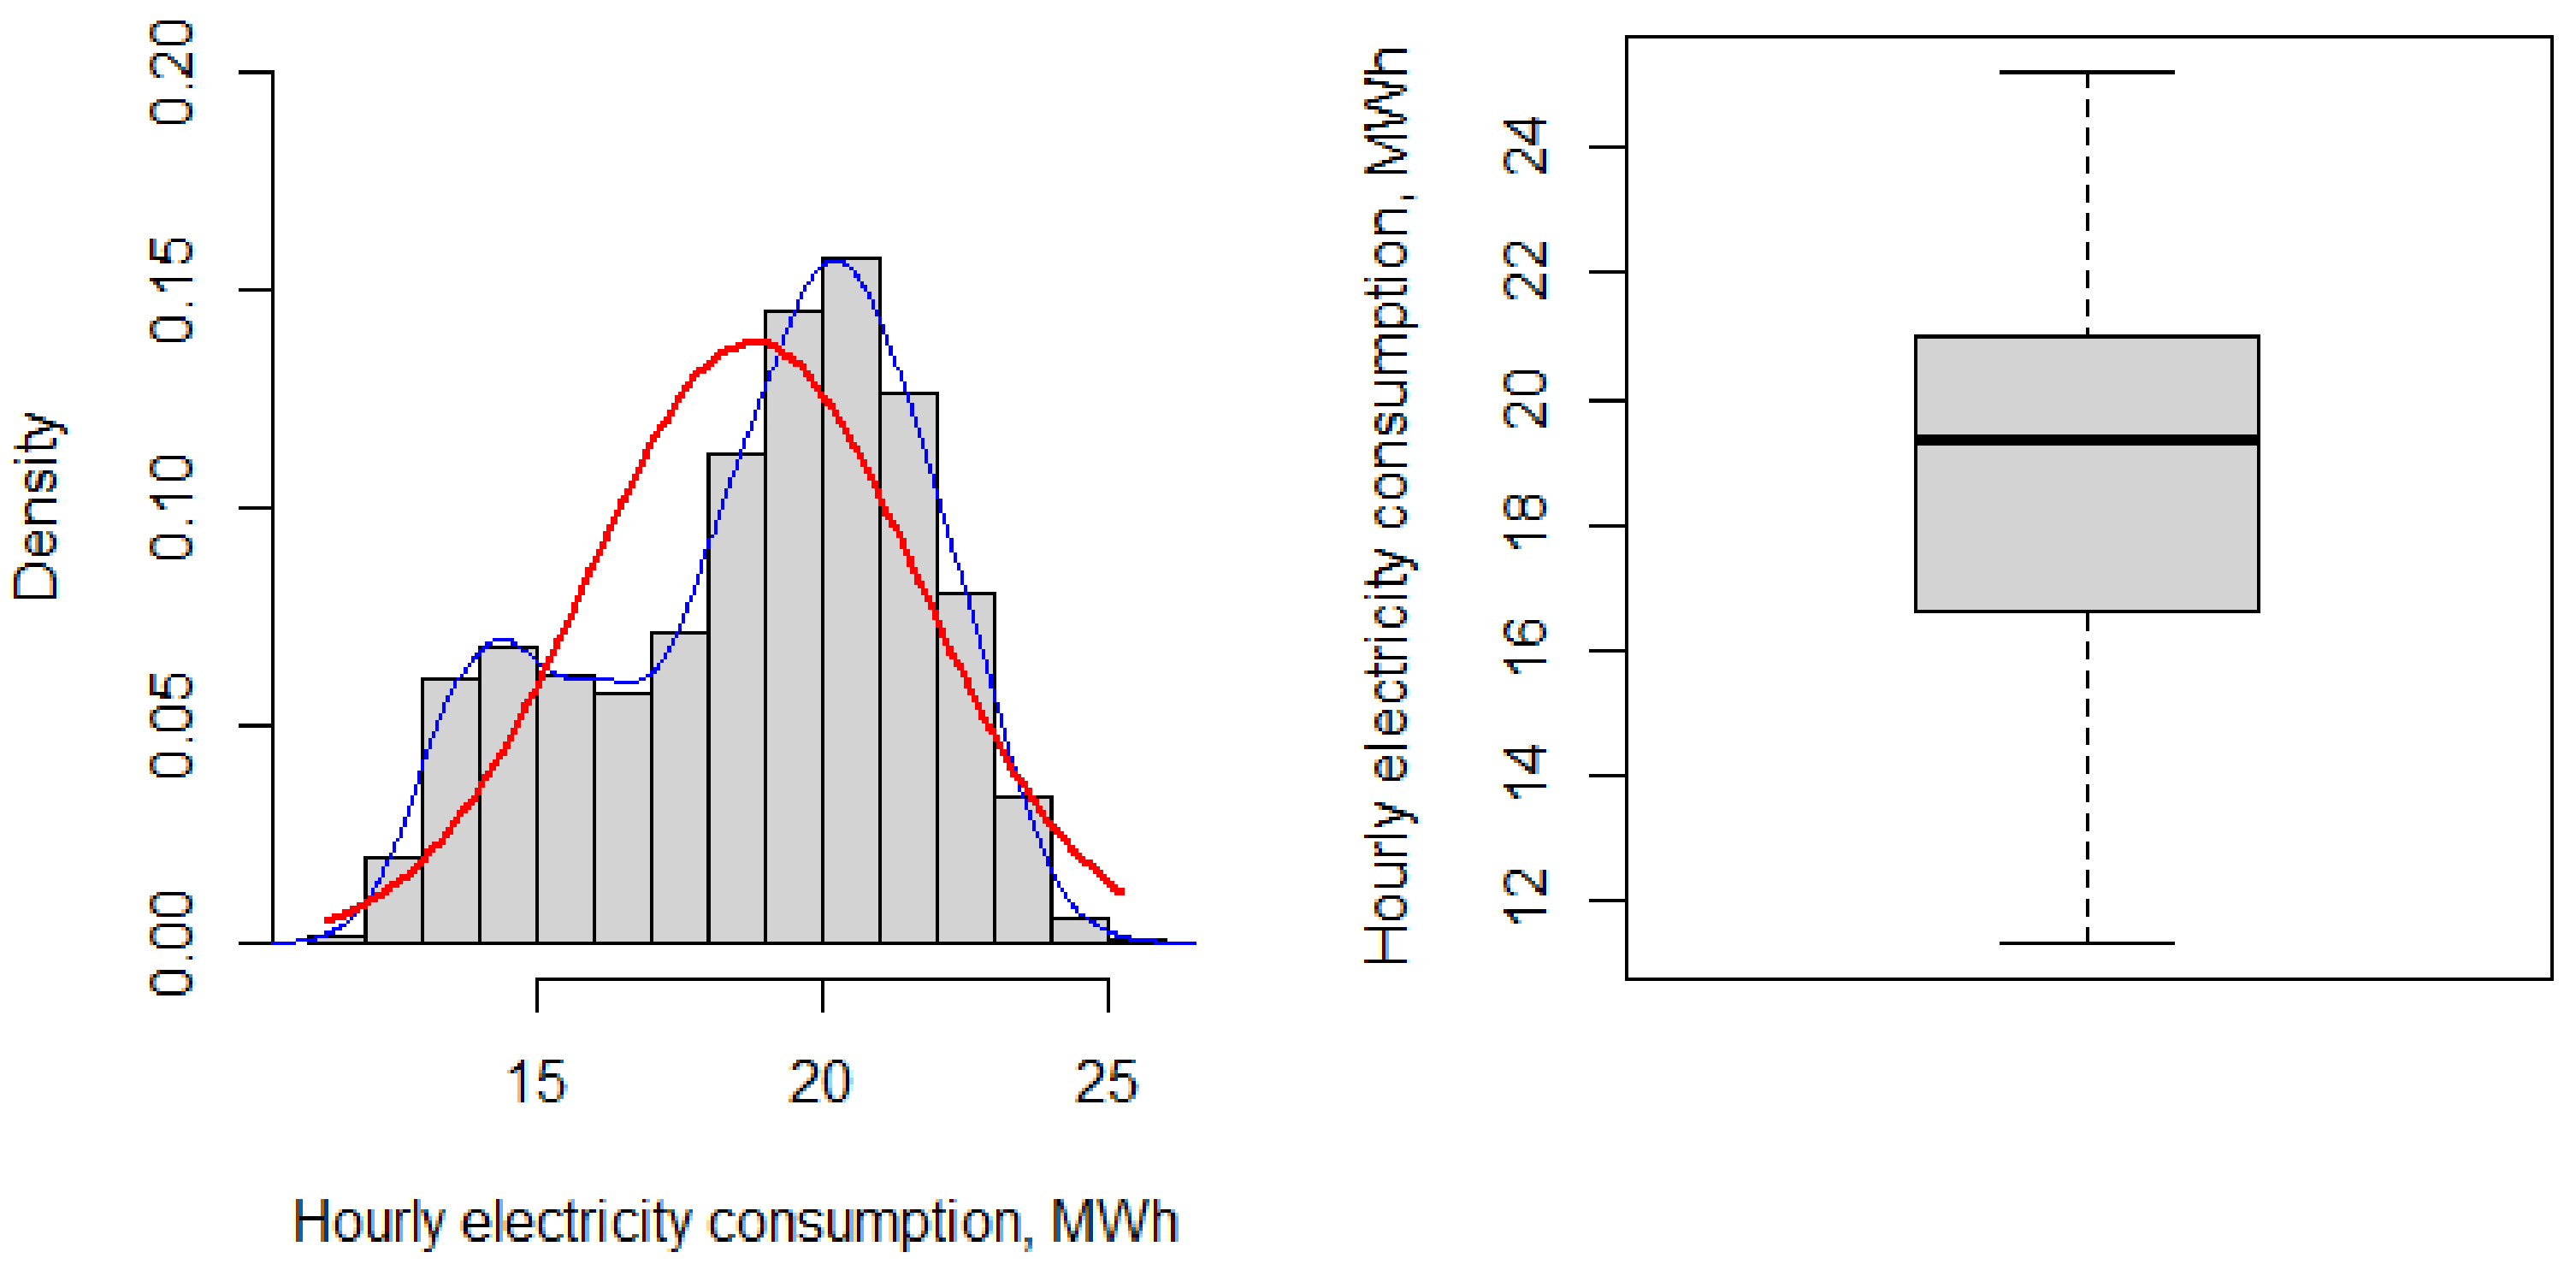
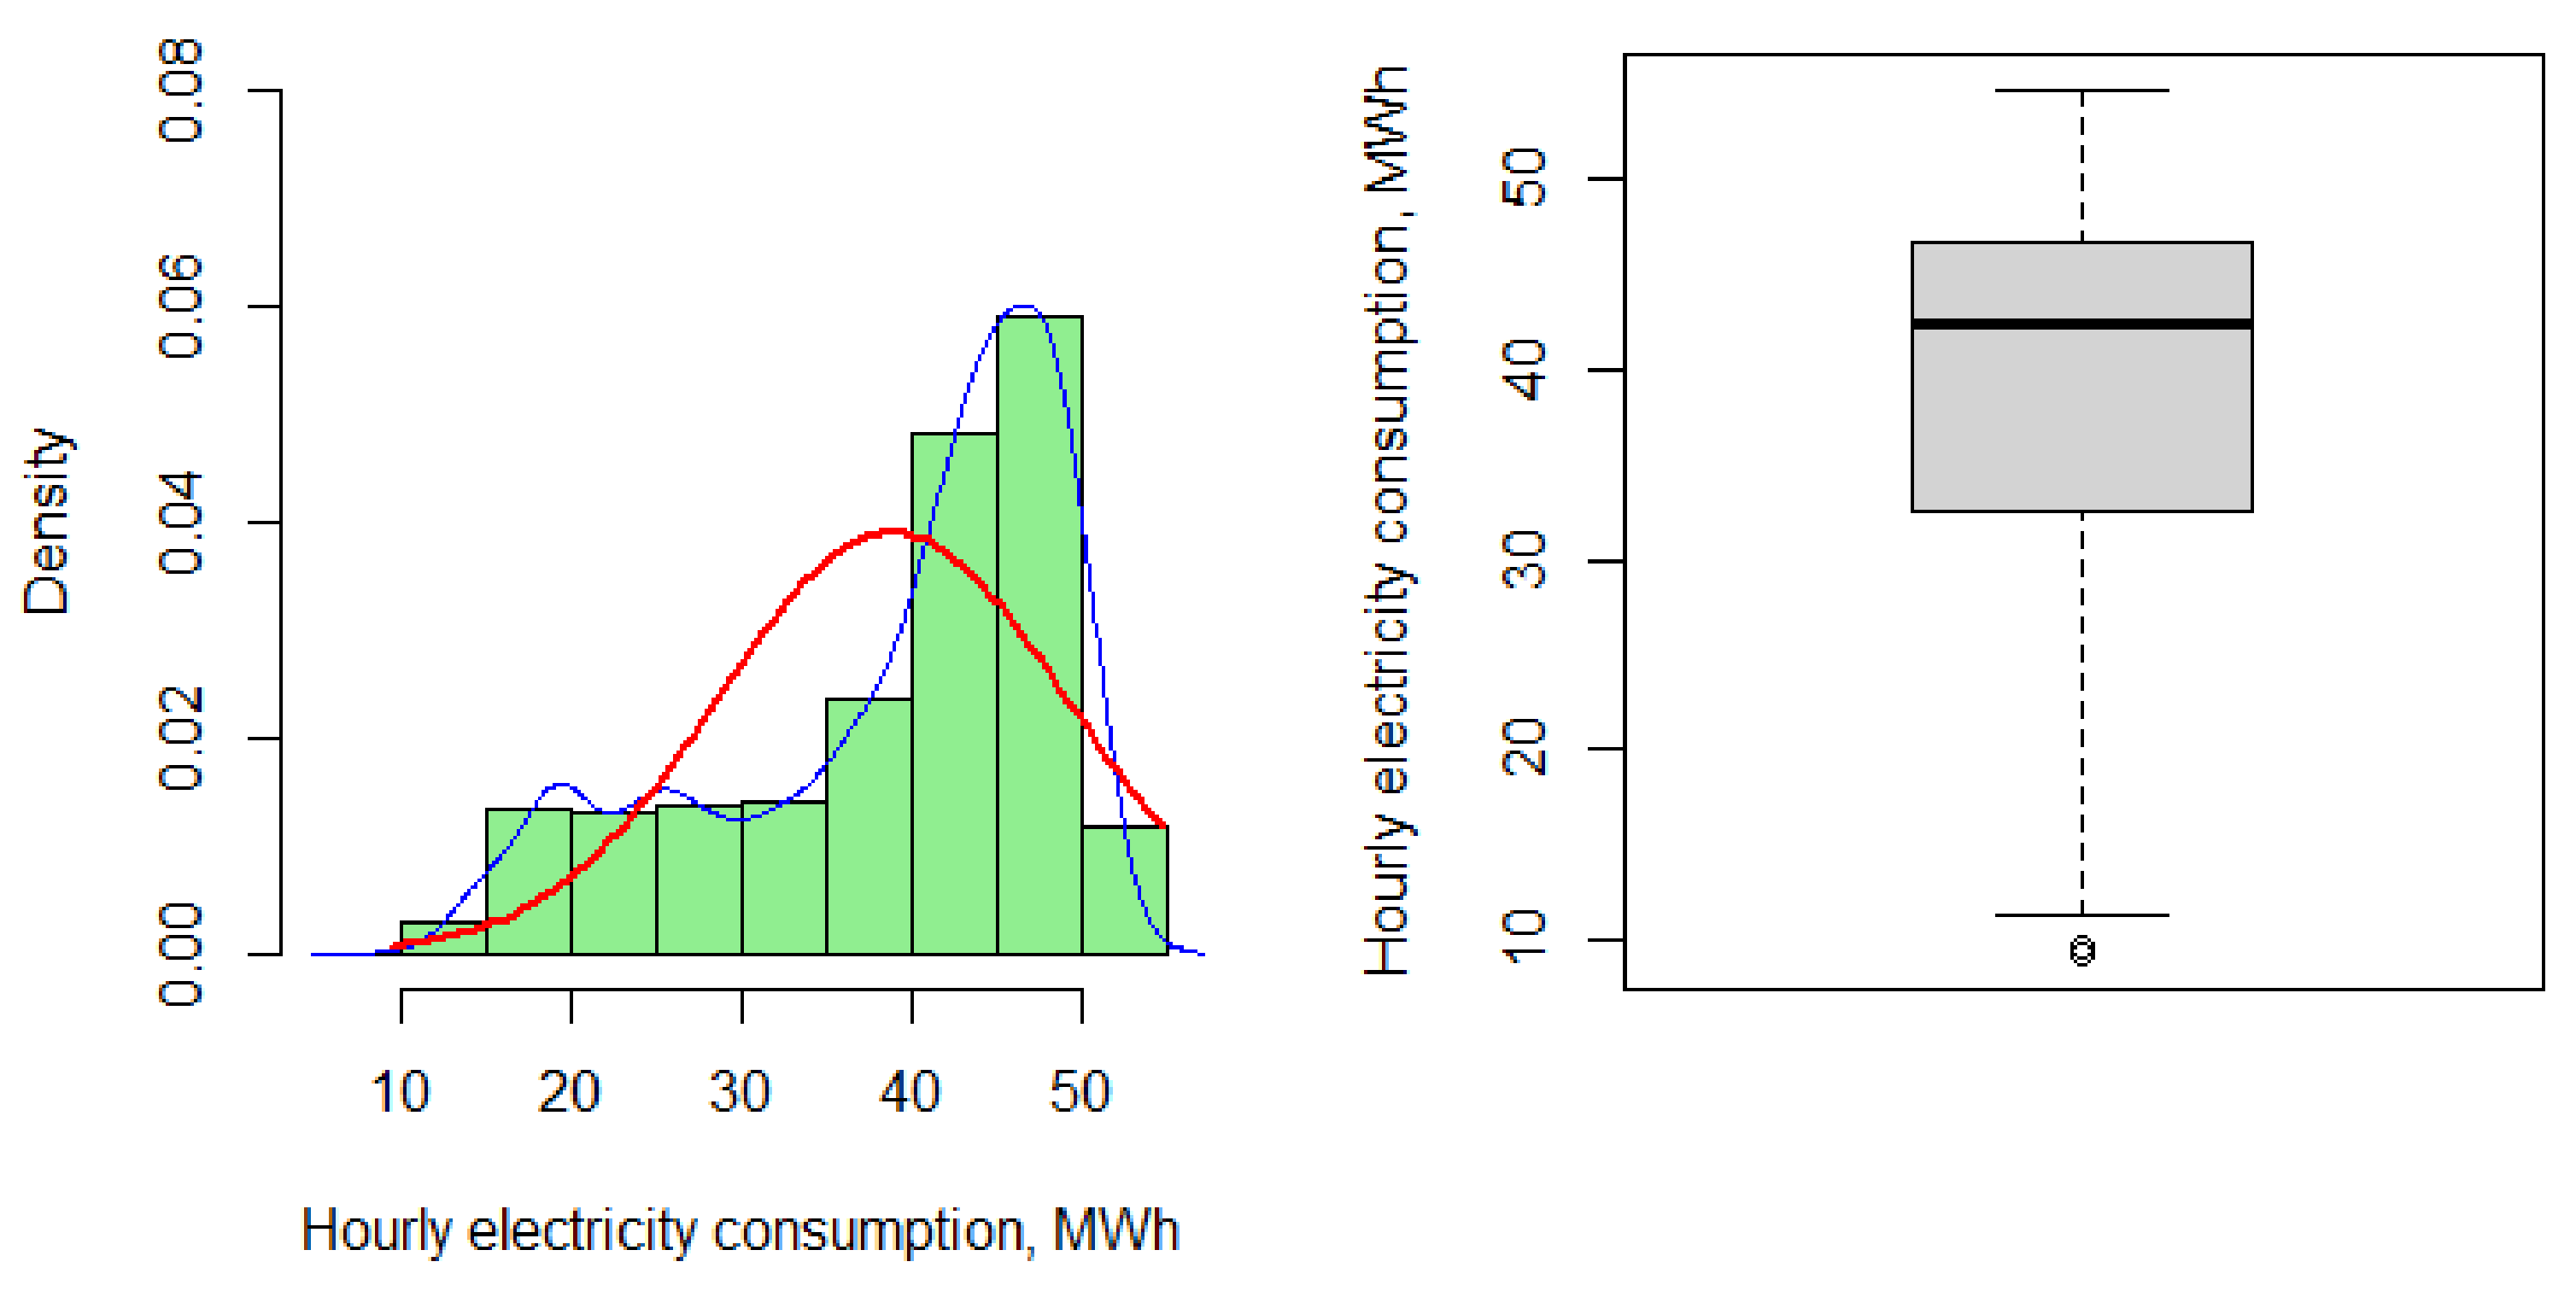
In research objects M1, M2 and M4, the average value of the hourly electricity consumption was lower than the median, and therefore, more observations were on the right side of average value, which indicated a left asymmetry of the empirical distribution. The concentration of the empirical distribution (kurtosis) was below 3, which means that they were platocurtic distributions, and the values of the variable were less concentrated than with the normal distribution.
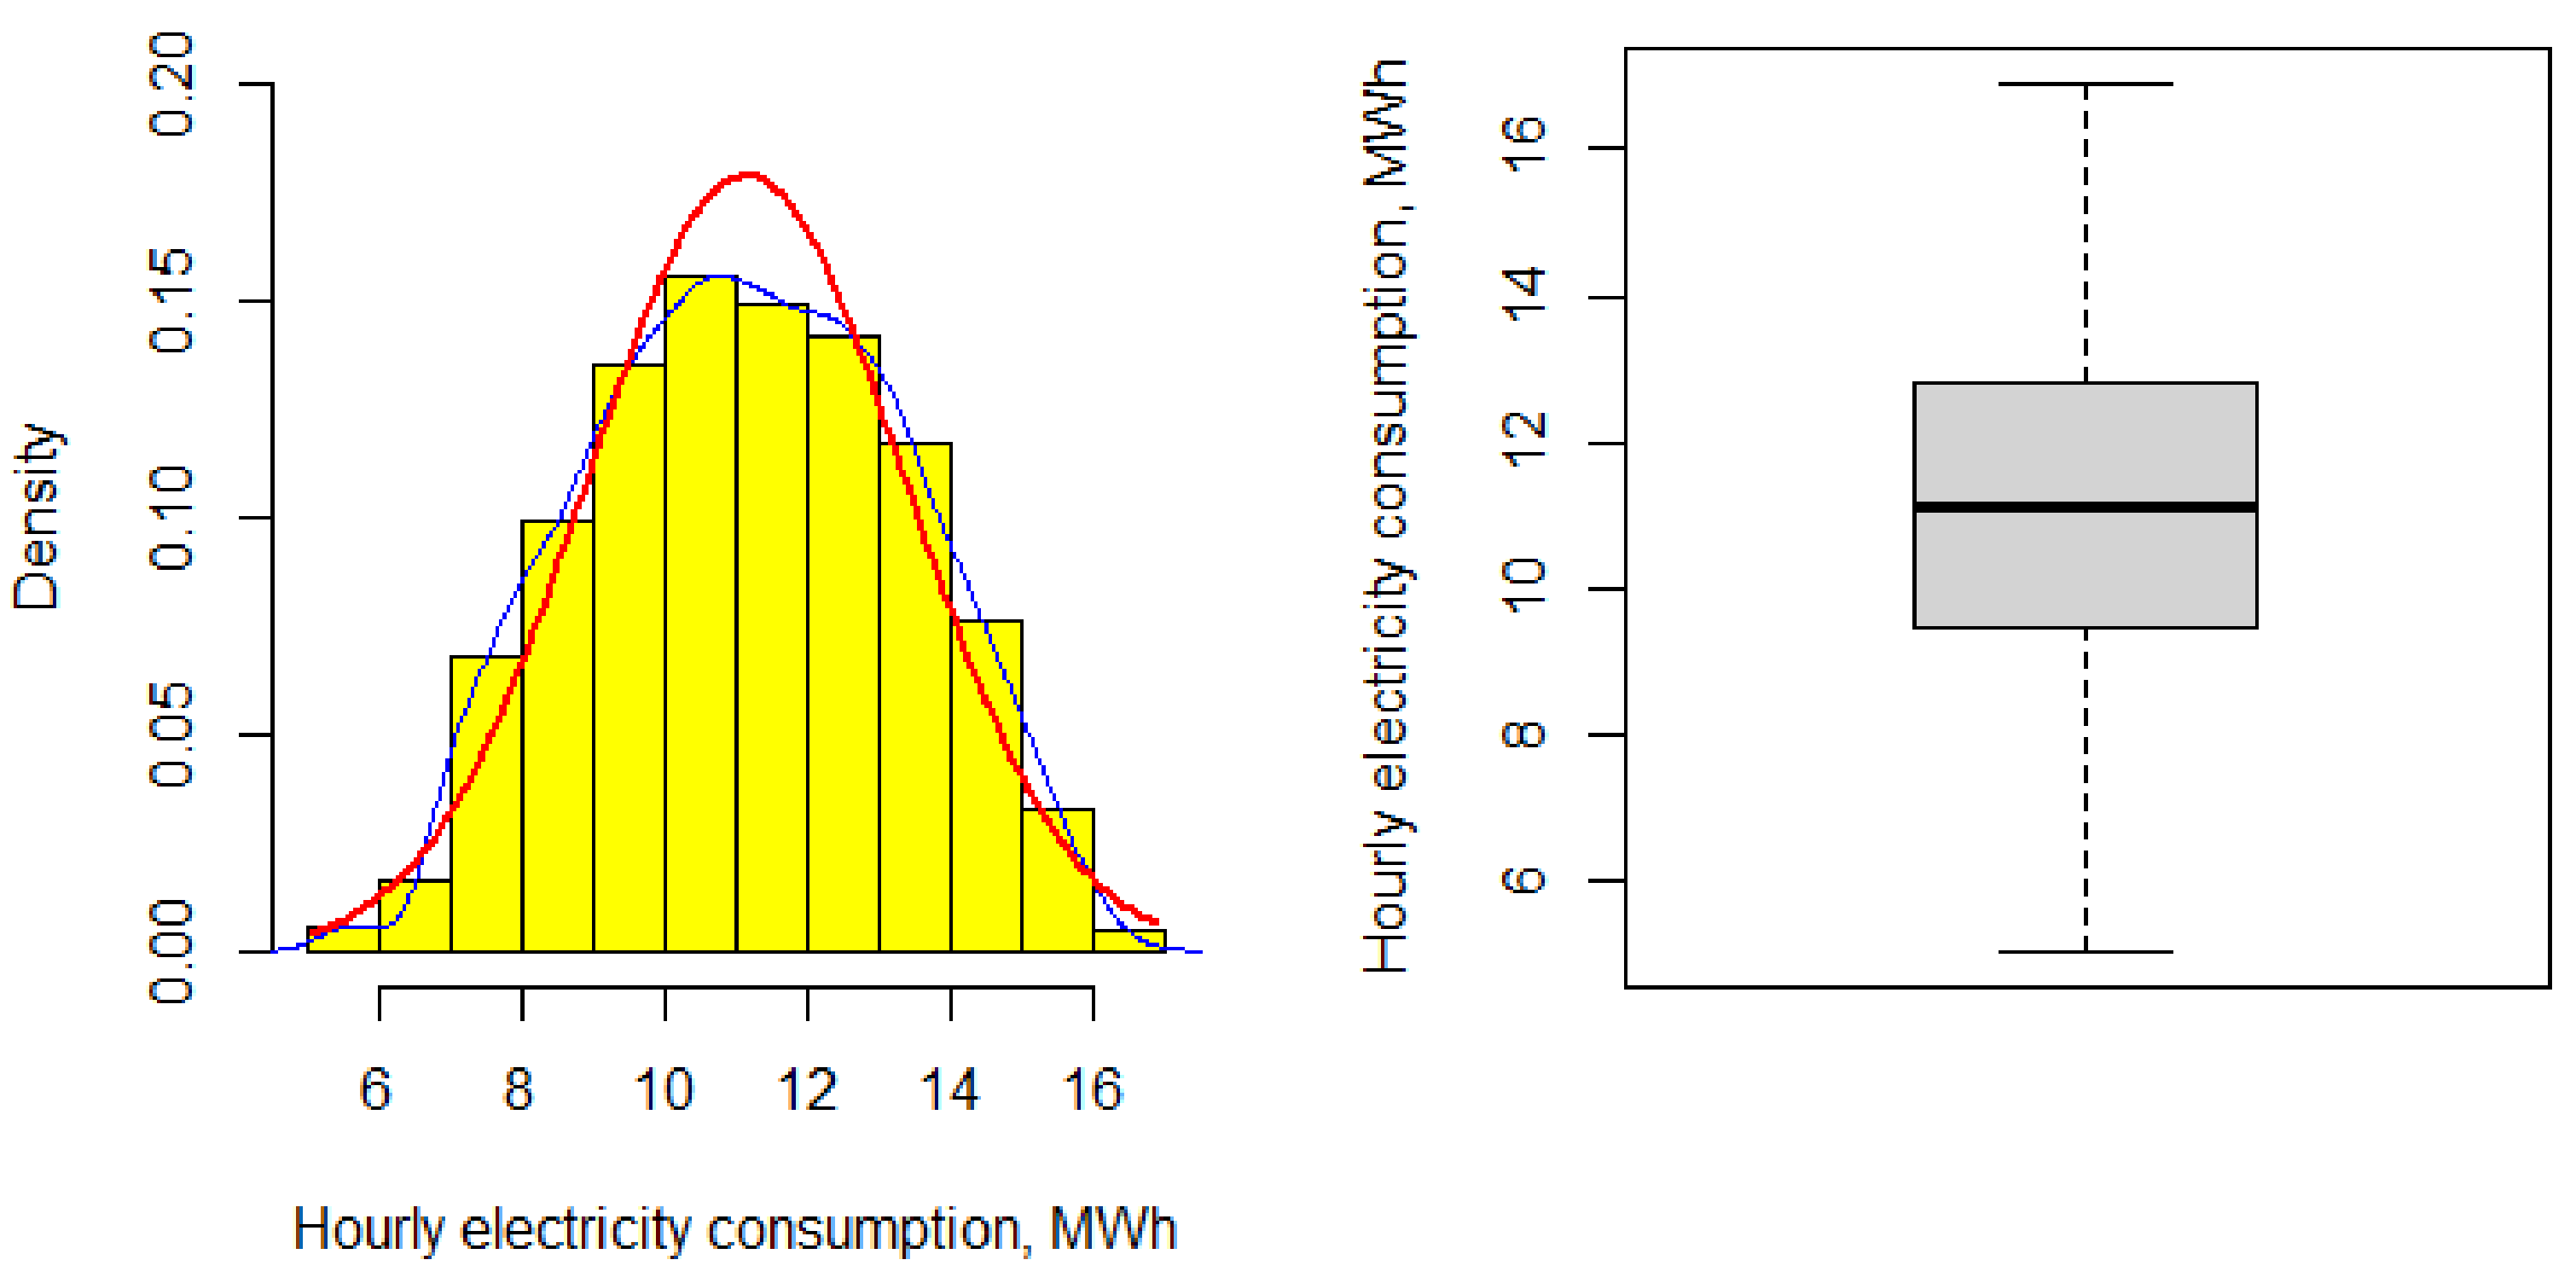
In the case of M3, the mean and median values were equal, which, in the context of skewness, means the convergence of the empirical distribution with the normal distribution. This was confirmed by the values of the distribution dispersion measures. The skewness value was close to zero. However, the value of the kurtosis coefficient was below 3, which means that values of the variable were less concentrated than in the case of the normal distribution, and it was not exactly a mesokurtic distribution but only close to a normal distribution.
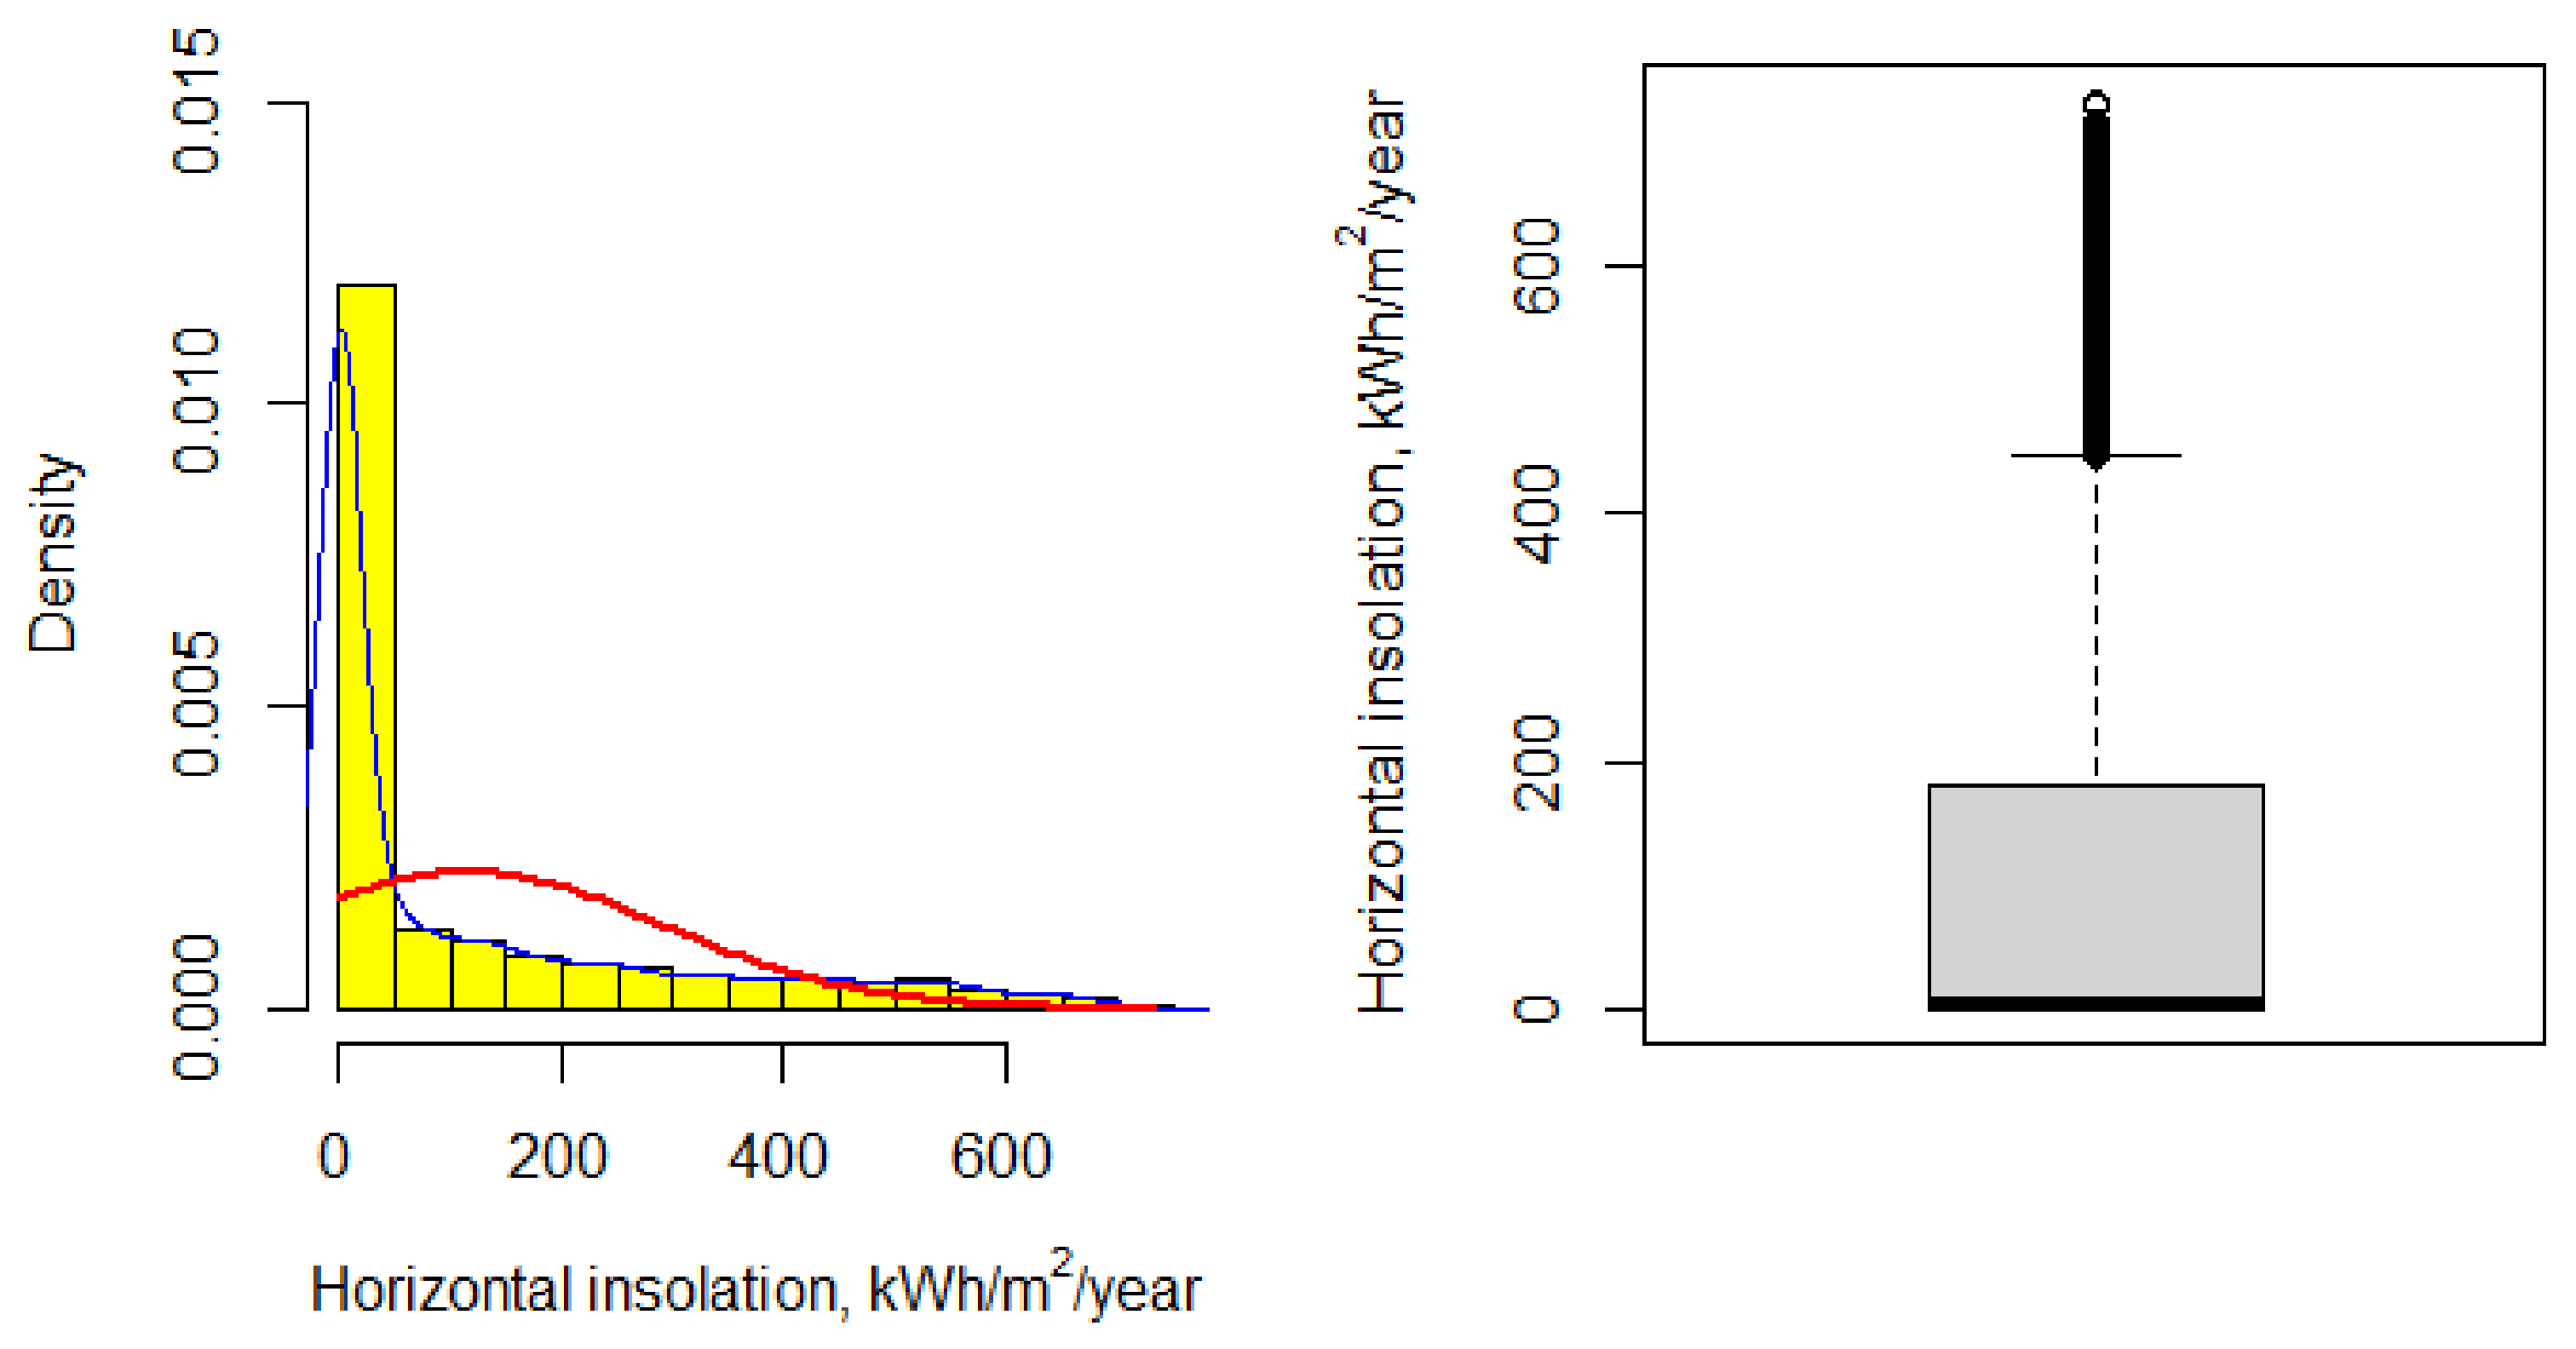
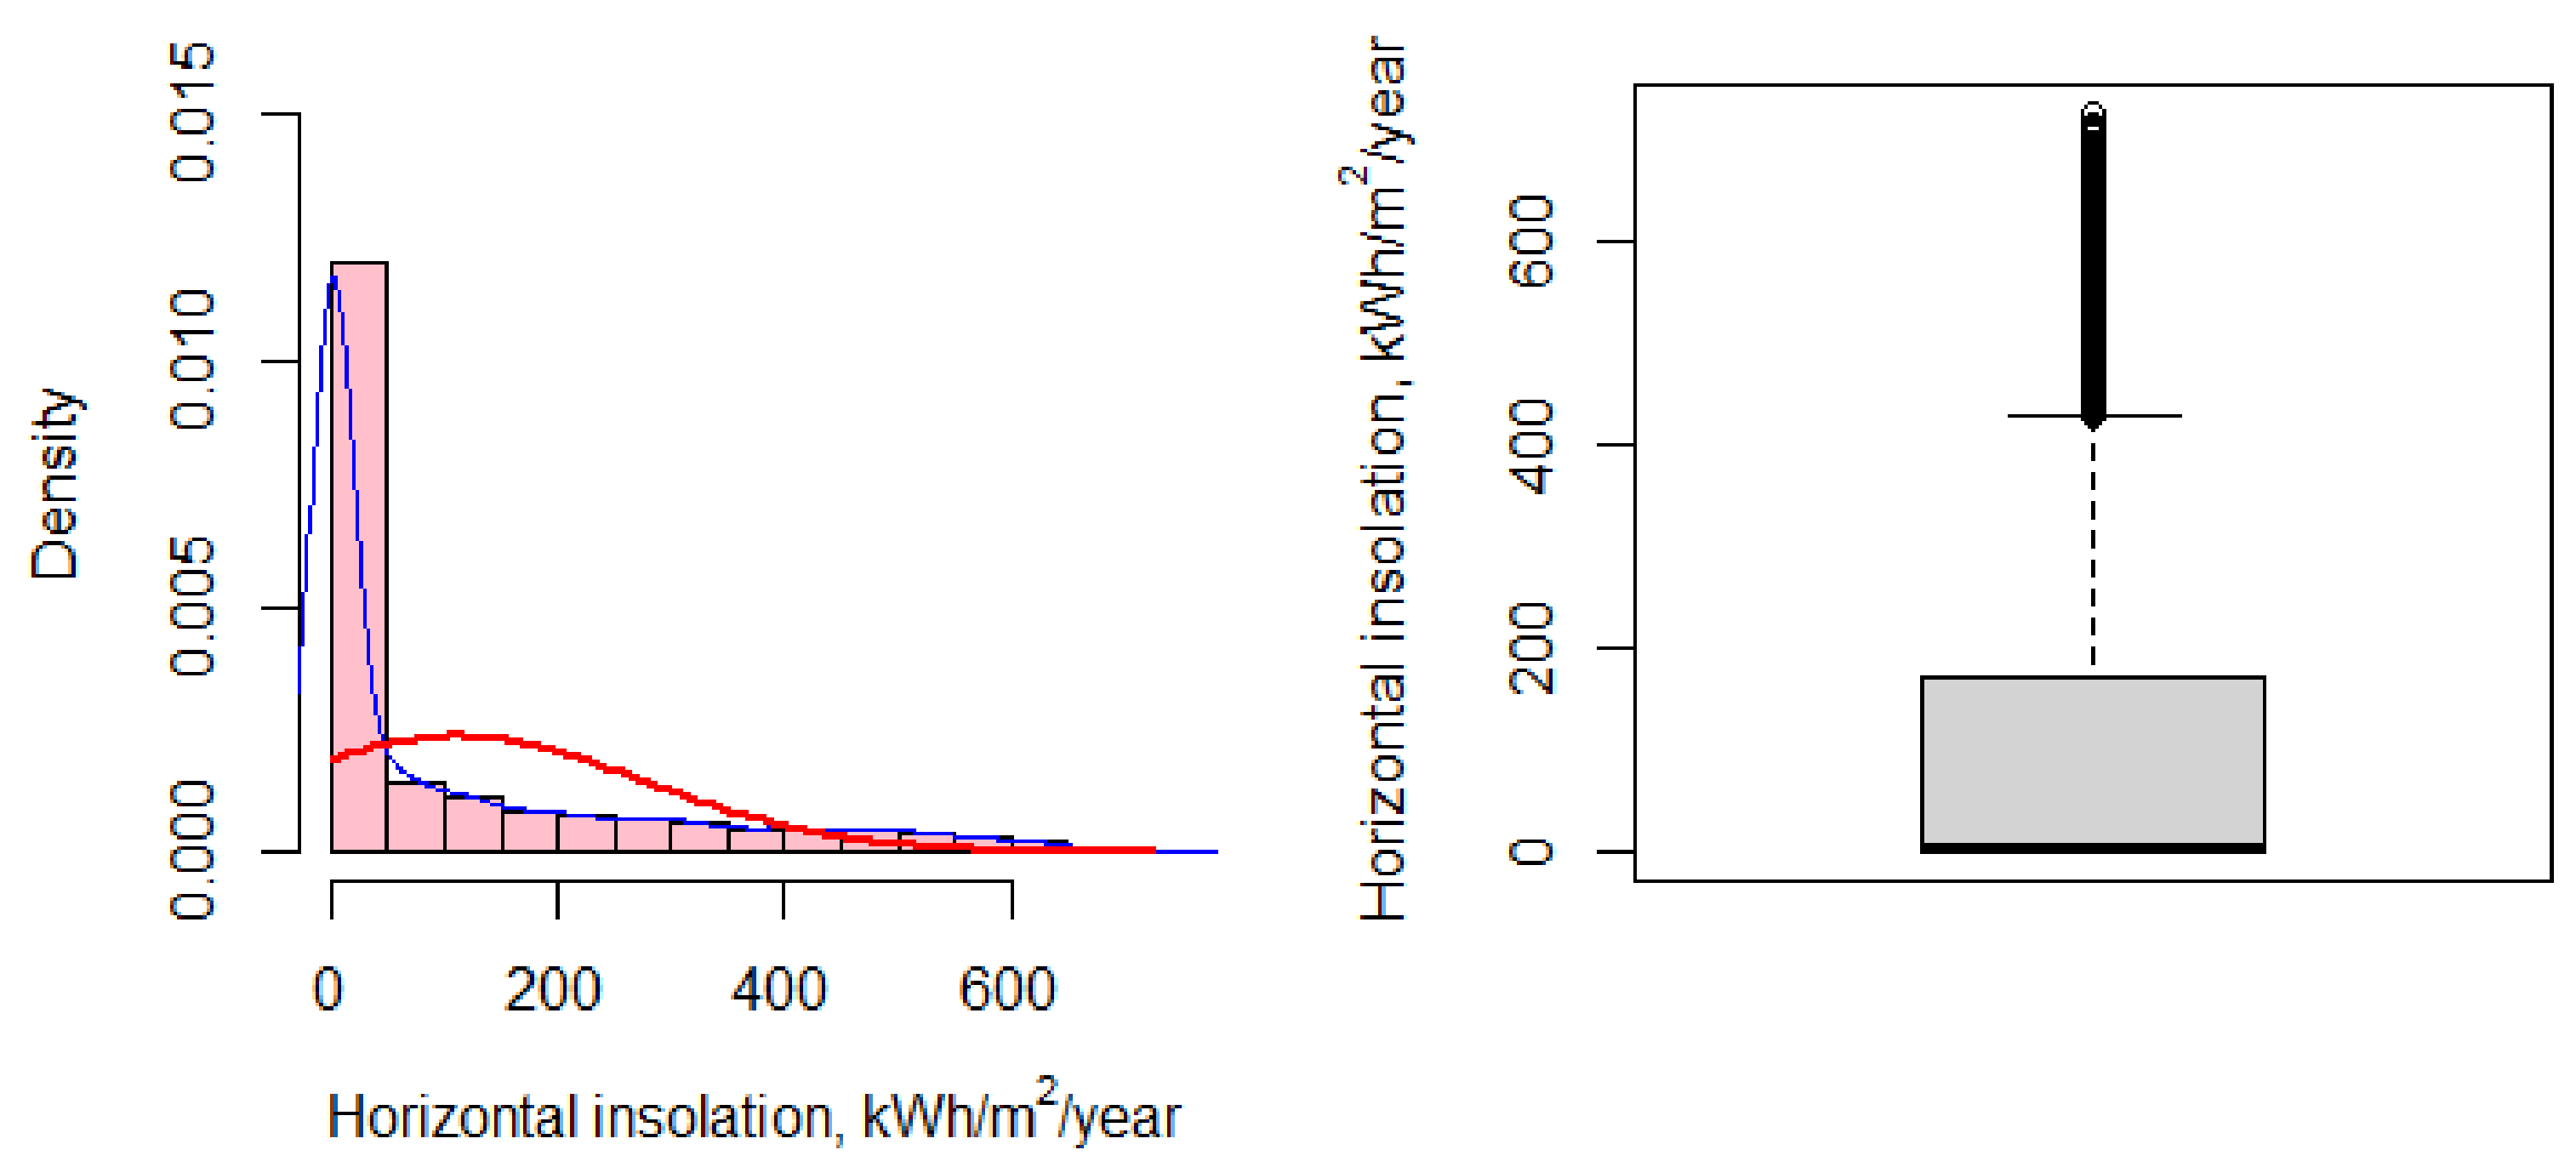
In the case of insolation conditions in the locations of the analyzed case studies, the distribution of the variables, due to numerous occurrences of zero and close-to-zero values, showed a strong left asymmetry. They were also leptokurtic distributions, as the value of the kurtosis coefficient was over 4 [31]. Additionally, literature sources indicated that the empirical distribution of horizontal insolation did not show similarity to the normal distribution and was best approximated by the beta distribution [32,33,34,35,36]. The sources also indicated that, for some seasons and latitudes, the empirical distribution may be approximate to the Weibull distribution [33,36,37,38] commonly used for wind speed analyses, as well as the log-normal [33] or gamma distribution [33,35].
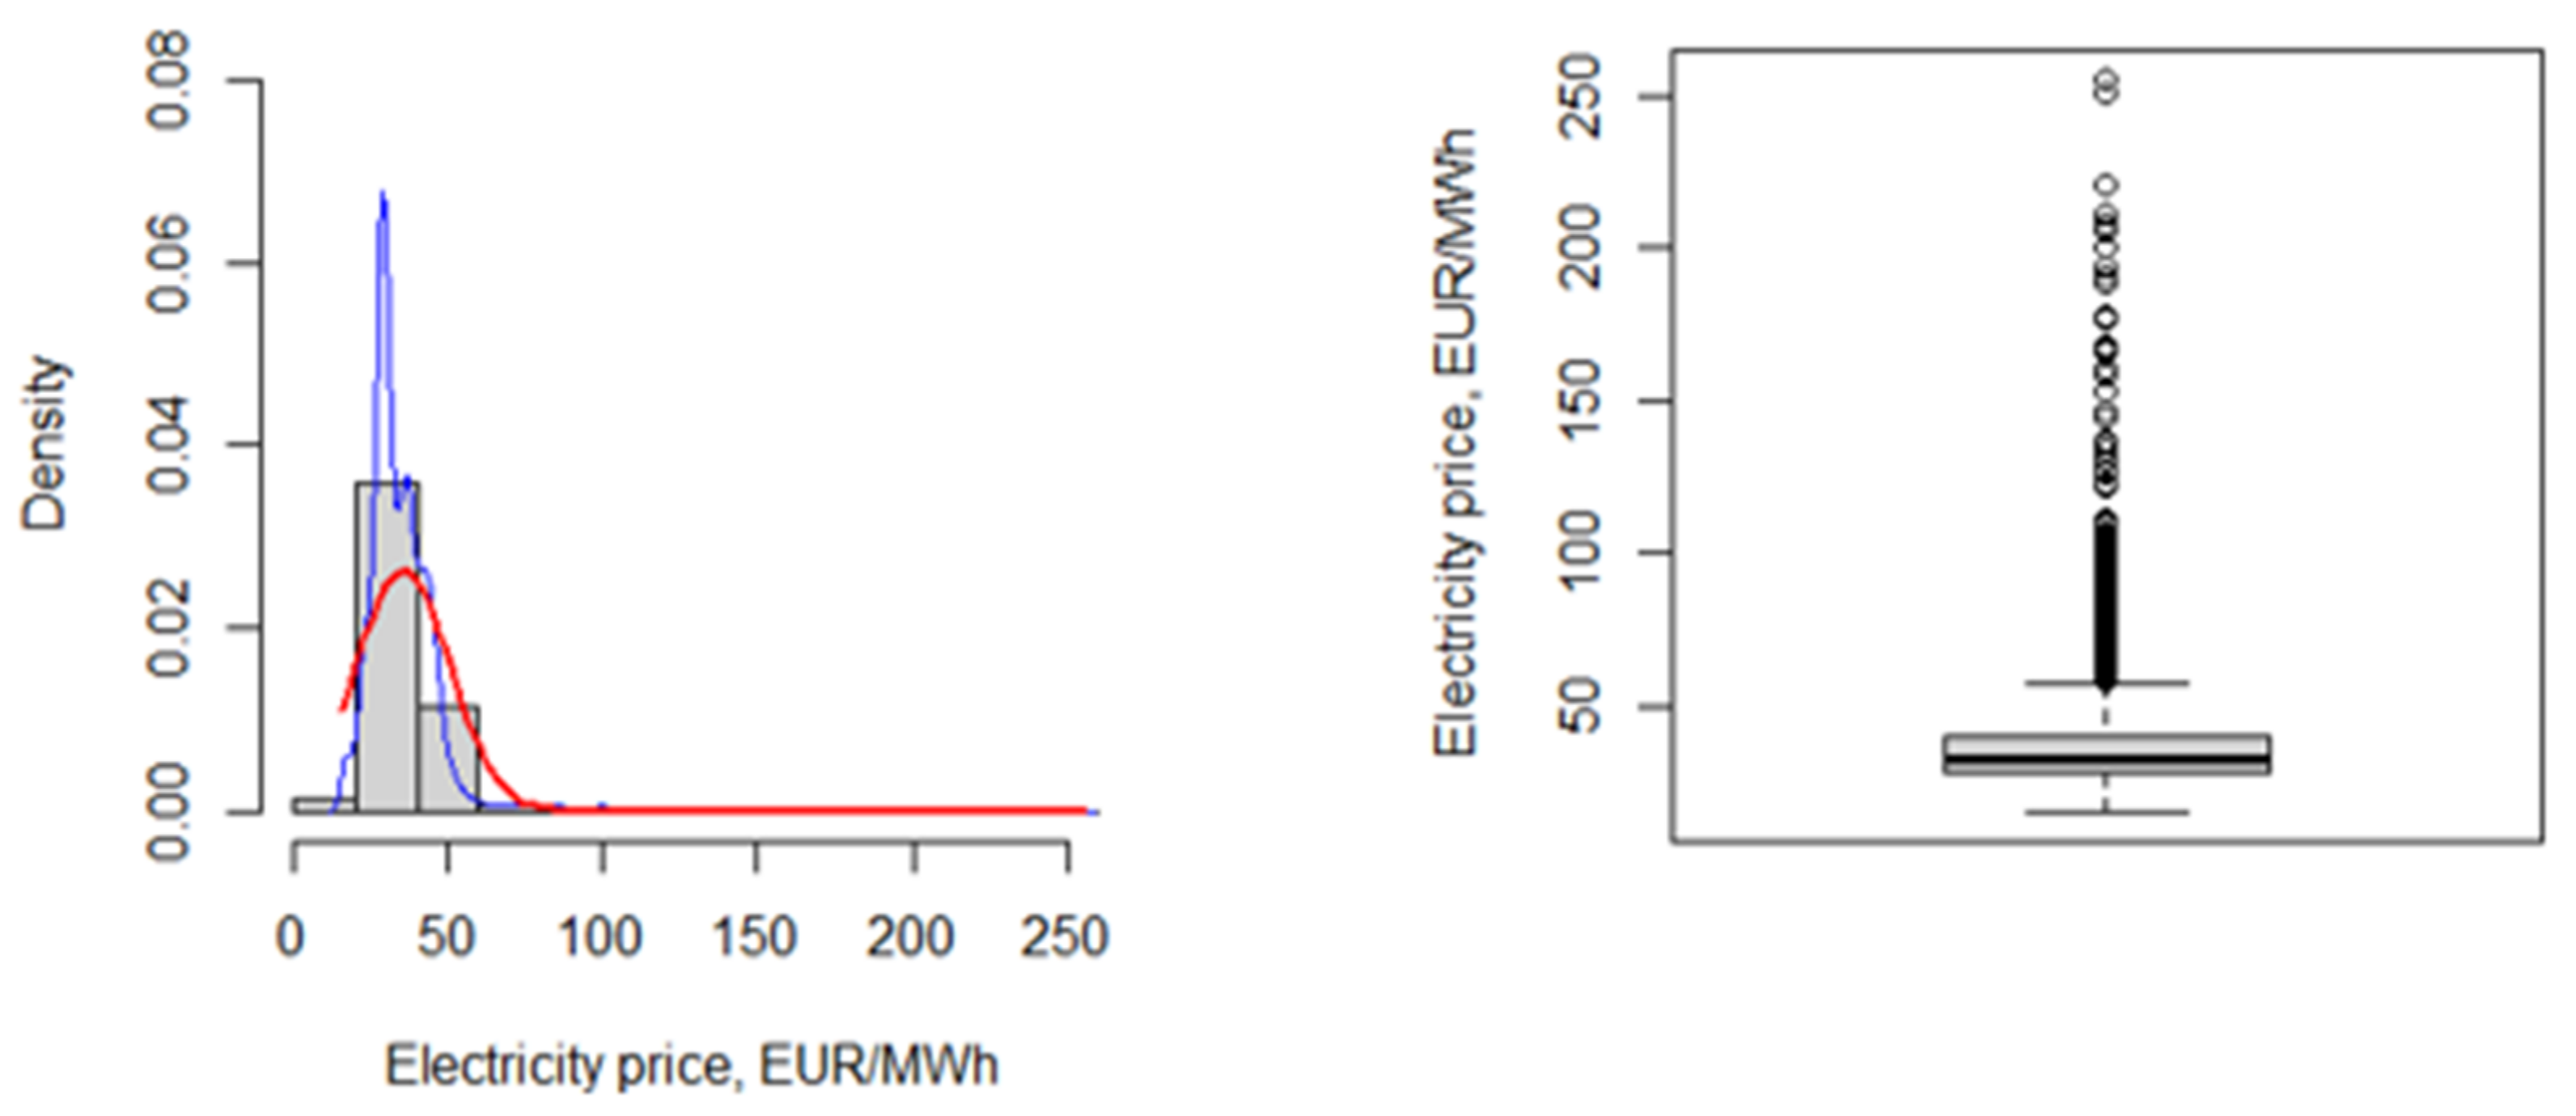
The distribution of electricity prices showed a positive skewness, which was confirmed by the positive value of the skewness coefficient. Moreover, it was a strongly leptokurtic distribution, as the value of the kurtosis coefficient was over 54. The values were strongly concentrated around the measures of central tendency.
4.2. Graphical Representation of the Distributions of the Analyzed Variables
An important element of the descriptive analysis of data is the shape of its distribution, providing information about the frequency of occurrence of the variable’s value in various areas of its variability [27]. For a complete description of the variable, it is necessary to analyze the statistical plots—in particular, the histogram and the whisker box plot (Figure 8, Figure 9, Figure 10, Figure 11, Figure 12, Figure 13 and Figure 14) [39].

Figure 8.
Graphical representation of the distribution of hourly electricity consumption for the M1 object. Source: own study in the RStudio environment.
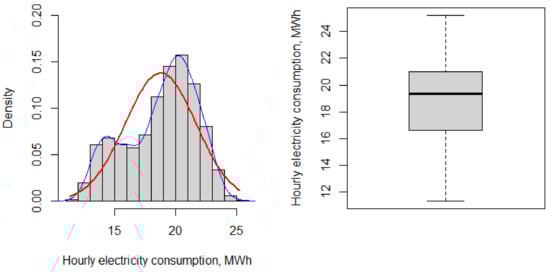
Figure 9.
Graphical representation of the distribution of hourly electricity consumption for the M2 object. Source: own study in the RStudio environment.
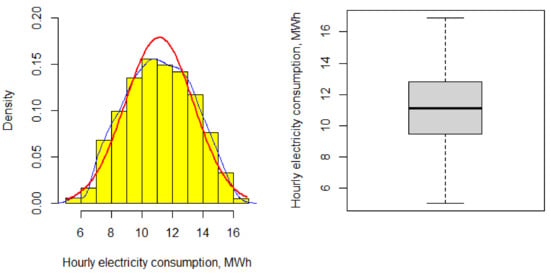
Figure 10.
The graphical representation of the distribution of hourly electricity consumption for the M3 object. Source: own study in the RStudio environment.
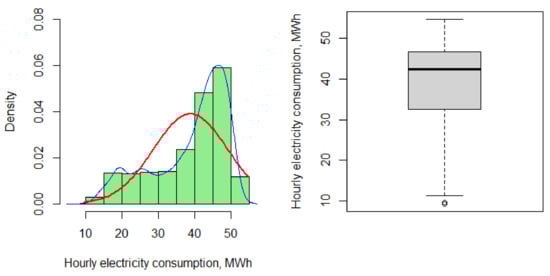
Figure 11.
Graphical representation of the distribution of hourly electricity consumption for the M4 object. Source: own study in the RStudio environment.
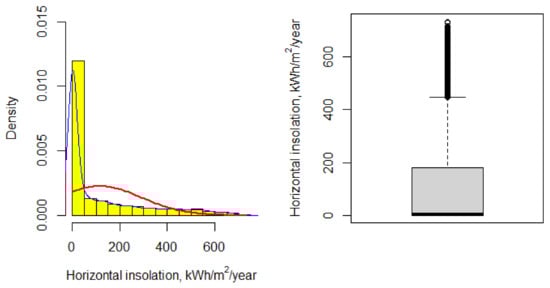
Figure 12.
The graphical representation of the distribution of hourly insolation in the horizontal location of objects M1, M2 and M3. Source: own study in RStudio environment based on ERA5-Land data.
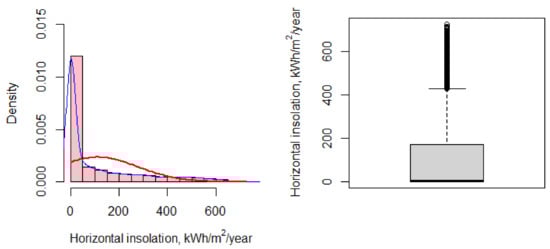
Figure 13.
The graphical representation of the distribution of hourly insolation in the horizontal location of the M4 object. Source: own study in RStudio environment based on ERA5-Land data.
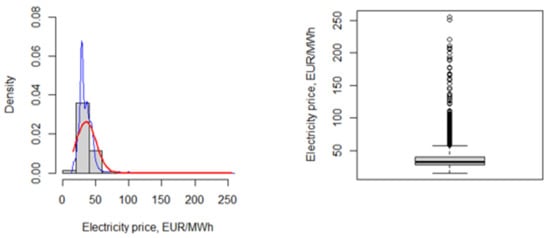
Figure 14.
The graphical representation of the distribution of the hourly electricity prices on the Day-Ahead Market in the Polish Power Exchange in 2018. Source: own study in RStudio environment based on Polish Power Exchange data.
4.3. The Results of the Study of the Correlation between the Analyzed Variables
Correlation Analysis in the Context of the Environmental Efficiency
The values of the correlation coefficient between the hourly values of the volume of electricity consumption and insolation per year for the M2 and M3 cases were close to zero (no correlation). For cases M1 and M4, the Spearman rho correlation coefficients indicate the existence of only a weak nonlinear relationship between the variables (Figure 15 and Table 2). Interestingly, in the case of M1, the correlation was negative, which may indicate a provision of the DSR stabilization services by this enterprise and/or using cheaper, off-peak electricity to conduct production processes, the delay of which is technologically possible.
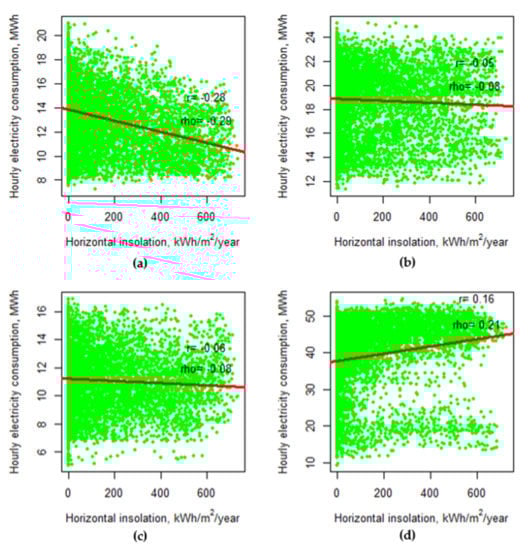
Figure 15.
Correlation between the hourly values of horizontal insolation and electricity consumption for the analyzed case of the research objects: (a) M1, (b) M2, (c) M3 and (d) M4. Source: own study in the RStudio environment.
Table 2.
Values of the correlation coefficient between the hourly volumes of electricity consumption and horizontal insolation per year (8760 h) in 4 analyzed cases of mines.
In the case of M4, however, the presence of a positive, relatively weak monotonic nonlinear relationship was visible, which was also reflected in the value of the Spearman’s rho coefficient being slightly higher compared to the Pearson r coefficient. This relationship was underestimated by the set of outliers located in the lower part of the graph. Their occurrence was associated with the adopted system of organization of the work—the lack of a standard occupancy on Sundays and public holidays from work. A typical week is also shown in Figure 7. This enterprise was also characterized by the consumption of significant amounts of electricity during periods of peak demand in the national grid, i.e., at prices much higher than the average. This was confirmed by the concentrations of the observations (high energy consumption with high energy prices) in the upper part of the point cloud in Figure 16.

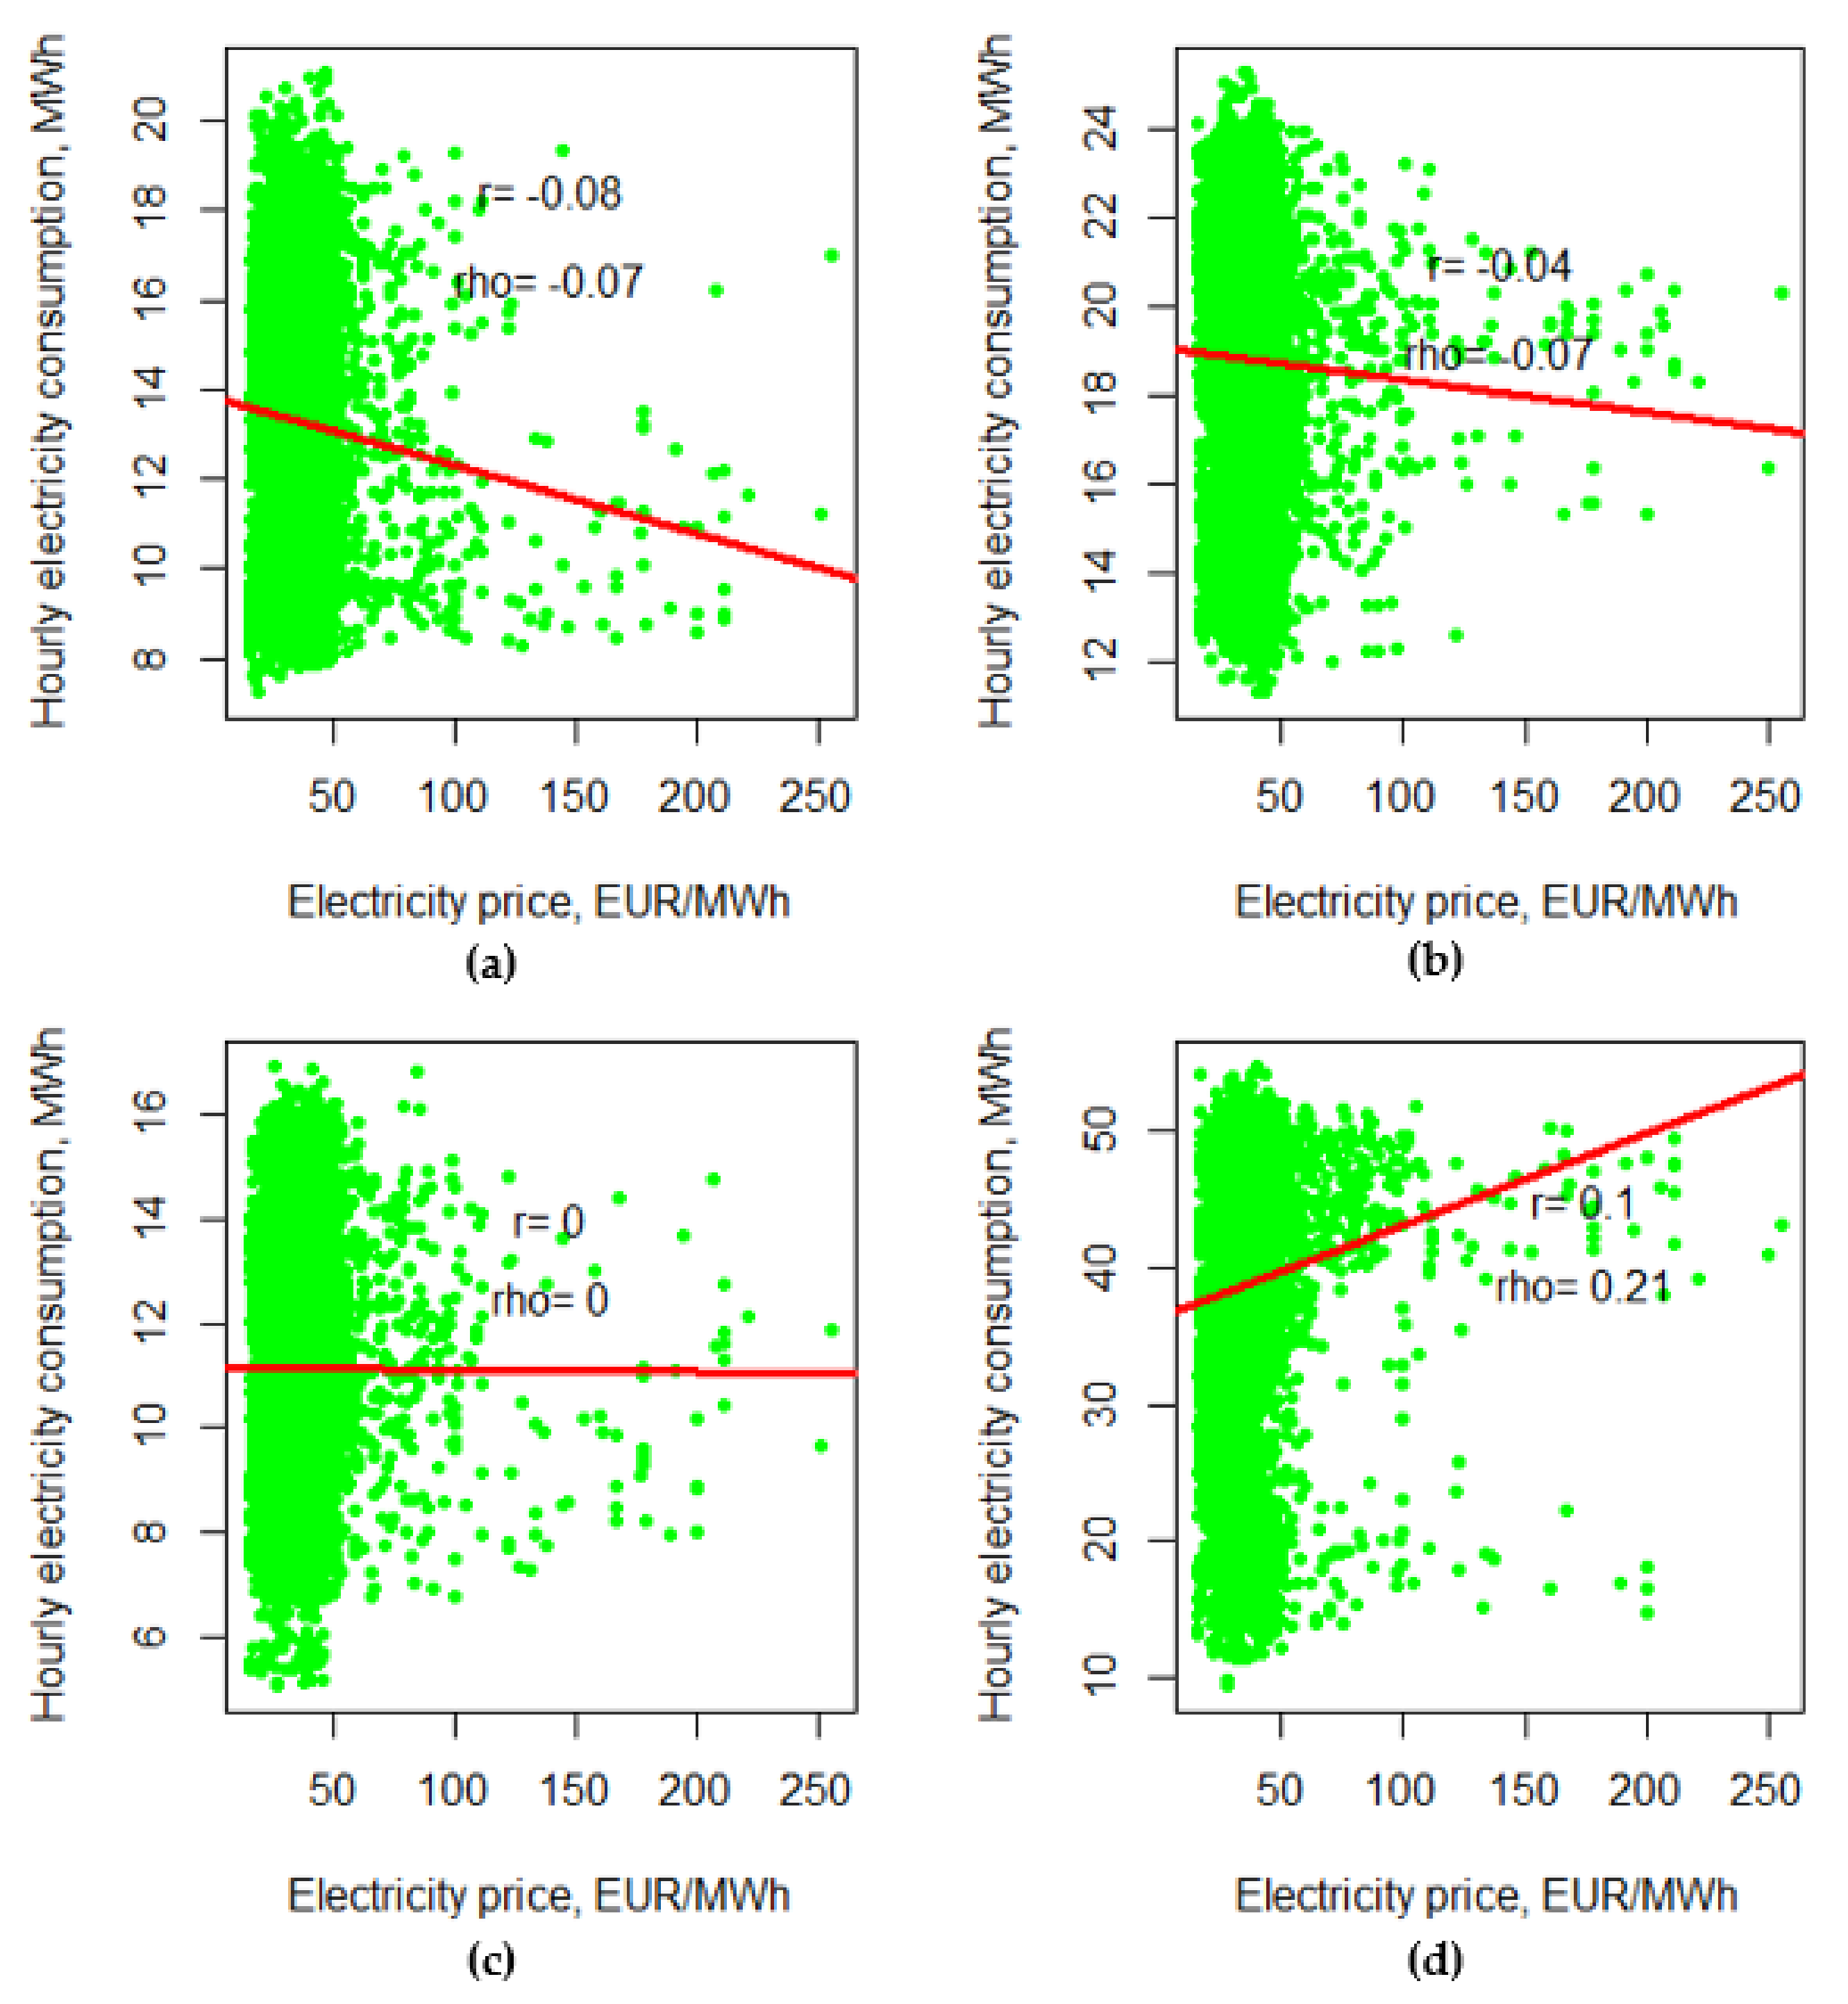
Figure 16.
Correlation between the hourly electricity prices and electricity consumption for the analyzed case of the research objects: (a) M1, (b) M2, (c) M3 and (d) M4. Source: own study in the RStudio environment.
The correlation analysis carried out for individual months (Table 3 and Table 4) showed that, for the M1 case, the highest (absolute) values of the correlation coefficient were recorded in the summer months (July and August), i.e., in the period of the highest electricity prices in the national grid based mainly on power plants powered by solid fuels.
Table 3.
Values of the Pearson r linear correlation coefficient between the values of electricity consumption and horizontal insolation in individual months in 4 analyzed cases of mines.
Table 4.
Values of the Spearman rho correlation coefficient between the values of electricity consumption and horizontal insolation in individual months in 4 analyzed cases of mines.
The highest value of the Spearman’s rho coefficients achieved in the case of M4 in August was related to the high consumption of electricity by air-conditioning devices, due to the great depth of mining exploitation.
A graphical analysis of the data distribution indicated the existence of, at most, a very weak, monotonic nonlinear relationship between the variables. In the case of the analysis of the relationship between the price of electricity and its consumption in individual mines (Figure 16), a very weak nonlinear correlation was visible only in the case of M4. The accumulation of points in the right part of the chart (consumption of 40–50 MWh/h at prices above EUR 50/MWh) indicated the consumption of significant volumes of relatively expensive energy. Additionally, reanalyzing Figure 4a, it can be seen that this situation occurs mainly in the summer period, when the potential PV source would work with high productivity.
4.4. Correlation Study in the Context of Economic Efficiency
The analysis carried out in the second context, i.e., the economic efficiency of using a potential PV source in the analyzed enterprises in order to cover their own energy needs, showed the existence of stronger correlations between the examined variables than in the first approach. These impacts present greater linearity, which is confirmed by both the graphical representation and higher achieved values of the Pearson r correlation coefficient than of the Spearman rho correlation (Figure 17 and Table 5). On a monthly basis (Table 6 and Table 7), in some cases, the correlation coefficients reach values above 0.4, which allowed us to define the strength of the correlation as moderate.
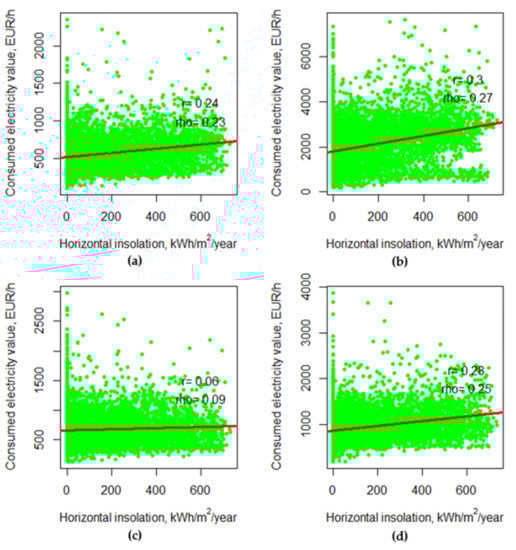
Figure 17.
Correlation between the hourly values of horizontal insolation and the value of the volume of electricity consumed for the analyzed case of the research objects: (a) M1, (b) M2, (c) M3 and (d) M4. Source: own study in the RStudio environment.
Table 5.
Values of the correlation coefficients between the hourly values of the volumes of electricity consumed and the horizontal insolation per year (8760 h) in 4 analyzed cases of mines.
Table 6.
Values of the Pearson r correlation coefficient between the value of the volume of electricity consumed and horizontal insolation in the individual months in 4 analyzed cases of mines.
Table 7.
Values of the Spearman’s rho correlation coefficient between the value of the volume of electricity consumed and horizontal insolation in the individual months in 4 analyzed cases of mines.
On an annual basis, only in the case of M1, there was no correlation between the value of the volume of electricity consumed in each hour and the value of horizontal insolation. A weak correlation was found in the cases of M2, M3 and M4. It is worth noting that, in the cases of M2 and M3, a weak positive correlation was noted between the value of electricity volumes consumed and insolation, despite the lack of correlation both between the energy consumption and the price of energy, as well as the energy consumption and insolation studied in the first context. The highest values of the correlation coefficients were recorded in the summer months (June and August) and in February. Except in one case (November, case study M1), the correlation coefficients reached only positive values.
It is worth mentioning that the results of the correlation analysis carried out in the second approach should be approached with wariness due to the volatility and the low probability of a repeat of the price conditions from the analyzed year. On the other hand, insolation conditions may, to a large extent, repeat in the following years, i.e., during the operation of a potential PV installation.
However, the volatility of market prices of electricity probably means no possibility of repeating such correlations in the coming years. With regards to the adopted climate policy, a further increase in electricity prices in Polish conditions seems to be inevitable, as evidenced by the prices in mid-2021 [40]. However, the scale of further increases [41,42] and the daily price fluctuation remain unknown. The dynamics of further increases in PV power (oversupply and decline in PV electricity prices on sunny days) and the development of energy storage technologies will also be significant. Nevertheless, from the point of view of an industrial entrepreneur, an increasing independence from risk and the market environment is a strategic issue.
Additional justification for the interest in using PV sources for their own needs by industrial enterprises may also result from analyzes carried out by other researchers. Malvoni et al. [43] performed a statistical analysis of electricity consumption in an Italian company in terms of the use of photovoltaics. The share of PV energy was determined at 22%. Ossowska and Janiszewska [44] conducted an analysis of energy consumption in the European Union, taking into account renewable energy. They showed the need to increase the production of energy from RES in order to reduce consumption (especially fossil fuels), as well as for climate and environmental purposes. Malec et al. [45] conducted an analysis of the changes in energy consumption in various industries in Poland. There were also differences in the amount of energy consumed depending on social conditions (e.g., SARS-CoV-2). Canales et al. [15] conducted an analysis of the increase in the availability of renewable energy over the years, which is a promising premise given the growing energy prices and the growing energy consumption in mining enterprises.
It should be noted that the future of mining companies is uncertain (especially in the area of hard coal), but PV installation may remain at the installation site and produce energy, as it has a good quality power connection. This is due to the increase in electricity consumption and environmental awareness of society, as well as the observed slight increase in access to solar energy (e.g., due to the reduction of dust in mining regions).
5. Conclusions
This article analyzed the data on electricity consumption from four cases of enterprises operating in the mining sector. It showed that there was no or weak correlation between electricity consumption and insolation.
In the analyzed period, the highest value of the correlation coefficient between electricity consumption and insolation was achieved for the M4 case, for which the positive Spearman rho correlation was 0.21. On the other hand, the highest value of the negative Spearman rho correlation at the level of −0.29 was achieved for the M1 case, with the maximum value on a monthly basis in August at −0.35.
In the case of the analysis of the correlation between the monetary value of electricity consumed and insolation, i.e., the volume of consumption weighted with the price of energy, the existence of slightly stronger and more linear relationships was identified. In monthly terms, the highest correlation value at the level of 0.48 was achieved for the M2 case in June and 0.43 in August and February. On an annual basis, the Pearson r correlation value for this case study was 0.28. The highest value of the Pearson r correlation in annual terms at the level of 0.30 was recorded for the case of M4 and one of the highest monthly indicators, 0.42, in August.
Both cases had the highest potential use of photovoltaic installation, even without energy storage. This conclusion could be formulated due to the impact of the use of air-conditioning devices and their share in the demand for electricity in the period of the highest productivity of PV sources during the year. At the same time, in the conditions of the Polish energy sector, it is the period of the highest electricity prices. There is a hypothetical possibility that, in the longer term, the price trend will change due to price pressure resulting from a large increase in the installed capacity in PV sources.
The use of photovoltaics for their own needs is particularly justified in the case of the M4 mine case study. Currently, due to the adopted production shift scheme, a significant increase in demand from 7 to 11 a.m. was noticeable. For this reason, the M4 mine contributed to the generation of the morning peak in the national power grid. The use of its own PV installation with a partially east orientation had a stabilizing impact on the operation parameters of the power grid (flattening the resultant electricity demand profile of the mine).
The case of M1 exhibited the highest volumes of consumption of electricity during the off-peak demand in the national grid. Therefore, there is a potential for introducing organizational and technological changes in this enterprise in order to increase the adjustment of its demand profile to the profile of electricity production from photovoltaics.
On the other hand, in the cases of M2 and M4 shown above, there was a potential way to reorganize the work in order to increase the degree of self-consumption of electricity from the PV source. The reorganization of the production process could include the postponement of some subprocesses, the delay of which is technologically possible (water pumping, vertical transport and mechanical processing of minerals), to the period of high PV productivity. Thus, it could lead to an even better fit of their energy consumption profiles to the generation profile of the PV source.
Author Contributions
Conceptualization, P.O. and S.K.; methodology, P.O. and S.K.; software, S.K.; validation, S.K.; formal analysis, S.K. and P.O.; investigation, S.K.; resources, S.K. and P.O.; data curation, S.K. and P.O.; writing—original draft preparation, S.K.; writing—review and editing, P.O. and M.S.; visualization, S.K.; supervision, P.O.; project administration, P.O. and M.S. and funding acquisition, P.O. and M.S. All authors have read and agreed to the published version of the manuscript.
Funding
This research received no external funding.
Institutional Review Board Statement
Not Applicable.
Informed Consent Statement
Not Applicable.
Data Availability Statement
Not Applicable.
Conflicts of Interest
The authors declare no conflict of interest.
References
- PSE. Summary of Quantitive Data on the Functioning of the National Power System in 2020. 2021. Available online: https://www.pse.pl/web/pse-eng (accessed on 7 August 2021).
- IRENA. Renewable Energy Statistics. 2021. Available online: https://www.irena.org/-/media/Files/IRENA/Agency/Publication/2021/Apr/IRENA_RE_Capacity_Statistics_2021.pdf (accessed on 7 August 2021).
- IRENA. Energy Transition Innovation. 2017. Available online: https://www.irena.org/-/media/Files/IRENA/Agency/Publication/2017/Jun/IRENA_Energy_Transition_Innovation_2017.pdf (accessed on 12 August 2021).
- Lu, Q.; Zhang, Z.; Lü, S. Home energy management in smart households: Optimal appliance scheduling model with photovoltaic energy storage system. Energy Rep. 2020, 6, 2450–2462. [Google Scholar] [CrossRef]
- ENTSO-E. Generation By Fuel. Available online: https://www.entsoe.eu/ (accessed on 15 June 2021).
- Quandl. EUA Certificate Prices. Energy Instrat. 2021. Available online: //energy.instrat.pl/co2_prices (accessed on 20 August 2021).
- Typowe Lata Meteorologiczne i Statystyczne Dane Klimatyczne. Dane do Obliczeń Energetycznych Budynków. Available online: https://www.gov.pl/web/archiwum-inwestycje-rozwoj/dane-do-obliczen-energetycznych-budynkow (accessed on 15 June 2021). (In Polish)
- Lee, C.-Y.; Ahn, J. Stochastic modeling of the levelized cost of electricity for solar PV. Energies 2020, 13, 3017. [Google Scholar] [CrossRef]
- Paska, J.; Surma, T.; Terlikowski, P.; Zagrajek, K. Electricity Generation from Renewable Energy Sources in Poland as a Part of Commitment to the Polish and EU Energy Policy. Energies 2020, 13, 4261. [Google Scholar] [CrossRef]
- IRENA. Renewable Power Generation Costs in 2019; International Renewable Energy Agency: Abu Dhabi, United Arab Emirates, 2020; ISBN 978-92-9260-244-4. [Google Scholar]
- European Centre for Medium-Range Weather Forecasts (ECMWF). ERA5. Available online: https://www.ecmwf.int/en/forecasts/datasets/reanalysis-datasets/era5 (accessed on 15 June 2021).
- Copernicus Climate Change Service (C3S). ERA5: Fifth Generation of ECMWF Atmospheric Reanalyses of the Global Climate. Copernicus Climate Change Service’s Climate Data Store (CDS). 2017. Available online: https://cds.climate.copernicus.eu/#!/home (accessed on 5 April 2018).
- Zhou, S.; Wang, Y.; Zhou, Y.; Clarke, L.E.; Edmonds, J.A. Roles of wind and solar energy in China’s power sector: Implications of intermittency constraints. Appl. Energy 2018, 213, 22–30. [Google Scholar] [CrossRef]
- Kreft, W.; Filipowicz, M.; Żołądek, M. Reduction of electrical power loss in a photovoltaic chain in conditions of partial shading. Optik 2020, 202, 163559. [Google Scholar] [CrossRef]
- Canales, F.; Jadwiszczak, P.; Jurasz, J.; Wdowikowski, M.; Ciapała, B.; Kaźmierczak, B. The impact of long-term changes in air temperature on renewable energy in Poland. Sci. Total Environ. 2020, 729, 138965. [Google Scholar] [CrossRef] [PubMed]
- Krupa, K.; Nieradko, Ł.; Haraziński, A. Prospects for energy storage in the world and in Poland in the 2030 horizon. Polityka Energ. Policy J. 2018, 21, 19–34. [Google Scholar] [CrossRef]
- Szczerbowski, R.; Kornobis, D. The proposal of an energy mix in the context of changes in Poland’s energy policy. Polityka Energ. Policy J. 2019, 22, 5–18. [Google Scholar] [CrossRef]
- Antončič, M.; Papič, I.; Blažič, B. Robust and fast state estimation for poorly-observable low voltage distribution networks based on the Kalman filter algorithm. Energies 2019, 12, 4457. [Google Scholar] [CrossRef] [Green Version]
- Böckl, B.; Greiml, M.; Leitner, L.; Pichler, P.; Kriechbaum, L.; Kienberger, T. HyFloW—A hybrid load flow-modelling framework to evaluate the effects of energy storage and sector coupling on the electrical load flows. Energies 2019, 12, 956. [Google Scholar] [CrossRef] [Green Version]
- Zołądek, M.; Filipowicz, M.; Sornek, K.; Figaj, R.D. Energy performance of the photovoltaic system in urban area—Case study. IOP Conf. Ser. Earth Environ. Sci. 2019, 214, 012123. [Google Scholar] [CrossRef]
- Olczak, P.; Matuszewska, D.; Kryzia, D. ”Mój Prąd” as an example of the photovoltaic one off grant program in Poland. Energy Policy J. 2020, 23, 123–138. [Google Scholar] [CrossRef]
- Zelazna, A.; Gołębiowska, J.; Zdyb, A.; Pawłowski, A. A hybrid vs. on-grid photovoltaic system: Multicriteria analysis of environmental, economic, and technical aspects in life cycle perspective. Energies 2020, 13, 3978. [Google Scholar] [CrossRef]
- Jasiński, J.; Kozakiewicz, M.; Sołtysik, M. The effectiveness of energy cooperatives operating on the capacity Market. Energies 2021, 14, 3226. [Google Scholar] [CrossRef]
- Kaczmarzewski, S.; Olczak, P.; Halbina, A. Issues of photovoltaic installation size choice for a hard coal mine. E3S Web Conf. 2019, 123, 01014. [Google Scholar] [CrossRef]
- Billewicz, K. Test normalności rozkładu wartości poboru energii. Przegląd Elektrotechniczny 2008, 84, 78–79. (In Polish) [Google Scholar]
- Hauke, J.; Kossowski, T. Comparison of values of Pearson’s and Spearman’s correlation coefficients on the same sets of data. Quaest. Geogr. 2011, 30, 87–93. [Google Scholar] [CrossRef] [Green Version]
- R Core Team. RDocumentation Nortest. Available online: https://rdocumentation.org/packages/nortest/versions/1.0-4 (accessed on 19 June 2021).
- StatSoft. Statystyki Nieparametryczne. Available online: https://www.statsoft.pl/textbook/stathome_stat.html?https%3A%2F%2Fwww.statsoft.pl%2Ftextbook%2Fstnonpar.html (accessed on 19 June 2021). (In Polish).
- Olczak, P.; Olek, M.; Matuszewska, D.; Dyczko, A.; Mania, T. Monofacial and bifacial micro PV installation as element of energy transition—The case of Poland. Energies 2021, 14, 499. [Google Scholar] [CrossRef]
- Olczak, P.; Komorowska, A. An adjustable mounting rack or an additional PV panel? Cost and environmental analysis of a photovoltaic installation on a household: A case study in Poland. Sustain. Energy Technol. Assess. 2021, 47, 101496. [Google Scholar] [CrossRef]
- Cain, M.K.; Zhang, Z.; Yuan, K.-H. Univariate and multivariate skewness and kurtosis for measuring nonnormality: Prevalence, influence and estimation. Behav. Res. 2017, 49, 1716–1735. [Google Scholar] [CrossRef]
- Lv, Y.; Guan, L.; Tang, Z.; Zhao, Q. A Probability model of pv for the middle-term to longterm power system analysis and its application. Energy Procedia 2016, 103, 28–33. [Google Scholar] [CrossRef]
- Arthur, Y.D.; Gyamfi, K.B.; Appalah, S.K. Probability distributional analysis of hourly solar irradiation in Kumasi-Ghana. Int. J. Bus. Soc. Res. 2013, 3, 63–75. [Google Scholar] [CrossRef]
- Cherif, H.; Belhadj, J. Energy output estimation of hybrid wind-photovoltaic power system using statistical distributions. J. Electr. Syst. 2014, 10, 117–132. [Google Scholar]
- Linguet, L.; Pousset, Y.; Olivier, C. Identifying statistical properties of solar radiation models by using information criteria. Sol. Energy 2016, 132, 236–246. [Google Scholar] [CrossRef] [Green Version]
- Ajeigbe, O.A.; Munda, J.L.; Hamam, Y. Optimal allocation of renewable energy hybrid distributed generations for small-signal stability enhancement. Energies 2019, 12, 4777. [Google Scholar] [CrossRef] [Green Version]
- Afzaal, M.U.; Sajjad, I.A.; Awan, A.B.; Paracha, K.N.; Khan, M.F.N.; Bhatti, A.R.; Zubair, M.; Rehman, W.; Amin, S.; Haroon, S.S.; et al. Probabilistic generation model of solar irradiance for grid connected photovoltaic systems using weibull distribution. Sustainability 2020, 12, 2241. [Google Scholar] [CrossRef] [Green Version]
- Kam, O.M.; Noel, S.; Ramenah, H.; Kasser, P.; Tanougast, C. Comparative Weibull distribution methods for reliable global solar irradiance assessment in France areas. Renew. Energy 2021, 165, 194–210. [Google Scholar] [CrossRef]
- Xięski, T. Wydobywanie Wiedzy z Danych Złożonych; Uniwersytet Śląski: Katowice, Poland, 2014. (In Polish) [Google Scholar]
- TGE. Hourly Contracts Traded on 11 August 2021. Available online: https://tge.pl/electricity-dam (accessed on 11 August 2021).
- IEO—Instytut Energetyki Odnawialnej. Prognoza Kosztów Wytwarzania i Cen Energii Elektrycznej do 2040 Roku. Available online: https://ieo.pl/pl/projekty/prognoza-cen-energii (accessed on 11 August 2021). (In Polish).
- Reuters. Europe Carbon Prices Expected to Rise to 2030-Industry Survey. 2021. Available online: https://www.reuters.com/business/sustainable-business/europe-carbon-prices-expected-rise-2030-industry-survey-2021-06-14/ (accessed on 9 August 2021).
- Malvoni, M.; Congedo, P.M.; Laforgia, D. Analysis of energy consumption: A case study of an Italian winery. Energy Procedia 2017, 126, 227–233. [Google Scholar] [CrossRef]
- Ossowska, L.J.; Janiszewska, D.A. Toward sustainable energy consumption in the European Union. Polityka Energ. Policy J. 2020, 23, 37–48. [Google Scholar] [CrossRef]
- Malec, M.; Kinelski, G.; Czarnecka, M. The impact of COVID-19 on electricity demand profiles: A case study of selected business clients in Poland. Energies 2021, 14, 5332. [Google Scholar] [CrossRef]


Publisher’s Note: MDPI stays neutral with regard to jurisdictional claims in published maps and institutional affiliations. |
© 2021 by the authors. Licensee MDPI, Basel, Switzerland. This article is an open access article distributed under the terms and conditions of the Creative Commons Attribution (CC BY) license (https://creativecommons.org/licenses/by/4.0/).