Article

Study of Flow and Heat Transfer for the Supercritical Hydrogen in Spallation-Type Cylindrical Neutron Moderator

1
School of Energy Science and Engineering, Harbin Institute of Technology, Harbin 150001, China
2
Institute of High Energy Physics, Chinese Academy of Sciences, Beijing 100049, China
3
Spallation Neutron Source Science Center, Dongguan 523803, China
4
Department of Mechanical and Power Engineering, Harbin University of Science and Technology, Harbin 150001, China
*
Author to whom correspondence should be addressed.
Energies 2021, 14(18), 5856; https://doi.org/10.3390/en14185856 (registering DOI)
Submission received: 1 August 2021 / Revised: 4 September 2021 / Accepted: 13 September 2021 / Published: 16 September 2021
(This article belongs to the Section A5: Hydrogen Energy)

Abstract

:
Pipe height in cylindrical neutron moderator is an important factor to flow pattern, temperature distribution and even the neutron characters. In this paper, the steady-state thermal analysis of cold neutron moderator is carrying out with different heights, conjugated heat transfer method and one-way coupled with a neutron transfer software. The different pipe heights, which is the jet-to-surface distances (H/D = 0.5~6), were compared using a 2D moderator model. The results show that vortex size and velocity gradient from container wall to vortex center vary with H/D, the center of recirculation zone nearly remain constant, and heat transfer effect is weakened on the target bottom surface. With H/D increasing, the velocity at bottom target surface is progressively decreased, and cooling effect is poor, leading to the rise in temperature. The optimal range cooling performance is (H/D) = 0.5~1 at Re = 1.7 × 10⁵, and the enhancement of beam power further strengthens the thermal deposition difference between container and liquid hydrogen. The results can be applied to moderator component design and optimization in the future spallation neutron source.

1. Introduction

The Spallation Neutron Source (SNS) project is a large-scale basic scientific platform for neutron scattering research by using high-energy protons to bombard heavy metal targets and slow down neutrons into cold and hot neutrons [1,2]. In China, Chinese Spallation Neutron Source (CSNS) is designed with 1.6 GeV high-energy protons and beam power of 100 kW to produce neutron flux for different basic research. Heavy metal target, beryllium reflectors, cryogenic liquid hydrogen moderators are main components for neutron production, enhancing neutron intensity and slowing the neutron energy [3,4,5,6]. The coupled moderator with cylindrical shape, which can absorb high-energy neutrons from neutron production target and exchanges neutrons with reflectors, is a key component in spallation neutron sources. The cylinder-type coupled moderator was applying in the CSNS, J-PARC [7] and ESS [8]. The Coupled Hydrogen Moderator (CHM) cools high- energy neutrons through an inelastic collision process, where some of the kinetic energy of neutrons transferred into the potential energy of hydrogen atoms in the moderator. As such, a high intensity long pulsed cold or thermal neutrons is emitted to the neutron instruments. Hydrogen, as an effective moderator for fast neutrons, has been applied in almost all the spallation neutron sources [9]. The flux is very sensitive to hydrogen abundance, and the temperature and density of hydrogen in moderator are important factors for neutron characters.
Supercritical fluid has gradually become one of the hottest research topics over the world in recent years, where includes the study about application of supercritical liquid hydrogen in various fields. Ji et al. [10] studied the flow process of supercritical hydrogen by applying strong heat flux conditions. The results revealed that the large decrease of fluid density of the near wall region compared with the central potential flow region, which leads to the acceleration of flow, deterioration of heat transfer and the suppression of turbulence. The change of turbulent kinetic energy and heat transfer capacity causes the change of velocity and presents a “M” distribution. A lot of research on heat transfer enhancement of supercritical hydrogen have been carried out by Xie and Zhang [11,12,13]. They pointed out that the addition of spherical bulges and grooves on the cooling wall was beneficial to decrease the effect of uneven temperature distribution, increasing surface convective heat transfer coefficient and improving overall cooling performance. For the case of Re = 42,000, the average Nu obtained by this method can be increased by about 40%, while the pressure drop is only increased by 14%. In addition, the heat sink of hydrogen can be fully utilized by a new cooling structure combining fins and spherical bulges, so more heat can be quickly taken away from heat wall, thereby weakening the thermal stratification. Ellahi et al. [14] investigated the cavitation bubble flow of hydrogen bubbles through overlapping narrow tubes. It notes that when the Reynolds number is large, even if the void fraction of upstream section at a smaller value, instability would occur in the downstream. Therefore, due to the sudden increase of speed, the bubbles hit the target face at a higher velocity, and ultimately eliminate the existing stenosis. Keshavarzzadeh et al. [15] explored the generation process of hydrogen by proposing a new solar integrated energy system. In addition, a series of experimental results of hydrogen production by methanol steam reforming with Cu-SiO2 porous catalyst coated on the inner wall of parallel microchannel microreactor were reported by Sarafraz et al. [16].
The CHM of CSNS is designed for CSNS to keep neutron energy and intensity in demand with supercritical state at 20K. When the facility is in operation with spallation reaction, nuclear heat is deposited in CHM, the hydrogen will be in a cooling loop to remove heat of itself and its container. To enhance the coupling effect between moderator and reflectors, the cooling pipes should have a small cross-section area in reflectors. A multi-layer coaxial pipe can minimize the cross-section area of cooling loop that is being applied in CHM of CSNS, as shown in Figure 1. In this paper, hydrogen atoms and its moderator container, kept as the cryogenic temperature in vacuum, are focused on their flow pattern of hydrogen and heat transfer performance. The jet flow from the inlet pipe cools moderator and brings heat out through the outlet pipe in a closed container. The inlet pipe height, which assigned as the jet-to-surface distance H/D, is an important factor to influence the temperature of hydrogen. For predicting the temperature distribution in moderator considering different pipe heights, computational fluid dynamics (CFD) analysis been performed to simulate the internal flow assembly.

2. Mathematical and Physical Model
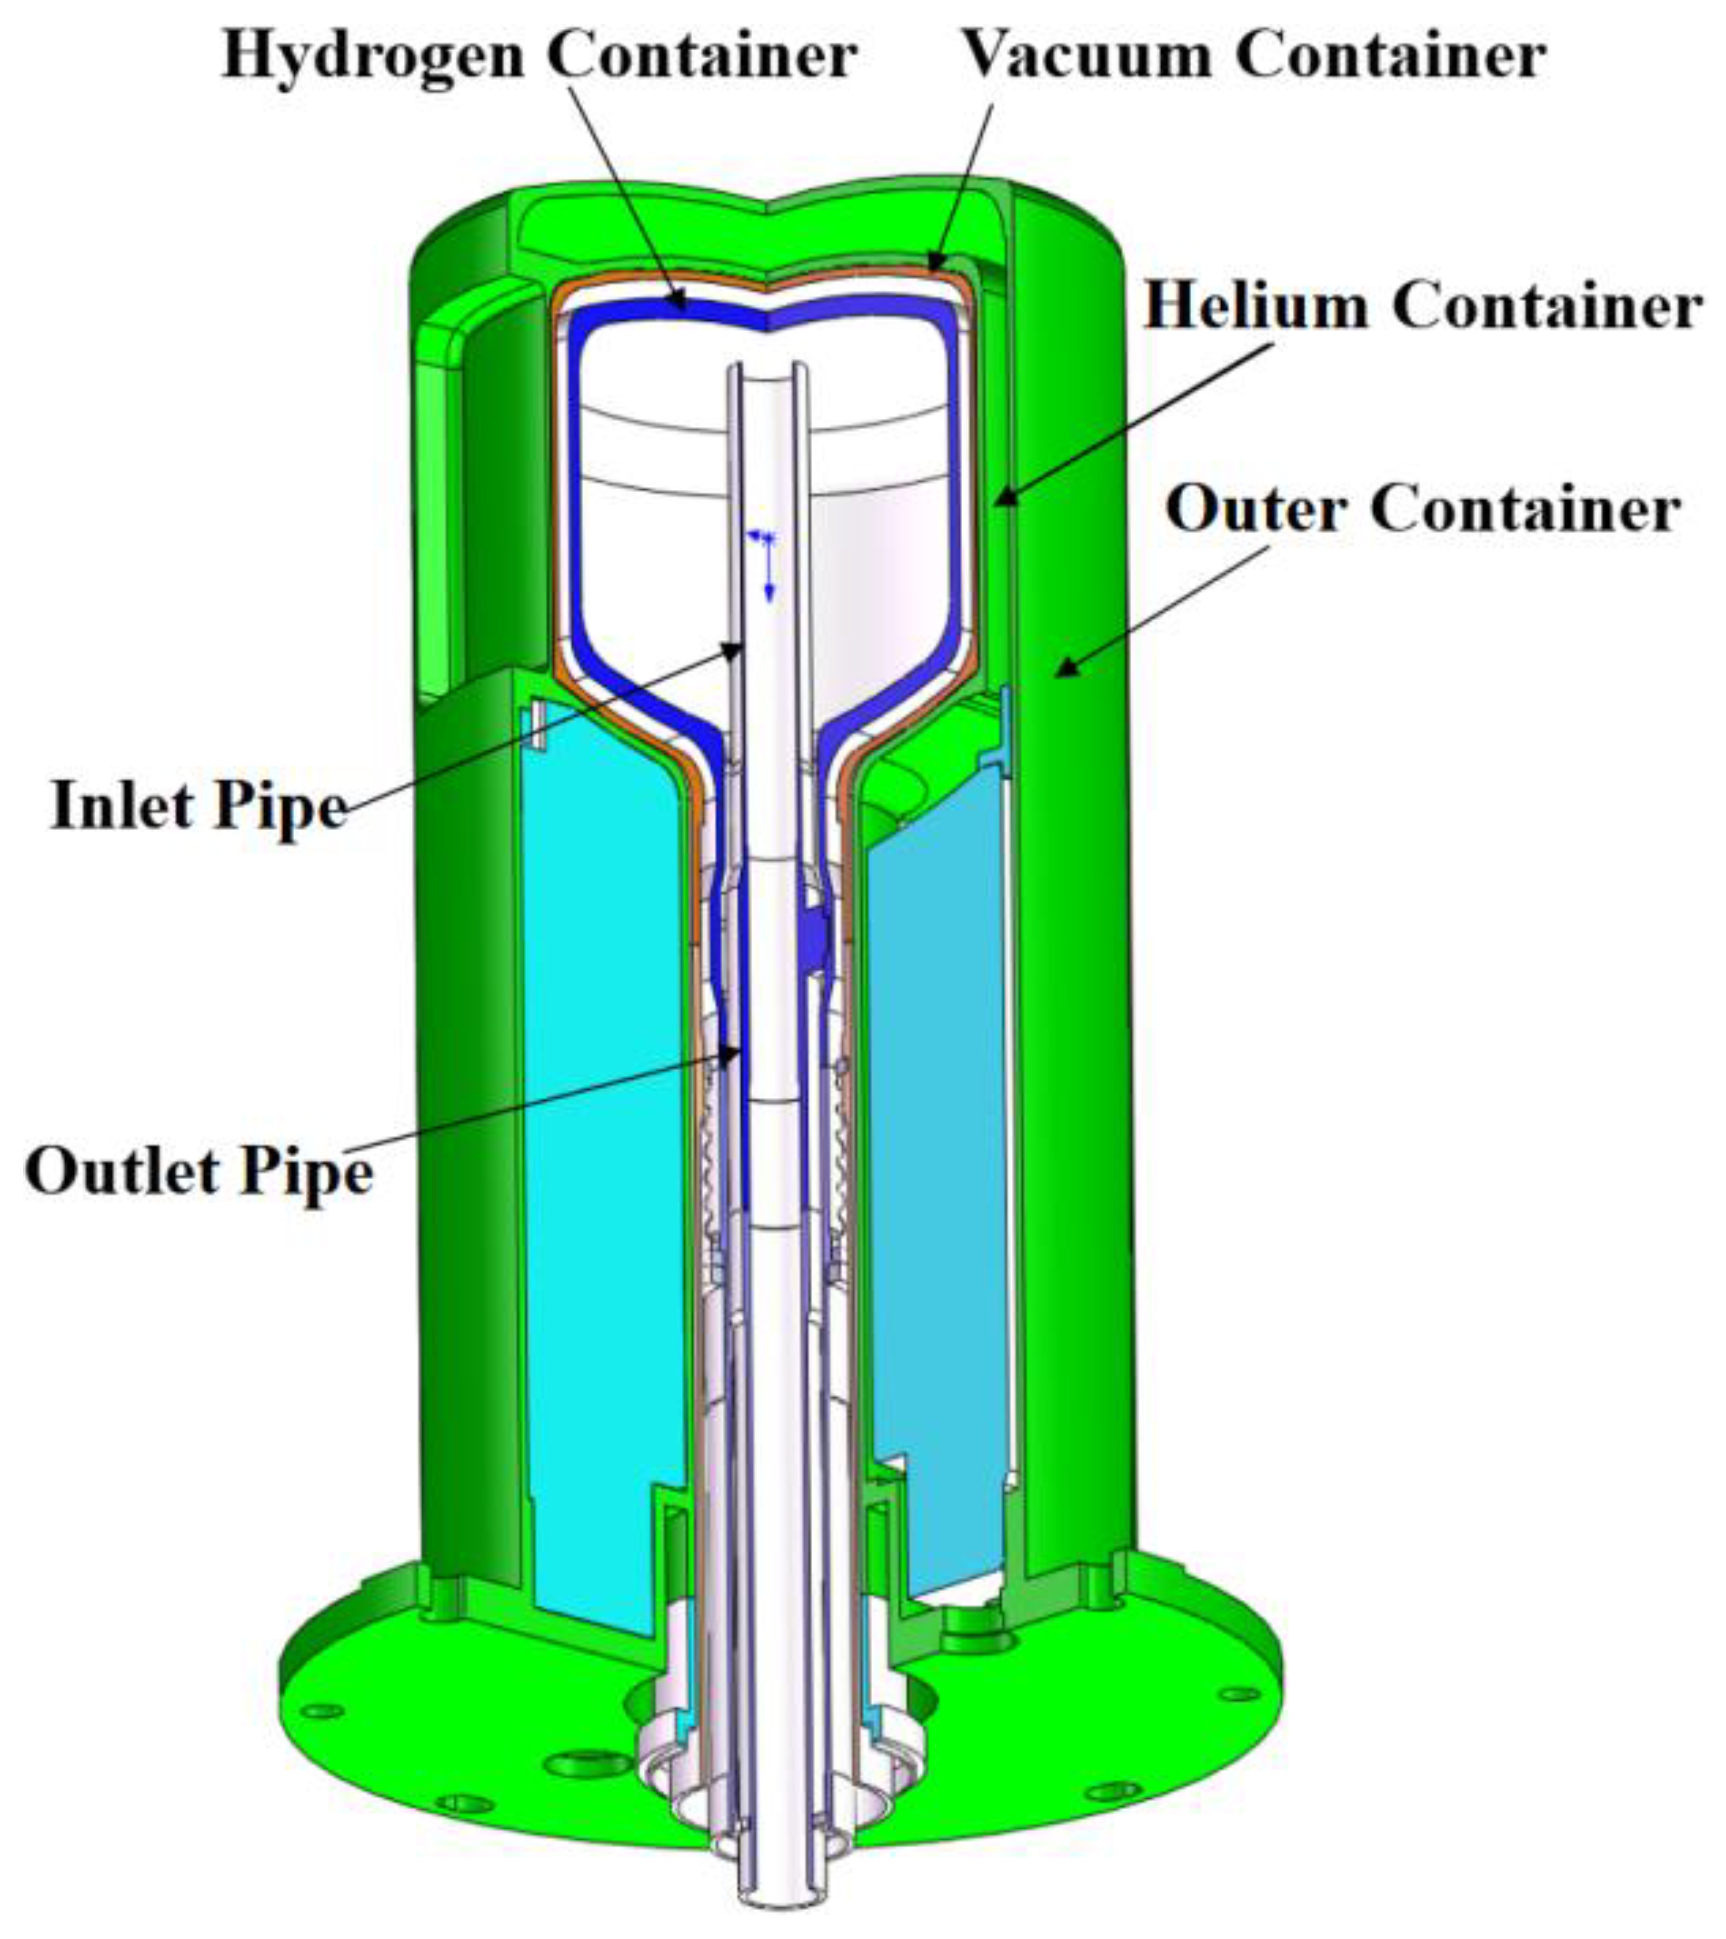
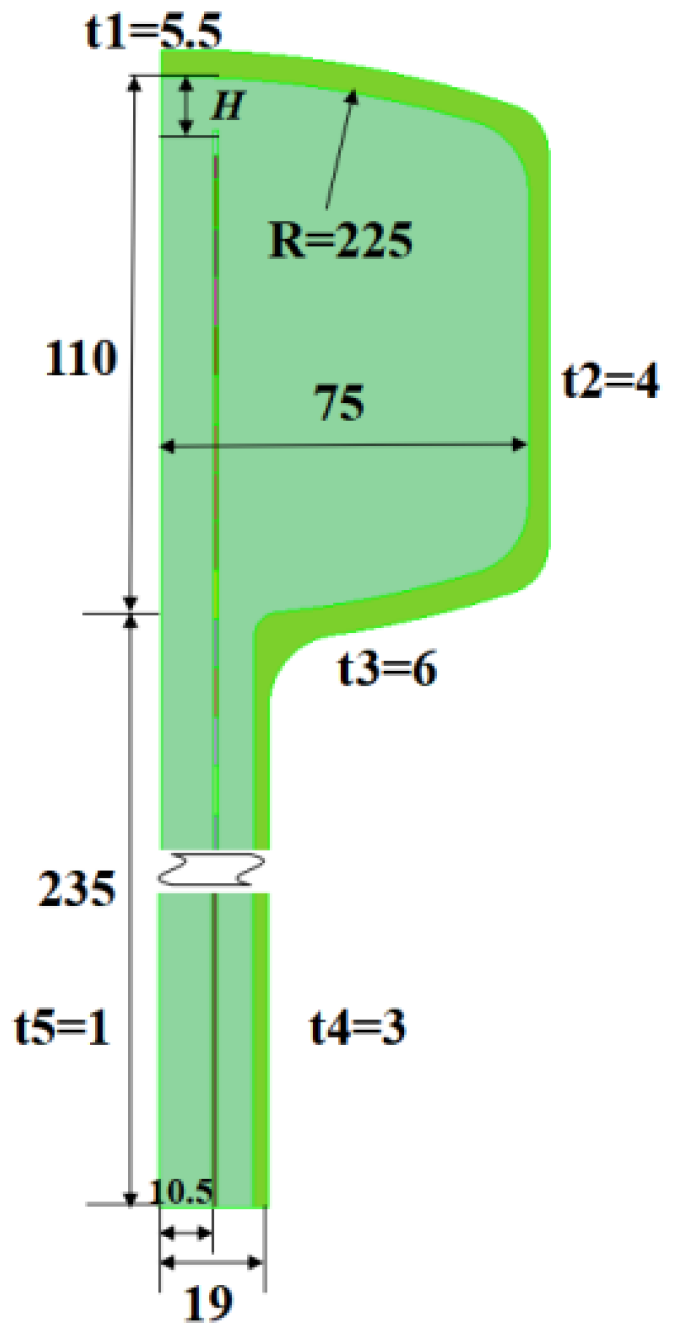
2.1. Physical Model

Taking account of complex flow in the three-dimensional model of CHM, the formation of vortex is mainly random and not easy to observe. Therefore, for the convenience of numerical simulation, the moderator was simplified into a two-dimensional symmetric model in Figure 2. The general structure of CHM is composed of hydrogen inlet and outlet pipes, which are concentric, and container. Liquid hydrogen flows continuously in the inlet pipe and finally from the inlet pipe outlet directly impact the bottom target [17]. Due to the confinement of internal structure, the pressure is concentrated above container, and finally released through hydrogen return tube. Owing to the effect of thermal deposition produced by neutron collisions, the heat of pipelines and container is mainly removed by the liquid hydrogen flow. By changing the pipe height, the specific effects on cooling mechanism of liquid hydrogen were discussing. The MCNPX software, a commonly used Monte Carlo transport program developed by Los Alamos National Laboratory, can exactly simulate the scattering reaction of high-energy particles [18]. In this article, the common parameters obtained from MCPNX 2.5 and CFX 2021 software [19,20] were modified, and heat source of moderator acquired by combining physical-thermal boundary conditions with external coupling method.

2.2. Governing Equations

The effect of gravity can be ignored in the process of liquid hydrogen cooling by high- speed jet flow in the moderator. The pressure has obvious influence on the density of liquid hydrogen in the transcritical process [21]. In this paper, the liquid hydrogen in moderator is assumed to be incompressible and the steady-state flow is analyzed. The expression given as follows [22].
The continuity equation,
ρ t + ( ρ u x ) x + ( ρ u y ) y + ( ρ u z ) z = 0
The momentum equation:
{ ( ρ u x ) t + ( ρ u x u ) = p x + τ x x x + τ y x y + τ z x z + ρ f x ( ρ u y ) t + ( ρ u y u ) = p y + τ x y x + τ y y y + τ z y z + ρ f y ( ρ u z ) t + ( ρ u z u ) = p z + τ x z x + τ y z y + τ z z z + ρ f z
The energy equation:
( ρ E ) t + [ ( ρ E + P ) u ] = ( λ e f f T j h j J j + ( τ e f f u ) ) + S h
where ρ, t and u represent the density, time term and velocity; p, τ and f denote pressure, viscosity force and body force; E, h, λ, J, Sh and T are energy, enthalpy, thermal conductivity, component diffusion flux, source term and temperature, respectively.
The shear stress transport (SST) k-ω turbulence model [23] was using to solve the three-dimensional flow of liquid hydrogen. This model takes into account the turbulent shear stress transport and has high accuracy in predicting complex flows. The equations can be expressed in the following forms,
ρ k t + ( ρ U k ) = P k β * ρ k ω + [ ( μ + σ k μ t ) k ]
ρ ω t + ( ρ U ω ) = α v t P k β ρ ω 2 + [ ( μ + σ ω μ t ) ω ] + ( 1 F 1 ) 2 ρ σ ω 2 ω k ω
where, k, ω, μ, μt, vt, ρ, U and Pk denote the turbulence kinetic energy, the specific dissipation rate, the dynamic viscosity, the turbulent dynamic viscosity, the turbulent kinematic viscosity, density, the velocity vector and the production term, respectively [24]. Both above model parameters acquired by blending related k-ε and k-ω constants via Φ = F1Φ1 + (1 − F1)Φ2, in which the mixing function F1 defined as follows,
F 1 = tanh { { min [ max ( k β * ω d , 500 μ d 2 ρ ω ) , 4 ρ σ ω 2 k C D k ω d 2 ] } 4 }
with,
C D k ω = max ( 2 ρ σ ω 2 1 ω k x i ω x i , 10 10 )
where d represent distance from the first layer to the nearest solid surface, model constants mentioned including: α1 = 0.5556, α2 = 0.44, β1 = 0.075, β2 = 0.0828, β* = 0.09, σk1 = 0.85, σk2 = 1.0, σω1 = 0.5, σω2 = 0.856. Turbulent eddy viscosity can be expressed as,
μ t = a 1 ρ k max ( a 1 ω , S F 2 )
where, S denote the scalar invariant of the strain rate (Sij), a1 = 0.31 and F2 is the second mixing function,
F 2 = tanh { [ max ( 2 k β * ω d , 500 μ d 2 ρ ω ) ] 2 }
The basic solving process of computational fluid dynamics shown in Figure 3. Every step from establishing the equation to obtaining the convergence solution is crucial for solving computational problem.

2.3. Boundary Conditions

  • Temperature is an important parameter having impact on the thermophysical properties of fluids, such as density ρ, specific heat capacity cp, viscosity μ and thermal conductivity λ, which all influence the heat transfer and transport properties of fluid. The container is made of aluminium alloy 6061, whose conductivity is 23 W/(K·m). The inlet flow and inlet temperature are set to 40 g/s and 18 K, with pressure outlet is applying. Moreover, non-uniform heat source of CHM under 100 kW and 500 kW are import to CFX software through User Defined Function (UDF) function.
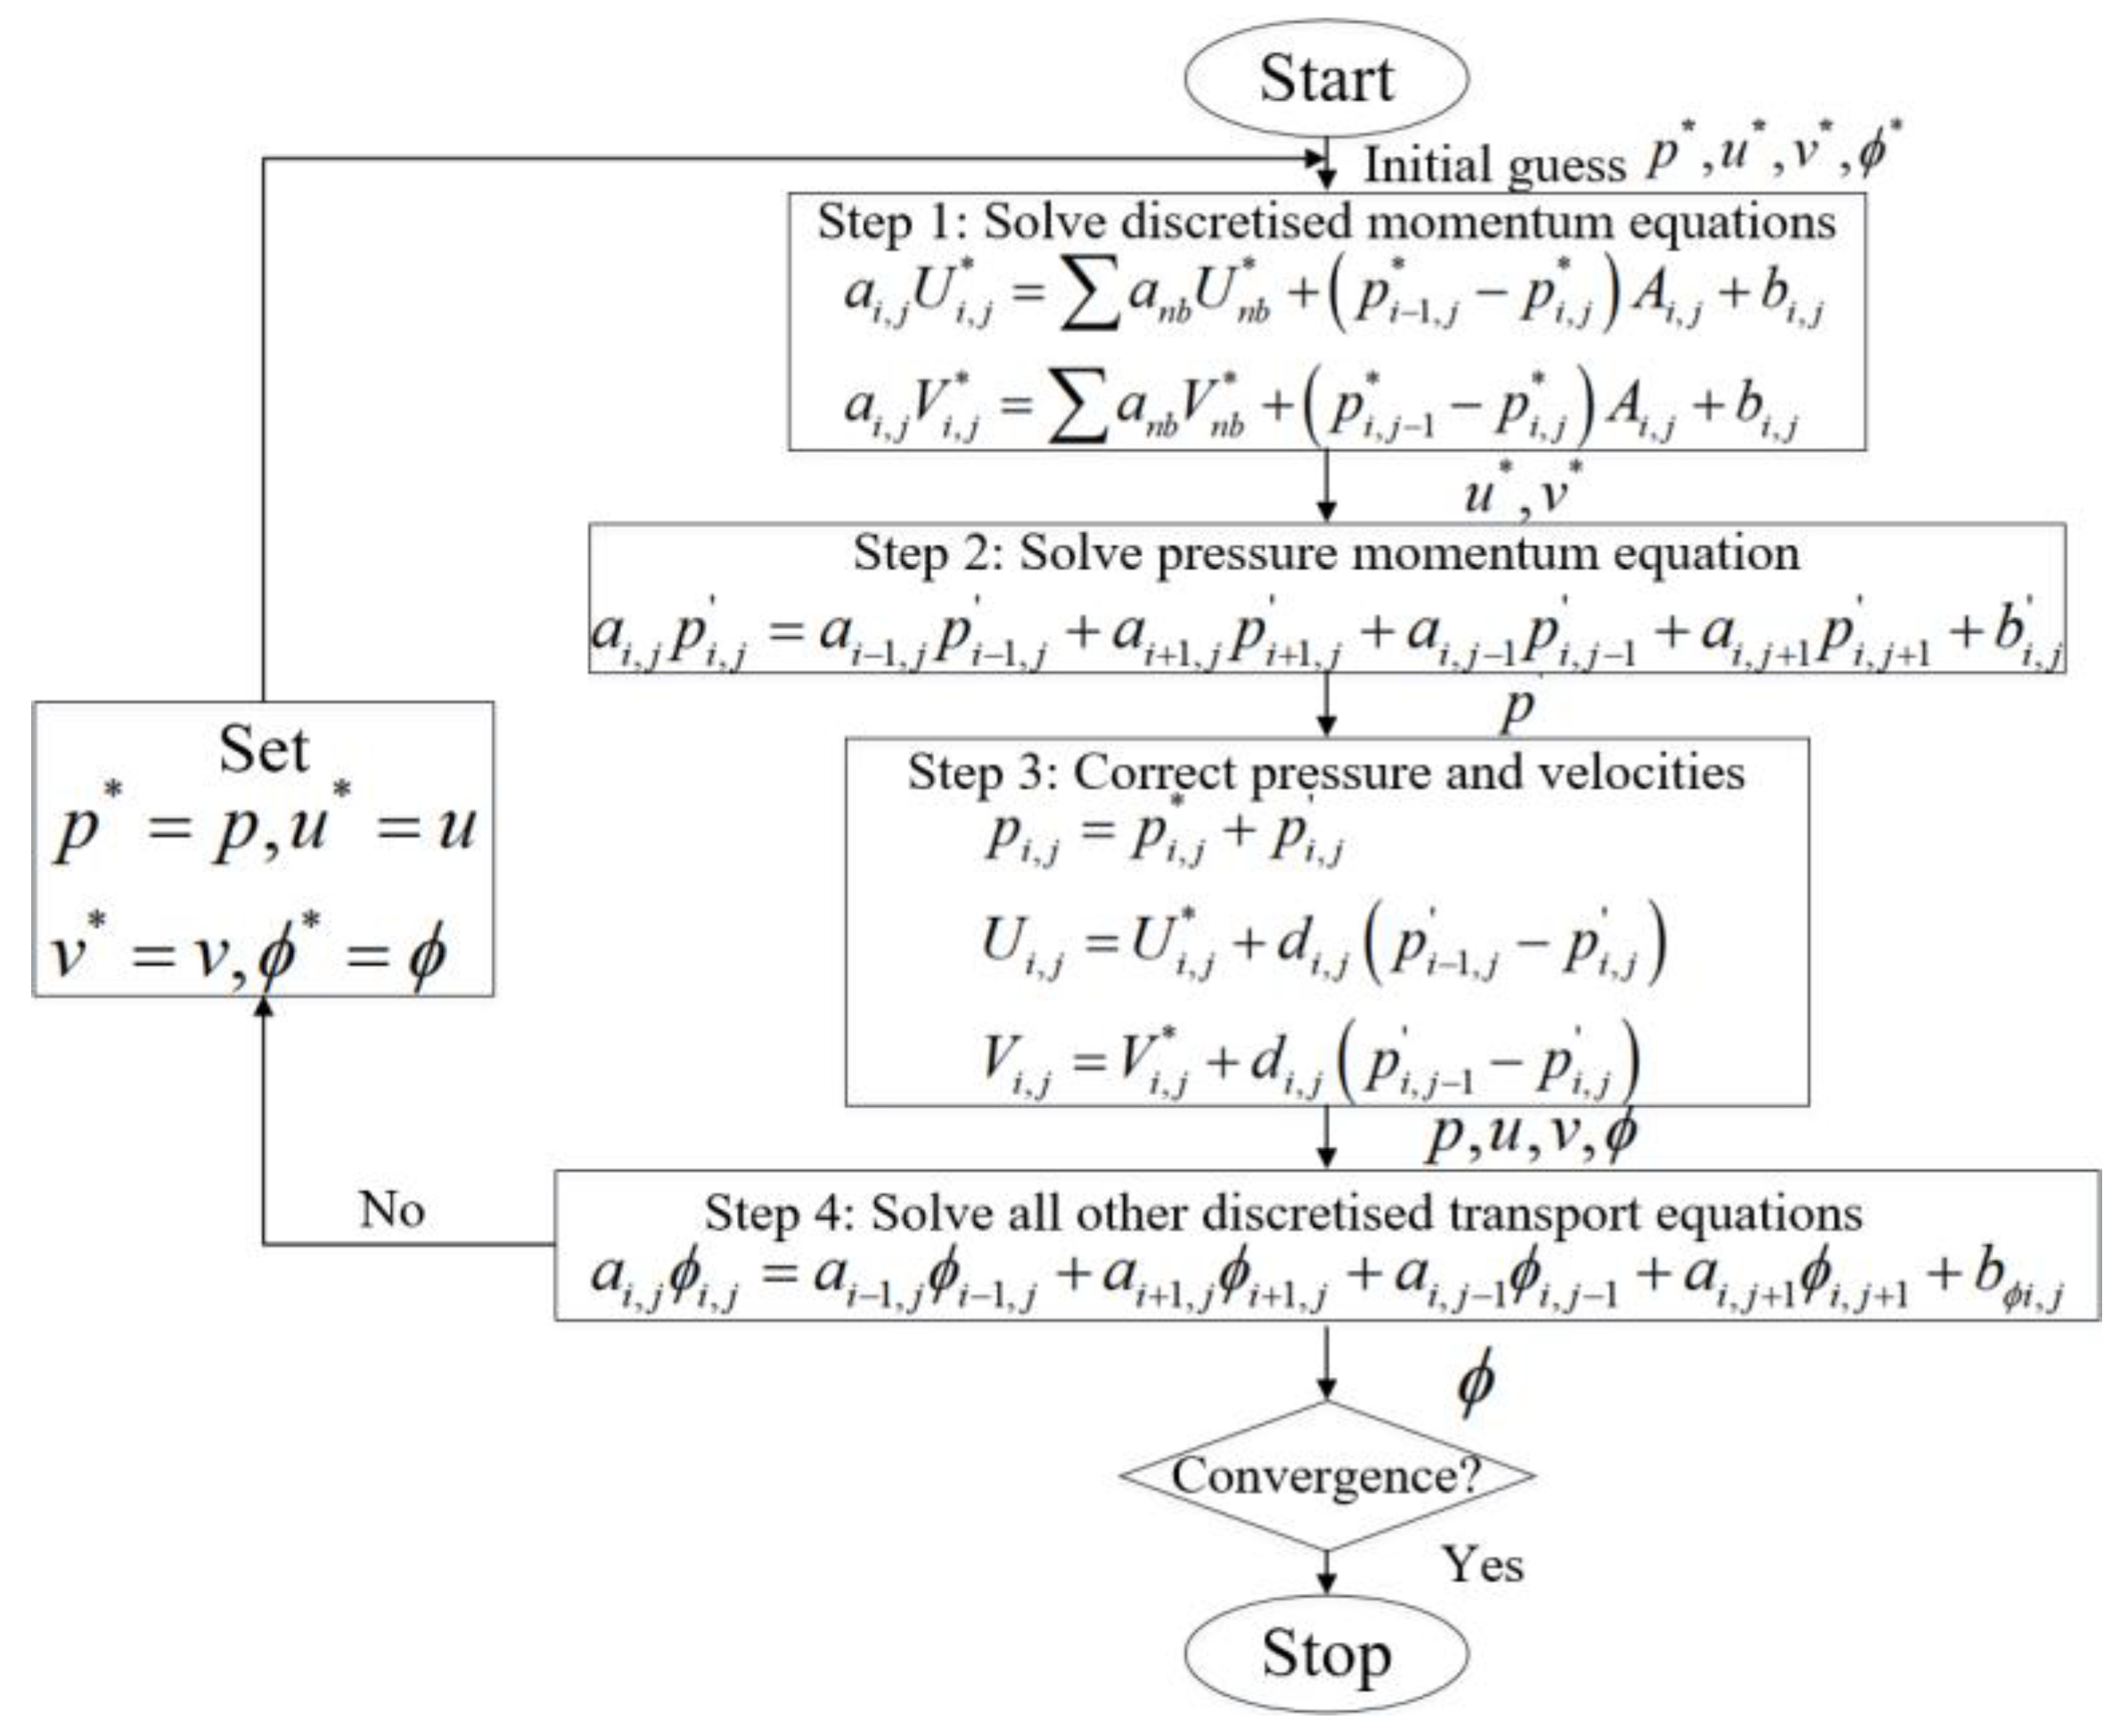
  • The numerical simulation of liquid hydrogen flow in CHM carried out by software CFX 2021. The wall treatment adopts the standard wall function, and symmetric is employing. The container wall is set to be adiabatic, Semi-Implicit Method for Pressure Linked Equations (SIMPLE) algorithm (Figure 4) is chosen for the velocity-pressure coupling method, and meanwhile the second-order upwind scheme is adopted. To ensure calculation accuracy, the solver sets enough convergent iterations to reach the convergence, and the Root Mean Square of the residual values (RMS) is set as 108 to acquire independent convergent solutions.
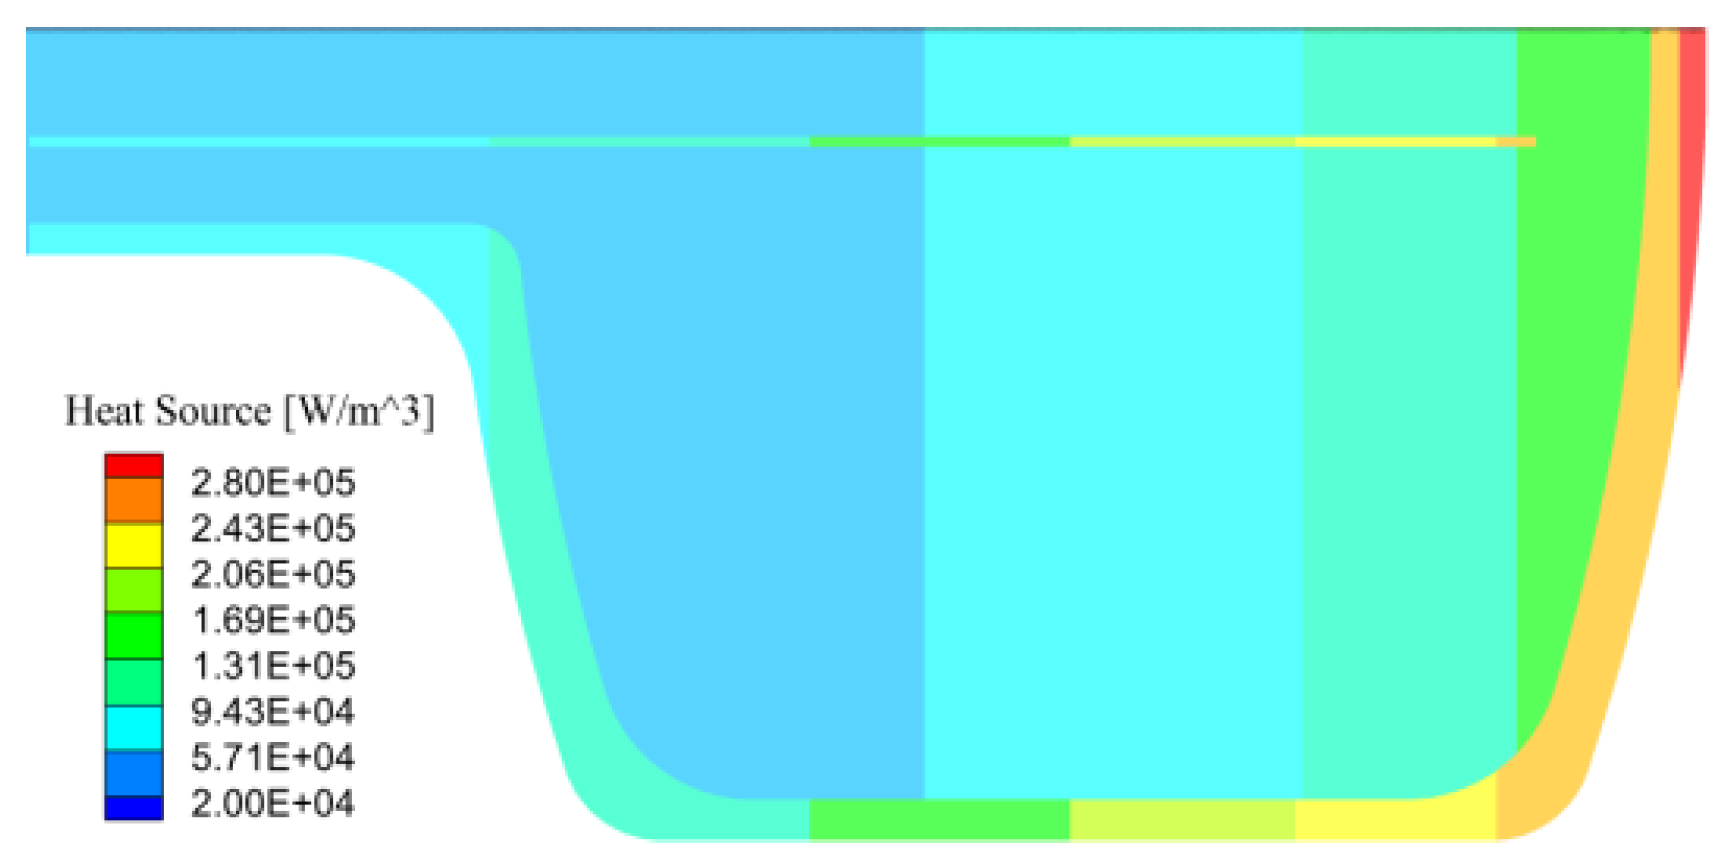
  • Table 1 shows the comparison of heat source values acquired by CFX and MCNPX, and the small error between two software verifies the reliability of the coupling method. Figure 5 shows the heat source distribution inside CHM. The overall heat source of moderator was unevenly distributed, including thermal deposition of external container, hydrogen inlet pipe and liquid hydrogen both gradually increased along axial direction. The maximum value appeared in the bottom central area of container, with the specific value was about 2.8 × 10⁵ W/m3.

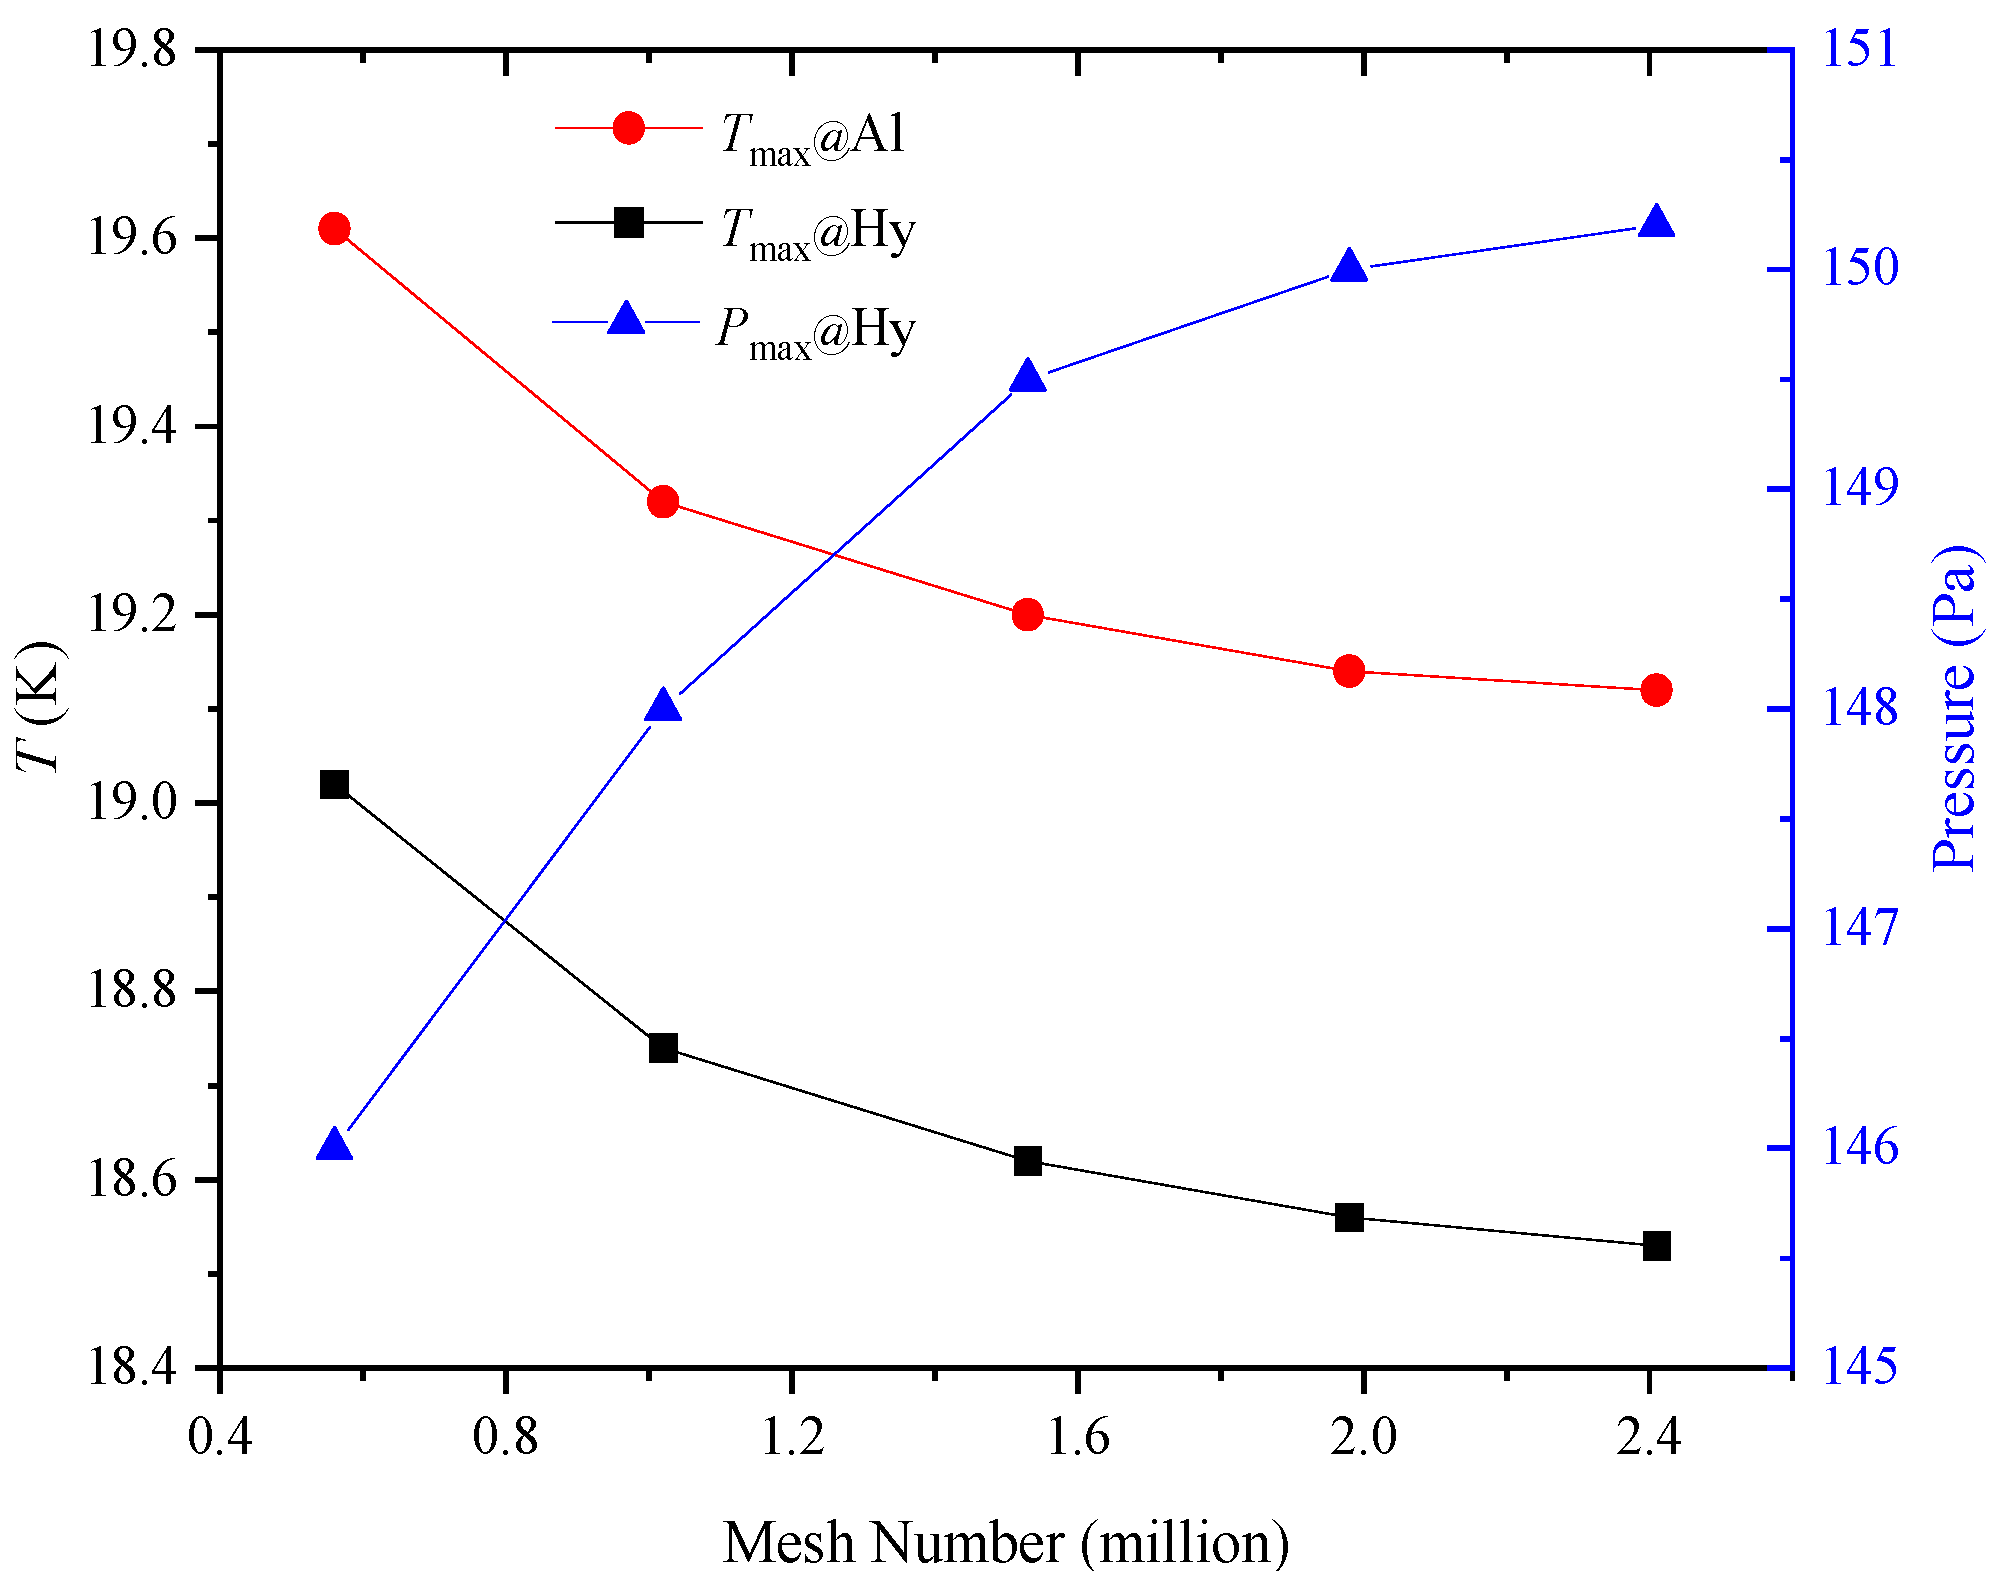
2.4. Verification of Grid Independence

In this study, the grid independence checked by employing five sets of mesh to improve computational accuracy. The three variables [25] of maximum temperature of container, maximum pressure and maximum temperature of liquid hydrogen were monitored under the conditions of H/D = 0.5. Figure 6 shows the simulation results of different grids, including five groups of grids with 0.56, 1.02, 1.53, 1.98 and 2.41 million, respectively. It shows that when the number of grid elements increases from 1,980,000, the changes of maximum temperature and pressure gradually tend to be stable, which proves that an independent convergence solution can be obtained at this time. The Grid Convergence Index (GCI) was selecting to quantify grid independence [26]. The GCI45 for medium and coarse grids was 3.87%, and the GCI34 for fine, and medium grids was 1.48%. The value of GCI45/(rpGCI34) was 0.973, which was approximately equal to 1 and reveal that the solutions is asymptotically convergent. In order to improve computational precision, the fourth grid was employing for subsequent calculation.

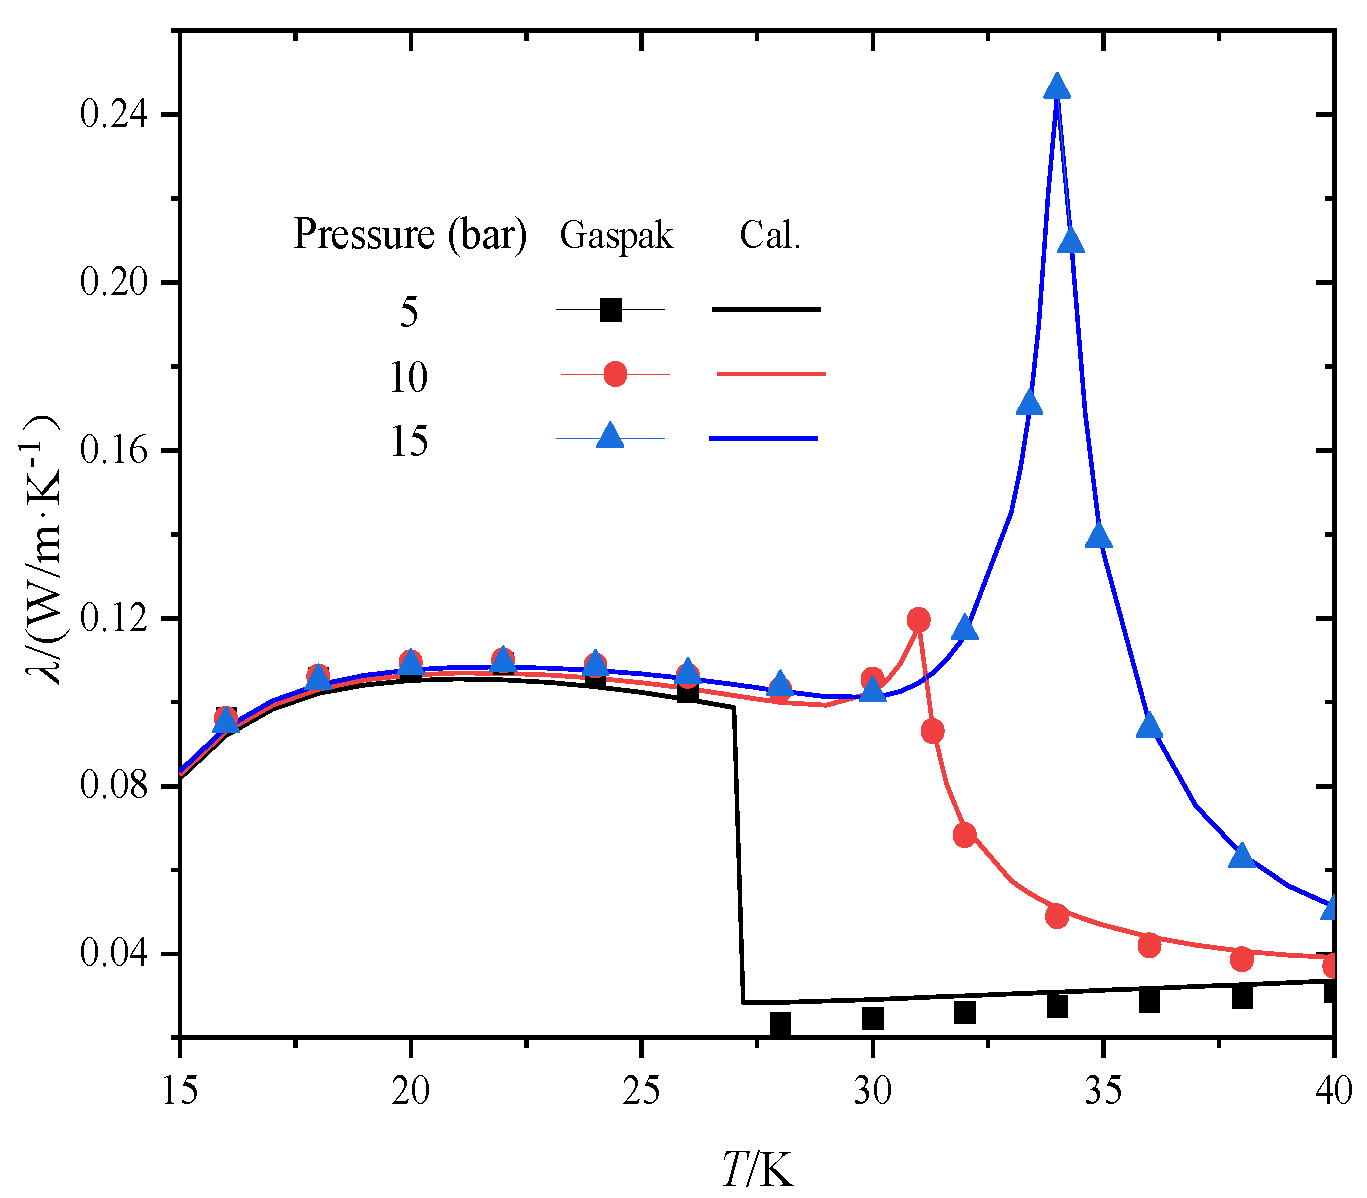
2.5. Thermophysical Properties of Hydrogen

Accurately predicting the hydrogen thermal properties is essential to the accuracy of calculation results, physical parameters of hydrogen can be exactly forecast by equation of state (EoSs) theory [27,28] The Peng–Robinson (PR-EOS) equation of state [29] is commonly adopted to obtain physical property of supercritical fluid, the equations are as follows,
p = R T v P R b a ( T ) v P R ( v P R + b ) + b ( v P R b )
where,
a ( T ) = 0.45724 R 2 T c 2 p c [ 1 + κ ( 1 ( T / T c ) ) ] 2
b = 0.0778 R T c p c
κ = 0.37464 + 1.54226 ω 0.26992 ω 2
where Tc, R, pc, vPR and ω present the critical temperature, molecular gas constant, the critical pressure, the molar volume and the Pitzer acentric factor.
However, PR-EoS formula has poor prediction accuracy for liquid density near critical pressure region. After a series of assessments, Khashayar [30] points out that the Redlich–Kwong EoS equation corrected by Mathias and Copeman (RKMC) [31] was extensively suitable for obtaining the liquid hydrogen properties in different ranges. The specific equation are as follows,
p = R T v b a c α ( T r ) v ( v + b )
b = 0.08664 R T c p c
a c = 0.42748 R 2 T c 2 p c
where,
α = { [ 1 + c 1 ( 1 T r ) + c 2 ( 1 T r ) 2 + c 3 ( 1 T r ) 3 ] 2 , T r 1 [ 1 + c 1 ( 1 T r ) ] 2 , T r > 1
where b, a c , α and T r denote the molar co-volume, the critical attractive parameter, the temperature dependence function and the reference temperature. Both c 1 ,   c 2 ,   c 3 represent coefficients of Mathias and Copeman α function.
Figure 7 shows the thermal conductivity distribution in the temperature range of 15~40 K under different pressure. To verify the reliability of the method, the data were comparing with those of GASPAK [32]. The results showed that two groups of value coincide quite well with less error.

3. Results and Analysis

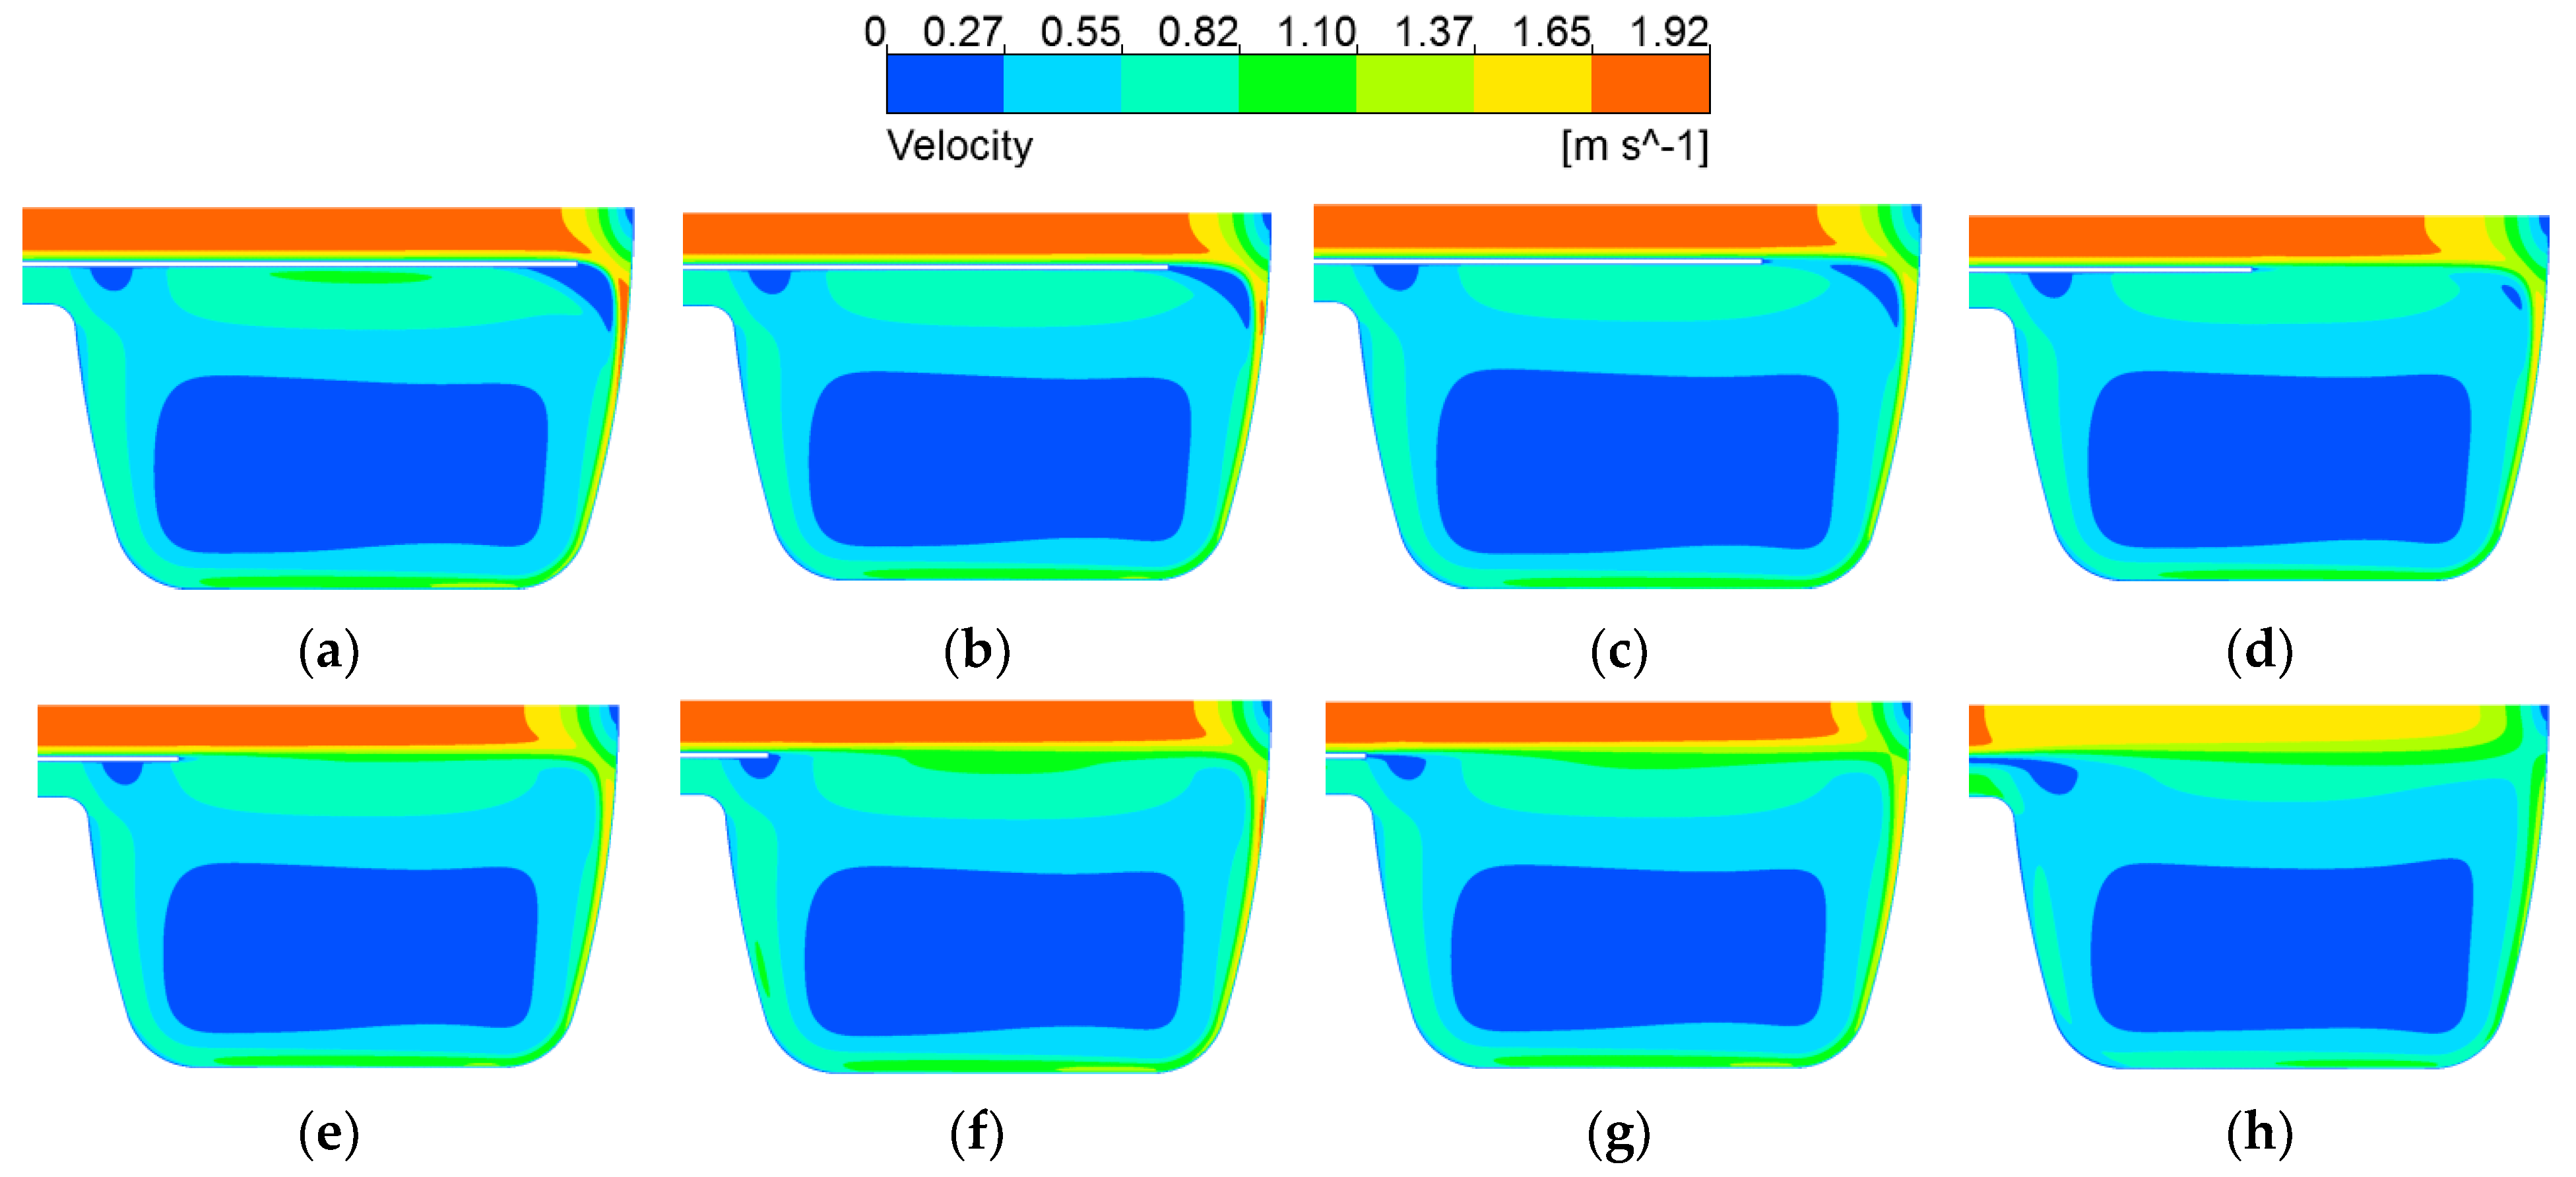
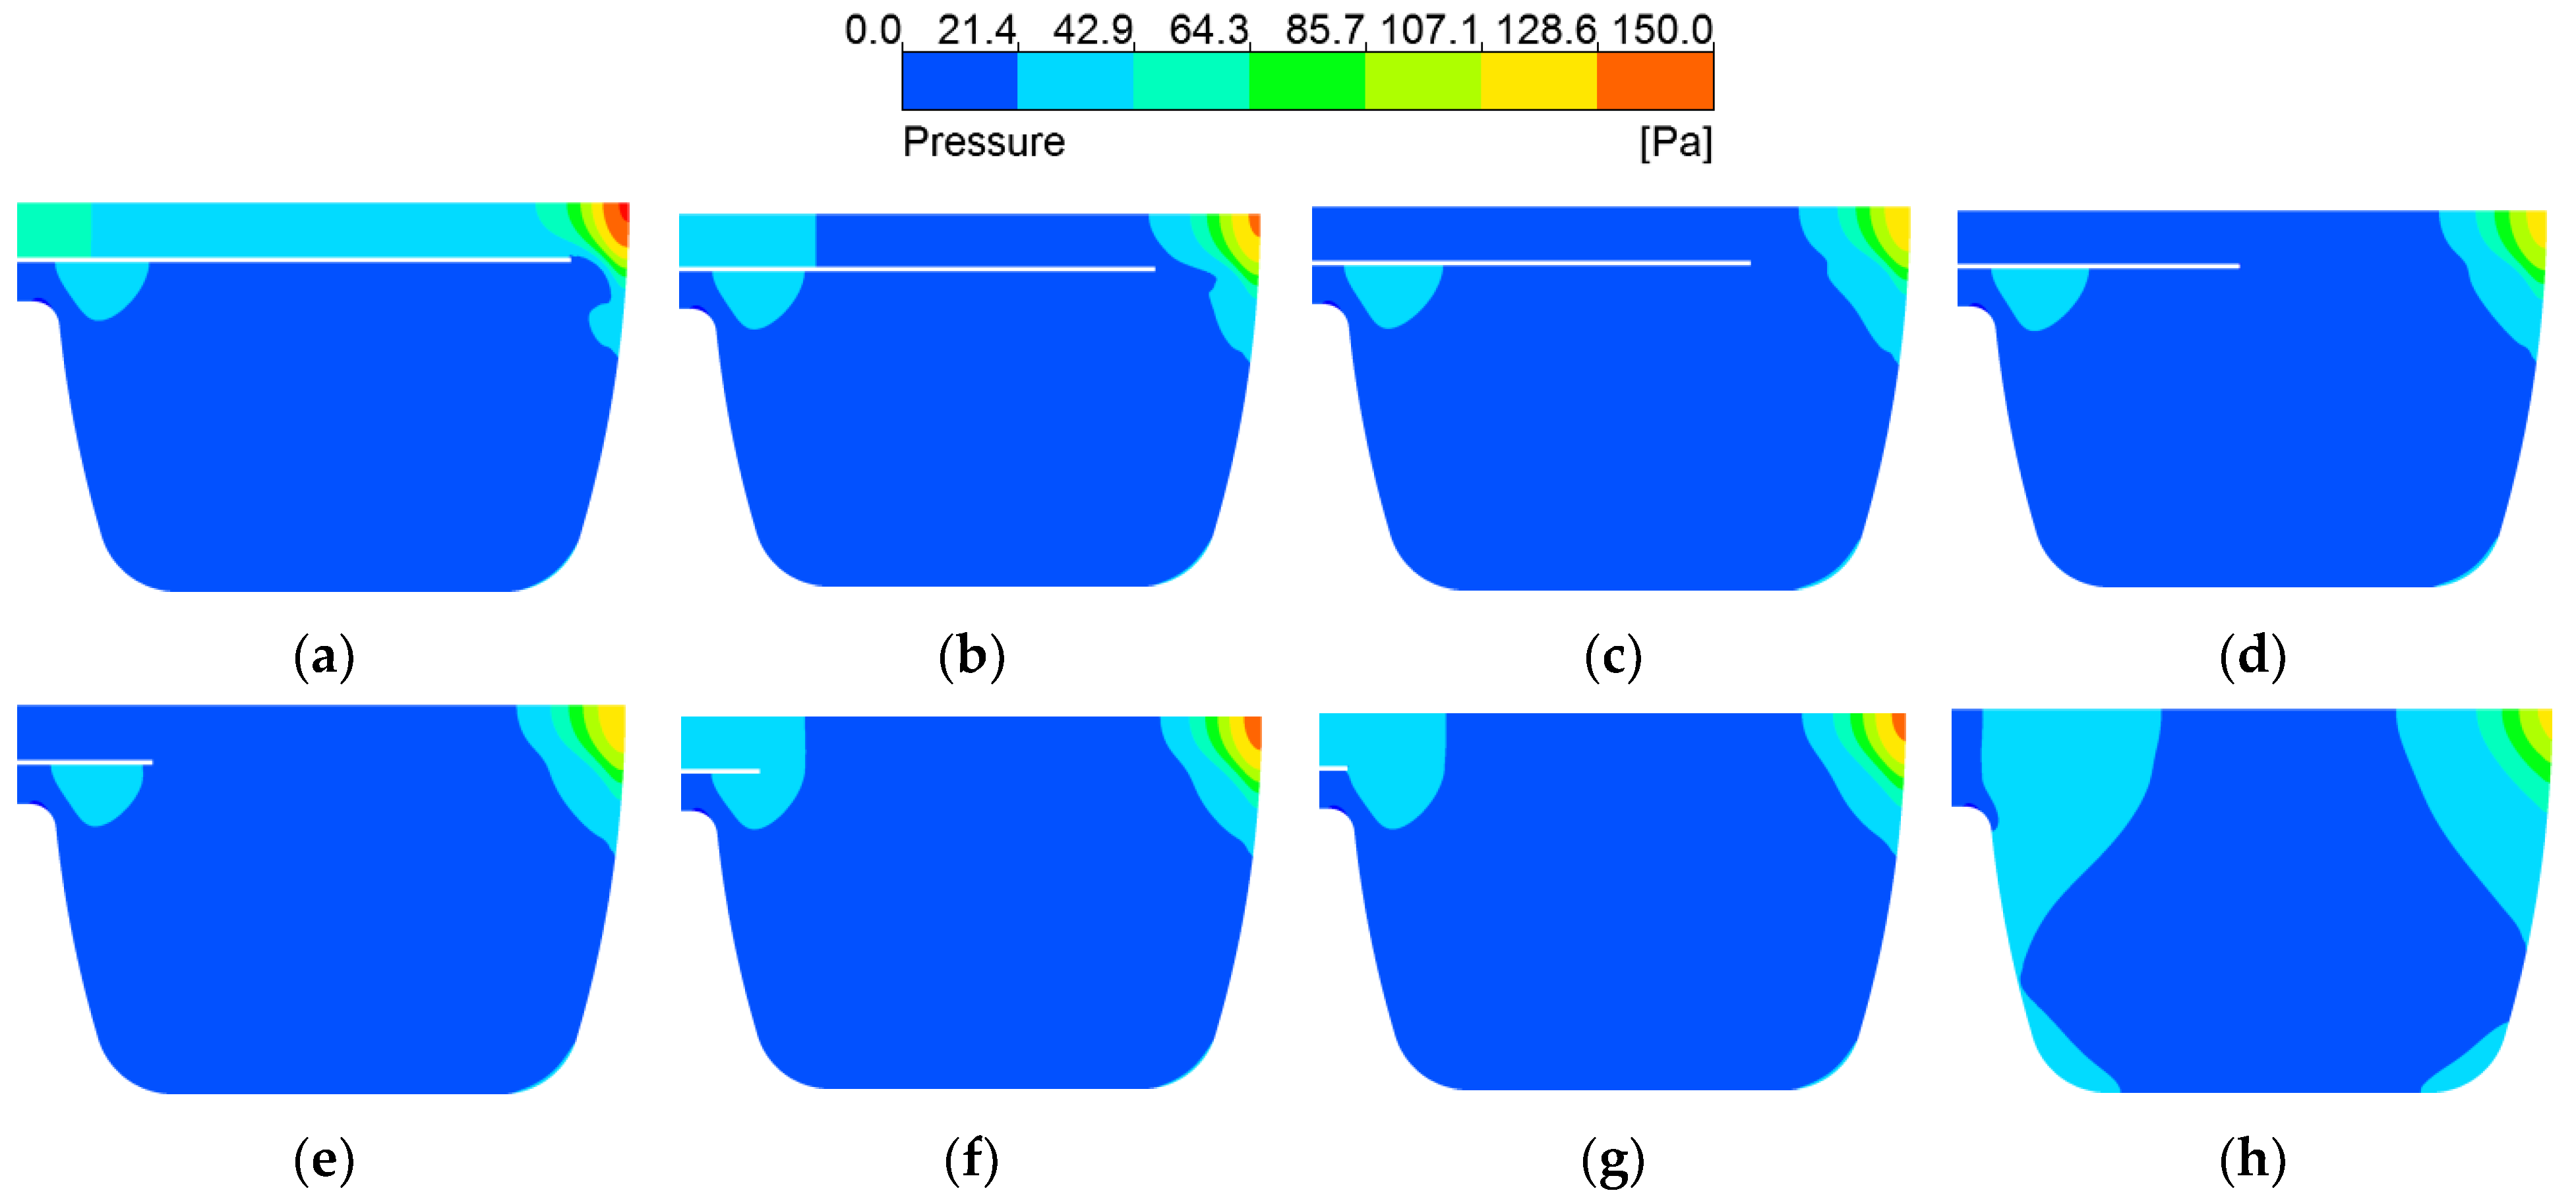
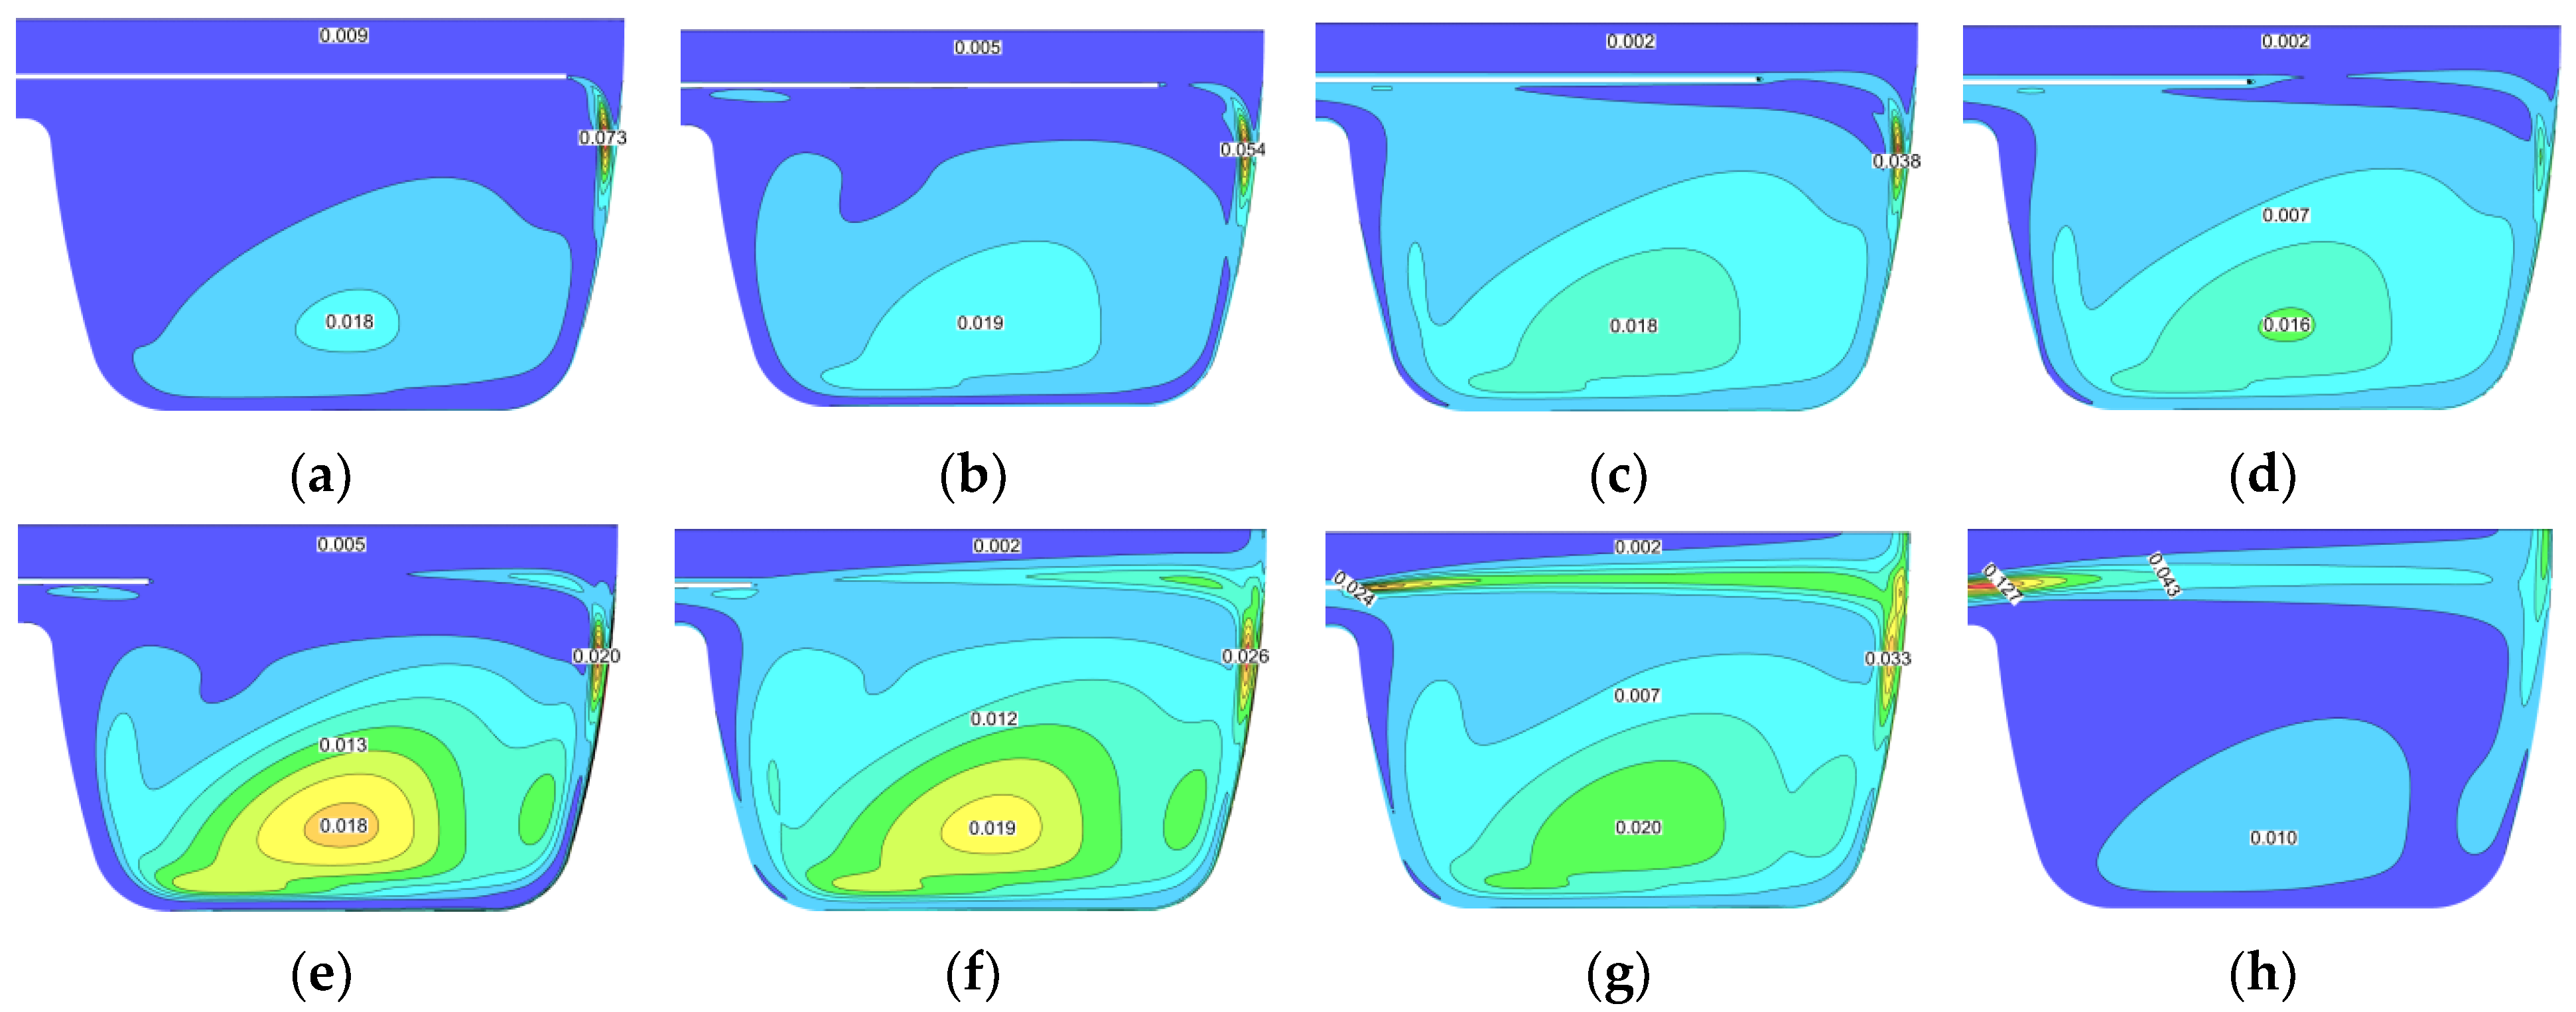
3.1. Flow Field and Velocity Distribution

Figure 8 shows the streamlines at different distance H/D based on the axisymmetric model of a cylindrical moderator. It seen that under the influence of closed space jet formed by the coaxial pipe inside moderator, the flow in the central area of container is dominated by the recirculation zone (zone 1). For the internal cavity structure, liquid hydrogen forms jet stagnation points 1 and 2 at different locations, and another recirculation zone 2. In zone 1, the target surface at the bottom of vessel impacted by liquid hydrogen from the exit of inlet pipe. The vertical effect of liquid hydrogen on target surface, of which structure is bending, makes flow velocity drop about to 0 m/s at this point, thus forming the jet stagnation point 1. In zone 2, the formation of stagnation point 2 at x = −0.045 m can be expounded from vertically impacts of liquid hydrogen, which between the cavity wall and recirculation zone.
It is worth noting that there is a flow dead zone between two liquid hydrogen streams with different flow directions, where the cooling effect is poor yet the influence on overall heat transfer inside container is not significant. When H/D is 0.5, the recirculation zone 2 formed between the fluid entering cavity and recirculation zone 1 for difference of flow velocity. With the reducing of H/D, the area of zone 2 gradually decreases, especially when H/D reaches 1.5, the area has completely disappeared. Furthermore, the center position of vortex basically remains unchanged during the variation of distance, which is proved the overall flow field tends to be stable.
Figure 9 displays velocity distribution of liquid hydrogen in CHM under variable height conditions, and overall distribution trend is generally consistent. It can be clearly observed that there is a large area of low velocity zone in the center of cavity, which is corresponding to the flow field distribution of CHM, that is, the majority of liquid hydrogen participate in central recirculation zone and generate vortex, so as the flow rate was reduced to 0 m/s. Moreover, in the range of H/D = 0.5~3, the flow dead zone near exit of inlet pipe decreases gradually with increase of distance H/D, and the flow state is gradually improved. When H/D constantly improve from 4.5, the velocity distribution of liquid hydrogen in pipeline gradually shifts. Due to the loss of wall barrier, the low velocity liquid hydrogen in vortex region of container gradually affects the flow in axial direction and causes the entrainment, which reduces the velocity of liquid hydrogen at junction. This phenomenon is further demonstrated at H/D = 6. Different from other distances, the overall velocity of liquid hydrogen after entering the cavity is at a low level, indicating that it will not be conducive to fluid flow while H/D is too large, and there is no effective jet impact on the bottom target surface.
When the boundary conditions remain unchanged, the jet impact pressure depends on mechanical energy loss of supercritical jet radial pressure distribution on the wall, which mainly determined by H/D. The smaller the mechanical energy loss is, the greater the impact pressure is, and the maximum value with 150 Pa appears in central area of bottom target surface shown in Figure 10. With enhancement of H/D, the impact pressure of supercritical hydrogen jet decreases, but the impact range expands. The reason is that when jet distance is too small, the development of supercritical hydrogen jet is insufficient, and impact range on wall is relatively concentrated with higher pressure. Correspondingly, the jet energy loss caused by larger jet distance is considerable, and impact pressure slowly reduced.
As Figure 11 depicts, the turbulent kinetic energy inside inlet pipe is small, indicating that the turbulence disturbance in this region is relatively less and velocity dissipation is low. By changing H/D, it found that most of peak turbulent kinetic energy appears in the wall jet zone, which is due to the high turbulence intensity at the junction of jet and central recirculation vortex region. As H/D increases, the peak decreases. There exists a very complex force condition for jet impingement, when liquid hydrogen enters pipeline, the inertial force, shear force and viscous force have not reached equilibrium, where the inertial force is dominant at this time. When the velocity of liquid hydrogen changes sharply from axial direction to radial direction, the force tends to be stable and remains balance. At this point, the turbulent kinetic energy gradually increases to the peak, and then reduces with diminution of inertial force. It should be note that when H/D = 5.5~6, different from other conditions, the turbulent kinetic energy near exit of inlet pipe is larger, with the maximum value is 0.127 m2/s2 at H/D = 6, which can be explained by streamline shown in Figure 4. The above region involves three flows, including axial flow in tube, reflux in center and flow gathered in outlet pipe. The turbulent kinetic energy enhanced significantly in the zone where three flows gathered, and the smaller the pipeline length, the larger the turbulent kinetic disturbance in this area.

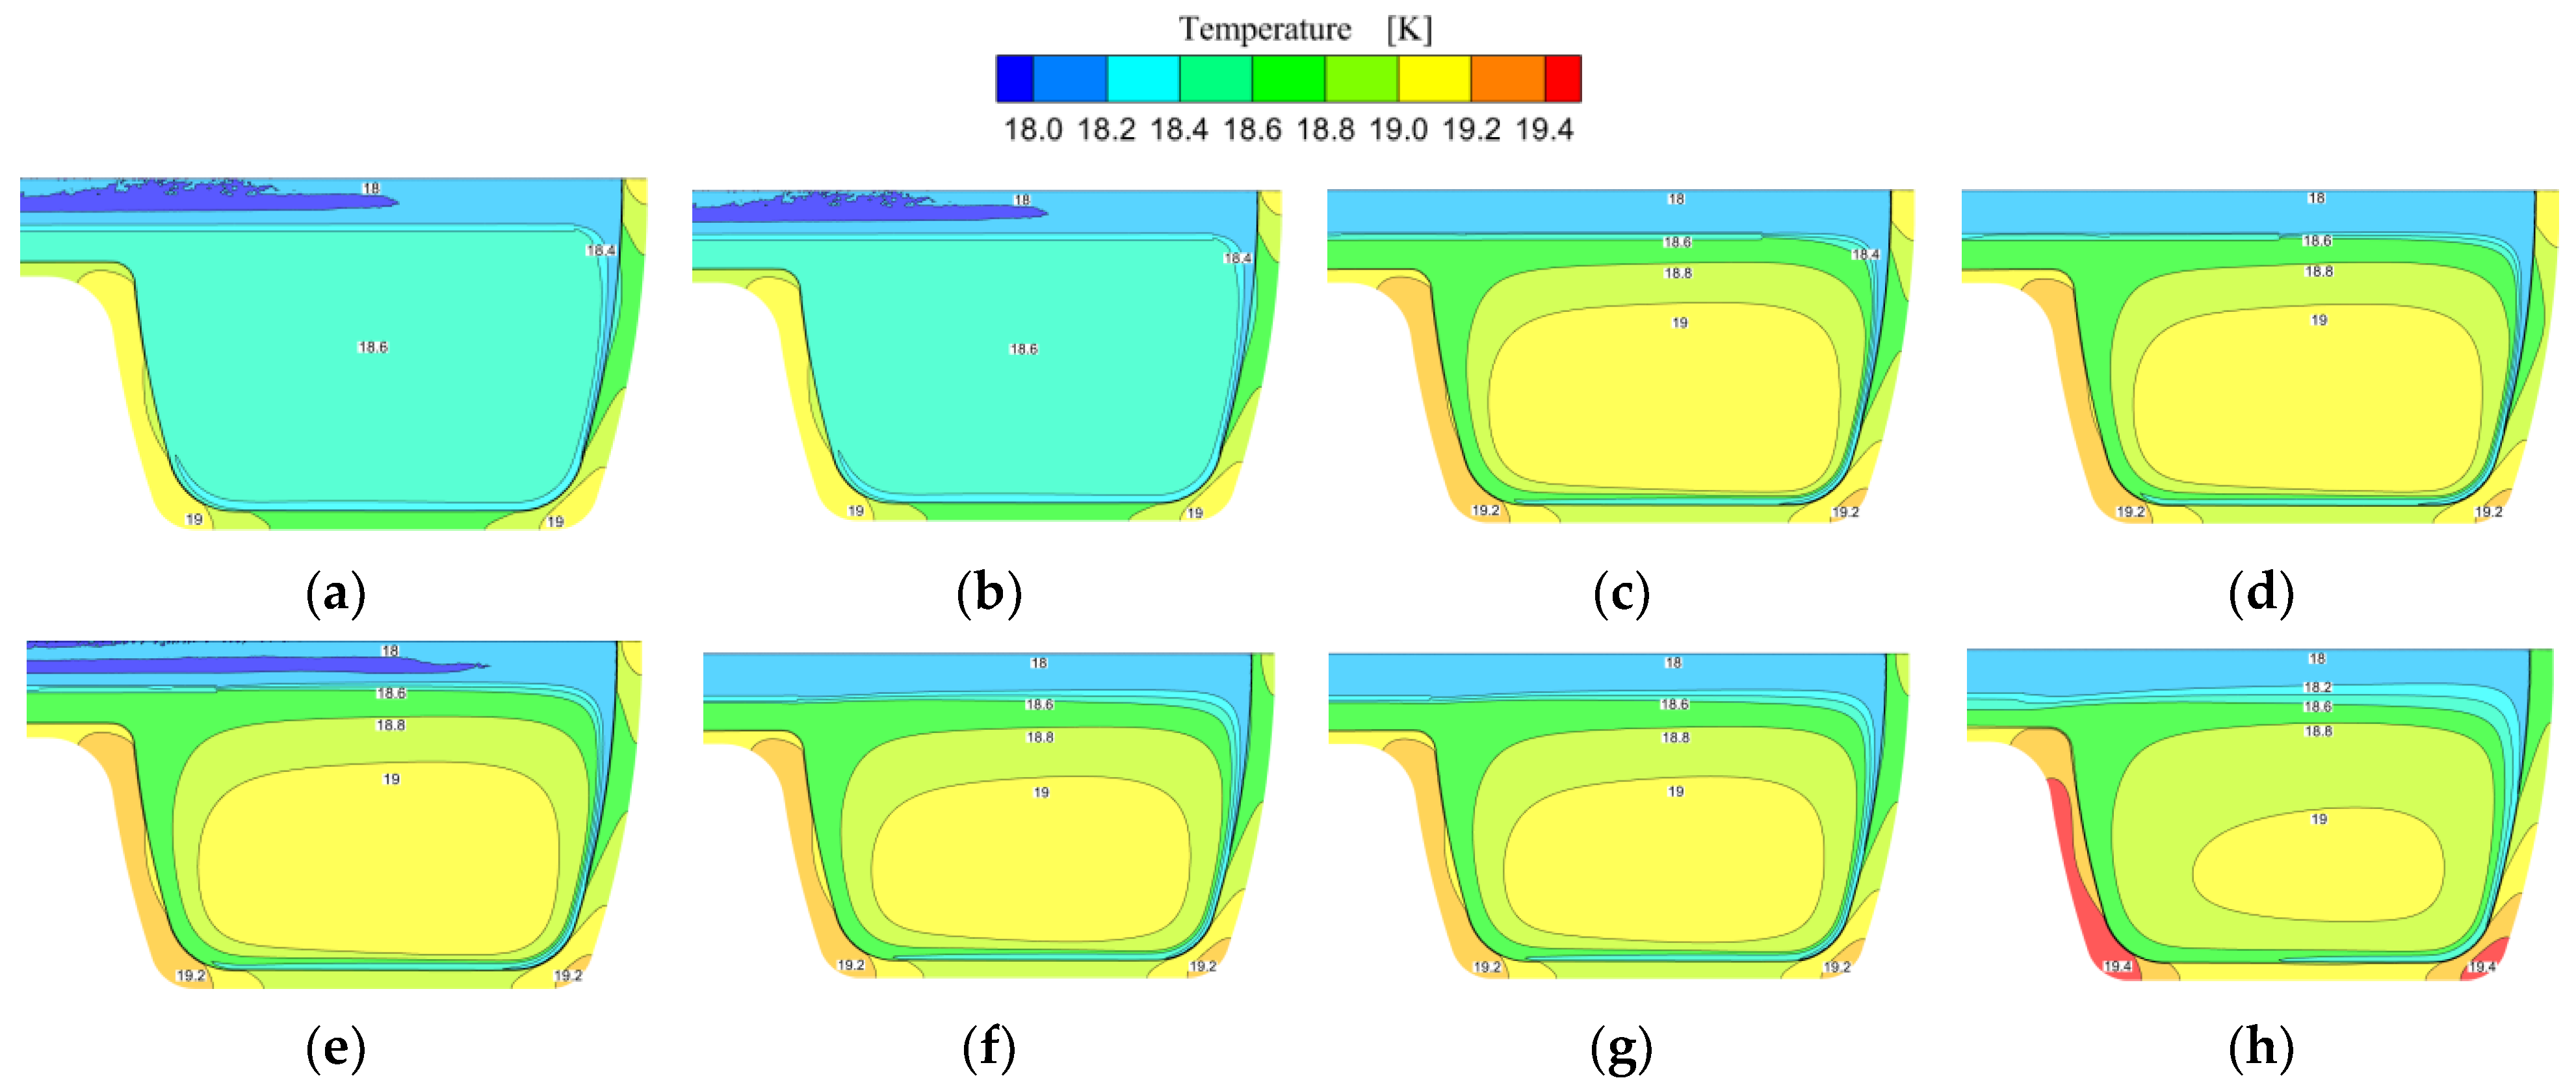
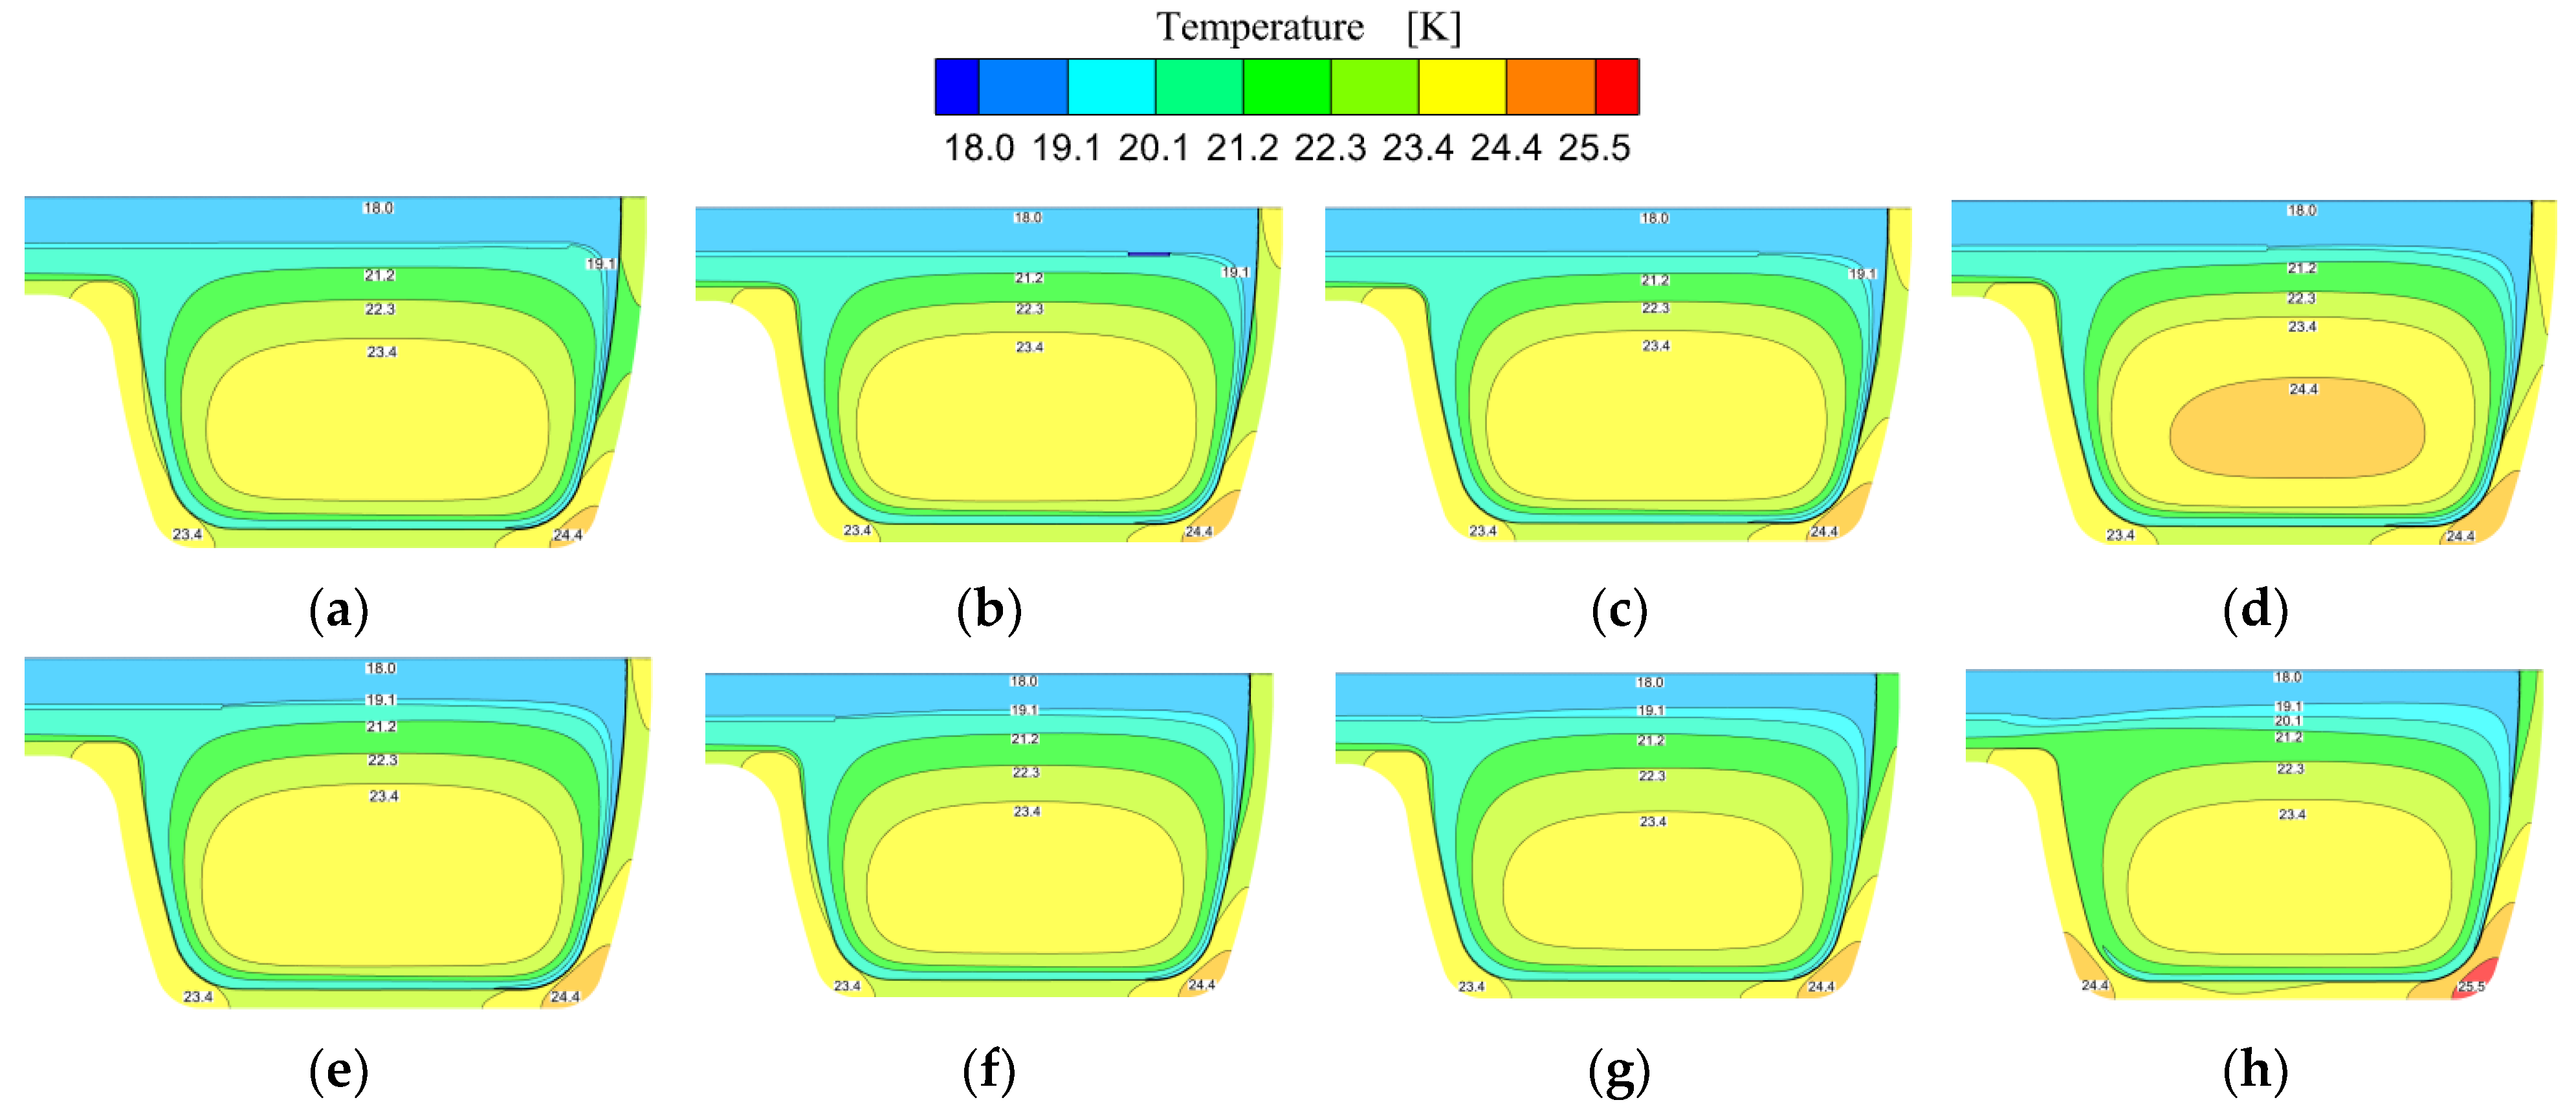
3.2. Distribution of Temperature
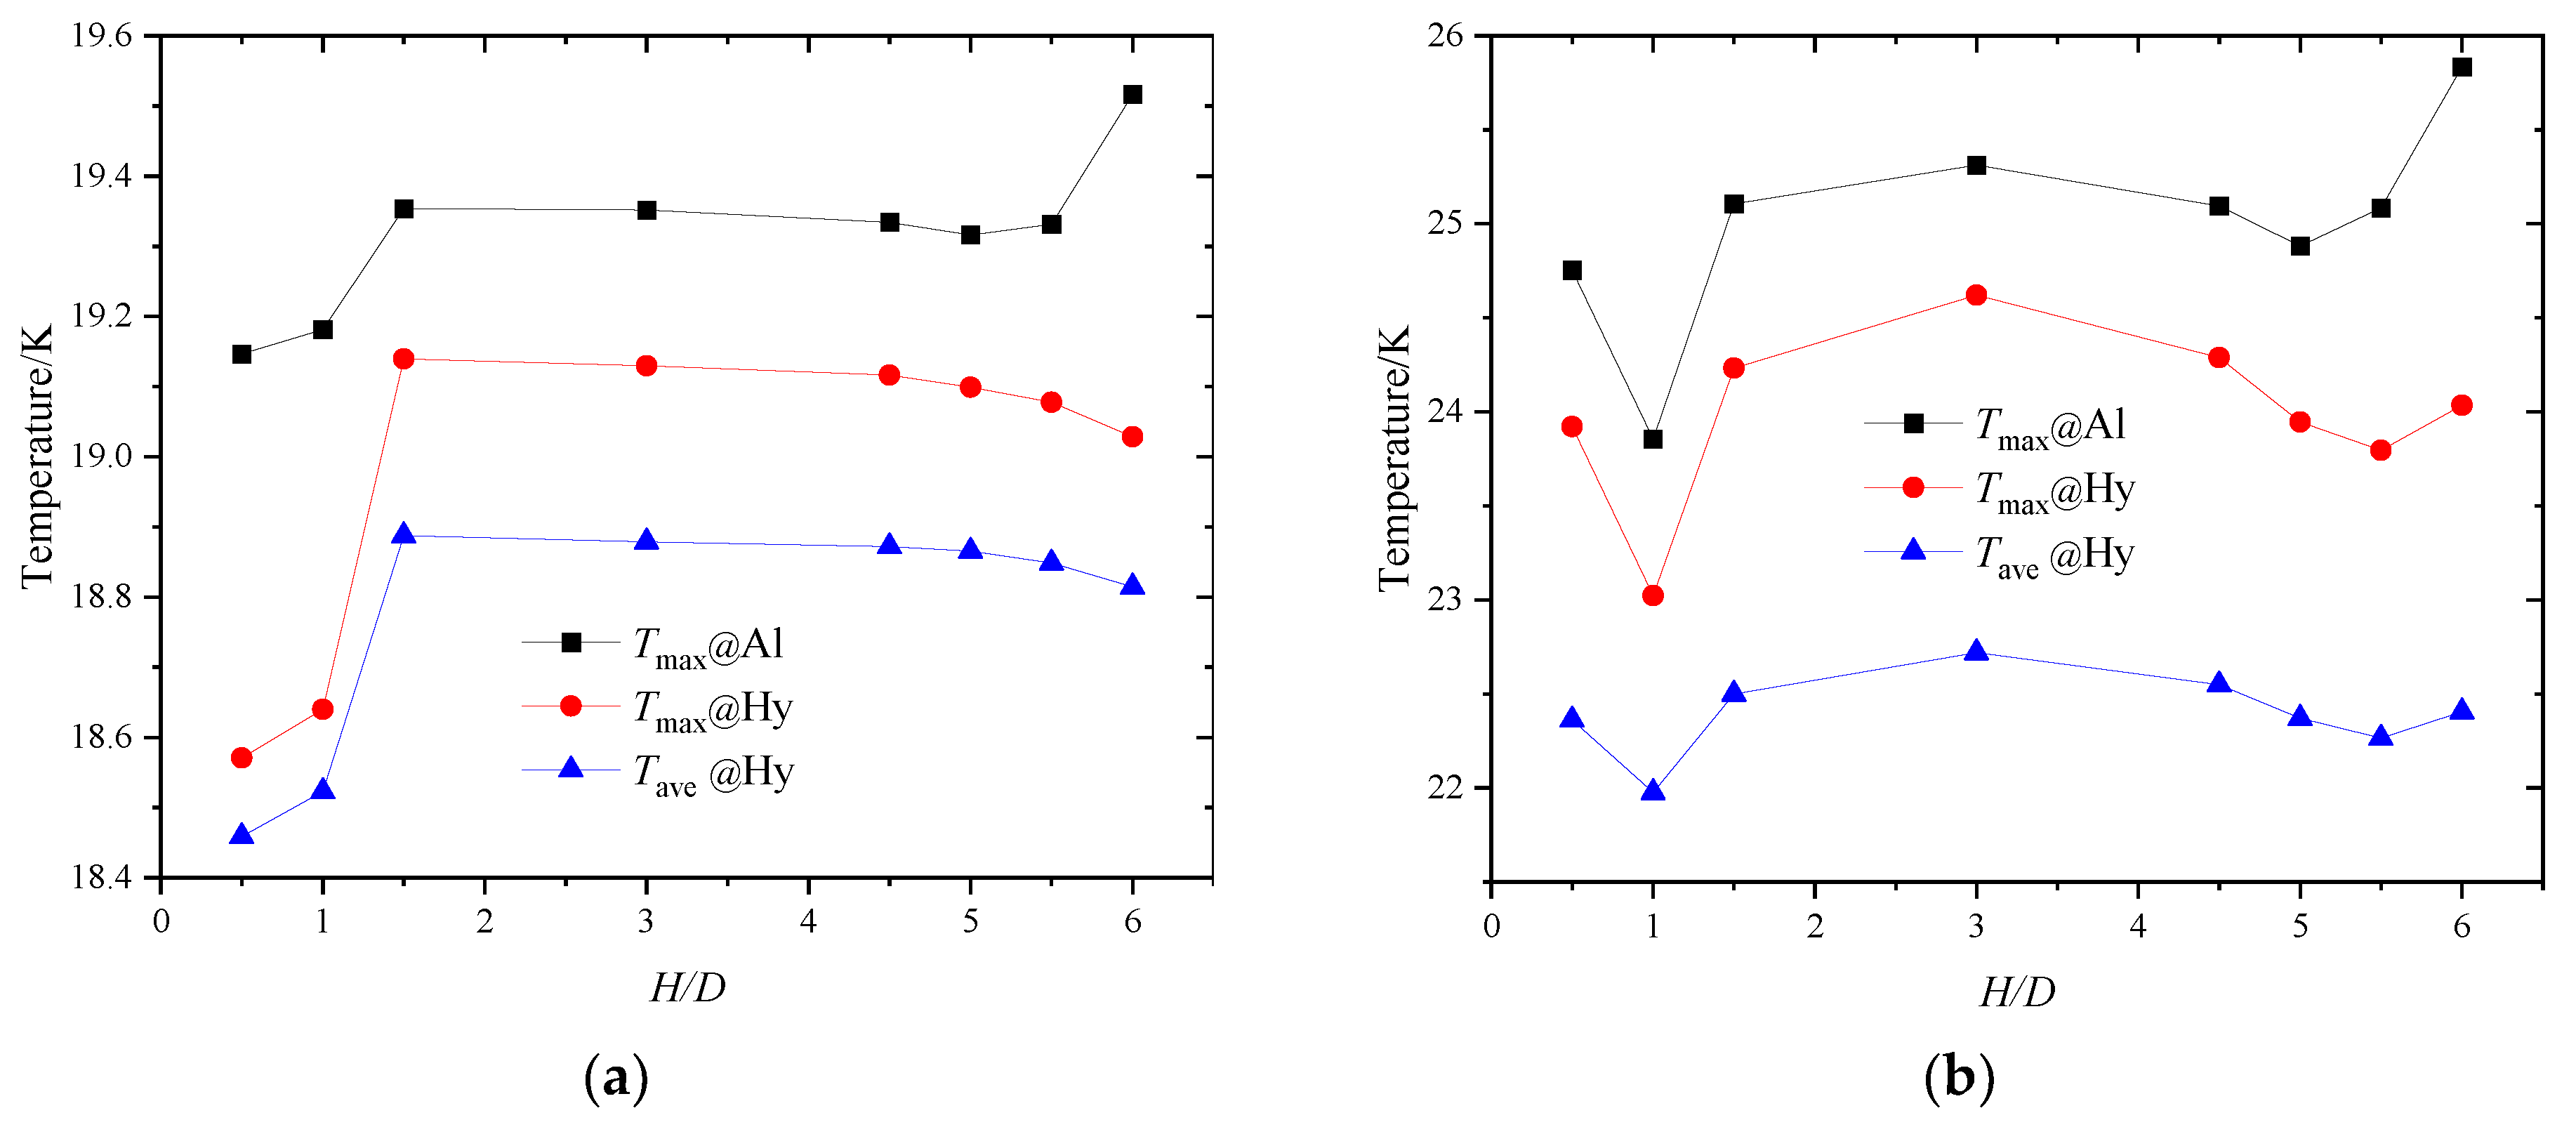
As Figure 12 shows, the temperature distribution of CHM corresponding to different H/D are comparing. The temperature of central recirculation zone in container is slightly higher than that in other parts, especially when H/D > 1. The vortex generated in central recirculation region leads to poor flow of liquid hydrogen, and velocity slows down, thus affecting the heat transfer effect. Simultaneously, the recirculation zone can effectively stabilize the internal temperature of container and avoid fluctuation interference of inlet temperature. Combined with the velocity distribution shown in Figure 9, it inferred that the velocity of long inlet pipe not affected by the central recirculation zone when hydrogen influences the bottom target surface. The inertial force brought by high-speed impact makes the liquid hydrogen diffuse rapidly along the inner wall of container, most liquid hydrogen eventually concentrated in outlet pipe. Therefore, the overall velocity is large and heat transfer effect is well at H/D = 0.5~1. The temperature on both sides of container wall increases obviously while H/D = 6, which may correspondingly to its small turbulent kinetic energy and deterioration of heat transfer by low turbulence intensity. A similar phenomenon occurs at H/D = 6 under 500 kW is shown in Figure 13, where the maximum temperature of wall rose from 19.4 K to 25.5 K. However, the cooling effect is not well reflecting at low H/D conditions.
Figure 14 displays the variation of maximum temperature of container and liquid hydrogen, the average temperature with H/D at 100 kW and 500 kW beam power. The temperature increases significantly when H/D is increased from 1 to 1.5 under 100 kW, and rise of maximum temperature of hydrogen was obvious, from 18.6 K to 19.1 K, given in Figure 14a. When beam power reaches 500 kW, whole temperature at different H/D rise as well as the distribution trend is roughly the same, as shown in Figure 14b. It speculated that it be related to the high heat deposition caused by this power, where the thermophysical parameters of liquid hydrogen are greatly affected by higher temperature.

3.3. Effect of H/D

For further exploring the influence of H/D on the cooling mechanism of liquid hydrogen, taking two cross sections of x = 52 and x = 54 mm near jet target area as examples, the radial turbulent kinetic energy, velocity distribution and temperature are shown in Figure 15. It is obvious that the velocity of liquid hydrogen decreases rapidly under high-speed jet. As shown in Figure 15b, normal velocity in this section area closes to 0 m/s gradually, and then due to the existence of a large radial pressure gradient, which is shown in Figure 10, the liquid hydrogen adherent flow promoted. The liquid hydrogen flow accelerated under a certain pressure gradient, and laminar flow state maintained, as shown by radial velocity distribution near stagnation point. The thinnest boundary layer in this region is only about 10 millimeters, so the surface heat transfer coefficient is the highest, which is reflected in low liquid hydrogen temperature in the region of y = 0~−15 mm. After a flow distance, due to the momentum exchange between the jet mainstream and liquid hydrogen previously filled, as well as the friction effect in boundary layer, the dissipation of jet flow energy will inevitably occur. In addition, the flow fluctuation of section x = 52 mm is large due to the backflow region generated at outlet under low H/D condition. Compared with other zones, the turbulent kinetic energy, shown in Figure 15c, in the near-wall zone maintains a high level, which helps to reduce the boundary layer thickness and enhance the heat transfer ability. With the distance of the radial distance from stagnation point, the boundary layer thickened, and the coefficient of surface heat transfer gradually reduced, the temperature near the wall increase, which is shown in Figure 15d.
To explore the influence of distance H/D on temperature distribution of CHM in detail, the current work analyzes the changes of liquid hydrogen and wall temperature gradient along radial and axial directions. At the same time, since beam power plays an important role in the change of temperature gradient and temperature value, four representative sections are selected for discussion, that is, the temperature gradient changes significantly, including x = 0 mm, x = −45 mm, y = −30 mm and y = −75 mm, as shown in Figure 16.
Figure 17 shows the variation of temperature with axial distance y on given x axis section at different H/D at 100 kW and 500 kW beam power. It can be seen that when beam power up to 100 kW, the temperature distribution of liquid hydrogen (y = 0~−10.5 mm) located in inlet pipe and its adjacent area is similar at all conditions, with a change trend but not distinct. Then, with the increase of radial distance, the temperature of liquid hydrogen in container cavity increased significantly. At the same time, due to the existence of the central recirculation zone, the temperature on the cross section of x = 0 mm was further improved, and the temperature value near lower wall surface decreased sharply, shown as Figure 17a. In addition to the central recirculation zone, the temperature of liquid hydrogen in other regions of cavity maintained at same level, and container wall contributes to the final temperature increase, shown as Figure 17b. It also can be observed that the lower H/D such as 0.5~1, in the y = −65~−15 mm section, the overall temperature curve is significantly lower than other conditions. Explaining that the distance between outlet pipe and container target surface is beneficial to cooling effect of liquid hydrogen. However, the change of H/D seems to have low effect on the temperature distribution along radius direction under 500 kW, which is different with 100 kW.
Correspondingly, Figure 18 shows that the temperature changes with axial distance x on specified y-axis section, which proved that low H/D enhances heat transfer, and the axial temperature distribution is more stable. y = −75 mm section exhibits the temperature distribution of lower wall. At beam power with 100kW, the temperature on both sides of x tends to be consistent, and the temperature value on left side (x axis negative direction) is slightly higher than that on other side, and overall temperature curve is approximately “U” type distribution. With the enhancement of beam power up to 500 kW, the “U” curve shows an inclination trend. The maximum temperature on right side is higher than that on left side, and maximum temperature difference occurs at H/D = 6, about 1.3 K.
Combined with the thermal deposition distribution shown above, it can be seen that the heat deposition of moderator is mainly concentrated at bottom of container. The heat source on the bottom of container will strengthened when beam power rises, thus making corresponding maximum temperature increase rapidly and exceed the other side. It is noteworthy that when H/D = 6, the wall temperature of four sections are at the highest level. Similar situations appear under different power, illustrated that when the exit of inlet pipe is far from container bottom, the cooling effect on wall gradually weakens.

4. Conclusions

In this paper, flowing process of supercritical hydrogen in cylindrical neutron moderator is investigating by numerical simulation approach, and influence of different inlet pipe height on flow and heat transfer are comparing. The main results are as follows,
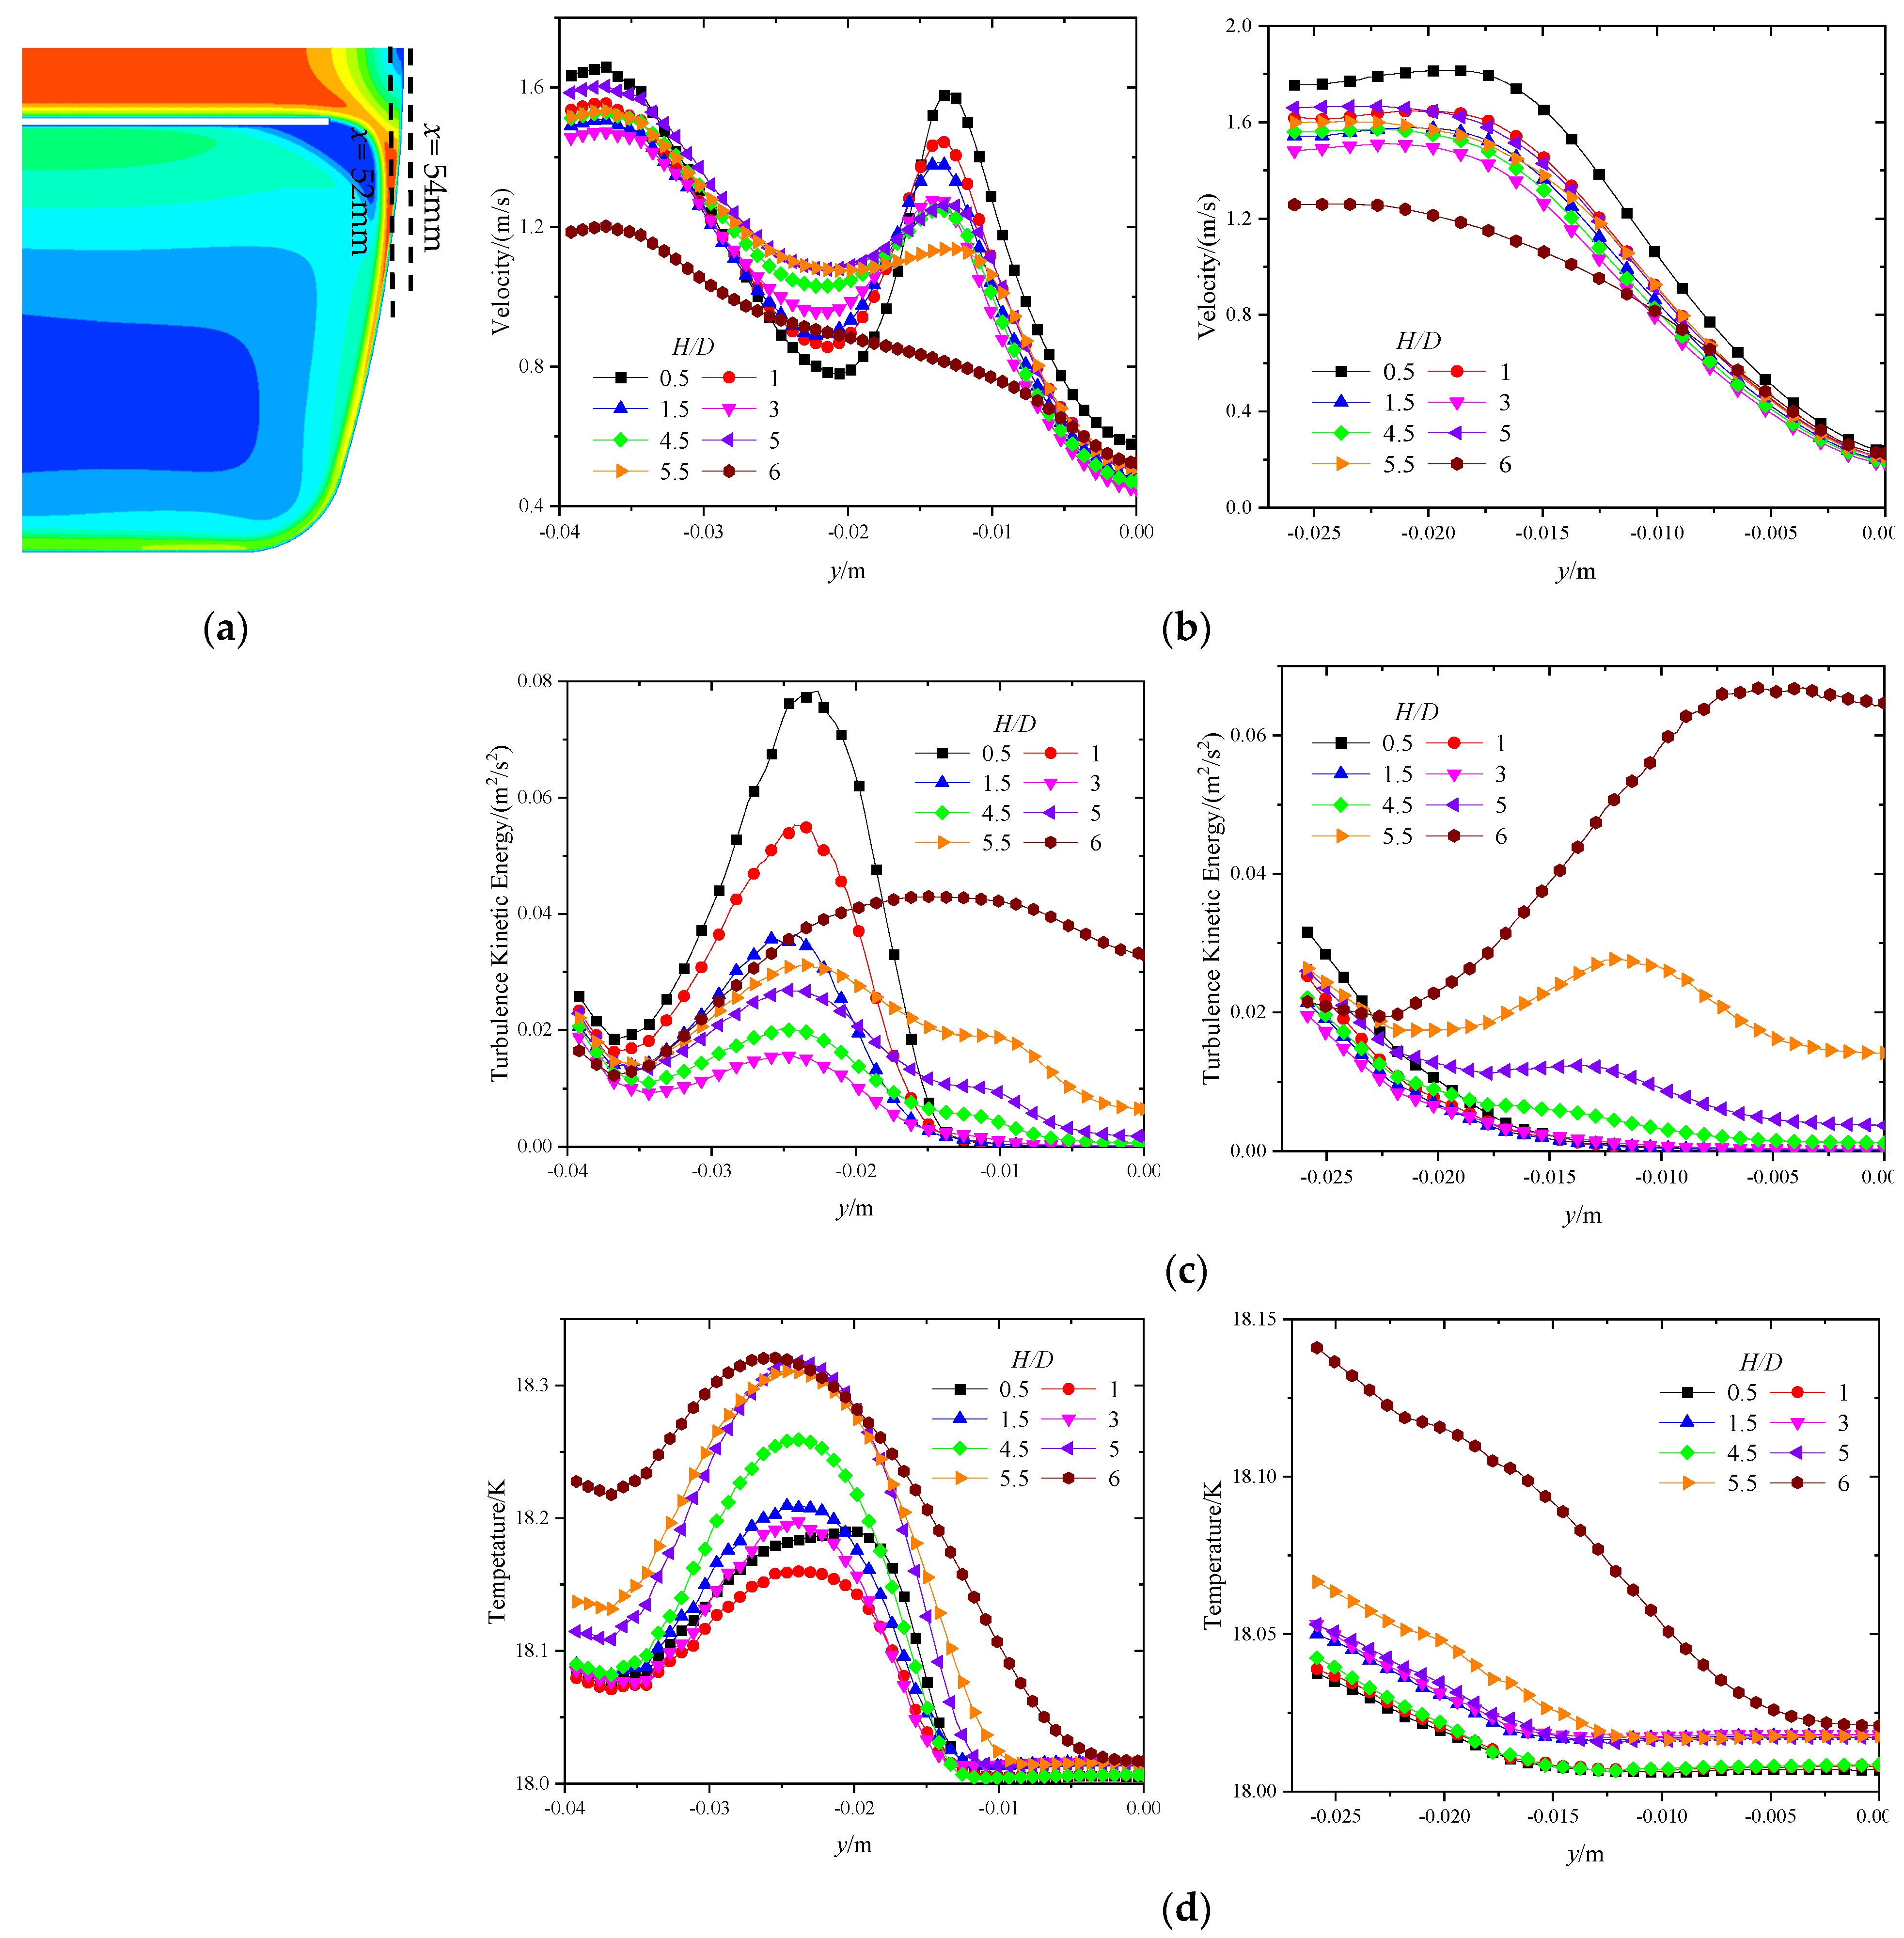
  • The vortex size and velocity gradient from container wall to vortex center vary with distance H/D, whereas the center position of vortex basically remains unchanged during variation of height, which proves that overall flow field tends to be stable.
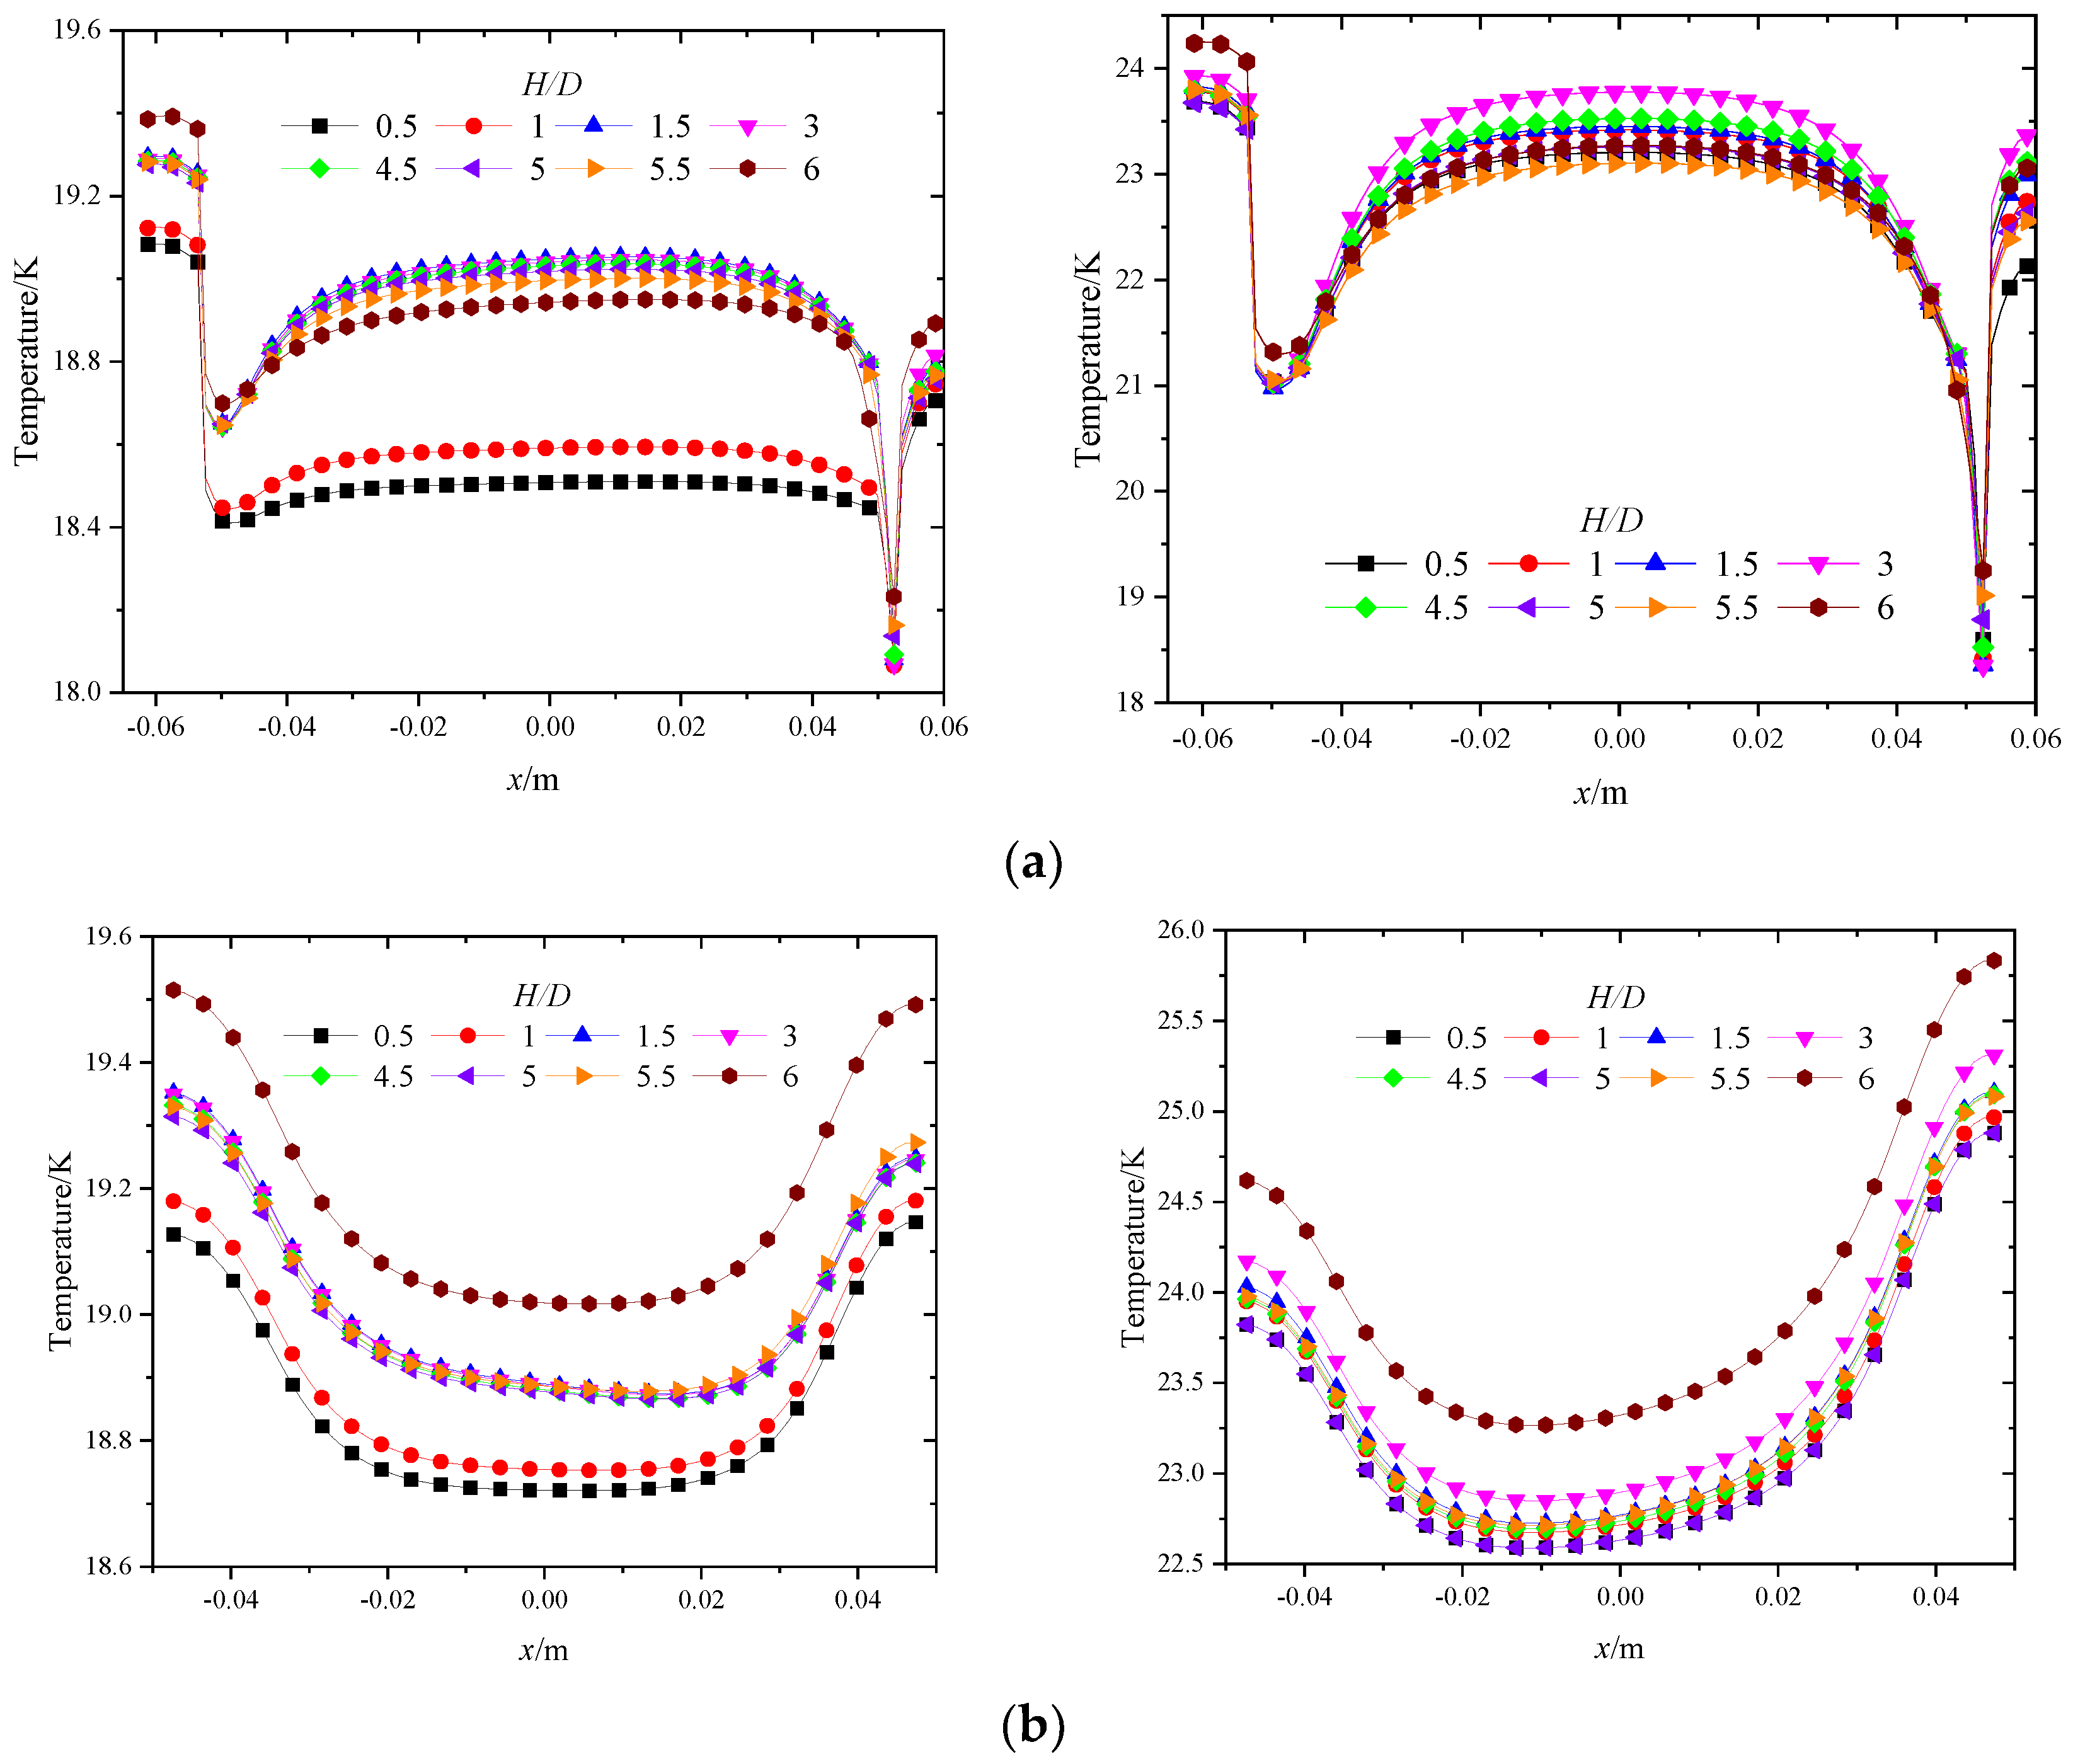
  • With distance H/D increasing, the velocity at bottom target surface progressively decreased, and the flow cooling effect is poor, leading to the rise in temperature. When H/D = 6, the local bulk temperature of liquid hydrogen reaches the maximum value. The optimal range cooling performance is H/D = 0.5~1 at Re = 1.7 × 10⁵.
  • As beam power increases, the hydrogen temperature distribution in the center of cavity remains unchanged under different H, whereas, exhibiting a sudden enhancement about wall temperature near container corner. It shows that increase of power further strengthens thermal deposition difference between container and liquid hydrogen, that is, the former dominates.
Therefore, it is necessary further optimize the cooling effect on wall temperature of moderator to adapt to higher power conditions.

Author Contributions

J.T. and L.Z. are the main authors of this manuscript. All the authors contributed to this manuscript. J.T. conceived the novel idea, and Y.L. (Yiping Lu) and S.D. performed the analysis; J.T. and Y.L. (Youlian Lu) analyzed the data and contributed analysis tools; L.Z. wrote the entire paper. T.L. and H.T. checked, reviewed and revised the paper; C.Y. and S.W. performed final proofreading and supervised this research. All authors have read and agreed to the published version of the manuscript.

Funding

This article Supported by the Program for Guangdong Introducing Innovative and Entrepreneurial Teams. (Project number: 2017ZT07S225).

Institutional Review Board Statement

Not applicable.

Informed Consent Statement

Not applicable.

Conflicts of Interest

The authors declare no conflict of interest.

Nomenclature

Tbulk temperature, K
Eenergy, kJ/kg
Pstatic pressure, Pa
Rmolecular gas constant, J/(mol·K)
Lcharacteristic length, mm
Hjet-to-surface distance, mm
Dnozzle diameter, mm
uvelocity, m/s
R e Reynolds number
Shvolumetric heat source, W/m3
Jcomponent diffusion flux, -
Twaveraging temperature of wall, K
Tccritical temperature, K
Tbbulk temperature of fluid, K
Trreference temperature, K
α temperature dependence function (alpha function)
β temperature dependence function (beta function)
a c critical attractive parameter, MPa·m6·k·mol−2
bmolar co-volume, m3·k·mol−1
fbody force, m/s2
henthalpy, J/kg
pideal gas pressure, Pa
kturbulence kinetic energy, m2/s
ubulk fluid velocity, m/s
ρ density, kg/m3
λ thermal conductivity of the fluid, W/m·K−1
ωthe specific dissipation rate, m2/s2
μ dynamic viscosity, Pa·S
σmodel constant, -
τ shear stress, N/m2
pccritical pressure, K
c p specific heat capacity, J/kg·K−1
vPRthe molar volume, L
λ effeffective thermal conductivity, W/m·K−1
τ effeffective stress tensor, N/m2
τ wboundary layer shear stress, N/m2
c 1 , c 2 , c 3 coefficients of the Mathias and Copeman alpha function
F1, F2mixing function, -

References

  1. Zhang, J. Chinese Spallation Neutron Source (CSNS) A Great Scientific Platform of Multidisciplinary Application. Bull. Chin. Acad. Sci. 2006, 21, 415–417. [Google Scholar]
  2. Wei, J.; Chen, H.S.; Chen, Y.W.; Chen, Y.B.; Chi, Y.L.; Deng, C.D.; Dong, H.Y.; Dong, L.; Fang, S.X.; Feng, J. China Spallation Neutron Source: Design, R&D, and outlook. Nucl. Instrum. Methods Phys. Res. A 2009, 600, 10–13. [Google Scholar]
  3. Wang, F.W.; Jia, X.J.; Liang, T.J.; He, C.H.; Yin, W.; Zhang, S.Y.; Zhu, T.; Yu, Q.Z.; Wang, P. Physical design of the target station and spectrometers for a spallation neutron source. Physics 2008, 34, 449–453. [Google Scholar]
  4. Fu, S.N.; Chen, H.S.; Chen, Y.B.; Ma, L.; Wang, F.W. CSNS Project Construction. J. Phys. Conf. Ser. 2018, 1021, 012002. [Google Scholar] [CrossRef]
  5. Wei, J.; Fu, S.N.; Tang, J.Y.; Tao, J.Z.; Wang, D.S.; Wang, F.W.; Wang, S. China Spallation Neutron Source-an overview of application prospects. Chin. Phys. C 2009, 33, 1033–1042. [Google Scholar]
  6. Wang, F.W.; Yan, Q.W.; Liang, T.J.; Yin, W.; Zhang, P.L.; Fu, S.N.; Tang, J.Y.; Fang, S.S.; Zhang, Z.; Zhang, J. Netron Scattering and Spallation Neutron Source. Physics 2005, 34, 731–738. [Google Scholar]
  7. Aso, T.; Tatsumoto, H.; Hasegawa, S.; Ushijima, I.; Ohtsu, K.; Kato, T.; Ikeda, Y. Design Result of the Cryogenic Hydrogen Circulation System for 1MW Pulse Spallation Neutron Source (JSNS) in J-PARC. Adv. Cryog. Eng. 2006, 51, 763–770. [Google Scholar]
  8. Andersen, K.H.; Bertelsen, M.; Zanini, L.; Klinkby, E.B.; Schönfeldt, T.; Bentley, P.M.; Saroun, J. Optimization of moderators and beam extraction at the ESS. J. Appl. Crystallogr. 2018, 51, 264–281. [Google Scholar] [CrossRef]
  9. Kiyanagi, Y.; Ooi, M.; Ogawa, H.; Furusaka, M. Development of Hydrogen Cold Moderator Systems for a Spallation Neutron Source. J. Neutron Res. 2011, 11, 3–11. [Google Scholar] [CrossRef]
  10. Ji, Y.; Sun, J.; Shi, L. Numerical Investigation of Convective Heat Transfer to Supercritical Pressure Hydrogen in a Straight Tube. J. Nucl. Eng. Radi. Sci. 2018, 4, 1–6. [Google Scholar] [CrossRef]
  11. Xie, P.Y.; Zhang, X.B. Hydrogen flow and heat transfer characteristic analysis in cooling channel wall with the spherical convexity structure. Int. J. Hydrog. Energ. 2019, 44, 20504–20515. [Google Scholar] [CrossRef]
  12. Xie, P.Y.; Zhang, X.B. Enhancement heat transfer analysis of supercritical hydrogen fuel in small-scale channels with spherical concave. Int. J. Therm. Sci. 2020, 152, 106287. [Google Scholar] [CrossRef]
  13. Xie, P.Y.; Zhang, X.B. Turbulent heat transfer analysis in supercritical hydrogen fuel flow considering thermal stratification. Numer. Heat Transf. A Appl. 2020, 77, 913–929. [Google Scholar] [CrossRef]
  14. Ellahi, R.; Zeeshan, A.; Hussain, F.; Safaei, M.R. Simulation of cavitation of spherically shaped hydrogen bubbles through a tube nozzle with stenosis. Int. J. Numer. Methods Heat Fluid Flow 2020, 30, 2535–2549. [Google Scholar] [CrossRef]
  15. Keshavarzzadeh, A.H.; Ahmadi, P.; Safaei, M.R. Assessment and optimization of an integrated energy system with electrolysis and fuel cells for electricity, cooling and hydrogen production using various optimization techniques. Int. J. Hydrog. Energy 2019, 44, 21379–21396. [Google Scholar] [CrossRef]
  16. Sarafraz, M.M.; Safaei, M.R.; Goodarzi, M.; Arjomandi, M. Reforming of methanol with steam in a micro-reactor with Cu–SiO2 porous catalyst. Int. J. Hydrog. Energy 2019, 44, 1–12. [Google Scholar] [CrossRef]
  17. Bolek, A.; Bayraktar, S. Flow and heat transfer investigation of a circular jet issuing on different types of surfaces. Sadhana Acad. Proc. Eng. Sci. 2019, 44, 242–252. [Google Scholar] [CrossRef] [Green Version]
  18. Tong, J.F.; Wang, J.L.; Zhang, H.C.; Ji, Y.; Tan, H.P. Three dimensional numerical simulation of thermal-hydraulic behaviors of CSNS decoupled poisoned hydrogen moderator with non-uniform heat source. In Proceedings of the ASME 2016 24th International Conference on Nuclear Engineering, Charlotte, NC, USA, 26–30 June 2016; pp. 1–6. [Google Scholar]
  19. Pelowitz, D.B. MCNPX User’ S Manual Version 2.5.0; Los Alamos National Laboratory: Los Alamos, NM, USA, 2005.
  20. Hirsch, C. Numerical Computation of Internal and External Flows: Fundamentals of Computational Fluid Dynamics, 2nd ed.; John Wiley & Sons Ltd.: New York, NY, USA, 2007; Volume 1. [Google Scholar]
  21. Tao, W.Q. Numerical Heat Transfer, 2nd ed.; Xi’an Jiaotong University Press: Xi’an, China, 2001. [Google Scholar]
  22. Versteeg, H.; Malalasekra, W. An Introduction to Computational Fluid Dynamics: The Finite Volume Method, 2nd ed.; Prentice Hall: Hoboken, NJ, USA, 2007. [Google Scholar]
  23. Menter, F.R. Two-equation eddy-viscosity turbulence models for engineering applications. AIAA J. 1994, 32, 1598–1605. [Google Scholar] [CrossRef] [Green Version]
  24. ANSYS Inc. ANSYS CFX Reference Guide, Release 2021 R1; ANSYS Inc.: Canonsburg, PA, USA, 2020. [Google Scholar]
  25. Tong, J.F.; Zhu, L.B.; Lu, Y.P.; Liang, T.J.; Lu, Y.L.; Wang, S.L.; Yu, C.J.; Dong, S.K.; Tan, H.P. Heat transfer analysis in supercritical hydrogen of decoupled poisoned hydrogen moderator with non-uniform heat source of Chinese spallation neutron source. Energies 2021, 14, 4547. [Google Scholar] [CrossRef]
  26. Roache, P.J. Perspective: A method for uniform reporting of grid refinement studies. J. Fluids Eng. 1994, 116, 405–413. [Google Scholar] [CrossRef]
  27. Boublik, T. The BACK equation of state for hydrogen and related compounds. Fluid Phase Equilibria 2005, 240, 96–100. [Google Scholar] [CrossRef]
  28. Peng, D.Y.; Robinson, D.B. A new two-constant equation of state. Ind. Eng. Chem. Fundam. 1976, 15, 59–64. [Google Scholar] [CrossRef]
  29. Yan, X.; Baugn, J.W.; Mesbath, M. The effect of reynolds number on the heat transfer distribution from a flat Plate to an impinging jet. In Proceedings of the ASME Winter Annual Meeting, Anaheim, CA, USA, 8–13 November 1992; Volume 226, pp. 1–7. [Google Scholar]
  30. Khashayar, N. Comparative study of eleven equations of state in predicting the thermodynamic properties of hydrogen. Int. J. Hydrog. Eng. 2010, 35, 3802–3811. [Google Scholar]
  31. Mathias, P.M.; Copeman, T.W. Extension of the Peng-Robinson equation-of-state to complex mixtures: Evaluation of the various forms of the local composition concept. Fluid Phase Equilibria 1983, 13, 91–108. [Google Scholar] [CrossRef]
  32. McCarty, R.D.; Arp, V.; Fox, J.R. GASPAK Version 3.35/3.45; CRYODATA Inc.: Littleton, CO, USA, 2007. [Google Scholar]
Figure 1. 3D View of coupled hydrogen moderator component in Chinese Spallation Neutron Source (CSNS).
Energies 14 05856 g001
Figure 2. Calculation Domain (mm).
Energies 14 05856 g002
Figure 3. The working flow chart of computational fluid dynamics (CFD).
Energies 14 05856 g003
Figure 4. The algorithm of SIMPLE.
Energies 14 05856 g004
Figure 5. Distribution of internal heat source.
Energies 14 05856 g005
Figure 6. Mesh independence verification for Coupled Hydrogen Moderator (CHM).
Energies 14 05856 g006
Figure 7. Comparison of calculation results of thermal conductivity with GASPAK.
Energies 14 05856 g007
Figure 8. Streamline profile of CHM: (a) H/D = 0.5; (b) H/D = 1.5; (c) H/D = 2.5; (d) H/D = 3.5; (e) H/D = 4.5; (f) H/D = 5.5.
Energies 14 05856 g008
Figure 9. Velocity distribution in CHM: (a) H/D = 0.5; (b) H/D = 1; (c) H/D = 1.5; (d) H/D = 3; (e) H/D = 4.5; (f) H/D = 5; (g) H/D = 5.5; (h) H/D = 6.
Energies 14 05856 g009
Figure 10. Pressure distribution in CHM: (a) H/D = 0.5; (b) H/D = 1; (c) H/D = 1.5; (d) H/D = 3; (e) H/D = 4.5; (f) H/D = 5; (g) H/D = 5.5; (h) H/D = 6.
Energies 14 05856 g010
Figure 11. Turbulent kinetic energy distribution in CHM: (a) H/D = 0.5; (b) H/D = 1; (c) H/D = 1.5; (d) H/D = 3; (e) H/D 4.5; (f) H/D = 5; (g) H/D = 5.5; (h) H/D = 6.
Energies 14 05856 g011
Figure 12. Temperature contour of moderator at proton beam power = 100 kW: (a) H/D = 0.5; (b) H/D = 1; (c) H/D = 1.5; (d) H/D = 3; (e) H/D = 4.5; (f) H/D = 5; (g) H/D = 5.5; (h) H/D = 6.
Energies 14 05856 g012
Figure 13. Temperature contour of moderator at proton beam power = 500 kW: (a) H/D = 0.5; (b) H/D = 1; (c) H/D = 1.5; (d) H/D = 3; (e) H/D = 4.5; (f) H/D = 5; (g) H/D = 5.5; (h) H/D = 6.
Energies 14 05856 g013
Figure 14. The maximum temperature varies with H/D under different power: (a) Beam power = 100 kW; (b) Beam power = 500 kW.
Energies 14 05856 g014
Figure 15. Different physical quantities radial distribution along different H/D (Left, x = 52 mm; Right, x = 54 mm): (a) Schematic of the position; (b) Velocity; (c) Turbulent kinetic energy; (d) Temperature.
Energies 14 05856 g015
Figure 16. Schematic of the position of different cross sections.
Energies 14 05856 g016
Figure 17. The variation of the temperature with y at specific x section (Left: 100 kW; Right: 500 kW): (a) x = 0 mm; (b) x = −45 mm.
Energies 14 05856 g017
Figure 18. The variation of the temperature with x at specific y section (Left: 100 kW; Right: 500 kW): (a) y = −30 mm; (b) y = −75 mm.
Energies 14 05856 g018
Table 1. Comparison of simulation results between CFX and MCNPX (W).
LocationMCNPXCFX
The Aluminum Container101103
Liquid Hydrogen149152
Publisher’s Note: MDPI stays neutral with regard to jurisdictional claims in published maps and institutional affiliations.

