Article

Experimental Analysis of Bi-Directional Heat Trading Operation Integrated with Heat Prosumers in Thermal Networks

Renewable Heat Integration Research Lab, Korea Institute of Energy Research, Gajeong-ro 152, Daejeon 34129, Korea
*
Author to whom correspondence should be addressed.
Energies 2021, 14(18), 5881; https://doi.org/10.3390/en14185881
Submission received: 2 September 2021 / Revised: 13 September 2021 / Accepted: 15 September 2021 / Published: 17 September 2021

Abstract

:
District cooling and heating methods that can utilize highly efficient heat pumps and various unused new and renewable types of energy are required to achieve low carbon emissions and zero energy usage in buildings and community units. The technical requirements for the implementation of decentralized thermal networks and heat trading are increasing, both for thermal networks in new buildings and for those remodeled based on existing centralized thermal networks. In this study, a conventional centralized thermal network was implemented as a decentralized thermal network and the possibility of heat prosumers feeding thermal networks was demonstrated experimentally. A real-scale plant was constructed by employing unused thermal energy facilities as prosumers in a school and childcare center based on the existing small-scale block heating and cooling thermal network. The decentralized thermal network and heat prosumer concepts were proven through operation experiments performed on the constructed system in summer and winter. An economic benefit can be achieved by increasing the peak power cost. The experimental results also showed that the proposed bi-directional heat trading reduced carbon emissions by 12.7% compared with conventional centralized thermal systems.

1. Introduction

With the increasing demand for the use of environmentally friendly energy and the expansion of distributed energy systems, interest in thermal energy trading and sharing is increasing in fourth-generation district heating and fifth-generation district cooling and heating in the thermal energy sector, as well as in the power sector [1,2,3]. In particular, thermal energy trade between buildings can be performed not only to utilize the surplus thermal energy existing in a building, but also to achieve economic efficiency or environmental friendliness of the heat source equipment. In other words, heat source facilities installed according to the maximum load of each building are selectively operated under various conditions, and the produced thermal energy is shared among multiple buildings. Such thermal energy trading or sharing can increase the efficiency of distributed energy systems and the utilization of renewable thermal energy.
Furthermore, interest in carbon neutrality and energy supply to buildings and communities based on renewable energy, such as RE100, has recently increased [4]. Among the many types of renewable energy, low-cost solar energy, whose equipment is easy to install, is being actively applied to buildings and in communities [5]. With the increasing level of solar power generation, however, linking surplus power to the grid is emerging as a problem, and the burden of linking solar power to the grid due to intermittent power generation is increasing. Consequently, interest in self-consumption in buildings and communities is growing [6] and research on the conversion of surplus power into heat or the installation of solar collectors instead of solar power generation facilities and the utilization of the generated power in buildings and communities is drawing attention [7].
To implement this approach, heat prosumers to whom the distributed supply of surplus heat is possible, as well as centralized heating and cooling supply, such as conventional district heating, need to be implemented. To stimulate such sharing and trading of thermal energy, fourth-generation district heating [1,2,3] or fifth-generation district heating [8,9] that can support low-temperature heating and high-temperature cooling is required. In addition, the development of mechanical systems is necessary to implement bi-directional decentralized thermal networks.
Various studies on bi-directional thermal networks have been conducted. Brange et al. [10] investigated the application of small-scale prosumers to district heating and examined the environmental impacts of various building types. They found that the heat obtained through prosumers can cover 50–120% of the annual thermal energy demand. Ancona et al. [11] implemented a connection method for constructing bi-directional thermal networks in four different district heating thermal networks. Further, Sanchez et al. [12] proposed a smart dual thermal network concept and analyzed a bi-directional heat supply between buildings for surplus thermal energy when a building with renewable energy systems is connected to the existing district heating. Brand et al. [13] conducted a simulation study on feed-in solar thermal collectors in district heating networks. Similarly, Li et al. [14] simulated a method of supplying heat to an existing heat network in a reversible mode using an absorption heat pump and analyzed the operating cost savings. Pipiciello et al. [15] constructed a pilot system for a bi-directional substation to implement a bi-directional thermal network for district heating and verified the possibility of implementing such a network by performing experiments on various control methods. Wirtz et al. [16] analyzed a method of maintaining an energy balance for a bi-directional thermal network to implement fifth-generation district cooling and heating. Meanwhile, Lorenzen et al. [17] analyzed the aspects to be considered when designing a smart thermal grid and implementing a bi-directional thermal network in the Wilhelmsburg region. Rosemann et al. [18] assessed a control method for applying a distributed solar thermal system in district heating and the resulting temperature and pressure distribution in pipes. Subsequently, Heymann et al. [19] introduced two methods of applying a distributed solar system to district heating and suggested operation schemes for each method. Kauko et al. [20] analyzed the applicability of prosumers through dynamic modeling in district heating. After modeling houses, district heating, and prosumers using the Dymola program, they analyzed the economic efficiency and CO2 reduction effect according to operations. Postnikov et al. [21] conducted a simulation analysis to reduce the peak load and optimized the cost of the maximum heating load when applying prosumers in district heating. Kim et al. [22] analyzed the bi-directional convergence of energy prosumers for an energy-sharing community. For the convergence energy system, a simultaneous heating and cooling heat pump system was proposed, and operating energy savings and the economic benefit were investigated by detailed simulation.
Recently, various research studies in terms of waste heat reuse, such as a data center as prosumers in district energy systems integrated with renewable energy and waste heat reuse, have been also investigated [23,24,25,26,27]. Wang et al. [24] investigated the thermal prosumer data center using a carbon dioxide ground-source heat-pump system. This research showed the prosumer data center waste heat recovery system showed 190.34% higher net profit compared with the conventional system. Liu et al. [25] studied data-center-park-integrated energy systems. The results showed that the proposed system can save 39,323 tons of annual carbon emissions and 1.388 power usage effectiveness. Nielsen et al. [26] investigated the accessible potential of unconventional excess heat sources, such as data centers, wastewater treatment, metros, and service sector buildings. Amiri et al. [27] investigated the feasibility in terms of waste heat recovery from data centers for applying an absorption chiller.
As examined thus far, the need for a bi-directional thermal network is increasing, and research on this topic is also expanding. Recently, heat prosumers have been operated on the pilot scale [15], but an empirical study on a bi-directional thermal network, such as the operation of an actual building, has not yet been conducted. Previous research [28] investigated two thermal energy prosumers, suggested a method of modifying the pipe network for heat trading, and presented the results of an empirical operation using this approach. Then, they demonstrated thermal energy sharing between buildings with different heat source facilities and verified the applicability of the bi-directional thermal network on typical summer and winter days.
This study investigated an experimental analysis of the energy performance of three thermal energy prosumers including the newly built building integrated with the existing thermal network. In order to analyze the thermal energy prosumers, the detailed control method and the method of converting the thermal prosumer were proposed. The pipe network was modified to enable a bi-directional thermal network, and a control system was constructed. A total of seven buildings, including three thermal energy prosumer buildings with different heat source facilities and four buildings with no heat source facilities, were connected to the thermal network, and thermal energy sharing among these buildings for more than five weeks during the cooling season was experimentally investigated. This study proves the operability of heat prosumer buildings in cooling operation and indicates the possibility of reducing operation costs and the environmental impact of the proposed heat prosumers compared to the conventional centralized heat pump operation during peak power usage hours.

2. Overview of Field Test Site

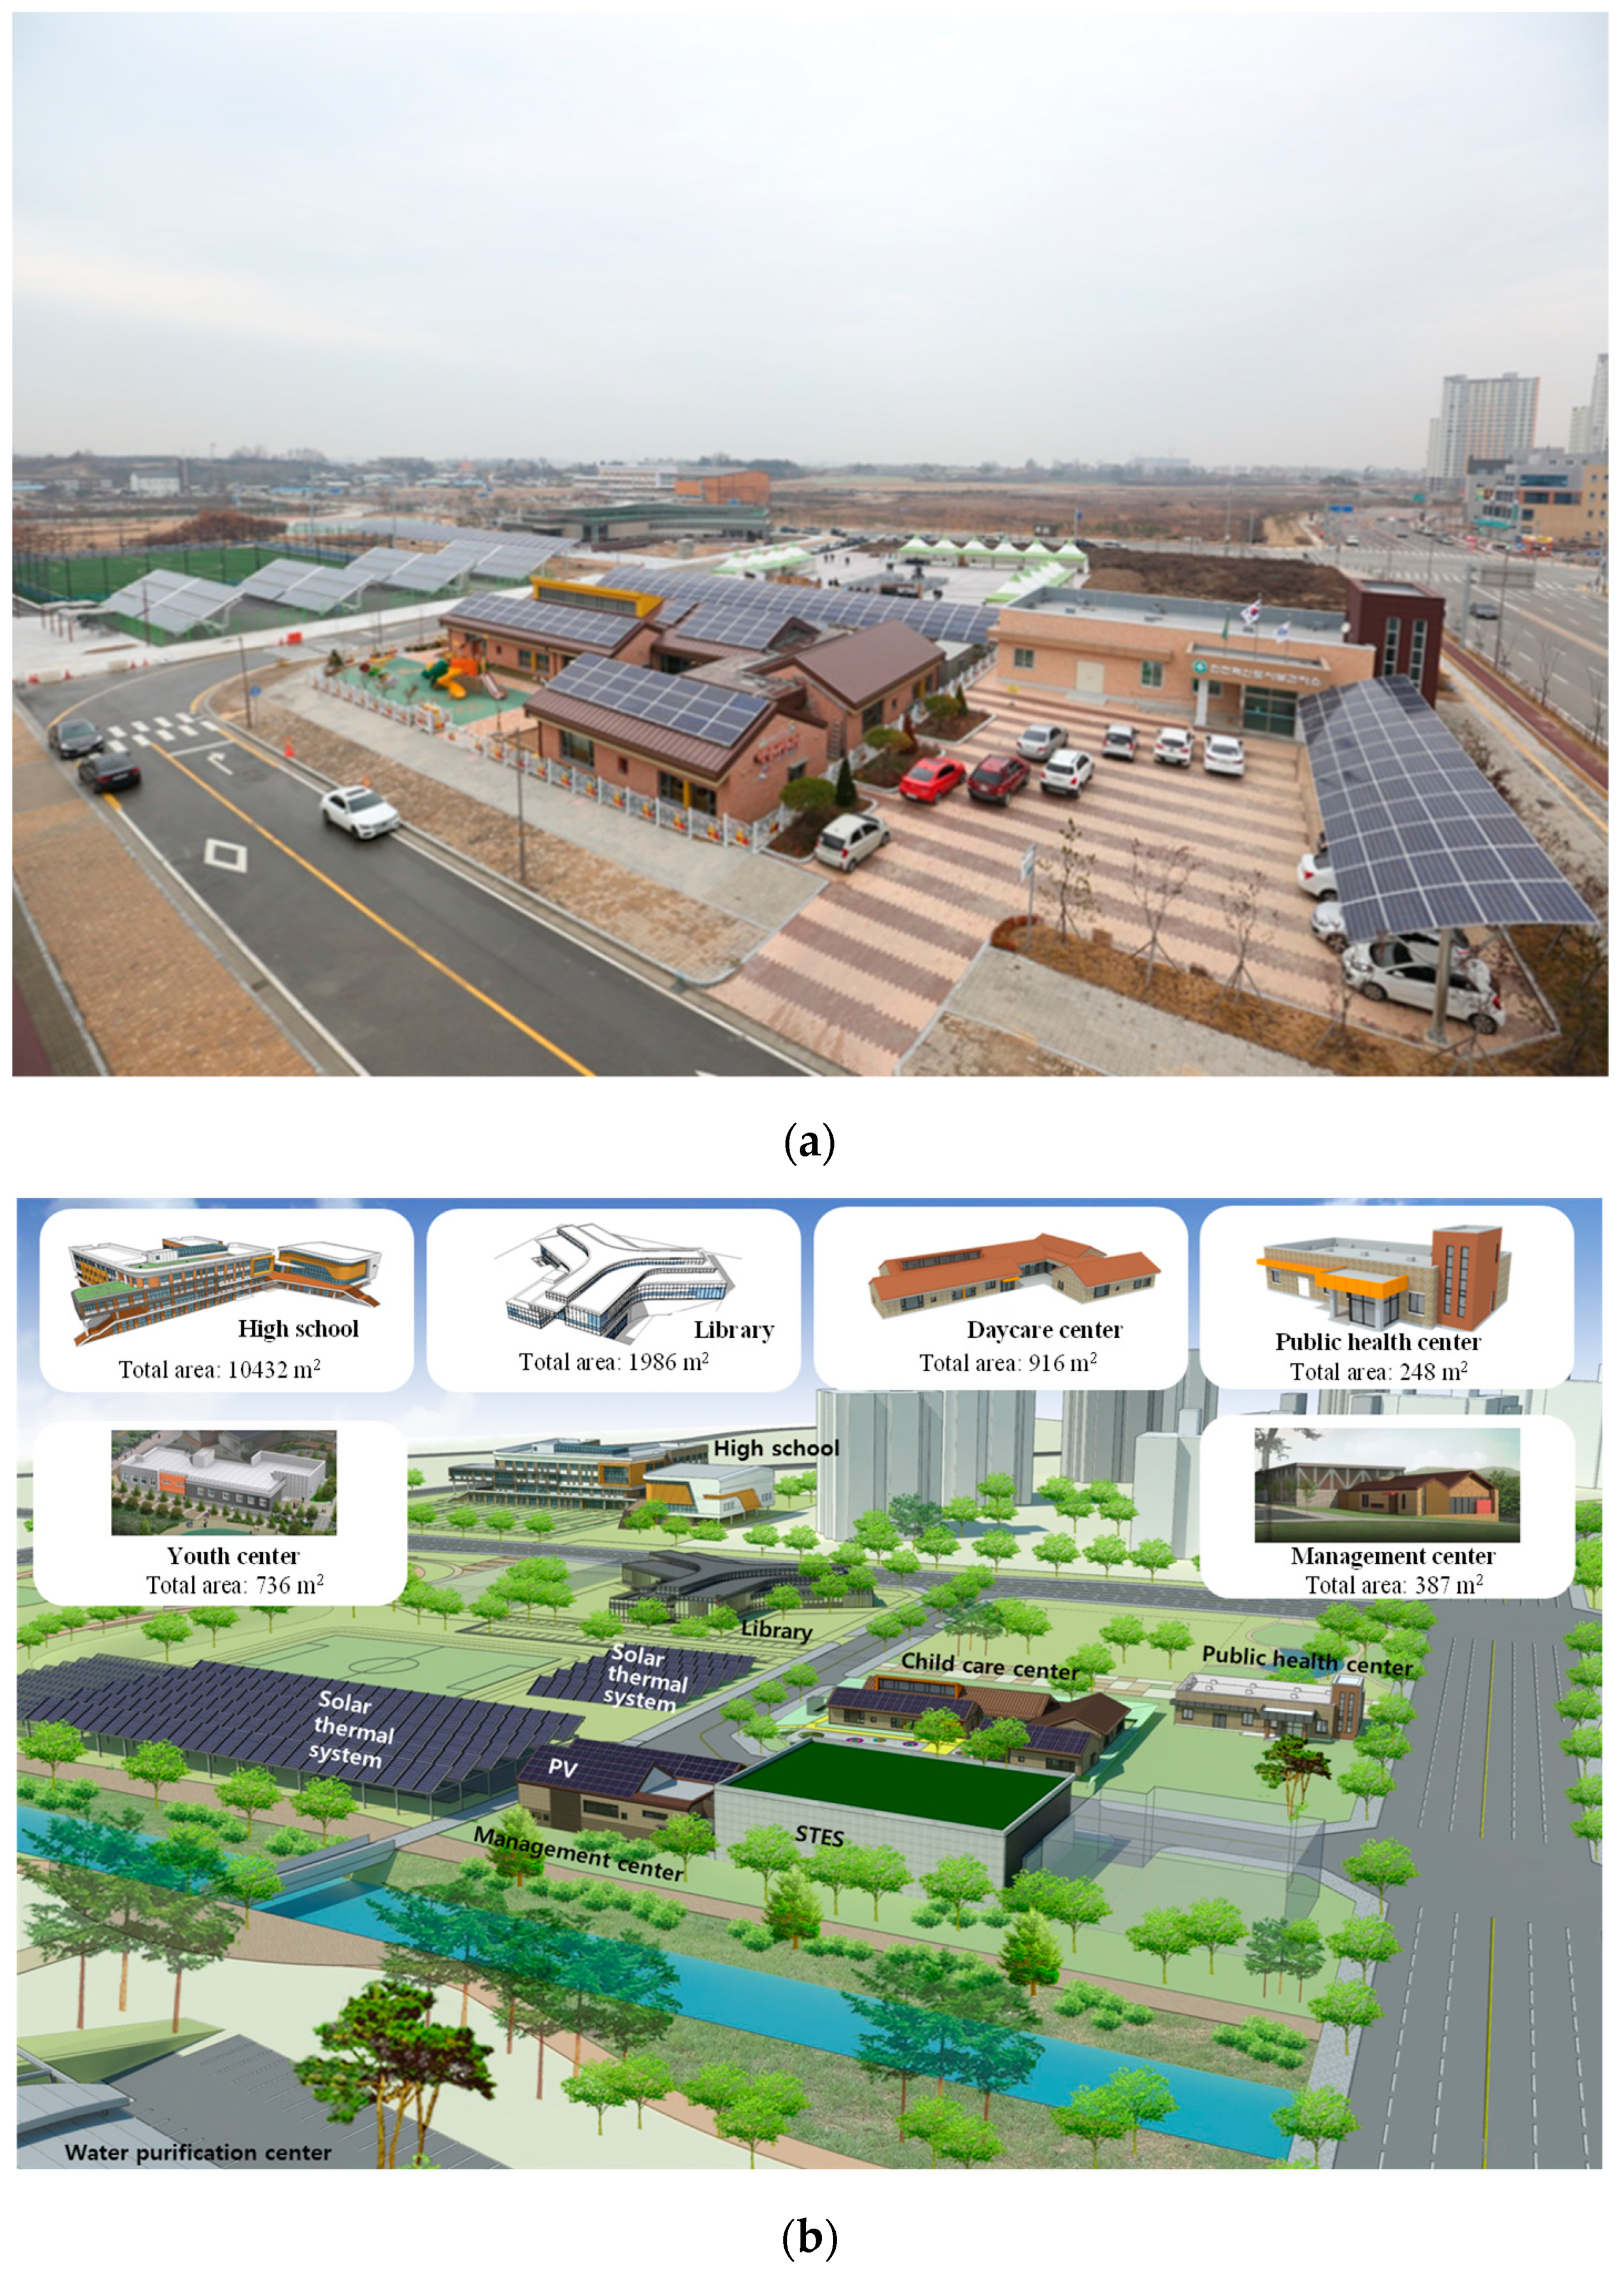
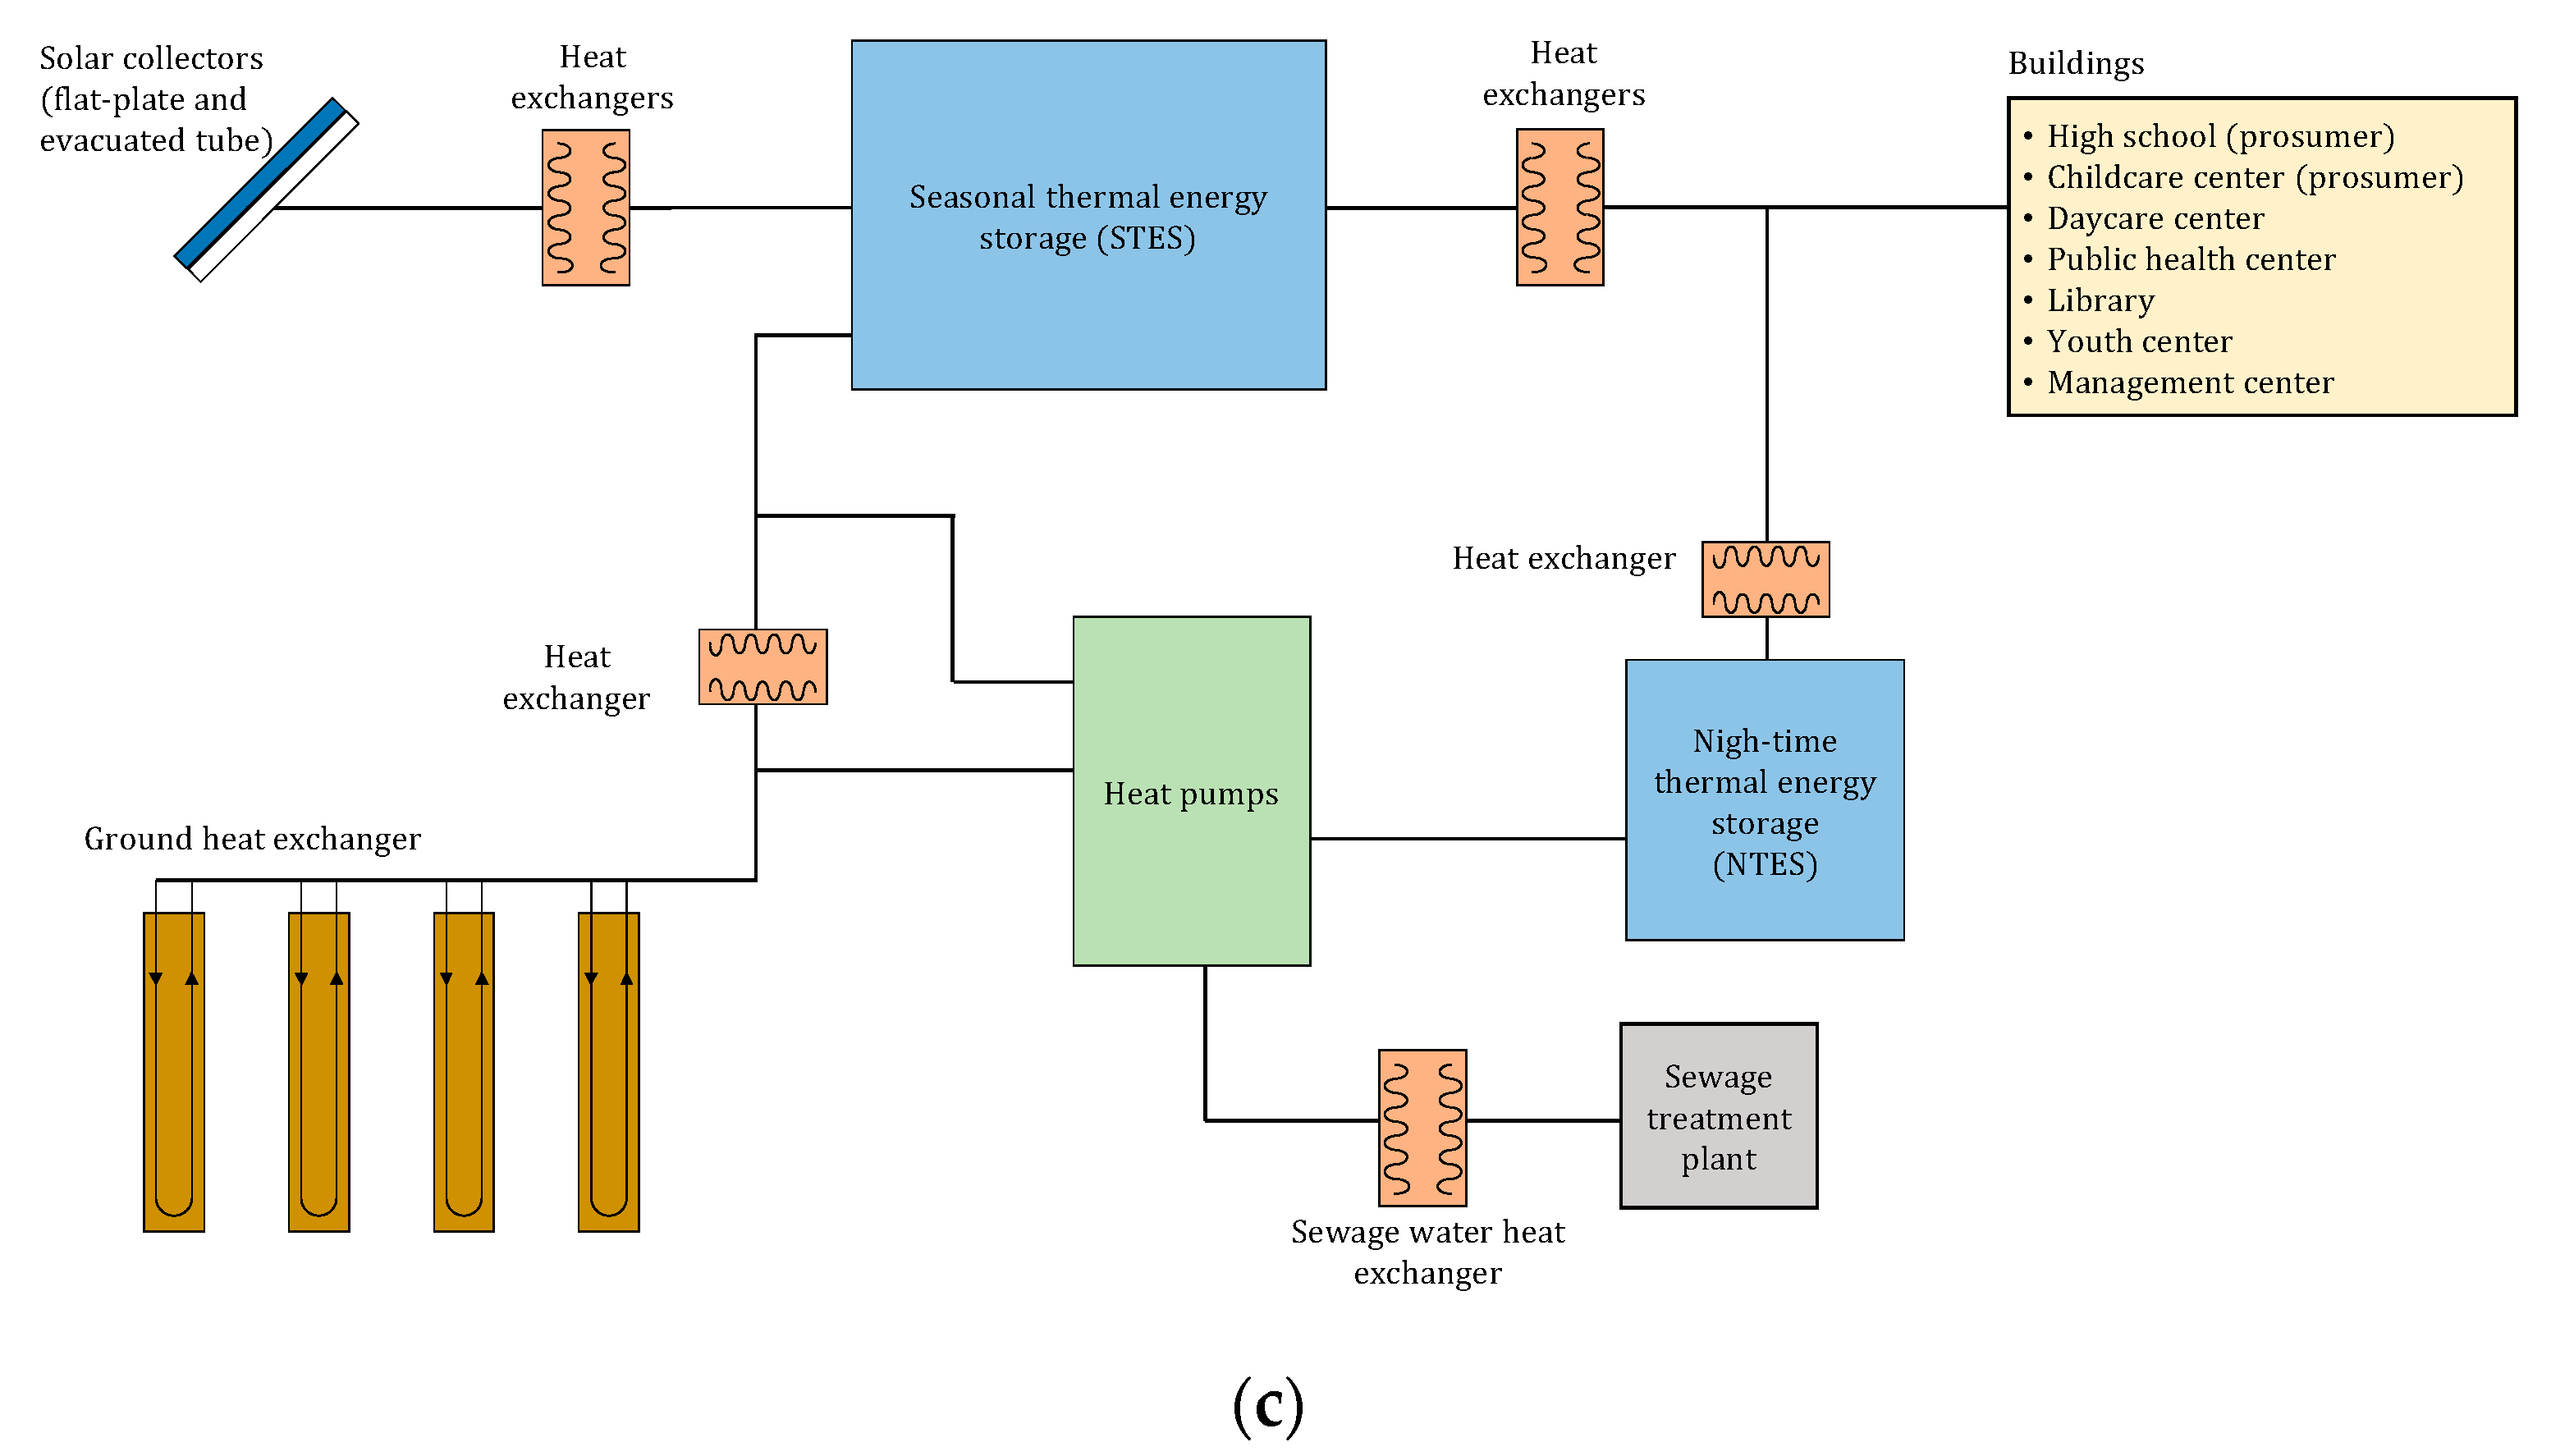
2.1. Jincheon Eco-Friendly Energy Town

The eco-friendly energy town of Jincheon was constructed as a water quality restoration center near public buildings located in Jincheon-gun in Chungbuk Innovation City. The objective is to achieve 100% self-sufficiency in terms of the annual power and thermal energy demands by installing renewable and thermal energy systems as well as supplying eco-friendly energy to nearby public buildings. The energy produced is supplied to a library, daycare center, healthcare center, youth center, and high school, as well as five other buildings, including an integrated management center that is used as a machine and public relations room. More detailed physical information of those buildings can be seen in the previous research [29]. A childcare center was recently added to the town, and a total of seven buildings were integrated into the thermal network.
Jincheon was constructed by the end of 2016 to supply thermal energy for heating and domestic hot water throughout the year based on the 1600 m2 solar thermal system and 4000 m3 seasonal thermal energy storage (Figure 1). More detailed information on the solar thermal system and seasonal thermal energy storage can be seen in previous research [29]. Three 175 kW heat pumps, including geothermal and sewage source heat pumps, were also installed as auxiliary heat source systems. A heat pump for low-temperature surplus heat was installed in the seasonal storage tank as an evaporation heat source. The 200 m3 capacity of nighttime (i.e., off-peak time) thermal energy storage (NTES) is located in the management center and connected with heat pumps as a buffer tank. Furthermore, 850 kW photovoltaic systems are installed in public buildings, parking lot roofs, and unused sites. The generated power is sold, and the grid power is consumed to realize a net-zero-energy town [29].
The 350-kW-capacity geothermal and sewage source heat pumps used as auxiliary heat source systems can produce cooling water in summer to public buildings, except for a school with large air-conditioning loads. In the school, a separate, approximately 1000 kW gas combustion absorption heat pump (AHP) has been installed and used as a cooling system. Therefore, the mechanical room in the school has a heat exchanger capable of receiving the supplied heat and channels it to supply the cooling water produced by the AHP to the interior of the school.

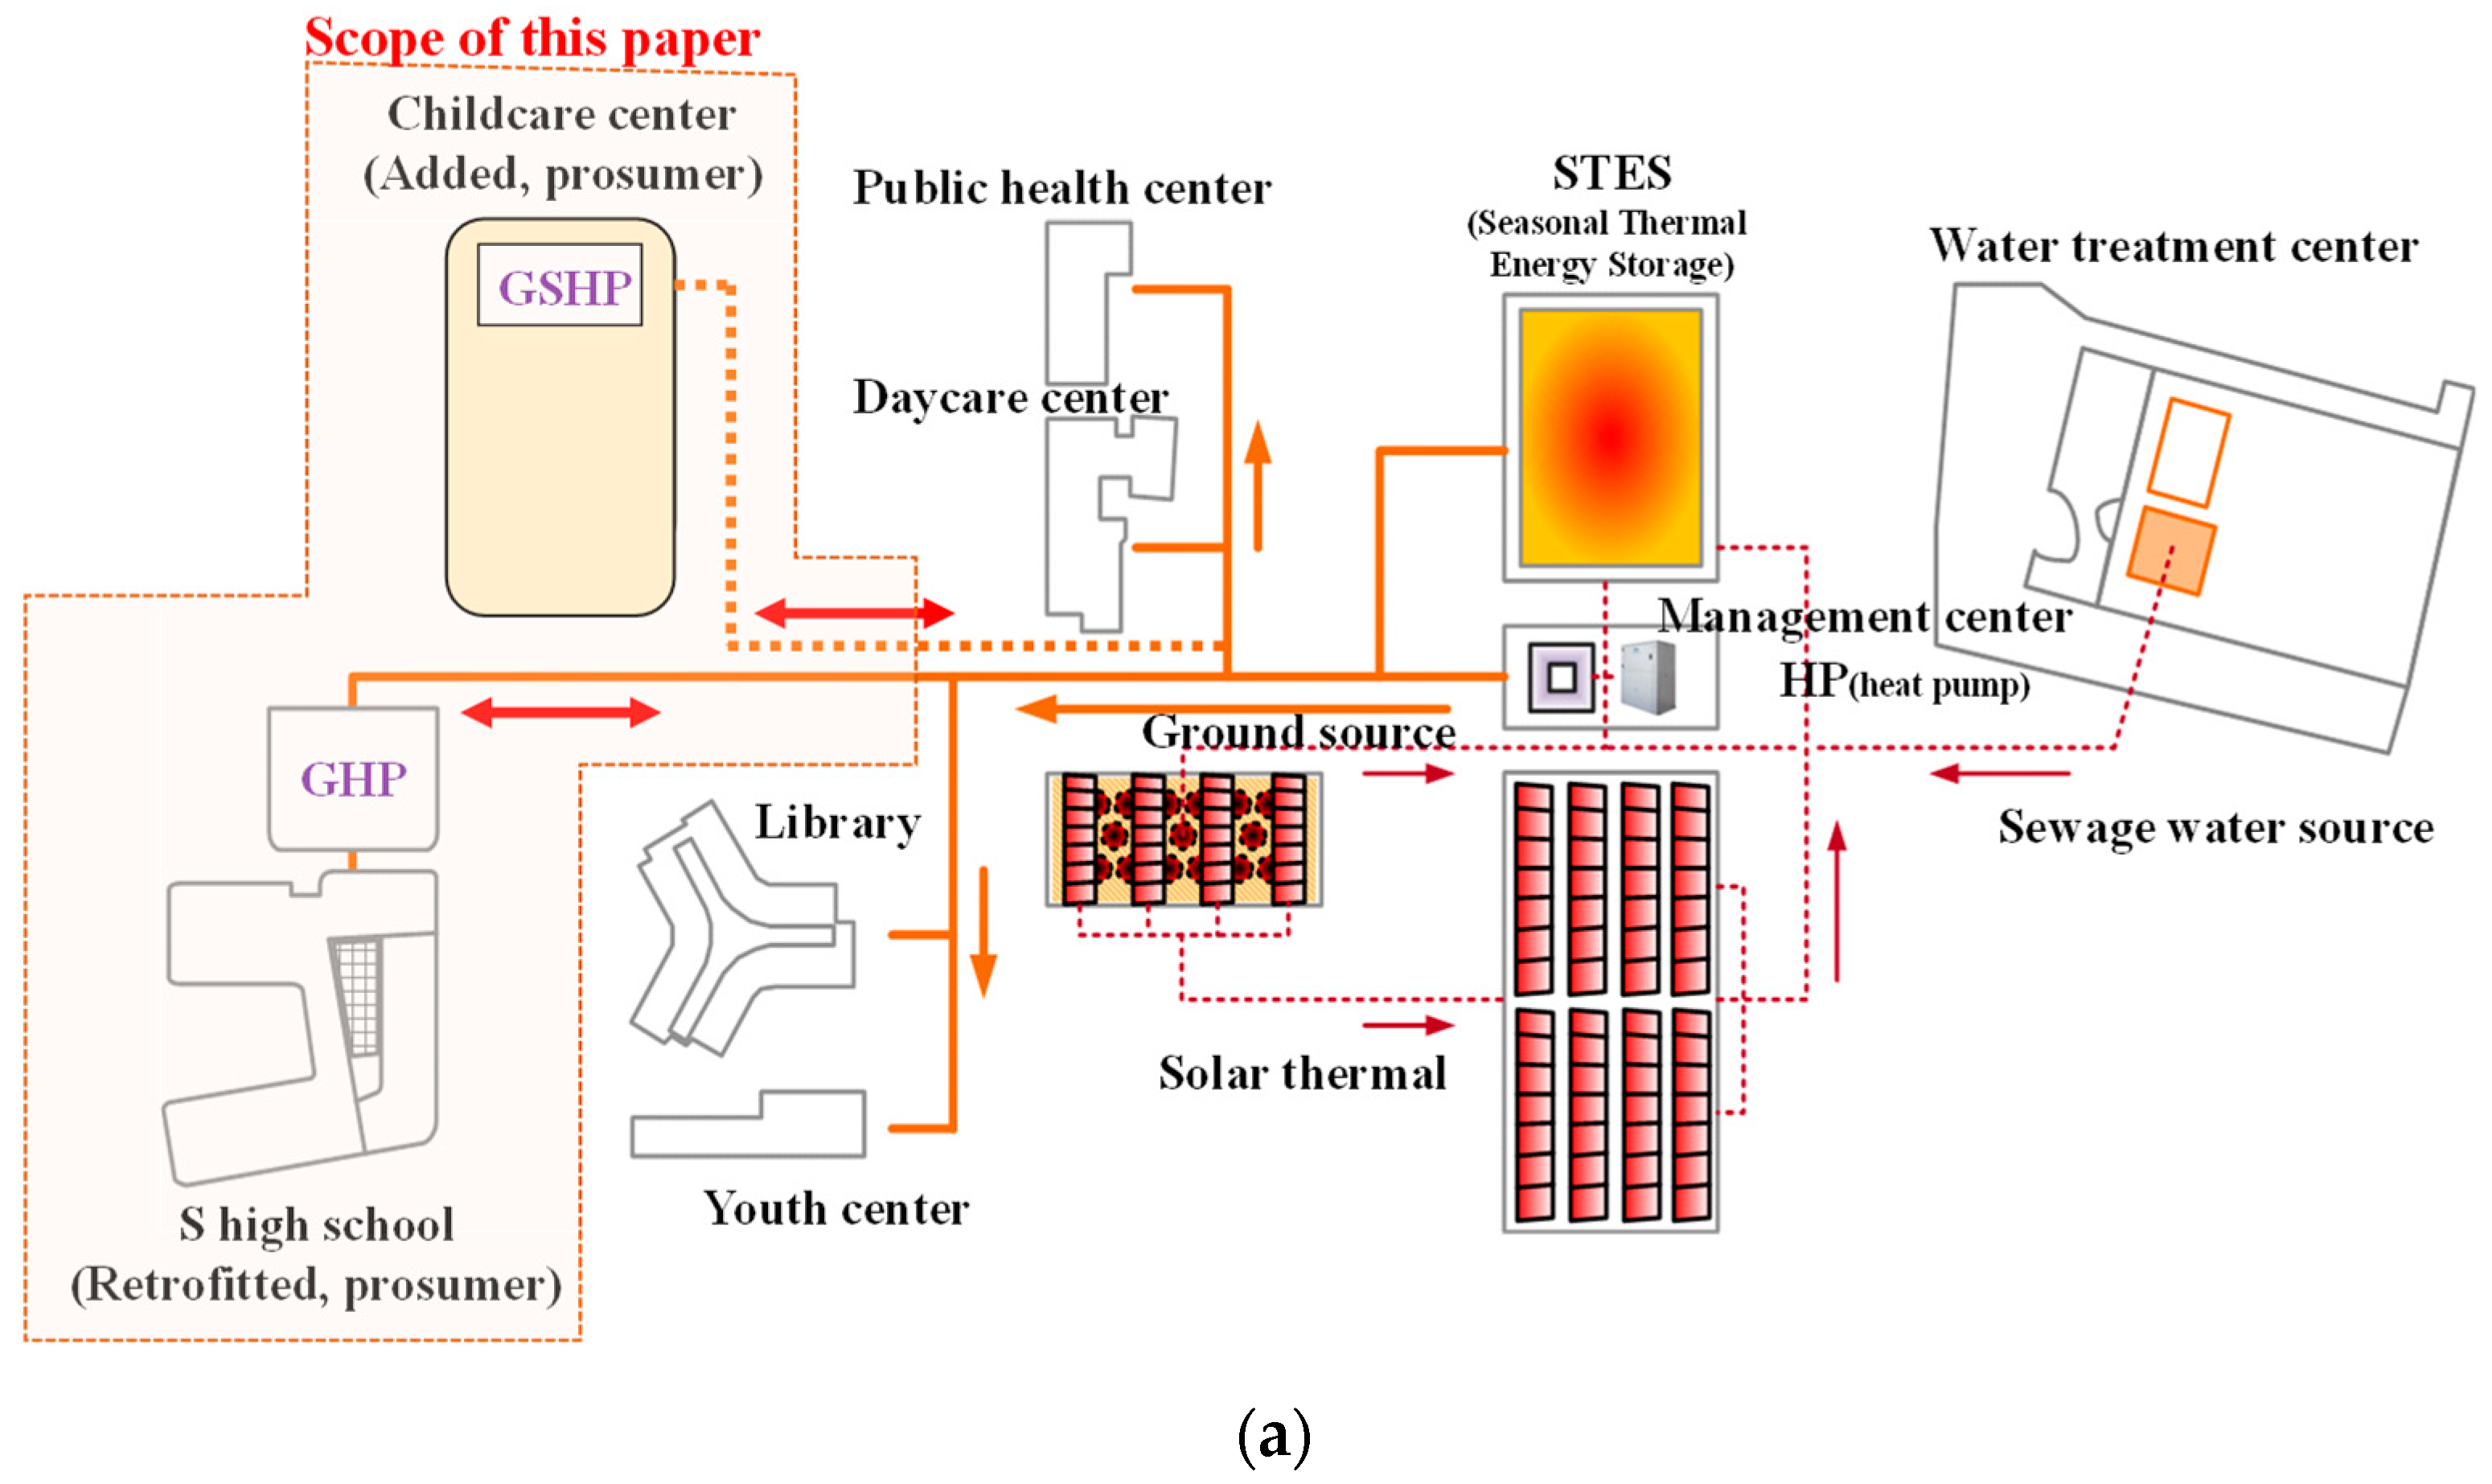
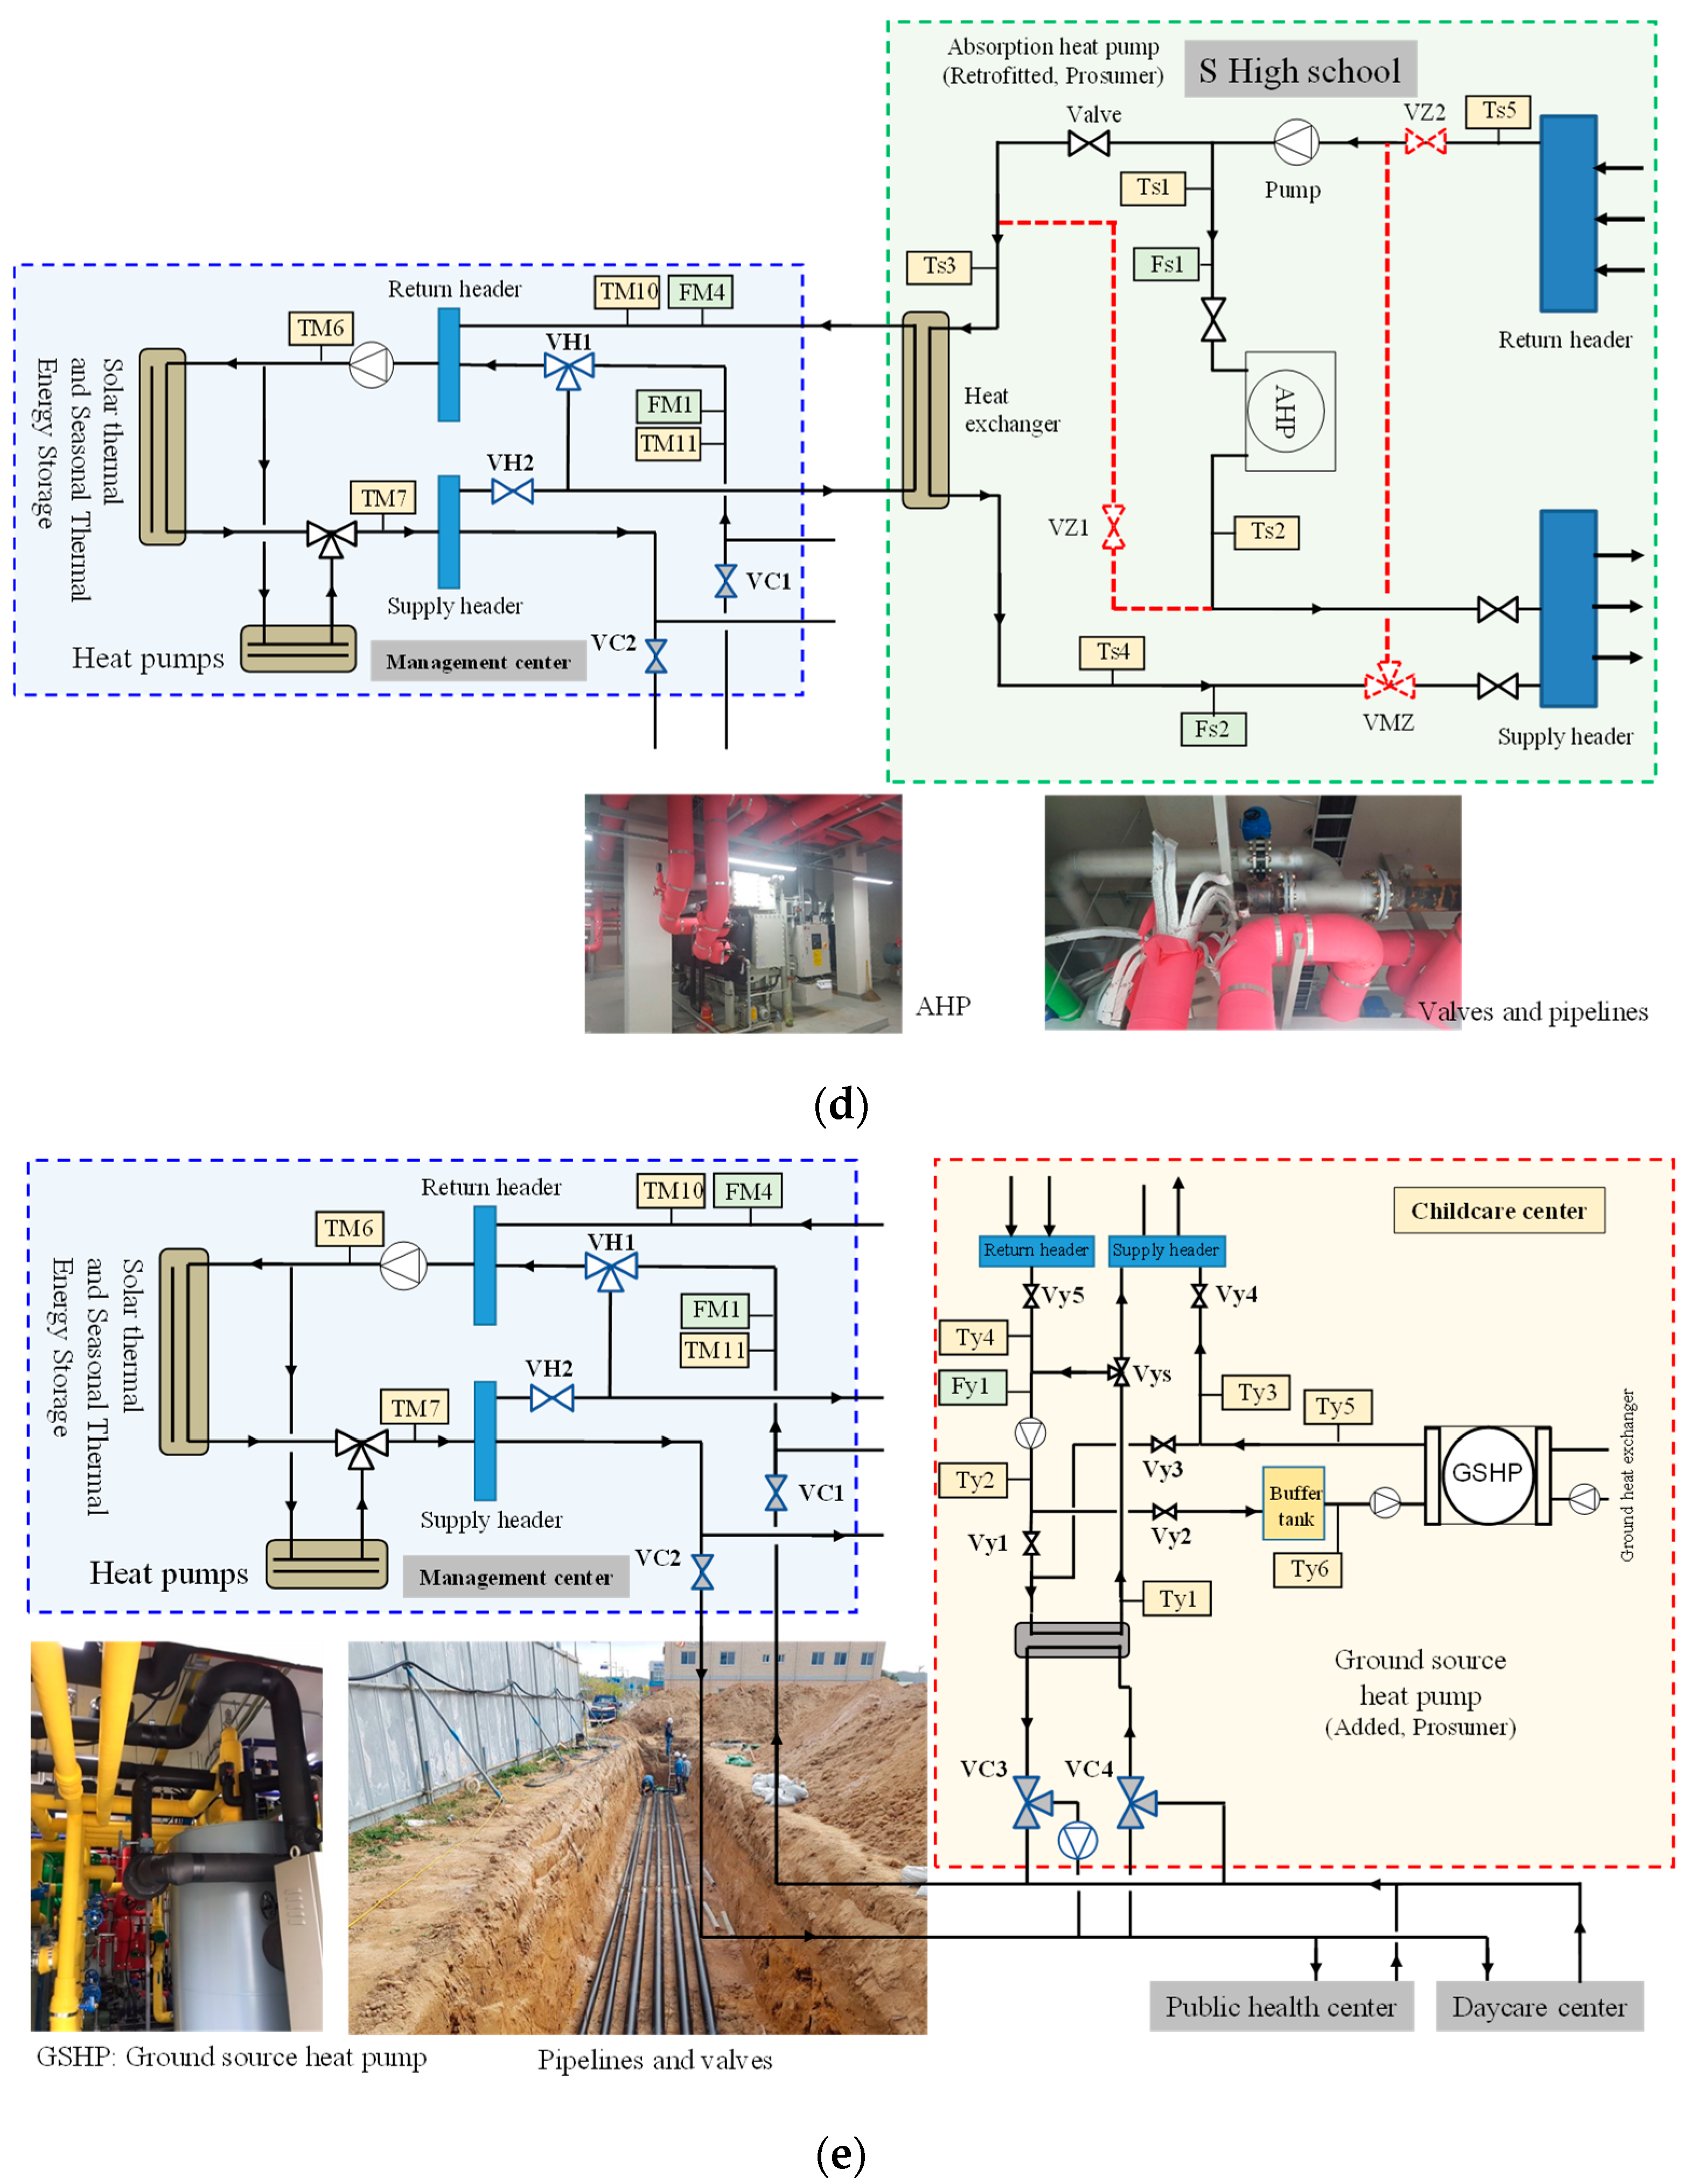
2.2. Thermal Network Retrofitting for Heat Trading

The management center normally produces cooling and heating water utilizing various heat sources, such as solar thermal systems integrated with seasonal thermal energy storage (STES) and multi-source heat pumps. The high school consumes the heating energy supplied by the management center or produced by the AHP installed in the school. The childcare center can consume heating and cooling energy produced by the geothermal source heat pump by itself or by the other two heat prosumer buildings (the high school and management center). The high school and childcare center are equipped with their own heat production facilities, and the other buildings use the heating and cooling energy supplied by the management center (Figure 2a). The childcare center has a ground-source heat pump installed with 30 RT capacity. Due to the limited capacity of the heat pump in the childcare center, the thermal energy produced by the heat pump is served to the public health center and daycare center. Figure 2 shows the operating method of the three heat prosumer buildings for trading cooling and heating energy.
During the demonstrated operations, it was determined whether the intended heat supply was properly performed while controlling each operation method according to an arbitrary schedule. Figure 2b shows the conventional centralized thermal network before retrofitting. Figure 2c depicts a typical case of the valve and pump control methods based on the prosumer operation method. As illustrated in Figure 2c, a bi-directional thermal network is enabled by installing valves and pumps. Valves VH1 and VH2 and the connecting pipes have already been installed to convert the high school into a prosumer. To convert the daycare center into a prosumer, VC1 and VC2 were installed in the management center, and the valves and connected pipes such as VC3 and VC4 were additionally installed in the daycare center. Figure 2d represents the pipeline of the high school for prosumer operation, and a control method when the heat energy produced by the AHP in the high school is shared with the buildings. Figure 2e depicts the pipeline of the childcare center for the prosumer. The childcare center can deliver or receive heating and cooling energy from the ground-source heat pump itself, the management center, or the high school.
As depicted in Figure 2d, additional experimental facilities were constructed in the school building, and Table 1 summarizes the valve controls according to various modes. Regarding the 3-way valve operation, open and close operation of middle port pathway is presented. Based on this operation scheme, three main operation modes can be identified: Consumer operation (heating mode), during which heat is received from the main mechanical room during the heating season; consumer operation (cooling mode), which takes charge of the self-cooling and heating loads through AHP operation; and prosumer operation (prosumer mode), during which heat is supplied to the block heating network while taking charge of the self-cooling and heating loads through AHP operation.
As shown in Figure 2d, the centralized thermal network method typically operates as follows. Heat is supplied by the supply header in the main mechanical room to public buildings, including the school, and is recovered to the return header. Then, the supply water temperature setpoint is maintained through a heat exchanger. To implement prosumers while maintaining the conventional thermal network pipeline, heat at a higher temperature than the supply water temperature setpoint must be produced in the school and supplied to the return pipeline again. The heat that returns to the main mechanical room must be mixed with the return water from the other buildings to maintain the supply water temperature. For this purpose, the prosumer building must produce a temperature higher than the supply water temperature setpoint, and the return water temperature of the school building must remain at the supply water temperature setpoint after being mixed with the return water from the public building. However, this method is difficult to implement.
Therefore, we redesigned the thermal network pipeline in this study, as illustrated in Figure 2d, so that when the school is operated as a prosumer, the valves (VH1 and VH2) are controlled such that the return water from the public building enters the heat exchanger supply side of the school, and the temperature of the hot or cooling water leaving the heat exchanger return side through AHP control will maintain the supply water temperature setpoint of the public building. Further, the heat passing through the heat exchanger is designed to return to the main mechanical room and to be supplied through the header to the public building. Table 1 lists the detailed operation characteristics of each valve.
As shown in Figure 2e, valves VC1–VC4 are adjusted to supply heat from the childcare center to the thermal network through prosumer operation, and an independent decentralized thermal network is configured by an additional pump operation. In addition, the childcare center mechanical room is designed to support consumer mode operation, which uses heat obtained from the centralized thermal network, by adjusting valves Vy1–Vy5 and prosumer mode operation, which can supply heat to the public health center and daycare center, by using part of the centralized thermal network. Table 2 summarizes the valve operation characteristics for each mode. Regarding the 3-way valve operation, open and close operation of middle port pathway is presented.

3. Methods

3.1. Overview of Experiments and Monitoring Systems

In this study, we analyzed the cooling energy supply operational data between 6 July and 31 August 2020. The operation experiment results of the centralized thermal network method were compared with those of the bi-directional operation experiment based on 20 days of data. The operation experiment of the centralized thermal network method was performed from 6 July to 31 July, and the bi-directional operation experiment was performed from 3 August to 31 August. During operation, optimization such as the reduction of the operation cost and peak load compared to the centralized thermal network method was not performed. Hence, the operation cost and greenhouse gas emission reduction effects that can be obtained when operating a distributed system were compared through simulation.
As shown in Table 3, various measurement sensors, such as temperature, flow, solar radiation, and electric power sensors, were installed to measure and monitor the system performance. In the experimental system, which was within the area range of this study, five pressure gauges, five flow meters, seventeen temperature sensors (RTDs), and six watt-hour meters were installed. The pressure gauges and flow meters measured the pressure and flow of the operating fluid flowing through the main pipe, respectively. The watt-hour meters measured the power consumption of the circulation and heat pumps. The measured data were recorded in 30 s intervals.

3.2. Energy Balance Equations

Using the data measured by the temperature sensors and flowmeters installed in the heat-producing facilities of the centralized thermal network and each building, the thermal energy balance of this town was estimated. The cooling load ( Q ˙ C , t o t a l ) of all the buildings can be estimated by Equation (1), and it includes the amount of cooling supply of the centralized thermal network ( Q ˙ C , C N ), the amount of cooling produced by the AHP in the school ( Q ˙ A H P , C ), and the cooling energy produced by the ground-source heat pump in the childcare center ( Q ˙ G S H P , C , c h i l d ). Charging the NTES by the heat pumps in the centralized heat pumps ( Q ˙ c h a , N T E S ,   C ) can be calculated by Equation (2). The cooling supply of the centralized thermal network ( Q ˙ C , C N ) can be estimated by Equation (3). The amount of cooling produced by the AHP in the school ( Q ˙ A H P , C ) also can be estimated by Equation (4), and it includes the amount of cooling supply to the school produced by the AHP ( Q ˙ A H P , C , sch ) and the amount of cooling supply to the public building produced by the AHP ( Q ˙ A H P , C , pub ). That cooling supply energy to the school ( Q ˙ A H P , C , sch ) and the public building ( Q ˙ A H P , C , pub ) can be calculated by Equations (5) and (6), respectively. The cooling supply from the ground-source heat pump in the childcare center ( Q ˙ G S H P , C , c h i l d ) can be calculated using Equation (7).
Q ˙ C , t o t a l = Q ˙ C , C N + Q ˙ A H P , C + Q ˙ G S H P , C , c h i l d
Q ˙ c h a , N T E S , C = V ˙ L ( F H 3 ) c p ( T T H 7 T T H 6 )
Q ˙ C N , C = V ˙ L ( F M 1 ) c p ( T c w r ( T M 11 ) T c w s ( T M 7 ) )
Q ˙ A H P , C = V ˙ L ( F s 1 ) c p ( T A H P , i n ( T s 1 ) T A H P , o u t ( T s 2 ) )
Q ˙ A H P , C , pub = V ˙ L ( F s 2 ) c p ( T s c h , h x , o u t ( T s 4 ) T s c h , h x , i n ( T s 3 ) )
Q ˙ A H P , C , sch = ( V ˙ L ( F s 1 ) V ˙ L ( F s 2 ) ) c p ( T s c h , c w r ( T s 5 ) T s c h , c w s ( T s 2 ) )
Q ˙ G S H P , C , c h i l d = V ˙ L ( F y 1 ) c p ( T G S H P , i n ( T y 6 ) T G S H P , o u t ( T y 5 ) )  
where:
c p is the specific heat of water [kJ/kg °C].
T c w s is the chilled water supply temperature from the centralized mechanical room [°C].
T c w r is the chilled water return temperature from the centralized mechanical room [°C].
T i n is the inlet water temperature [°C].
T o u t is the outlet water temperature [°C].
V ˙ L is the volumetric water flow rate [m3/s].

3.3. Simulation Overview

During the demonstration experiment period of this study, city gas work had not been completed in the school building. Thus, LPG gas was temporarily used for the AHP operation and cooking. However, because city gas will be installed in the future, we calculated the demonstration experiment results and operating costs in the case of using LPG gas and analyzed the reductions in operating cost and carbon emissions in bi-directional heat trading compared to the conventional centralized thermal network method in the case in which city gas is installed and supplied to the school in the future. The analysis was conducted under the following assumptions: the average heating value (HV) of the LPG is 94.2 MJ/m3; the density is 1.868 kg/m3, and the price of LPG is 1.47 USD/kg (0.029 USD/MJ); the HV of LNG is 43.54 MJ/m3, and the price is 0.036 USD/kWh (0.01 USD/MJ) and 0.056 USD/kWh (0.015 USD/MJ) during the cooling and heating seasons, respectively, for building cooling and heating. These values were obtained from the Korea City Gas Association. In this study, the exchange rate is assumed at 1100 USD/Won. The initial cost of the additional underground pipeline, pipeline, and valves in the mechanical room is not considered in this paper due to the fact that this cost is miscellaneous, and this paper does not consider the payback period of the proposed system.
We also considered the environmental impact of an energy-output-based emission factor approach for the proposed system. The general CO2 emission was used to represent the total greenhouse gas emission to estimate the environmental impact. As shown in Equation (8), the CO2 emission savings ( CO 2 ) can be calculated by comparing the proposed ( m C O 2 P S ) and conventional systems ( m C O 2 C S ) using global CO2 equivalent emissions ( m C O 2 ). The values of m C O 2 P S and m C O 2 C S in Equation (8) were estimated using Equations (9) and (10), respectively:
CO 2 = ( m C O 2 C S m C O 2 P S ) / m C O 2 C S
m C O 2 P S = δ · ( V ˙ g a s , A H P ) + γ · ( W G S H P , c h i l d ) + γ · ( W H P s )
m C O 2 C S = γ · ( W H P s ) ,  
where:
γ is the CO2 equivalent emission factor for electricity consumption [gCO2/kWhel].
δ is the CO2 equivalent emission factor for gas consumption [gCO2/Nm3].
V ˙ g a s , A H P is the gas consumption of absorption heat pump [Nm3/s].
W H P s is the power consumption of central heat pumps [kWh].
W G S H P , c h i l d is the power consumption of ground source heat pump in childcare center [kWh].
Values of 459.4 gCO2/kWhel and 218 gCO2/Nm3 for γ and δ , respectively, were obtained from the Energy Greenhouse with Total Information Platform Service. The cost of electricity in South Korea differs according to usage, season, and time of day. The differences in electricity costs are summarized in Table 4. The electricity prices range from 0.052 USD/kWh to 0.12 USD/kWh during the test cooling season.

4. Results and Discussion

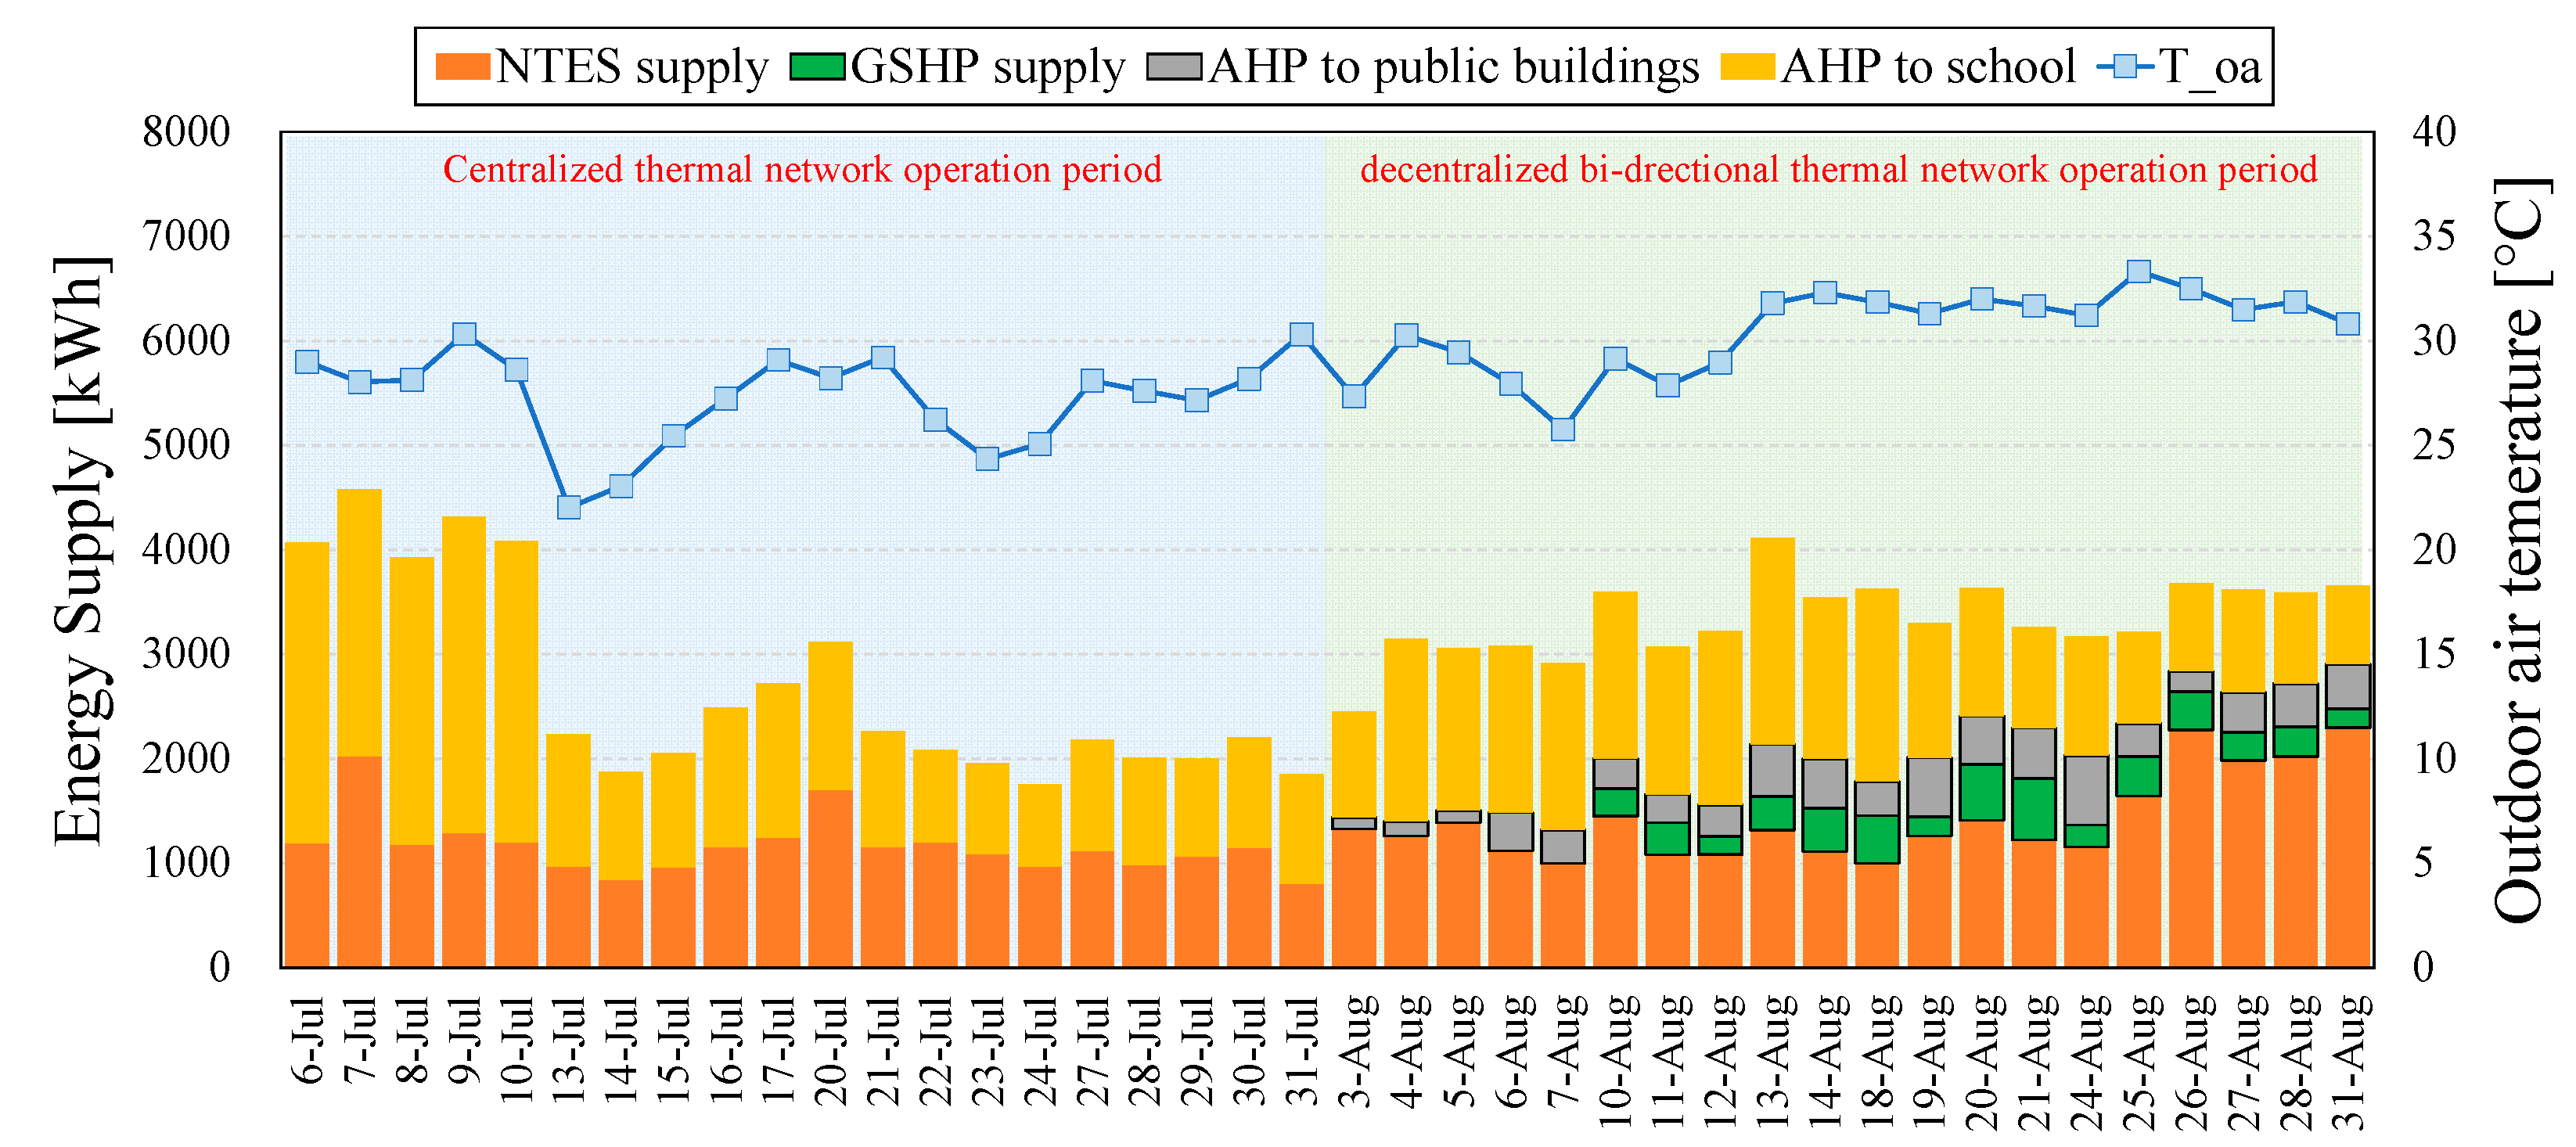
4.1. Outdoor Air Conditions and Thermal Loads

Figure 3 presents the outdoor air temperature ( T o a ) and thermal load (i.e., cooling load) during the test period. The measured daily average outdoor air temperature was 22.0–33.3 °C. In this test site, the peak cooling season is July and August. As Meteonorm 7.3 software (Fabrikstrasse, Switzerland) is able to generate TMY2 climate data using the past more than 10 years metrological data, the daily average outdoor air temperature was 21.3–30.3 °C in the peak cooling season. It was proved that the test period of this paper can represent and cover the cooling season. The total cooling load of the town ranges from 1754.9 kWh to 4580.0 kWh. During the experimental period, school buildings account for 20.5–70.6% of the total cooling load. From 6 to 10 July, the school accounts for approximately 70% of the total cooling load, but this percentage decreases to 20.6–56.6% from 13 July to 31 August, which is a vacation period.
As mentioned above, the heat was supplied by the centralized thermal network method from 6 to 31 July, and a decentralized bi-directional thermal network was operated from 3 to 31 August. In Figure 3, the gray and green bars represent the heat supplied to the public building by the bi-directional thermal network from the school and childcare centers, respectively. During the experimental period, the cooling energy supplied to the school and childcare center through the heat prosumers accounts for 3.7–2.0% and 4.8–18.0% of the total cooling load of the town, respectively.

4.2. Experimental Results of the Thermal Network

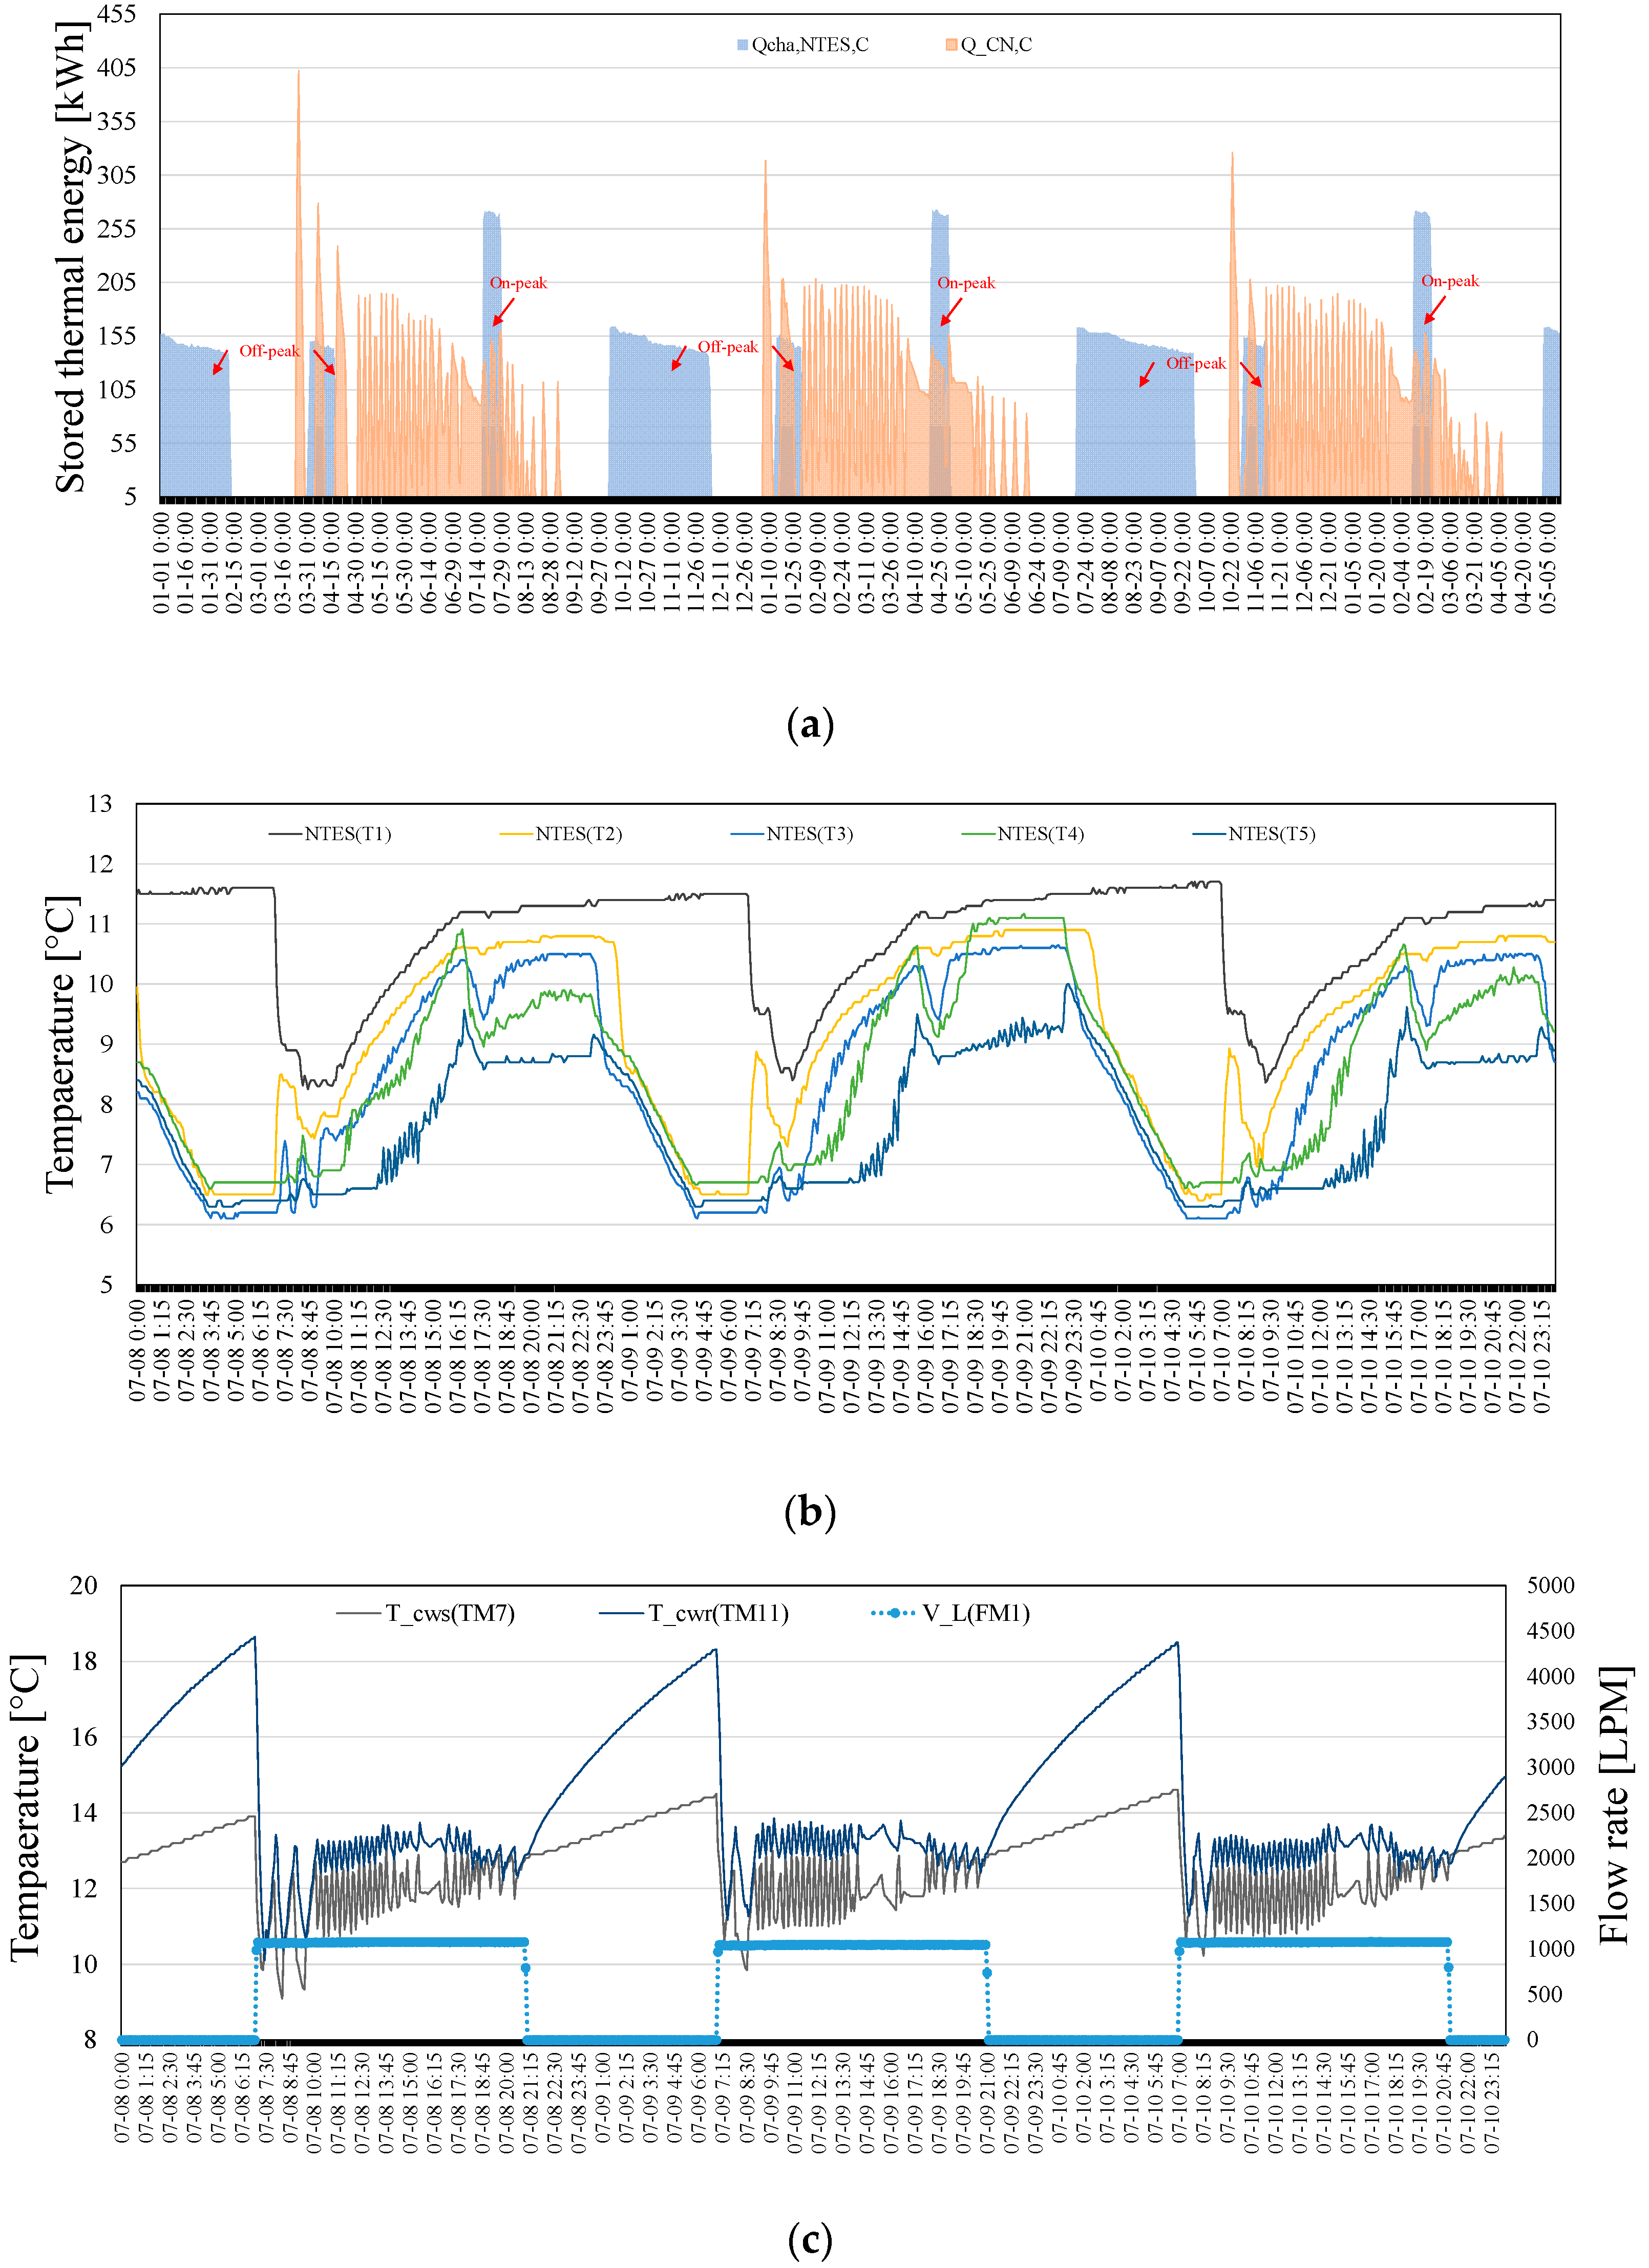
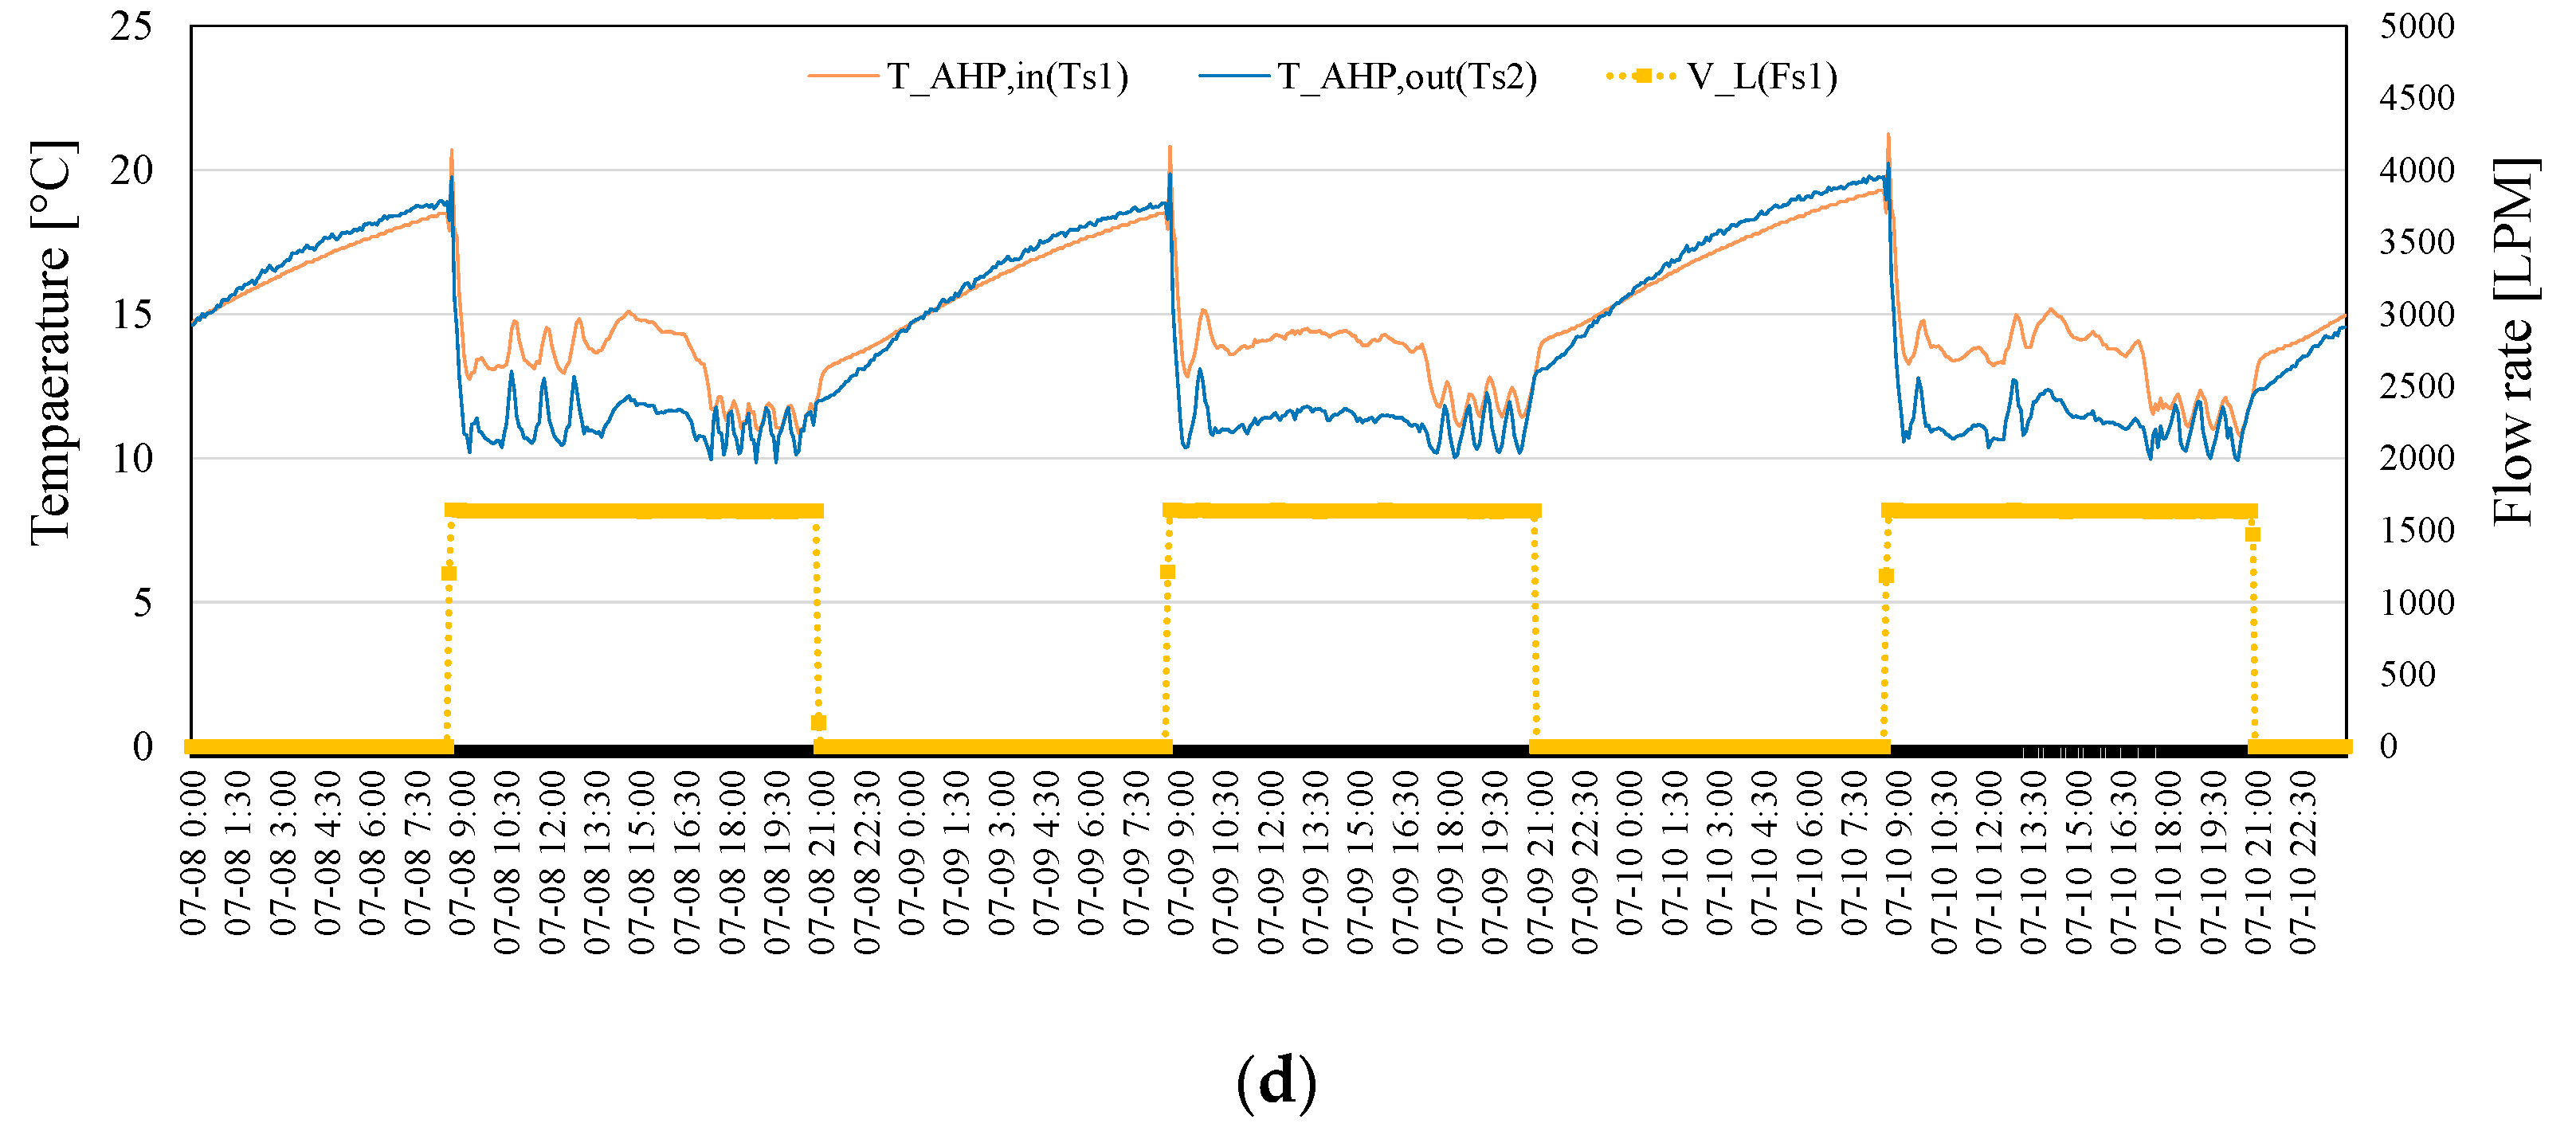
4.2.1. Conventional Centralized Thermal Network Operation

Figure 4 presents an analysis of the operation profile for the representative period from 8 to 10 July during the above-mentioned period of centralized thermal network operation. Figure 4a,b shows the inner temperature of the NTES according to thermal energy charging and discharging during the operation of the centralized thermal network. The blue area represents the heat charged into the NTES through heat pump operation ( Q ˙ c h a , N T E S , C ), and the orange area represents the discharging of the cooling to the thermal network from the NTES ( Q ˙ C N , C ). As mentioned above, heat is charged into the NTES through heat pump operation during the off-peak period, and when the temperature rises in the heat storage tank, cooling is charged through heat pump operation even during the peak period. The experimental results demonstrate that most heat charging occurs during the off-peak period. When the set cooling temperature cannot be maintained in the thermal network owing to a temperature increase at the bottom of the heat storage tank to more than 9 °C, heat is charged into the heat storage tank even during the peak period. Figure 4c shows the distributions of the cooling water supply temperature ( T c w s ( T M 7 ) ) and cooling water return temperature ( T c w r ( T M 11 ) ) inside the thermal network. The results confirm that the cooling water is supplied to the thermal network at approximately 11 °C and returned at 13 °C. The indoor temperatures of the buildings in the thermal network are maintained at appropriate levels. Supply temperature fluctuations occurred because the flow rate of the thermal network in actual operation is operated at a constant flow rate, and when a load is generated, the heat is supplied by the pump on/off of the primary heat exchanger in the thermal network. This phenomenon occurs when the load of a building is relatively small. Figure 4d depicts the temperature distributions according to the cooling water supply ( T A H P , o u t ( T s 2 ) ) and return ( T A H P , i n ( T s 1 ) ) through the operation of the AHP in the school. The results show that the cooling energy supply temperature of the school is approximately 11 °C and the return temperature is approximately 14 °C, indicating a stable heat supply.

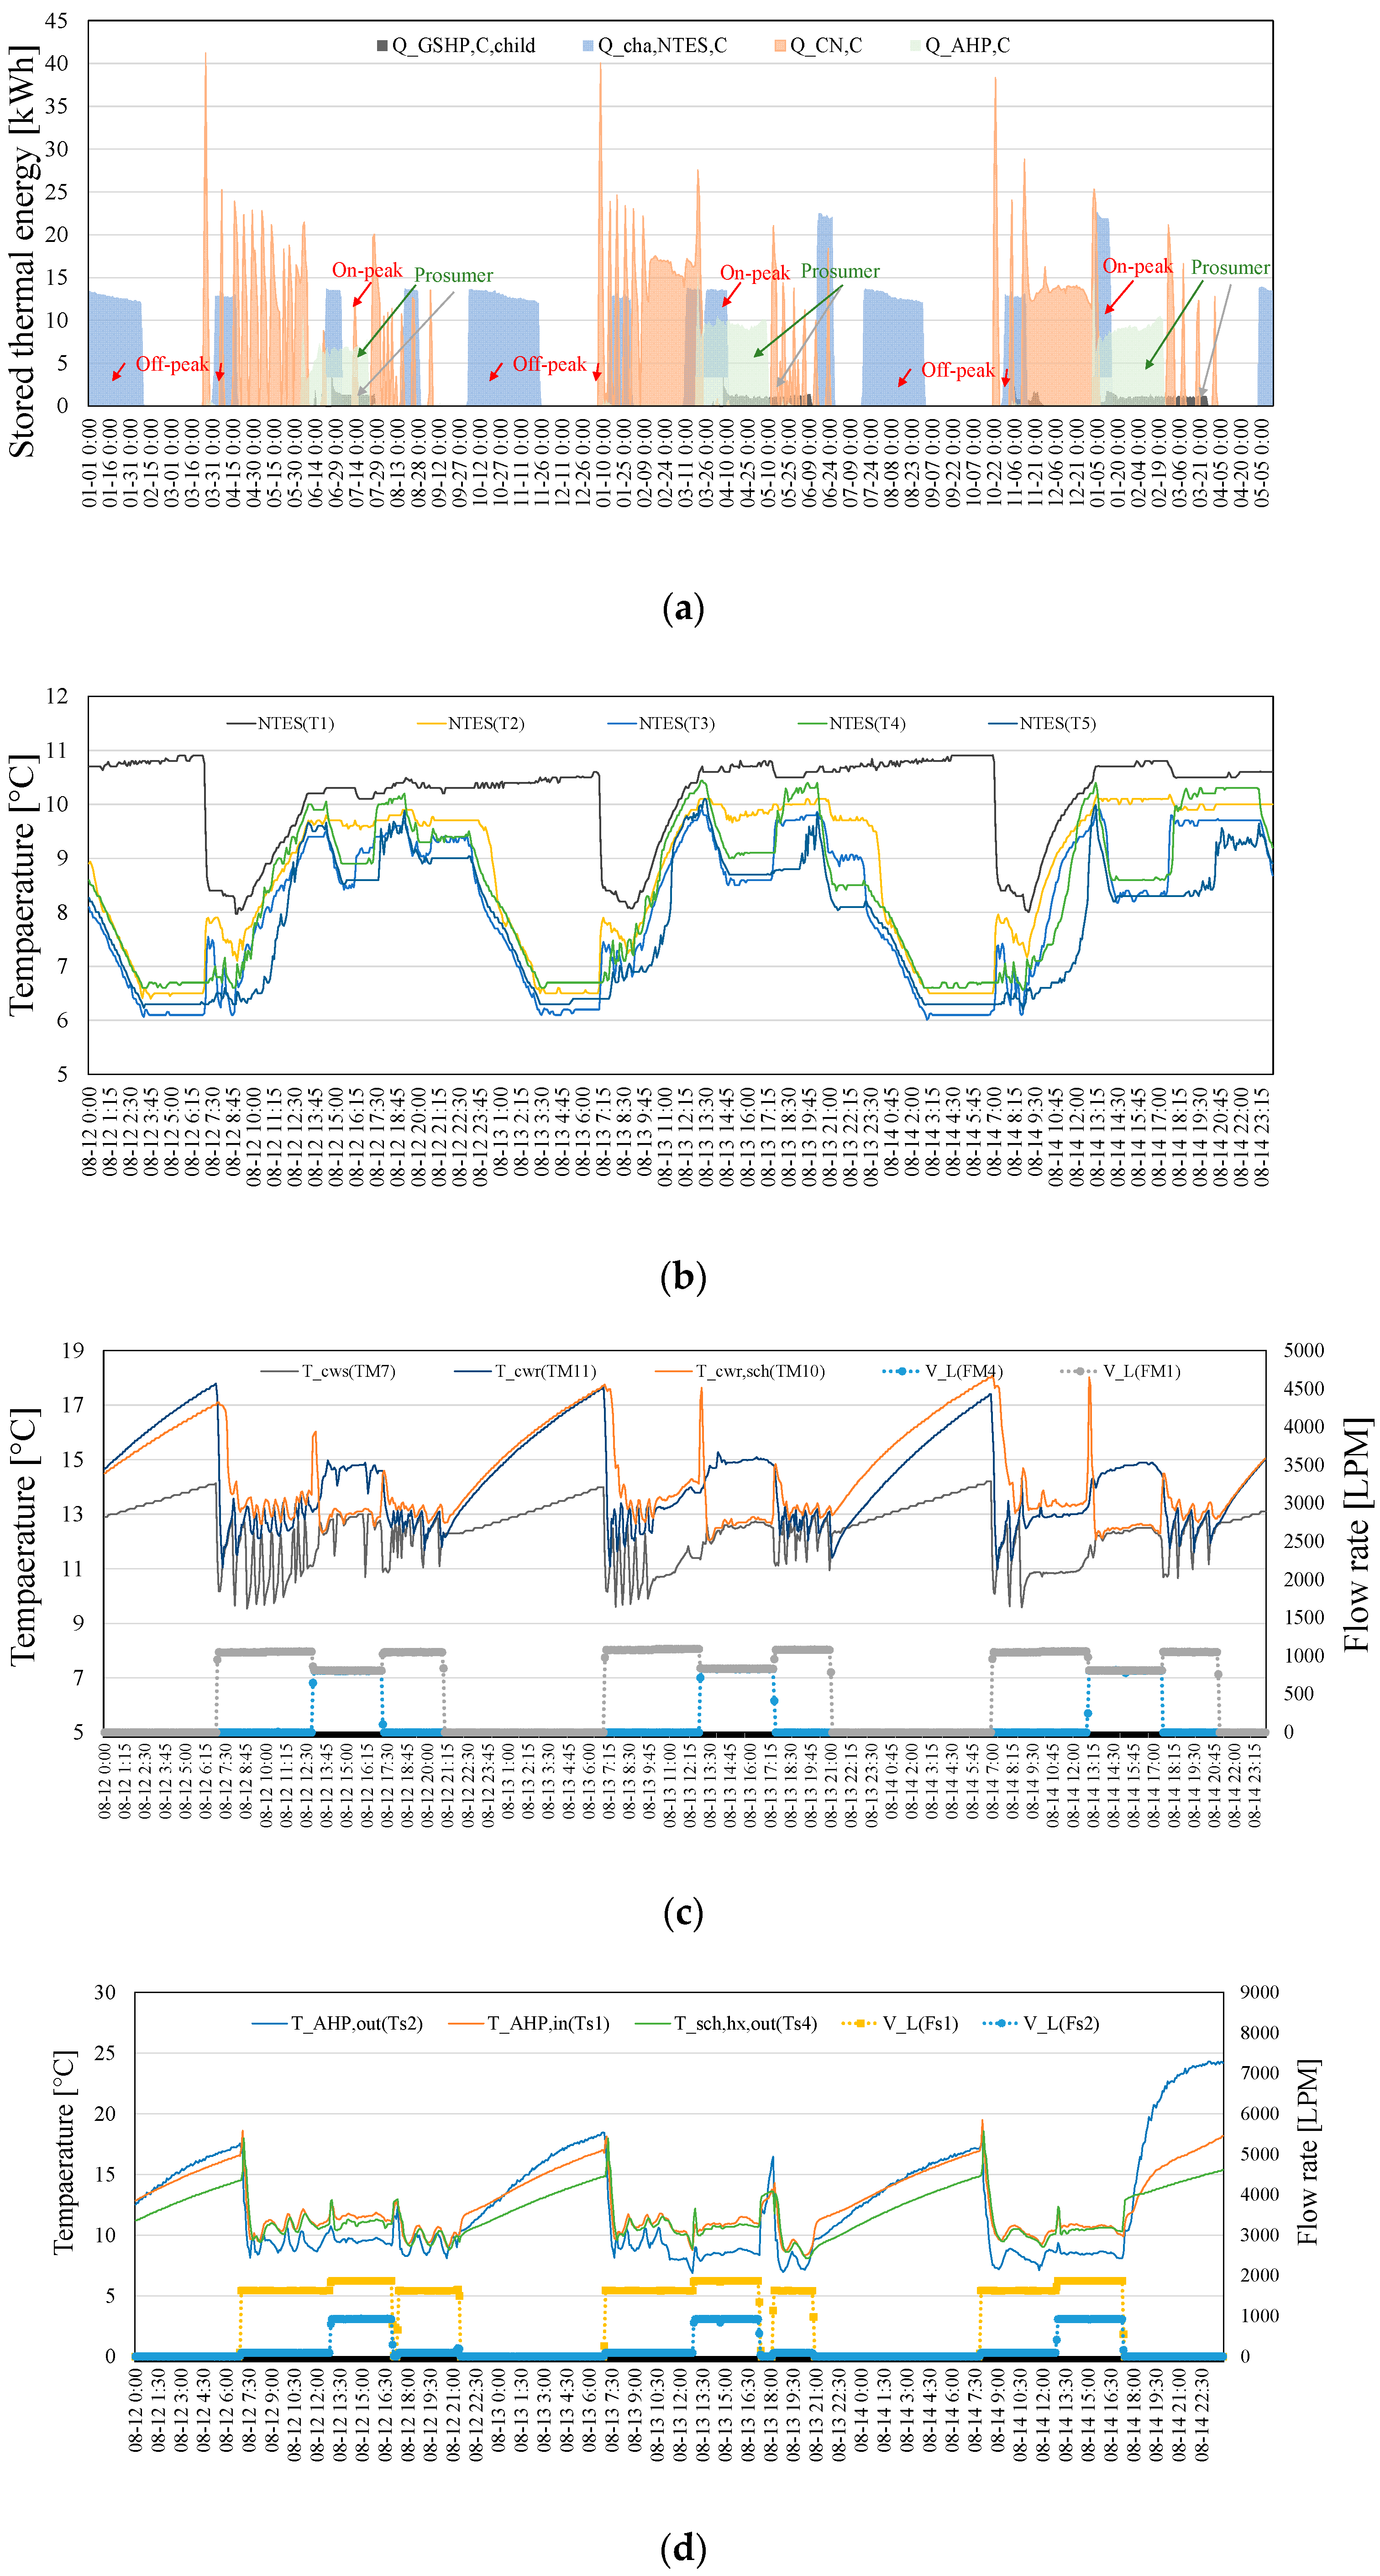
4.2.2. Bi-Didirectional Decentralized Thermal Network Operation

Figure 5 shows the operation profile for the representative period from August 12 to 14 during the decentralized thermal network operation period. During this period, heat was supplied by the centralized thermal network method and the heat prosumer method in combination. Figure 5a,b depicts the inner temperature of the NTES during decentralized thermal network operation. In Figure 5a, the blue area represents the heat charged into the NTES through heat pump operation ( Q ˙ c h a , N T E S , C ) and the orange area represents the heat discharged from the NTES ( Q ˙ C N , C ). In addition, the green area represents the bi-directional heat supply from the school to the thermal network according to the prosumer operation. In the conventional centralized thermal network operation, the temperature of the NTES increases to more than 9 °C (Figure 5b); thus, the central heat pump that uses electricity must be operated even during the peak period. However, the heat prosumer of the school, which is an AHP using gas, assists in reducing the power consumption during the peak period using the non-electric thermal energy production facility. Regarding heat prosumer operation, Figure 5c reveals that there is no flow to the school in the conventional thermal network (Figure 4c), although a pipe connected to the school was operated for heat prosumer operation (i.e., FM4). During heat prosumer operation, the temperatures corresponding to TM7 and TM10 are the same, confirming the possibility of receiving cooling energy from the heat pipe of the school and supplying it to the public building. An examination of the operation status of the heat pipe of the school during the same time period confirms that, as shown in Figure 5d, the flow rate (Fs2) of the school side of the heat exchanger connected to the thermal network is generated during heat prosumer operation. It is also evident that a bi-directional thermal network is able to work because the cooling water that passes through the AHP supplies cooling to the thermal network by exchanging heat through the heat exchanger, increasing the heat exchanger outlet temperature in the school ( T s c h , h x , o u t ( T s 4 ) ).

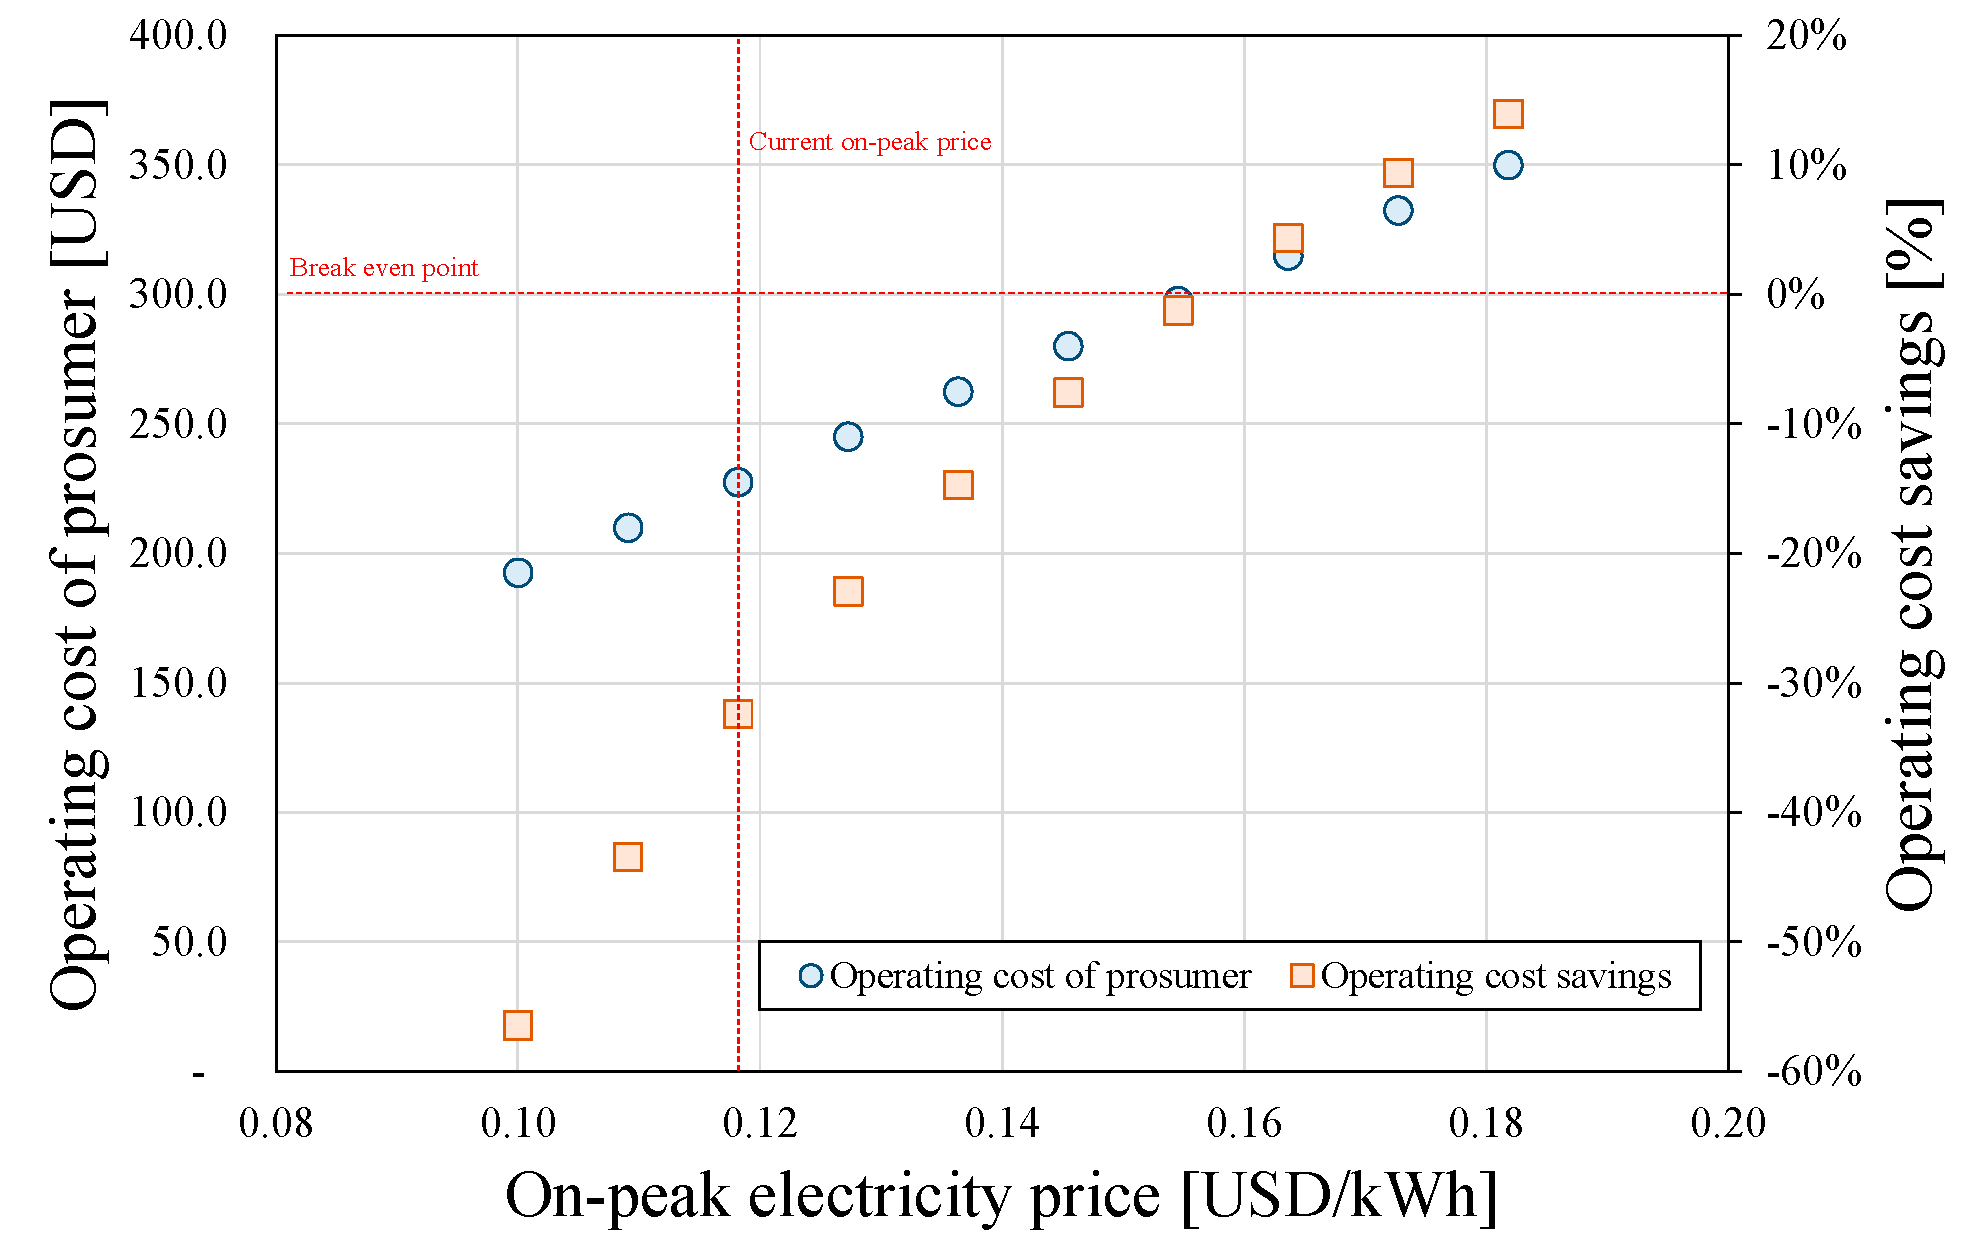
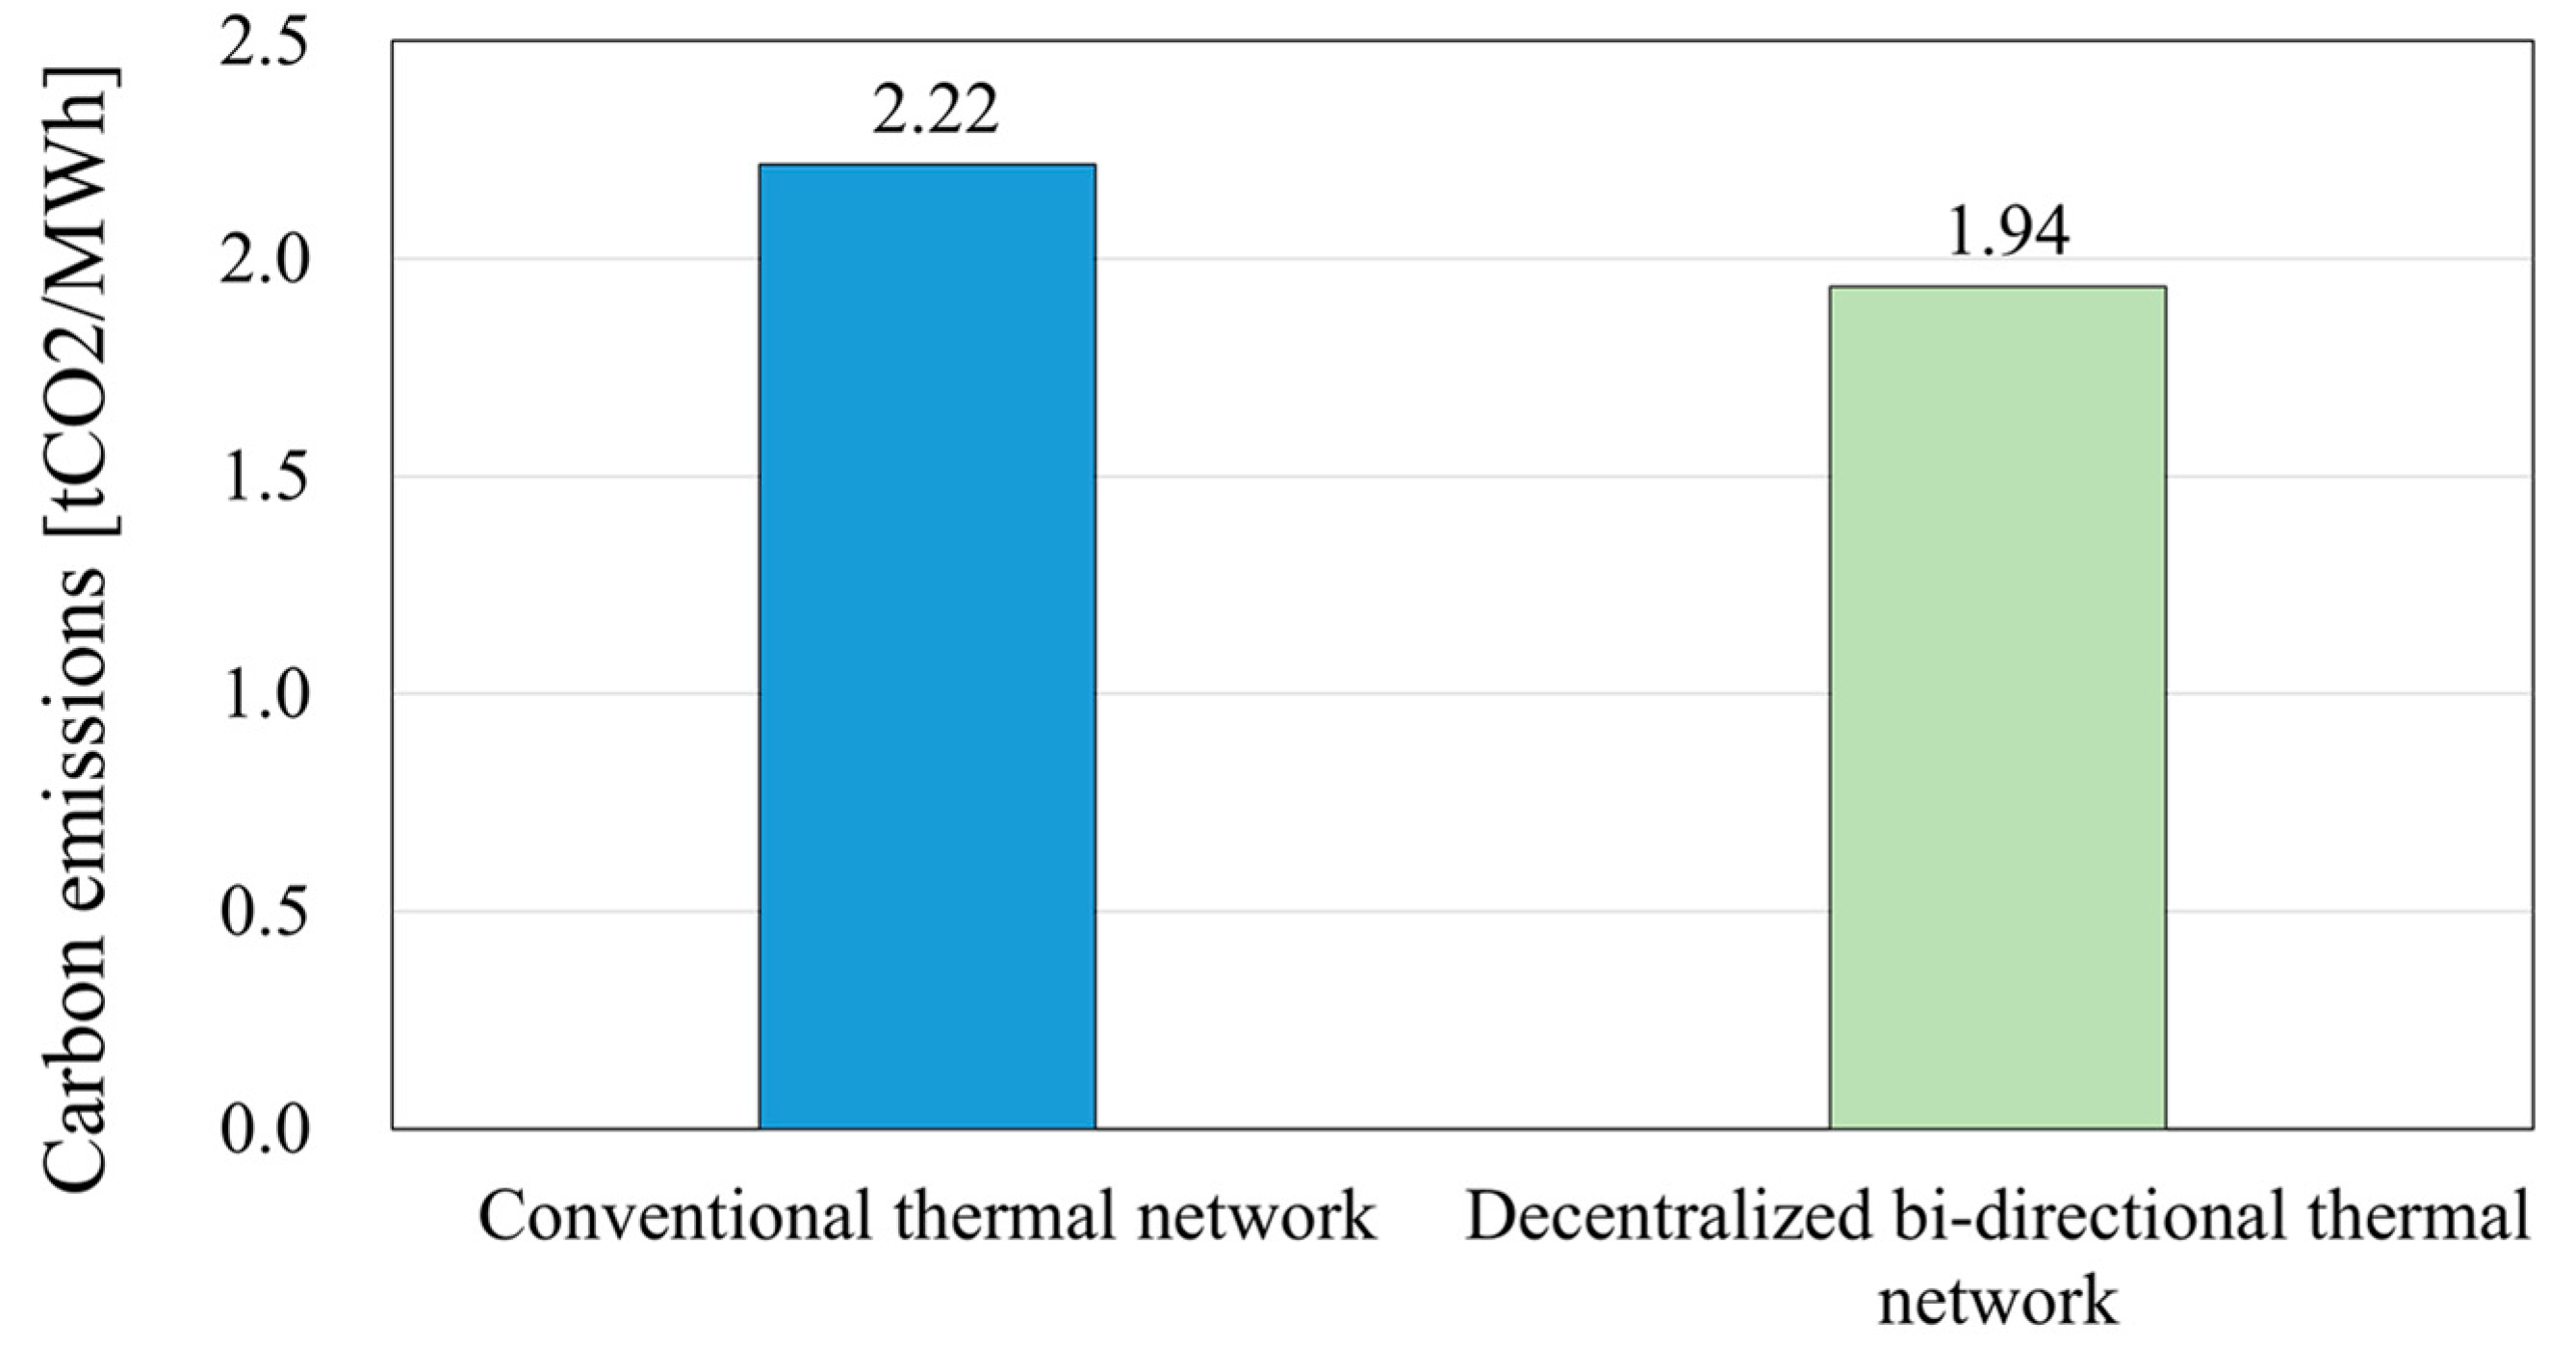
4.3. Operating Cost and Environmental Impact of the Bi-Directional Thermal Network

During the demonstration period, the AHP was operated from 3 August for the cooling energy supply and prosumer operation of the school. The total LPG gas consumption during operation is 1598 Nm3. The supply to the public building through the AHP in the bi-directional thermal network is 8301.8 kWh. The volume of LPG that is additionally consumed by the AHP for prosumer operation is 332 Nm3, or 20.8% of the total gas consumption. The current price of LPG gas is 2.76 USD/Nm3; thus, the cost of gas consumption for prosumer operation is 914.1 USD. In contrast, assuming that the heat supplied by the absorption heat pump is supplied through the daytime operation of the heat pump in the centralized mechanical room, an additional 2004.8 kWh of electricity is used during the day, and the power cost is 229.9 USD. It is assumed that the heat pump will show a COP of 4.16, as the mean COP of the ground-source heat pumps in the centralized mechanical room.
As mentioned above, LPG gas was temporarily used to operate the absorption heat pump in the school. The cost of LPG gas (i.e., 0.03 USD/MJ) is 3 times higher per megajoule than that of general city gas (i.e., 0.01 USD/MJ). Thus, it was calculated that if the absorption heat pump is operated by city gas, its operation cost will be 301.2 USD. Therefore, even if LPG gas is changed to city gas, the operation cost will be 1.31 times higher if the peak power rate is 0.12 USD/kWh. As shown in Figure 6, if the peak power rate increases, a greater reduction in the operation cost can be obtained than is possible by using the AHP. It is predicted that this reduction is achievable if the peak rate is greater than 0.16 USD/kWh.
The reduction rate of carbon emissions was analyzed using the demonstration operation. The results showed that the demonstration operation generated total carbon emissions of 5.75 tCO2 in the conventional centralized thermal network method, whereas the operation of the decentralized heat prosumers produced total carbon emissions of 7.15 tCO2. However, the total cooling load of the town was smaller during centralized thermal network operation in the demonstration experiment. Thus, the greenhouse gas generation related to the total cooling load (in megawatt-hours) of the town was calculated accordingly. Consequently, as shown in Figure 7, the conventional centralized thermal network method produces 2.22 tCO2/MWh of carbon emissions, whereas the decentralized heat prosumers yield 1.94 tCO2/MWh of carbon emissions. Hence, the carbon emission is reduced by 12.7%.

4.4. Discussion and Future Work

This study experimentally proves the possibility of decentralized prosumer heat trading during the cooling season in a centralized thermal network and demonstrates the achievable operation cost and carbon emission reductions. The thermal network used in this study is a small thermal network with seven buildings, which is smaller than a general thermal network. However, this research is meaningful because it provides experimental results in a thermal network reflecting the recent concept of low-temperature heating and high-temperature cooling, such as fourth-generation district cooling and heating. In future studies, thermal load prediction and operation optimization based on the prediction are required, and the present study serves as a basic demonstration for this future work. As analyzed in this research, an operation optimization strategy can be established based on the operating cost and environmental impact in terms of CO2 emissions. Furthermore, future studies will be conducted from the perspective of heat sharing and trading for electric and thermal convergence systems for zero-carbon emission communities.
Short-term thermal energy storage (TES) for a one-day load is important for reducing the operating cost when implementing a thermal network. However, the initial cost increases as the amount of TES increases. If the amount of TES is small, the operating cost inevitably increases because of the additional operation of heat pumps during the daytime. In this case, if a non-electric heat supply during the daytime can be achieved using idle equipment in a building connected to a thermal network, as in this study, it will be effective for reducing the initial investment cost and operating cost. Therefore, we plan to study design optimization considering this operation method and the initial investment cost.
Regarding carbon emissions reduction, South Korea has high CO2 emissions from power generation. It is estimated that this high emission level occurs because coal-fired power plants, which have low power production costs but high CO2 emissions, constitute the major source of power generation [30]. If natural-gas-fired power plants are used instead, CO2 emissions will be reduced, but the power generation cost will rise to 0.09 USD/kWh, resulting in a 28% higher power generation cost than that of coal-fired power plants, which is 0.07 USD/kWh. However, the use of natural-gas-fired power plants will continuously increase with international efforts to reduce carbon emissions, and the peak electric price is expected to increase gradually as a result. Consequently, the utilization of a non-electric thermal supply is expected to increase.

5. Conclusions

This study implemented heat prosumer buildings in a small thermal network and proposed a control method for a heat-trading system using heat prosumers. Heat prosumers were implemented on a real scale in a high school and childcare center. The operation results during the cooling season in terms of the heat trading of each building were also presented. The results indicated that the temperature of the thermal network ranged from 11 °C to 13 °C. It proved that similar to the centralized heat supply case, decentralized heat prosumer buildings can be used in a thermal network by supplying an appropriate level of cooling energy to the network. In this research, the operating cost was also calculated using the current gas and electricity demonstration operation. It was found that the current demonstration operation cannot achieve economic benefit. However, if the peak power cost becomes higher than 0.16 USD/kWh and general city gas (i.e., 0.01 USD/MJ) is used, the heat production and supply using AHP could operate cost effectively in the future. Further, the proposed bi-directional operation method is expected to achieve a carbon emission reduction of 12.7% compared to the conventional centralized thermal network method.

Author Contributions

Writing—original draft preparation, M.-H.K.; methodology and software, D.-W.K.; writing—review and editing, J.H.; supervision and project administration, D.-W.L. All authors have read and agreed to the published version of the manuscript.

Funding

This research was supported by the Energy Technology Development Program of the Korea Institute of Energy Technology Evaluation and Planning (No. 2018201060010A).

Institutional Review Board Statement

Not applicable.

Informed Consent Statement

Not applicable.

Data Availability Statement

Not applicable.

Conflicts of Interest

The authors declare no conflict of interest.

References

  1. Connolly, D.; Lund, H.; Mathiesen, B.V. Smart Energy Europe: The technical and economic impact of one potential 100% renewable energy scenario for the European Union. Renew. Sustain. Energy Rev. 2016, 60, 1634–1653. [Google Scholar] [CrossRef]
  2. Lund, H.; Werner, S.; Wiltshire, R.; Svendsen, S.; Thorsen, J.E.; Hvelplund, F.; Mathiesen, B.V. 4th Generation District Heating (4GDH). Energy 2014, 68, 1–11. [Google Scholar] [CrossRef]
  3. Mathiesen, B.V.; Lund, H.; Connolly, D.; Wenzel, H.; Ostergaard, P.A.; Möller, B.; Nielsen, S.; Ridjan, I.; KarnOe, P.; Sperling, K.; et al. Smart ennergy systems for coherent 100% renewable energy and transport solutions. Appl. Energy 2015, 145, 139–154. [Google Scholar] [CrossRef]
  4. Suh, H.S.; Kim, D.D. Energy performance assessment towards nearly zero energy community buildings in South Korea. Sustain. Cities Soc. 2019, 44, 488–498. [Google Scholar] [CrossRef]
  5. Radl, J.; Fleischhacker, A.; Revheim, F.H.; Lettner, G.; Auer, H. Comparison of Profitability of PV Electricity Sharing in Renewable Energy Communities in Selected European Countries. Energies 2020, 13, 5007. [Google Scholar] [CrossRef]
  6. Lopes, R.A.; Martins, J.; Aelenei, D.; Lima, C.P. A cooperative net zero energy community to improve load matching. Renew. Energy 2016, 93, 1–13. [Google Scholar] [CrossRef]
  7. Bloess, A.; Schill, W.-P.; Zerrahn, A. Power-to-heat for renewable energy integration: A review of technologies, modeling approaches, and flexibility potentials. Appl. Energy 2018, 212, 1611–1626. [Google Scholar] [CrossRef]
  8. Revesz, A.; Jones, P.; Dunham, C.; Davies, G.; Marques, C.; Matabuena, R.; Scott, J.; Maidment, G. Developing novel 5th generation district energy networks. Energy 2020, 201, 117389. [Google Scholar] [CrossRef]
  9. Buffa, S.; Cozzini, M.; D’Antoni, M.; Baratieri, M.; Fedrizzi, R. 5th generation district heating and cooling systems: A review of existing cases in Europe. Renew. Sustain. Energy Rev. 2019, 104, 504–522. [Google Scholar] [CrossRef]
  10. Brange, L.; Englund, J.; Lauenburg, P. Prosumers in district heating networks–A Swedish case study. Appl. Energy 2016, 164, 492–500. [Google Scholar] [CrossRef]
  11. Ancona, M.; Branchini, L.; De Pascale, A.; Melino, F. Smart District Heating: Distributed Generation Systems’ Effects on the Network. Energy Procedia 2015, 75, 1208–1213. [Google Scholar] [CrossRef] [Green Version]
  12. Sanchez, V.F.; Uriarte, A.; Barreiro, E.; Porta, M. Smart dual thermal network. Int. J. Energy Prod. Manag. 2017, 2, 315–326. [Google Scholar] [CrossRef] [Green Version]
  13. Brand, L.; Calvén, A.; Englund, J.; Landersjö, H.; Lauenburg, P. Smart district heating networks–A simulation study of prosumers’ impact on technical parameters in distribution networks. Appl. Energy 2014, 129, 39–48. [Google Scholar] [CrossRef]
  14. Li, Y.; Fu, L.; Zhang, S.; Zhao, X. A new type of district heating system based on distributed absorption heat pumps. Energy 2011, 36, 4570–4576. [Google Scholar] [CrossRef]
  15. Pipiciello, M.; Caldera, M.; Cozzini, M.; Ancona, M.A.; Melino, F.; Di Pietra, B. Experimental characterization of a prototype of bidirectional substation for district heating with thermal prosumers. Energy 2021, 223, 120036. [Google Scholar] [CrossRef]
  16. Wirtz, M.; Kivilip, L.; Remmen, P.; Müller, D. Quantifying Demand Balancing in Bidirectional Low Temperature Networks. Energy Build. 2020, 224, 110245. [Google Scholar] [CrossRef]
  17. Lorenzen, P.; Janßen, P.; Winkel, M.; Klose, D.; Kernstock, P.; Schrage, J.; Schubert, F. Design of a Smart Thermal Grid in the Wilhelmsburg district of Hamburg: Challenges and approaches. Energy Procedia 2018, 149, 499–508. [Google Scholar] [CrossRef]
  18. Rosemann, T.; Löser, J.; Rühling, K. A New DH Control Algorithm for a Combined Supply and Feed-In Substation and Testing Through Hardware-In-The-Loop. Energy Procedia 2017, 116, 416–425. [Google Scholar] [CrossRef]
  19. Heymann, M.; Rosemann, T.; Rühling, K.; Tietze, T.; Hafner, B. Concept and Measurement Results of Two Decentralized Solar Thermal Feed-in Substations. Energy Procedia 2018, 149, 363–372. [Google Scholar] [CrossRef]
  20. Kauko, H.; Kvalsvik, K.H.; Rohde, D.; Nord, N.; Utne, Å. Dynamic modeling of local district heating grids with prosumers: A case study for Norway. Energy 2018, 151, 261–271. [Google Scholar] [CrossRef]
  21. Postnikov, I.; Stennikov, V.; Penkovskii, A. Prosumer in the District Heating Systems: Operating and Reliability Modeling. Energy Procedia 2019, 158, 2530–2535. [Google Scholar] [CrossRef]
  22. Kim, M.-H.; Lee, D.-W.; Kim, D.-W.; An, Y.-S.; Yun, J.-H. Energy Performance Investigation of Bi-Directional Convergence Energy Prosumers for an Energy Sharing Community. Energies 2021, 14, 5544. [Google Scholar] [CrossRef]
  23. Huang, P.; Copertaro, B.; Zhang, X.; Shen, J.; Löfgren, I.; Rönnelid, M.; Fahlen, J.; Andersson, D.; Svanfeldt, M. A review of data centers as prosumers in district energy systems: Renewable energy integration and waste heat reuse for district heating. Appl. Energy 2020, 258, 114109. [Google Scholar] [CrossRef]
  24. Wang, X.; Li, H.; Wang, Y.; Zhao, J.; Zhu, J.; Zhong, S.; Li, Y. Energy, exergy, and economic analysis of a data center energy system driven by the CO2 ground source heat pump: Prosumer perspective. Energy Convers. Manag. 2021, 232, 113877. [Google Scholar] [CrossRef]
  25. Liu, Z.; Yu, H.; Liu, R.; Wang, M.; Li, C. Configuration Optimization Model for Data-Center-Park-Integrated Energy Systems under Economic, Reliability, and Environmental Considerations. Energies 2020, 13, 448. [Google Scholar] [CrossRef] [Green Version]
  26. Nielsen, S.; Hansen, K.; Lund, R.; Moreno, D. Unconventional Excess Heat Sources for District Heating in a National Energy System Context. Energies 2020, 13, 5068. [Google Scholar] [CrossRef]
  27. Amiri, L.; Madadian, E.; Bahrani, N.; Ghoreishi-Madiseh, S. Techno-Economic Analysis of Waste Heat Utilization in Data Centers: Application of Absorption Chiller Systems. Energies 2021, 14, 2433. [Google Scholar] [CrossRef]
  28. Kim, M.-H.; Lee, D.-W.; Kim, D.-W.; Heo, J. Feasibility Study of Bi-Directional Heat Supply in a Small Thermal Network. Korean J. Air-Cond. Refrig. Eng. 2021, 33, 31–41. [Google Scholar] [CrossRef]
  29. Kim, M.-H.; Kim, D.; Heo, J.; Lee, D.-W. Energy performance investigation of net plus energy town: Energy balance of the Jincheon Eco-Friendly energy town. Renew. Energy 2020, 147, 1784–1800. [Google Scholar] [CrossRef]
  30. Lim, S.-Y.; Kim, H.-J.; Yoo, S.-H. South Korean Household’s Willingness to Pay for Replacing Coal with Natural Gas? A View from CO2 Emissions Reduction. Energies 2017, 10, 2031. [Google Scholar] [CrossRef] [Green Version]
Figure 1. Overview of the eco-friendly energy town of Jincheon: (a) Overview of town; (b) buildings in town [29]; (c) hybrid renewable energy system in town [29].
Energies 14 05881 g001aEnergies 14 05881 g001b
Figure 2. Overview of the mechanical system in the eco-friendly energy town of Jincheon: (a) Systems and building locations; (b) conventional centralized thermal network; (c) decentralized bi-directional thermal network in the network pipeline after retrofitting; (d) pipeline of the high school as a prosumer; (e) pipeline of the childcare center as a prosumer.
Energies 14 05881 g002aEnergies 14 05881 g002bEnergies 14 05881 g002c
Figure 3. Thermal load and outdoor air temperature during the test period.
Energies 14 05881 g003
Figure 4. Thermal performance of the centralized thermal network: (a) NTES charging/discharging energy and thermal energy supply; (b) NTES inner temperature; (c) Thermal network operation profile; (d) Cooling supply in the school.
Energies 14 05881 g004aEnergies 14 05881 g004b
Figure 5. Thermal performance of bi-directional decentralized thermal network: (a) NTES charging/discharging energy and thermal energy supply; (b) NTES inner temperature; (c) thermal network operation profile; (d) cooling supply in the school.
Energies 14 05881 g005
Figure 6. Operating energy savings depending on the peak electricity price.
Energies 14 05881 g006
Figure 7. Comparison of CO2 emission rates.
Energies 14 05881 g007
Table 1. Operation modes of the high school as a prosumer.
Operation ModeReturn ValveClosed ValveConventional ValveValve for Prosumer
VH1VMZVH2GV1GV2GV3GV4VZ1VZ2
Heating mode
(consumer)
CloseCloseOpenOpenCloseOpenOpenCloseOpen
Cooling mode
(consumer)
CloseCloseCloseCloseOpenOpenCloseCloseOpen
Prosumer modeOpenOpenCloseCloseOpenOpenCloseOpenOpen
Table 2. Operation modes of the childcare center as a prosumer.
Operation ModeNetwork
Separate Valve
Closed ValveConventional ValveValve for Prosumer
VC1VC2VysVy1Vy2Vy3Vy4Vy5VC3VC4
Cooling and heating mode
(consumer)
OpenOpenCloseOpenCloseCloseCloseOpenCloseClose
Prosumer modeCloseCloseOpenCloseOpenOpenOpenOpenOpenOpen
Table 3. Specifications of the measurement sensors.
CategoryModelSpecifications
TemperatureRTD PT100 transmitter−10–100 °C
Accuracy ±0.106 °C
Resolution 0.001 °C
PressureSensys PSCH0006K0–6 bar
Accuracy ±0.25% FS
Solar radiationKippen & ZonenCMP11
Accuracy 0.2% (1000 W/m2)
Water flowToshiba LF620Accuracy
vs. > 0.5 m/s ±0.3% of rate
vs. < 0.5 m/s ±0.4% of rate
Gas flowRMG 132 (rotary meter)Accuracy ±1.0% @ (0.6–65) m3/h
SF 2200 (gas volume corrector)Accuracy
Pressure 0.25%
Temperature 0.5 °C
Outdoor air temperatureGOTH-1420/PT1000(–36–80) °C
±(0.2–0.4) °C @ 25 °C
Table 4. Electricity prices.
SeasonPrice (USD/kWh)
Heating season (i.e., October–February)
Off-peak0.06
Mid-peak 0.09
On-peak0.10
Intermediate season (i.e., March–May, September–November) and cooling season (i.e., June–August)
Off-peak0.05
Mid-peak 0.10
On-peak0.12
Publisher’s Note: MDPI stays neutral with regard to jurisdictional claims in published maps and institutional affiliations.

