1. Introduction
The issue of railway transport safety is a broad issue and the studies conducted in this area are carried out with the use of railway vehicles and real operating conditions, as well as with the use of mathematical models and computer simulation methods [
1,
2,
3,
4]. An example of the use of new methods in research on the safety of rail vehicles is the work [
5] showing the use of neural networks in the process of driving safety assessment. The wheel derail coefficient, wheel rate of load reduction, and wheel lateral pressure are considered the decision variables for the safety framework, but this set of parameters lacks a description of the rail’s inclination. The work [
5], however, does not address the subject of a comprehensive approach to the relationship between track geometry and railway transport safety.
Tests aimed at determining the state of the system or its components, carried out with the use of models or test stands, are classified as off-line tests. The justification for adopting such a research method, especially in the case of rail vehicles, results mainly from economic reasons (research costs) and the possibility of accessing an increasing number of research tools (specialist equipment or computer packages) dedicated to solutions to specific problems [
6,
7,
8,
9]. An example of works dealing with the influence of track irregularities on vehicle behavior and vehicle response to track input for straight track and turnouts are the works [
10,
11]. The authors of these works emphasize the importance of this problem, however, emphasizing the need for research in which it is possible to study the influence of the rail geometry on the behavior of the vehicle, taking into account not only such basic parameters as geometric irregularities i.e., longitudinal level and alignment or track gauge, but also other parameters characterizing the track, such as, e.g., rail inclination.
In the case of railway vehicles, safety is determined by: the technical condition of the vehicle, the condition of track railway surface and track, and the conditions of cooperation between the railway vehicle and the track. In the case of a railway track, the process of assessing the technical condition is reduced to measuring geometric irregularities of the track, assessing the condition of the subgrade and measuring rail profiles, taking into account the wear of the transverse profile and the longitudinal wear of the rails, in particular the wear of the corrugation type [
12,
13]. Recently, there has been a development of track condition monitoring methods using computer simulation methods, specialized service vehicles or dedicated systems built by research institutes or research teams of universities. An example may be the solutions described in the works and the results obtained [
14,
15,
16]. However, it should be said that these works concern monitoring methodology and are focused on monitoring parameters such as track modulus, track voids or twist, top or alignment based on the use of existing systems based on the on-board GSM-R cab radio. Such solutions, important from the point of view of train running safety, cannot be used for detailed analyses of the impact of parameters such as rail inclination on derailment. However, during the current operation, measurements and evaluation of the transverse inclination of rails in the track are not performed—a parameter that affects the transverse interaction of the vehicle with the track, the wear of rails and wheels profiles and, as a result, the safety of driving [
17]. As demonstrated by simulation studies and analyses, the changes in the parameters characterizing the railway track during operation, combined with the deterioration of the wheel profile as a result of wear, have a significant impact on the behavior of the vehicle on the track and may ultimately lead to vehicle derailment [
18]. As it is difficult to investigate the impact of changes in the transverse inclination of rails on the vehicle running safety with on-line methods, as demonstrated by the analyses of the conducted research, described above, an attempt was made to evaluate this phenomenon with the use of mathematical models and simulation methods.
Numerical models of railway track and railway vehicles are fundamental tools for the study of their mechanics properties, taking into account safety and comfort of rail transport. The structure of the models and their mathematical notation depend on the research tasks adopted for implementation. One can find examples of published works dealing with specific railway problems in [
19,
20,
21]. The thematic areas in which the analyses are performed are:
modelling the vehicle–track dynamic interaction for a vehicle on a straight track, but also in the case when the vehicle is passing over a bridge or crossing a transition zone;
assessing and diagnosing the deterioration of track components, including switches and crossings;
rail wear/corrugation and hanging sleepers;
studying other problems related to wheel–rail interaction, including the effect of noise of rolling flat wheels.
Among the works carried out in these areas, a small number of works on the issues of the impact of track irregularity on road safety, and in particular the relationship of the parameter determining the inclination of the rails on the derailment problem, can be noted.
As it results from the analysis of the literature, in the 1970s research was conducted on the influence of rail inclination on the behavior of the vehicle on the track and, above all, on driving safety. These tests were related to the introduction of S1002 railway wheels and UIC60 rails into operation. Since then, the research work was carried out on such issues as: the development of modeling methods and the creation of new tools for experimental and simulation tests, analysis of the relationship between track irregularities and vehicle dynamic responses, without considering the issue of rail inclination, the issues of current monitoring of the track and vehicle condition with a view to driving safety or the issues of wear of wheel and rail profiles.
The development of high-speed railways and new solutions in the field of construction of rail vehicles, not only for the needs of railways, but also for tram transport in urban public transport, resulted in the launch of works on the introduction of new railway wheel profiles and new solutions in the field of railway infrastructure. These activities mean that there is a need to fill the existing research gap in the field of the impact of rail inclination on traffic safety in rail transport, taking into account new perspectives regarding technological solutions in this area. The presented article should fill this gap.
2. Models and Parameters
The general structure of the simulation model for off-line diagnostic tests should, due to the structure of the real object being diagnosed, consists of [
6,
22,
23,
24]:
The track model was adopted in this study as for low-frequency vibrations [
14,
25,
26]. The track is described as a perfectly rigid system, the kinematics of which is written by geometry, taking into account the speed of the vehicle moving on the track. Typical diagnostic tests of railway track geometry (e.g., with geodetic methods) are limited to the examination of geometrical irregularities of the left and right rails, or a combination of them, while the track geometry (
Figure 1) includes an important element—rail inclination (
Cl).
The contact model, describing the interaction between the vehicle and the track, addresses two basic issues, namely the calculation of the geometrical contact parameters and the contact forces between the wheel and rail. The basis for determining the geometric parameters of contact is the location of the contact points on the wheel and rail, in the coordinate system related to the wheel or rail and the resulting derived quantities, such as:
instantaneous rolling radii of the wheels of the wheelset;
contact angles (angles of inclination of the tangents at the wheel-rail contact point to the track plan);
main radii of curvature of the running surfaces of wheels and rails at the points of contact;
the roll angles (rotations around the Ox axis).
For low-frequency vibrations, the nominal model of a rail vehicle is a mechanical system consisting of rigid bodies such as a vehicle body, two bogie frames and four wheel sets, connected by massless elastic-damping elements. The mathematical model by which the results will be analyzed in this article contains inertial and geometric parameters corresponding to the passenger car. The mathematical model has 27 degrees of freedom defined as follows [
6,
23]:
sets have 3 degrees of freedom (lateral displacement y, yaw angle ψ and pitch angle χ);
bogie frames have 5 degrees of freedom (lateral displacement y and vertical z and rotation angles ψ, χ and φ);
the wagon body has 5 degrees of freedom (lateral displacement y and vertical z and rotation angles ψ, χ and φ).
The movement constraints of each wheelset result from its interaction with a rigid track. As a result, the vertical displacement z and the angle of rotation about the longitudinal track axis θ are dependent on the lateral displacement of the set y and on its yaw angle ψ; the coordinate describing the position of the center of the wheel set along the track axis x depends on the angle of rotation about the symmetry axis of this wheel set χ. The form of constraints is non-linear and depends on the geometrical parameters of the wheelset and the track, e.g., on track gauge, lateral inclination of rails, wheel and rail profiles and wheel center gauge of the wheel set.
Thus, we can see that in the model for off-line diagnostic tests, there is a generally undiagnosed track geometry parameter—rail inclination and rarely diagnosed geometric parameters of wheel and rail running surfaces [
25,
26]. The inclination of rails is usually assumed to be constant, and it is assumed that it does not change during the operation process. We would like to partially dedicate the considerations contained in this article to the discussion of the effects of its possible changes. The impact of changing the rail inclination on the location of the contact points and the resulting changes in contact parameters will also be investigated, as well as how the change in rail inclination affects the results of simulation tests. We will also show the impact of changes in the profiles of the running surfaces of the rail, related to the operation process, on the dynamic response of the model.
In general, in this article, we wanted to pay attention to some problems related to the inconsistency of typical diagnostic tests performed on-site (on-line methods) and off-line diagnostic tests carried out with the use of mathematical models of a rail vehicle, bearing in mind the running safety of a rail vehicle.
Parameters Describing the Condition of the Railway Track and Safety Running of a Railway Vehicle
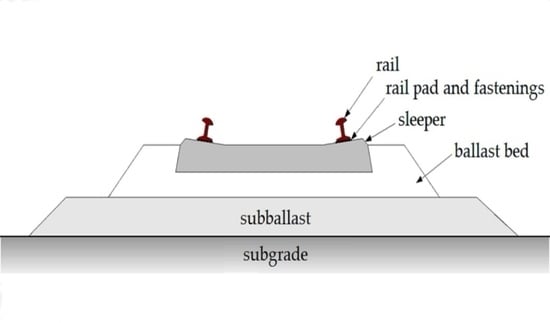
The railway track is part of the rail track structure and constitutes the basic component of the railway infrastructure, which determines the quality of rail transport, both passenger and freight, and the safety of the transport [
27]. The basic, component elements of a track are: rails, rail pads, sleepers and a system for attaching rails to sleepers. The structure of the pavement and the track is generally a complex structure.
The structure of the track consists of two parallel rails, which are the basic load-bearing system of the railway track, the geometric arrangement of which is adapted to the safe movement of rail vehicles at speeds and pressures with specific technical and operational parameters. The features that define the track geometry are the track geometry in the horizontal and vertical planes, track gauge, cant, rail inclination and track geometric irregularities.
The parameters that define the geometric layout of the track in the horizontal and vertical planes are the radius of the horizontal curve, twist, length of the transition curves and longitudinal track inclination. These parameters play an important role in the case of varied terrain, they determine the maximum speed of travel on individual sections of the railway route and the selection of traction parameters for motor vehicles. The track gauge is the distance between the inner surfaces of the rails measured 14 mm below their running surface. Currently, 54.8% of the world’s railway lines in use are 1435 mm (4 ft 8 + ½ in) wide, known as standard gauge. Superelevation is the difference in height of rails in a curve or on straight track sections. The purpose of the cant is to equalize or reduce the differences in wheel pressure on the rails and reduce the acceleration acting on passengers during the movement of the rail vehicle in a curve [
28,
29].
The transverse inclination of the rails is shown in
Figure 2 for the case of a track with cant, and is denoted
CI. It is the deviation of the rail base in the vertical plane by a certain value creating a ratio of 1:20 or 1:40 with the rail base. During the track operation period, this slope should not be less than 1:60 and higher than 1:12, but in the track condition monitoring process, the value of this parameter is not diagnosed. The next quantities characterizing the track are the geometric irregularities of the track, which are the generator of kinematic and parametric excitations for vehicle vibrations, characterizing the track geometry in the vertical plane of the track [
30,
31].
The description of the track irregularity can be made in several ways, e.g.,
vertical irregularities of the left (zl) and (zr) right rail;
transverse irregularities of the left (yl) and (yr) right rail;
local cant (θt);
inclination of the right (Cr) and left (Cl) rails or their equivalent sizes;
vertical irregularities of track center line (zt);
lateral irregularities of the track center line (yt);
track gauge (st).
The relationships between the above-mentioned values are as follows:
where:
snom—nominal track gauge.
In the case of a perfect track and the absence of geometric irregularities, a wheelset running on a straight track simultaneously moves in the transverse direction, making an oscillating motion around the center line of the track. This is the effect of the conical profile of the wheel and the characteristic structure of the wheelset—connecting two wheels with a rigid axle. In the theory of wheelset movement, this movement was first described analytically by Klingel in 1883, and in the following years it was and is still the subject of numerous studies and analyses [
32,
33]. The appearance of geometric irregularities in the track causes the wheelset movement to cease to be an oscillating movement described by a regular sinusoid, but it is still a movement in which the lateral displacements of the center of mass of the wheelset oscillate around the center line of the track and the wheels of the wheelset contact their flange with the inner part of the rail. At the contact point on the wheel flange, the wheel exerts pressure on the rail head, the source of which are two forces, the vertical force
Q and the transverse force
Y, while the rail acts on the wheel with a reaction force—normal
N and a friction force
μN. In extreme conditions, caused, e.g., by bad track conditions, worn wheel and rail profiles, bad condition of the running gear of a rail vehicle or excessive vehicle load, large lateral displacements of the wheelset may occur and, consequently, the wheel may climb on the rail. This could lead to the wheelset going off the track and vehicle derailment. This situation is shown in
Figure 3.
Assuming a state of equilibrium in the wheel-rail system presented in
Figure 3, the quotient of forces
Y and
Q, referred to in the literature as the derailment coefficient or the safety factor against derailment (derailment ratio), can be expressed as [
18,
34,
35]:
where:
The safety criterion against derailment (2) was introduced by Nadal in 1908 and is still used in railways to calculate the
Y/Q ratio when assessing the safety of rail vehicles. As it results from the form of criterion (2), the value of the coefficient depends directly on the wheel flange angle
γ and the friction coefficient
μ. These dependencies are presented in
Figure 4, marking the
Y/Q value equal to 0.8, determined in accordance with the UIC 518 regulation [
9], for the flange angle
γ = 75° and the friction coefficient
μ = 0.5.
On the other hand, assuming the UIC60 rail profile and the S1002 wheel profile and assuming the friction coefficient
μ = 0.36, which occurs most often in operating conditions [
12], we obtain the relationship:
In addition to the friction coefficient and the wheel flange angle, the following factors have an indirect impact on the value of the derailment coefficient: track arrangement, technical condition of the track and the vehicle, the dynamics of the vehicle-track system and the geometry of the wheel and rail profiles resulting from, e.g., their wear. Among these parameters is also the inclination of the rails, which is not monitored in the track diagnostics process, and which affects the value of the flange angle.
Figure 5a,b shows the behavior of the wheel flange angle for the case when the rail inclination value is on the order of 1:20, and for the case when the rail inclination is 1:∞. The lack of rail inclination or a change in this inclination may cause the contact point to move from the running surface to the rail flange, which leads to an increase in the flange angle and thus to an increase in the
Y/Q value (
Figure 4). This increases the likelihood of vehicle derailment.
As there are no considerations on this subject in the literature, it will be analyzed in the further part of the work, carried out with the use of computer simulation methods.
3. Simulation and Results
A mechanical system with parameters corresponding to a first-class passenger wagon with MD522 bogies [
23]—moving at a constant speed on a rigid track with variable geometry—was adopted as the model tested in the simulation study.
The basic assumptions about the vehicle model are described in Chapter 2 of the paper.
The wheel profiles were adopted in accordance with the carried out measurements of the nominal or worn wheel with S1002 outline, and rail profiles according to UIC60 rail profiles. The movement of the vehicle was modeled in a non-inertial frame of reference related to the track centerline.
The mathematical model of the system can be presented in a general form as follows [
7,
23]:
where:
M,
C and
K represent the square inertia, damping, gyroscopic and stiffness matrices, respectively.
The column vector
q contains independent coordinates describing the motion of the rigid bodies of the system. The columnar matrix
p represents forces. It can be interpreted as the sum of two matrices:
where
f(
t) is a vector containing inputs from track irregularities and external actions, e.g., wind, and
is a vector of nonlinear forces containing contact forces between the wheel and the rail.
We will discuss the influence of the system geometry on the vehicle dynamics for the MD522 wheel set model described by the equations presented below.
Assuming that the wheelset does not lose contact with the track and we are dealing with a one-point contact, the reaction equations derived from the track can be written as follows [
8,
21,
24]:
where:
, , θt—vertical acceleration, roll angle acceleration and local cant (values resulting from inter alia, the constraints within the system) and the local track cant;
m, Jx—wheelset mass, as well as the moment of inertia with respect to the longitudinal axis;
QL, QR, YL, YR—vertical and lateral forces exerting on the wheelset;
lL, lR, rL, rR—the moment arms of the forces exerting on the right and left side of the rail and the rolling radiuses of the wheels;
G—track static load by the wheelset;
Fwith, Mx—vertical force and the moment of force acting on the wheelset and resulting from the movement of the bogie frame and of the railcar body.
The normal forces are set in accordance with [
24]:
where:
δL, δR—contact angles for the left and right wheel;
T2L, T2R—lateral tangential forces.
As visible in Equations (6) and (7), the geometric contact parameters are values which to a great degree determine the forces acting on the wheelset. The curvature radius values in the contact point of the wheel and the rail influence the normal forces—calculated in accordance with Hertz’s two elastic bodies contact theory; by them, the tangential forces and the contact angle and the wheel rolling radius are important factors influencing the lateral and vertical forces acting on the wheel.
3.1. Effect of the Change in Rail Inclination on the Coordinates of the Contact Points in the Wheel-Rail System and Geometrical Contact Parameters
The basis for the calculation of the contact parameters are the positions of the contact points on the wheel and rail rolling surface which touch one another. We analyze these positions depending on the rail inclination, assuming a track nominal width of 1435 mm.
Figure 6 and
Figure 7 present the positions of contact points for a nominal profile of a S1002 type wheel and a UIC60 type rail for a rail inclination of 1:40. Here, the wheel makes a lateral displacement (
y) in a range from −8 mm to +8 mm from the wheelset central position against the track with a yaw angle (
ψ) equal to zero.
For lateral displacements of the wheelset (y) within a range from −8 mm to approximately −1 mm, there is a single-point contact. Next, we have the two-point contact area for (y) up to ~0.5 mm, in which one of the contact paths is a continuation of the previous positions. For lateral displacements from 0.5 to 4.2 mm, single-point contact occurs. In the three above-mentioned zones, the position of the contact point gradually shifts towards the inner part of the rail. For larger (y) in the range of the contact with the flange, we are dealing with a two-point contact. However, for y ≈ 5.6 and 6 mm, there is a contact point position jump, but after that, its position is almost unchanged depending on (y). When comparing the position of contact points on the wheel with the positions of contact points on the rail, we can see that the first three contact zones correspond to one another, this including the jumps of contact point positions which occur. Near contact with the flange and on the flange, the position of the contact point changes quite rapidly, whereas it remains virtually constant on the rail.
The positions of the contact points for rail inclination equal to 0 are shown in
Figure 8 and
Figure 9.
Similar as in the previous case, we are dealing here with quite clearly distinguished contact point zones. However, the differences in its positions are considerable, especially in the case of those zones corresponding to the situations when wheelset displacement is in the range from −8 to ~4.2 mm. The positions corresponding to the contact with the flange are similar in both cases.
We can observe a much bigger qualitative change for a rail inclination of 1:20, which is shown in
Figure 10 and
Figure 11.
In this case, for most of the possible relative positions of the wheelset and the rails, we have one-point contact. The fact of changing the position of contact points entails changes in the geometric parameters of the contact, which we will show in the example of changes in the rolling radius and contact angle, assuming the symmetry of wheel and rail profiles for both rails of the track and a track width equal to 1435 mm.
Figure 12 shows a comparison of the course of the tangent value of the contact angle between the wheel and rail for three previously analyzed rail inclinations They are presented as functions of lateral displacements of the wheelset within the range from 0 to 8 mm. The course of tangent values of the contact angle for 0 inclination grows the fastest. The values obtained for inclinations equal to 1:20 and 1:40 almost coincide for larger displacements of the wheelset. The course for 1:40 inclination is slightly bigger for smaller displacements.
The wheel rolling radius has analogous characteristic features as in the case of the tangent of the contact angle (
Figure 13).
3.2. The Influence of Rails Inclination on the Results of Simulation Tests
We now proceed to the analysis of the influence of rail inclinations on the system dynamics. We take into consideration the differences between the courses of lateral force values and wheelset displacements for the rail inclinations equal to 1:40 and 1:20.
The simulations were conducted for the following traffic conditions:
Examples of simulation results are presented in
Figure 14 and
Figure 15. When analyzing the obtained results, it can be stated that the lateral forces for 1:40 rail inclination have lower values. This is also accompanied by their smaller standard deviation, although the differences are not so significant here. A list of the basic statistical values of these forces is presented in
Table 1.
Of course, the standard deviation of the lateral displacement of the wheelset is related to the lateral forces. For a 1:40 inclination, this is bigger than for a 1:20 inclination. The range of lateral displacements is also bigger in this case. A list of basic statistical values of lateral displacements is presented in
Table 2.
The lateral force on the right wheel has shown similar qualitative features as on the left wheel.
Examples of the lateral displacements of the wheelset are shown in
Figure 15.
In the case of the transverse forces relevant for the calculation of the derailment coefficient, their mean value is higher for a 1:20 inclination compared to the mean values of the forces for a 1:40 inclination. This affects the values of the lateral displacements of the wheelset (
Figure 16) and the values of the Y/Q ratio.
From the simulations of straight track runs, taking into account the actual track irregularities, for different rail inclinations, the values of the Y/Q derailment coefficient for the left and right rails were obtained. The maximum values of this coefficient are presented in
Table 3 and the exemplary results for the speed of 200 km/h are shown in
Figure 16a–c.
When assessing the influence of the driving speed on the value of the Y/Q coefficient (
Table 3), for various rail inclinations, it can be observed that for low speeds, up to 100 km/h, this influence is insignificant, while an increase in speed above 100 km/h results in an increase in the value of this coefficient, which reduces driving safety. On the other hand, the Y/Q coefficient waveforms at the speed of 200 km/h show that the lack of rail inclination (
Figure 16a) or a small inclination (1:40) results in the appearance of the Y/Q coefficient exceeding the limit value of 0.8; as shown in
Figure 16a,b, an inclination of 1:20 resulted in a significant reduction of the derailment coefficient to the value of 0.41.
We now discuss the issue of the influence of varying rail inclination along the track on some of the kinematic and dynamic parameters of the wheelset. Those variations are not diagnosed, but we cannot assume their ideal constancy. Due to the fact that there is no measurement data whatsoever related to this issue, the following assumptions have been adopted for the numerical experiments:
rail inclination is a random process with an average value of 0.025 (this corresponds to a 1:40 inclination);
the lengths of the inclination change waves correspond to the lengths of the rail lateral alignment;
the maximum and minimum inclination value does not exceed the average value ±10%.
Based on such assumptions, an implementation of a certain stochastic process has been generated; it was assumed to be a variation of rail inclination.
A number of simulations were conducted on a straight track with a length of 400 m, changing the velocity of the vehicle in the range from 10 to 70 m/s. The obtained results confirm a thesis that rail inclination variations (of course within the limits which have been assumed here) do not cause significant changes in the kinematics and dynamics of the rail vehicle, which is confirmed by an analysis of system element displacement and of the forces in contact.
However, what is interesting is the fact that at certain velocities, one may observe regular lateral oscillations (sinusoid with a wavelength of approximately 65 m) of the railcar body, with a low amplitude of approximately 1 mm. Such oscillations occurred at velocities of 27 to 33 m/s. This corresponds to a railcar body oscillation frequency from ~2.4 to 2 Hz. This range also includes the imaginary parts of some eigenvalues of the linearized model of a rail vehicle. We can say with a high degree of certainty that this is a result of parametric oscillations implied by the assumed disturbance of the system.
3.3. The Influence of Rail Profile Deviations from Nominal Size on the Results of Simulation Tests
The rail profiles in the conducted tests were assumed to be symmetrical for the right and left rails. The profile outlines are presented in
Figure 17. Three profiles have been used; one of them corresponds to the nominal profile of the UIC60 rail (marked as rail 1), and the other two also represent rails of the UIC60 type, but with varying degrees of wear. The degree of wear can be characterized by the wear field, and thus, in the case of rail 2, it is
, and in the case of rail 3
.
An analysis of the simulation results conducted on a track with alignments as previously described will be started from the selected coordinates describing the displacement of the wheelset, showing the impact of variations in the shape of the rail profile on its kinematics with a S1002 wheel nominal profile. We first deal with the statistical values regarding the lateral displacements and lateral accelerations of the wheelset. Of course, the average value of these quantities is close to zero.
Changing the rail profile from a nominal one to that marked in
Figure 17 as rail 2, virtually does not lead to an increase in the standard deviation, and a change into the profile marked as rail 3 gives a significant increase by ~55%.
The standard deviations of accelerations are independent of the rail profile and practically the same. The situation is slightly different for the range of acceleration variations, as the range of accelerations obtained from the simulations at nominal profiles is bigger than that in the case of worn profiles. There is no relation—if the wear increases, the statistical values of displacements and accelerations increase.
Considering the frequency analysis of the oscillations of the wheelset [
24], we first handle the spectral density of the lateral displacements, analyzing the position of the peaks in the spectrum, and the changes in their values. The discussion of the results will be limited to the range of frequencies below 10 Hz as the spectral density of the lateral displacements for higher frequencies was several times lower (approximately 100 times) [
25,
26,
27].
The most important conclusion from the frequency analysis regarding the peak locations is the fact that a change in a rail profile shape does not lead to shifts in the peak location within the spectrum density diagram. The results obtained for the yaw angle, the lateral displacements and accelerations of the wheelset have similar characteristics.
Although the analyzed model does not explicitly contain any generalized coordinates correlating to vertical displacements and to the wheelset roll angle, they may be indirectly set with the assistance of an analysis of the geometry of the system and of the results which have been obtained directly. A list of the basic statistical values of the vertical displacements of the wheelset for the nominal wheel and rail profile with varying degrees of wear is shown in
Table 4.
To conclude the data contained within the table, we may say that if we are dealing with statistical characteristics, then the conducted simulations indicate only a slight relation between the rail profile and the vertical displacements of the wheelset. An analysis of the rolling surface geometry playing an important part in the model gives us a simple explanation of this fact [
7,
14,
22]. The vertical displacement of the wheelset will be influenced not only by the vertical geometrical irregularities, but also by a change in the temporary rolling radius of the wheels, and this can be an effect of large lateral displacements, as well as of the changes in track gauge. The last of these causes is definitely not caused by rail profile wear.
An analysis of the dynamic quantities will be presented for the statistical values of the reaction forces resultant from the track, impacting the wheelset, therefore the following forces: QR + QL and YR + YL.
The average vertical resultant force value impacting the wheelset virtually did not change regardless of the rail profile and was approximately 112,800 N. The standard deviation value changed with only slight fluctuations. This was as follows: for rail 1—1116 N, for rail 2—1089 N, and for rail 3—1086 N. Therefore, the changes did not virtually exceed 3%.
Similarly, small changes occurred within the minimum and maximum value of the resulting vertical force.
The average value of the resultant lateral force impacting the wheelset was approximately equal to 0 in all of the cases. As far as the standard deviation and the minimum and maximum values are concerned, they clearly depended on the rail profile.
Similar as in the case of lateral displacements, a change in the rail profile does not cause changes in the frequency characteristics of the lateral and vertical forces. Although the values of the characteristics change, the position of their peaks remain unchanged.
The influence of a rail profile on the forces within the system is more visible when we analyze the forces impacting only one side of the wheelset, that is, e.g., on the following forces:
YL and
QL. The results of simulation analyses in this case are included in
Table 5.
The differences in the values of both lateral and vertical forces visible in the table show that perhaps, during off-line diagnostics, one does not have to pay any special attention to the selection of the data describing the rail profile when we are interested in the system kinematics. However, it is indispensable when our interests concern the system dynamics, and, i.e., analyzing a value such as the derailment rate.
4. Discussion
In the case of an analysis of the changes in the position of contact points on the wheel and on the rail, one can conclude that there is no clear qualitative and quantitative relation when taking into consideration the lateral displacement of a wheelset. For 0 and 1:20 and 1:40 inclinations, depending on the lateral displacement of the center of mass of the wheelset in the range from −8 to +8 mm, there are changes both on the surface of the wheel and of the rail, from single-point contact into two-point contact. In the case of a 1:20 inclination, one can confirm much bigger quantitative changes, which were shown in simulation.
Changes in the positions of contact points and the changes of the nature of the contact from a single-point to a two-point one also influence the progress of the contact angle tangent between the wheel and the rail and the temporary wheel rolling radius.
Considering the influence of the rail inclination on the kinematic and dynamic parameters of the wheel set, the obtained results show that the change in rail inclination may cause differences in the lateral displacements of the set of up to 15%, while the differences in the transverse forces acting on the wheel may be on the order of several dozen percent. One can formulate a thesis that changes in the rail inclination (of course within the limits and simplifications assumed here) do not cause significant changes in the kinematics and dynamics of the rail vehicle, which is confirmed by the analysis of the displacement of system elements and the forces in contact. When assessing the impact of changes in rail inclination on safety and the phenomenon of derailment, it should be noted that at an increased vehicle speed already above 120 km/h, changes in rail inclination may significantly increase the Y/Q ratio. The safe slope in this case is 1:20.
It should be noted, however, that the simulation analyses were carried out under simplifying assumptions, which occur rather rarely in real operating conditions [
1,
2,
12].
When assessing the impact of rail profile changes on vertical displacements of the wheelset, it should be stated that the simulations carried out show a small relationship between the rail profile and the vertical displacements of the wheelset. An analysis of the rolling surface geometry playing an important role in the model gives us a simple explanation of this fact. The vertical displacement of the wheelset will be influenced not only by the vertical geometrical irregularities, but also by a change in the temporary rolling radius of the wheels, and this can be an effect of large lateral displacements, as well as of the changes in track gauge. The last of these causes is definitely not caused by rail profile wear.
Recent analyses of system dynamics show differences in the values of both lateral and vertical forces. It indicates that you may not need to pay special attention to off-line diagnostics and selection of data describing rail profiles when you are interested in system kinematics.
On the other hand, when referring to the issue of the impact of parameters determining the condition of the track, including rail inclination, on the running safety of a rail vehicle, in combination with the condition of wheel and rail profiles and the condition of the running gear of the vehicle, they undoubtedly play an important role in the assessment of vehicle safety using the Nadal criterion.
From the obtained simulation results, it can additionally be seen that for certain vehicle speeds one may observe regular lateral oscillations (sinusoid with a wavelength of approximately 65 m) of the railcar body with a low amplitude of approximately 1 mm. Such oscillations occurred at velocities of 27 to 33 m/s. This corresponds to a railcar body oscillation frequency from ~2.4 to 2 Hz. This range also includes the imaginary parts of some eigenvalues of the linearized model of a rail vehicle. We can say with a high degree of certainty that this is a result of parametric oscillations implied by the assumed disturbance of the system.


