
Holistic 1D Electro-Thermal Model Coupled to 3D Thermal Model for Hybrid Passive Cooling System Analysis in Electric Vehicles

 ,
,  ,
, 
 and
and 
Abstract
:1. Introduction
2. Chemistry and Characterization of the LiC
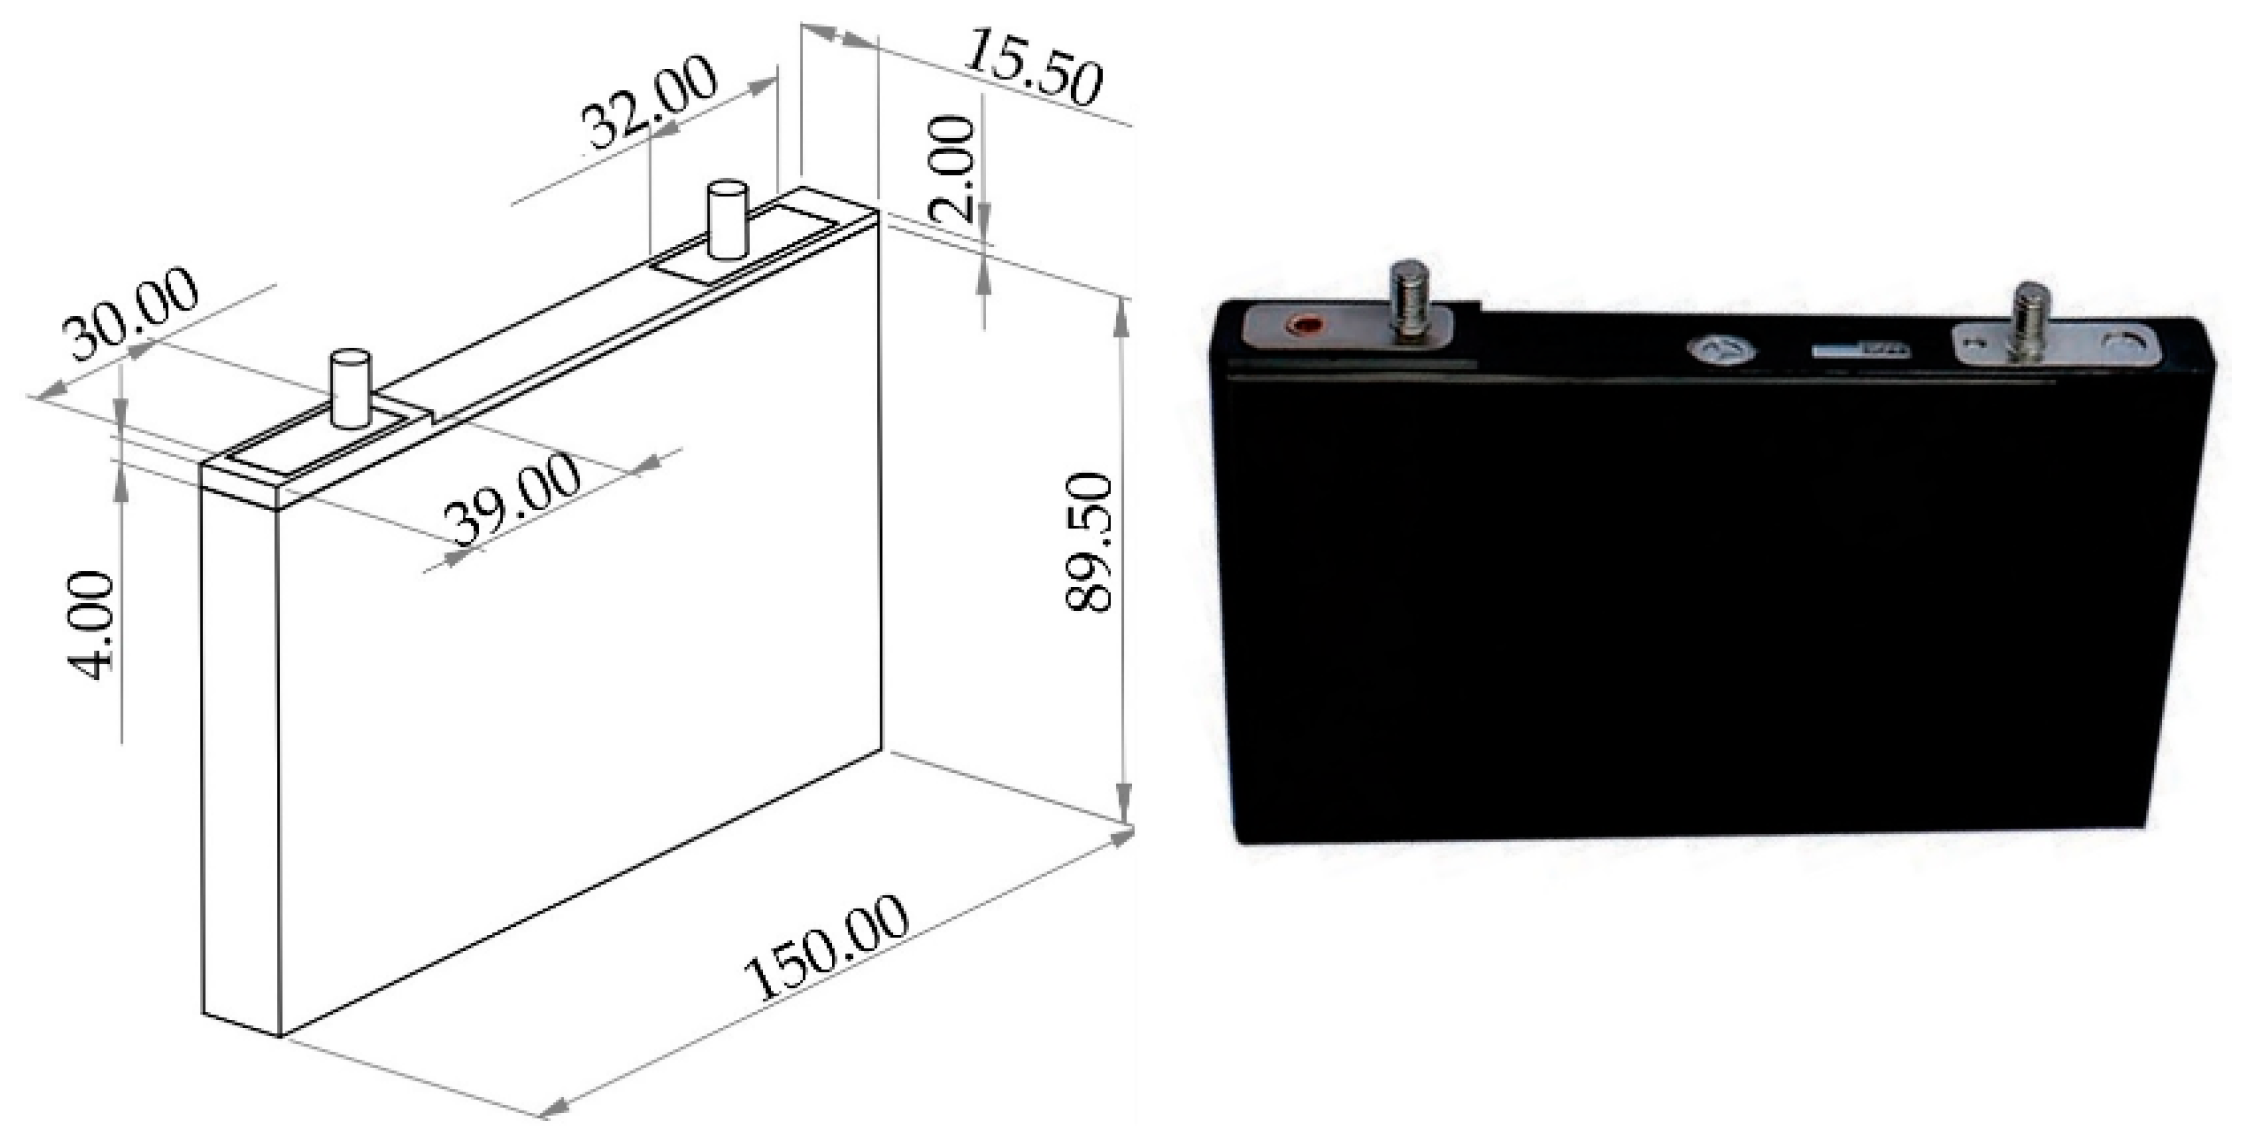
2.1. LiC 2300 F Technology
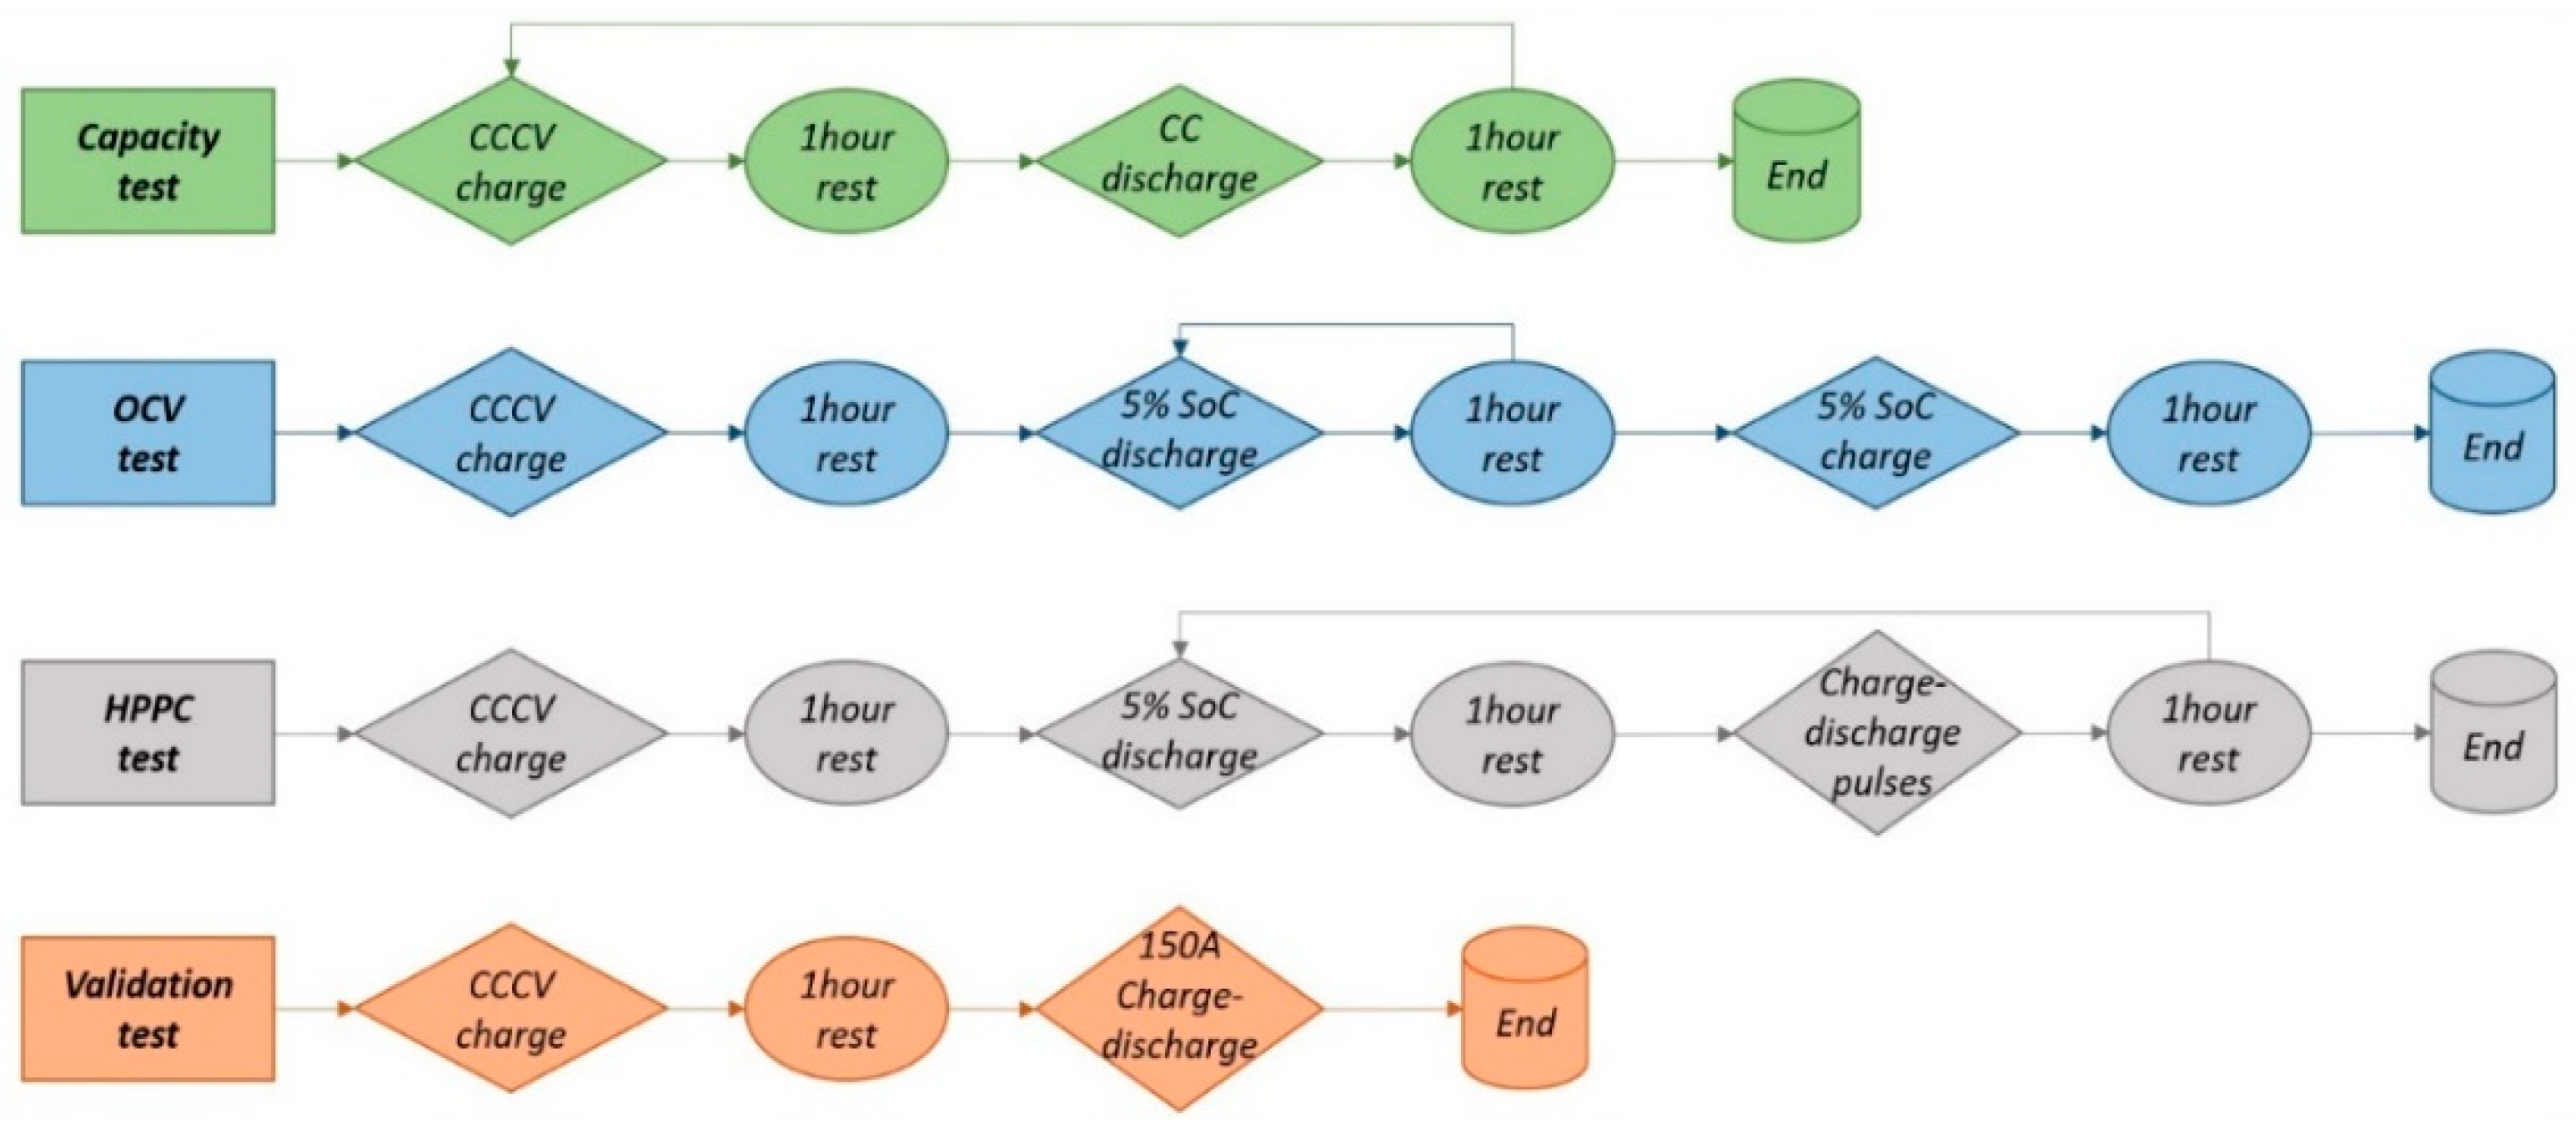
2.2. Characterization Test Protocol
2.2.1. Electrical Characterization
2.2.2. Thermal Characterization
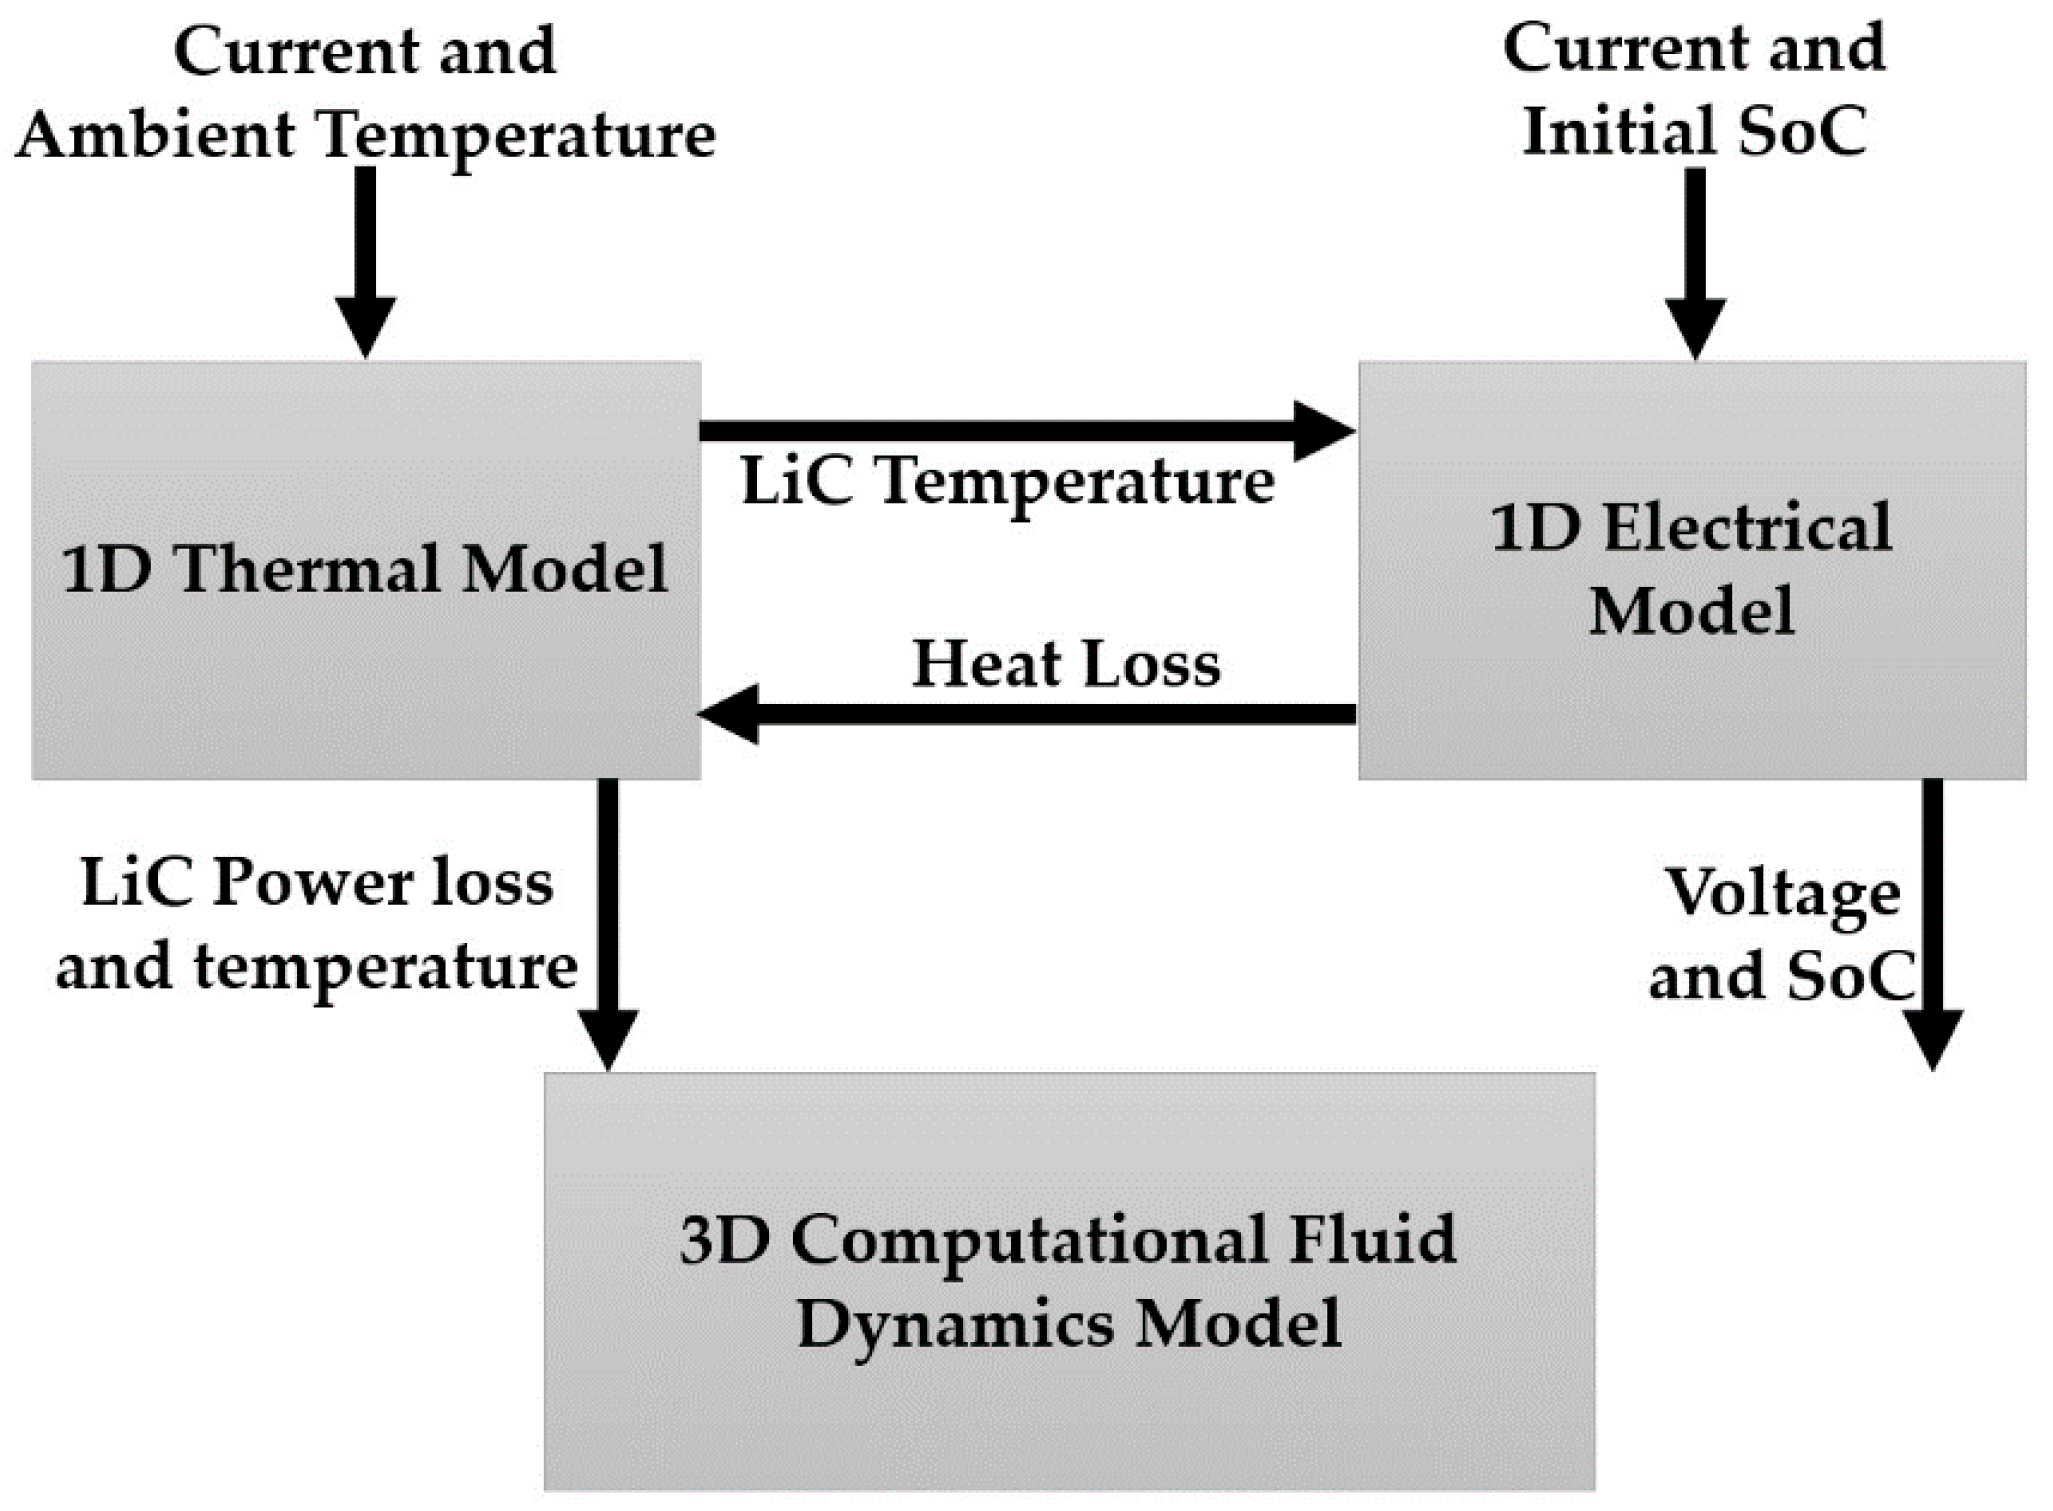
2.3. Governing Equations of the Electro-Thermal Model
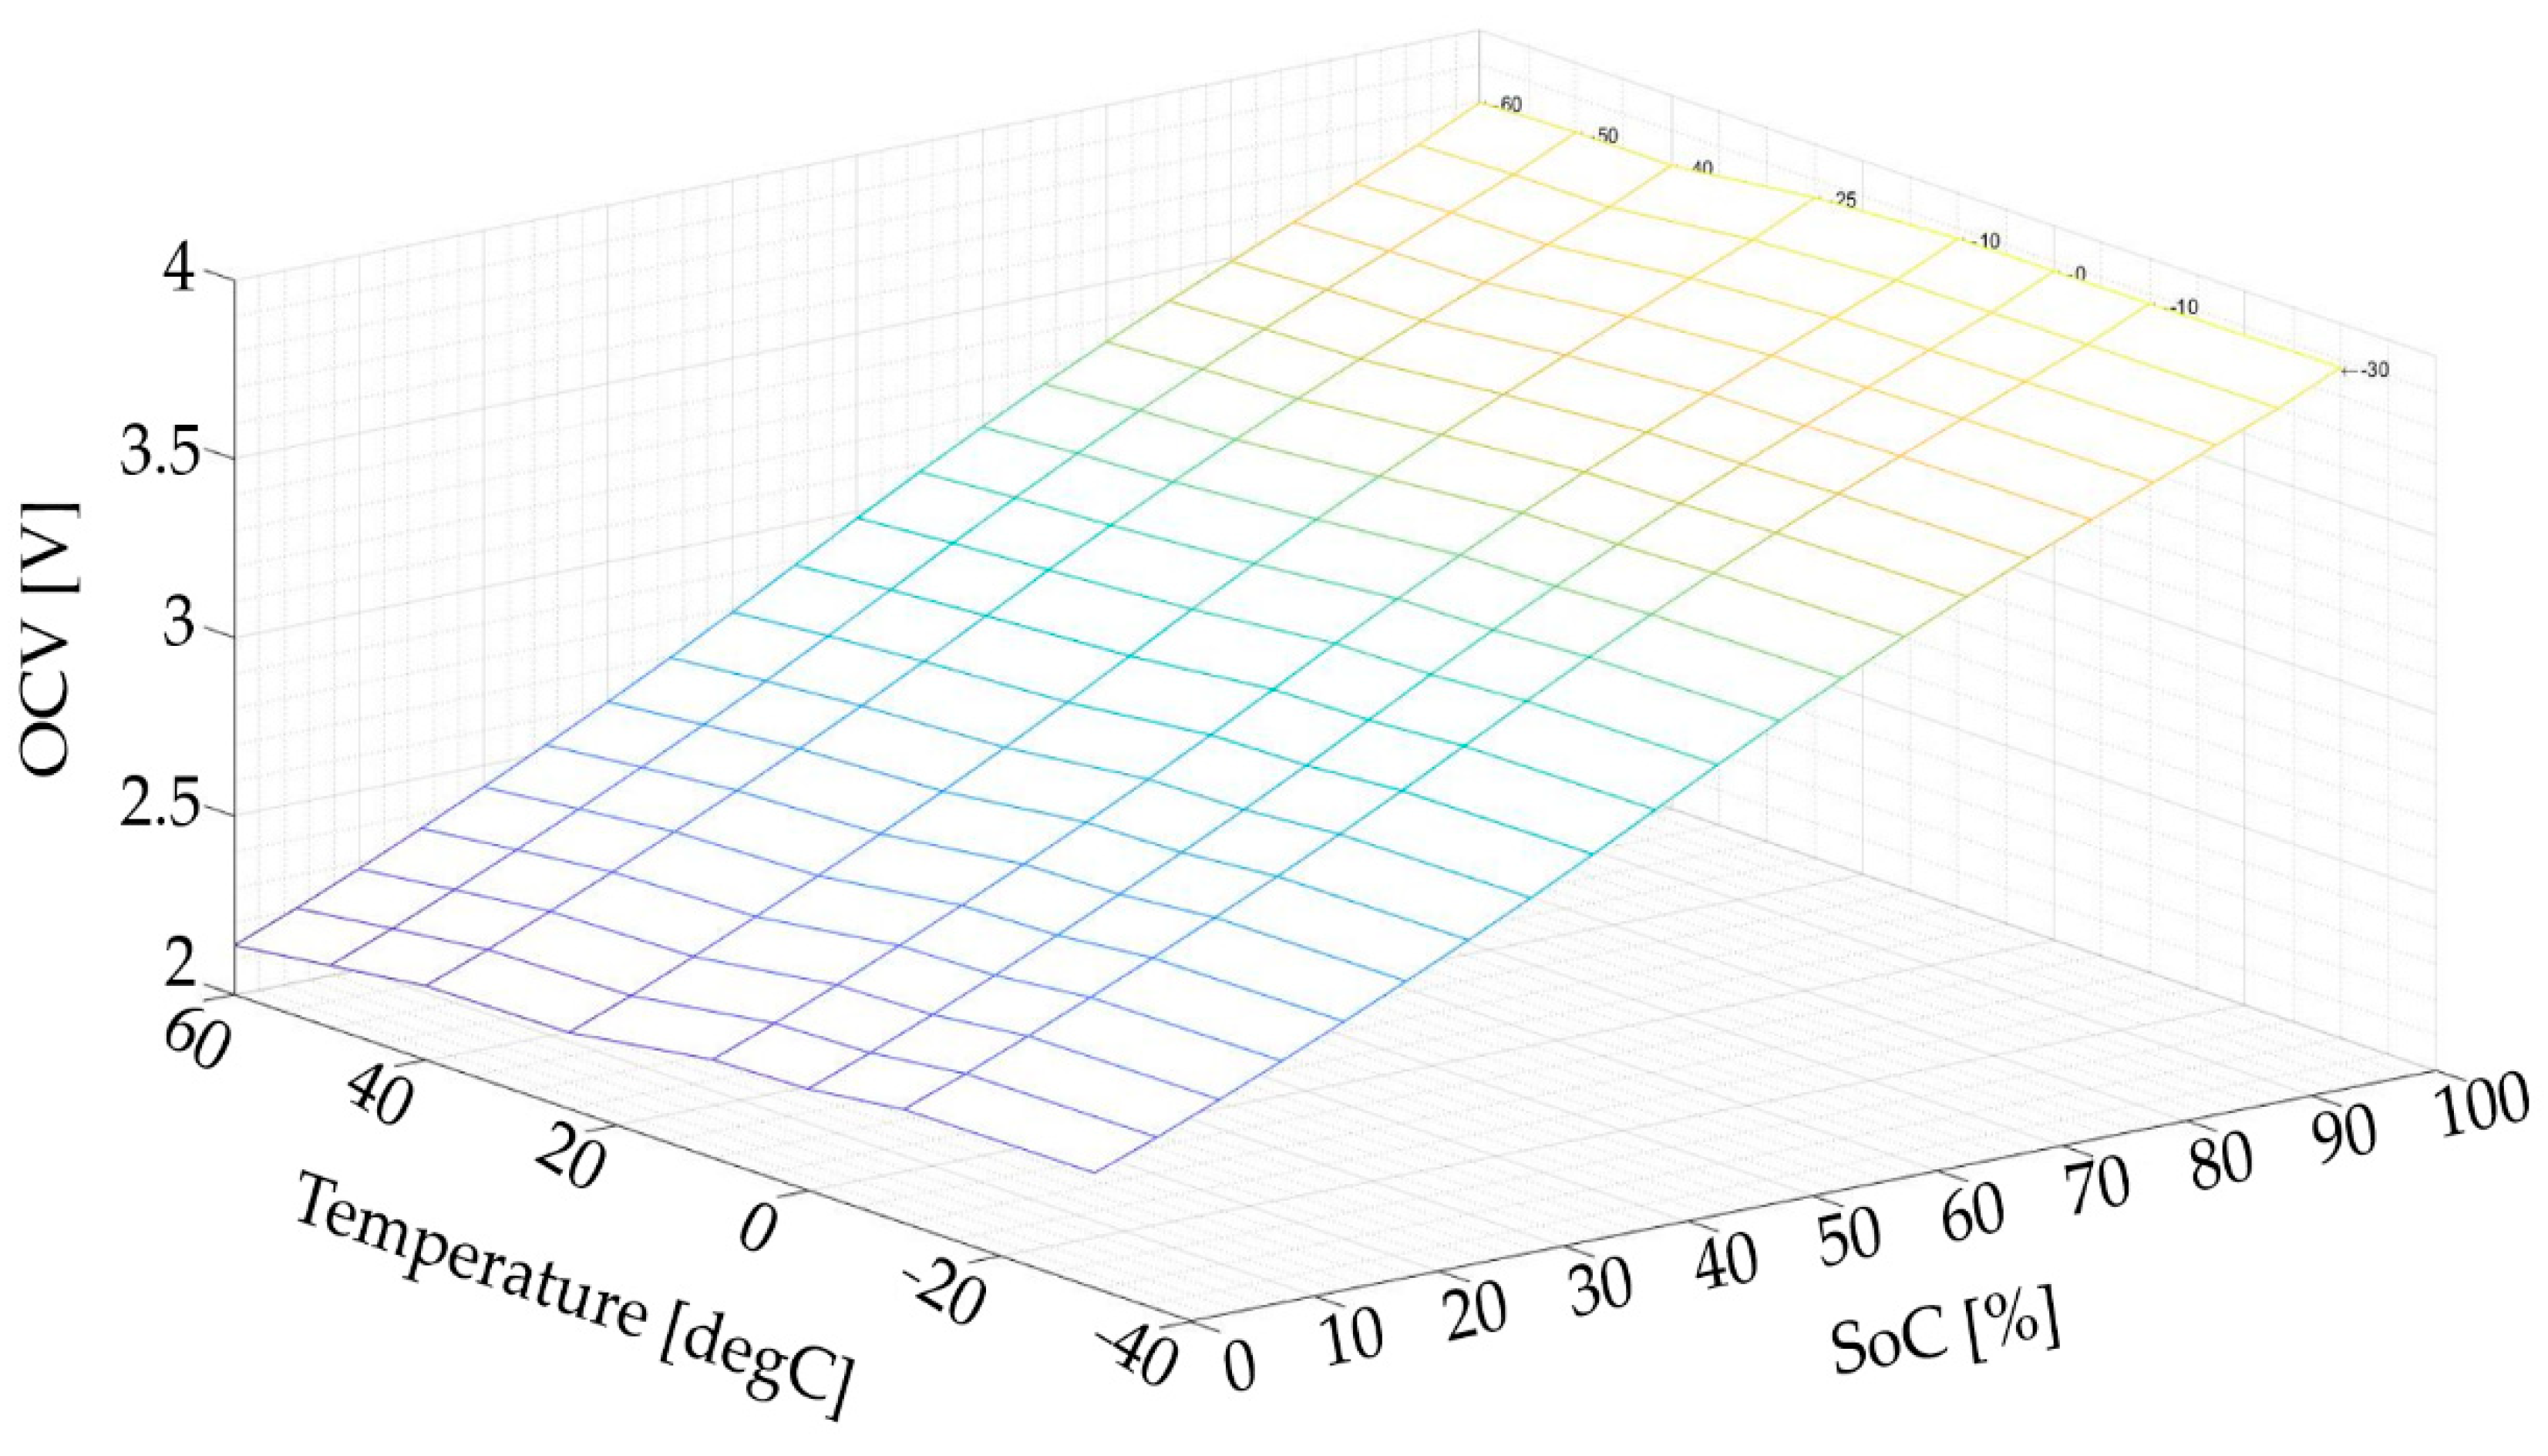
2.3.1. Electrical Model
2.3.2. Thermal Model
3. Hybrid TMS Development
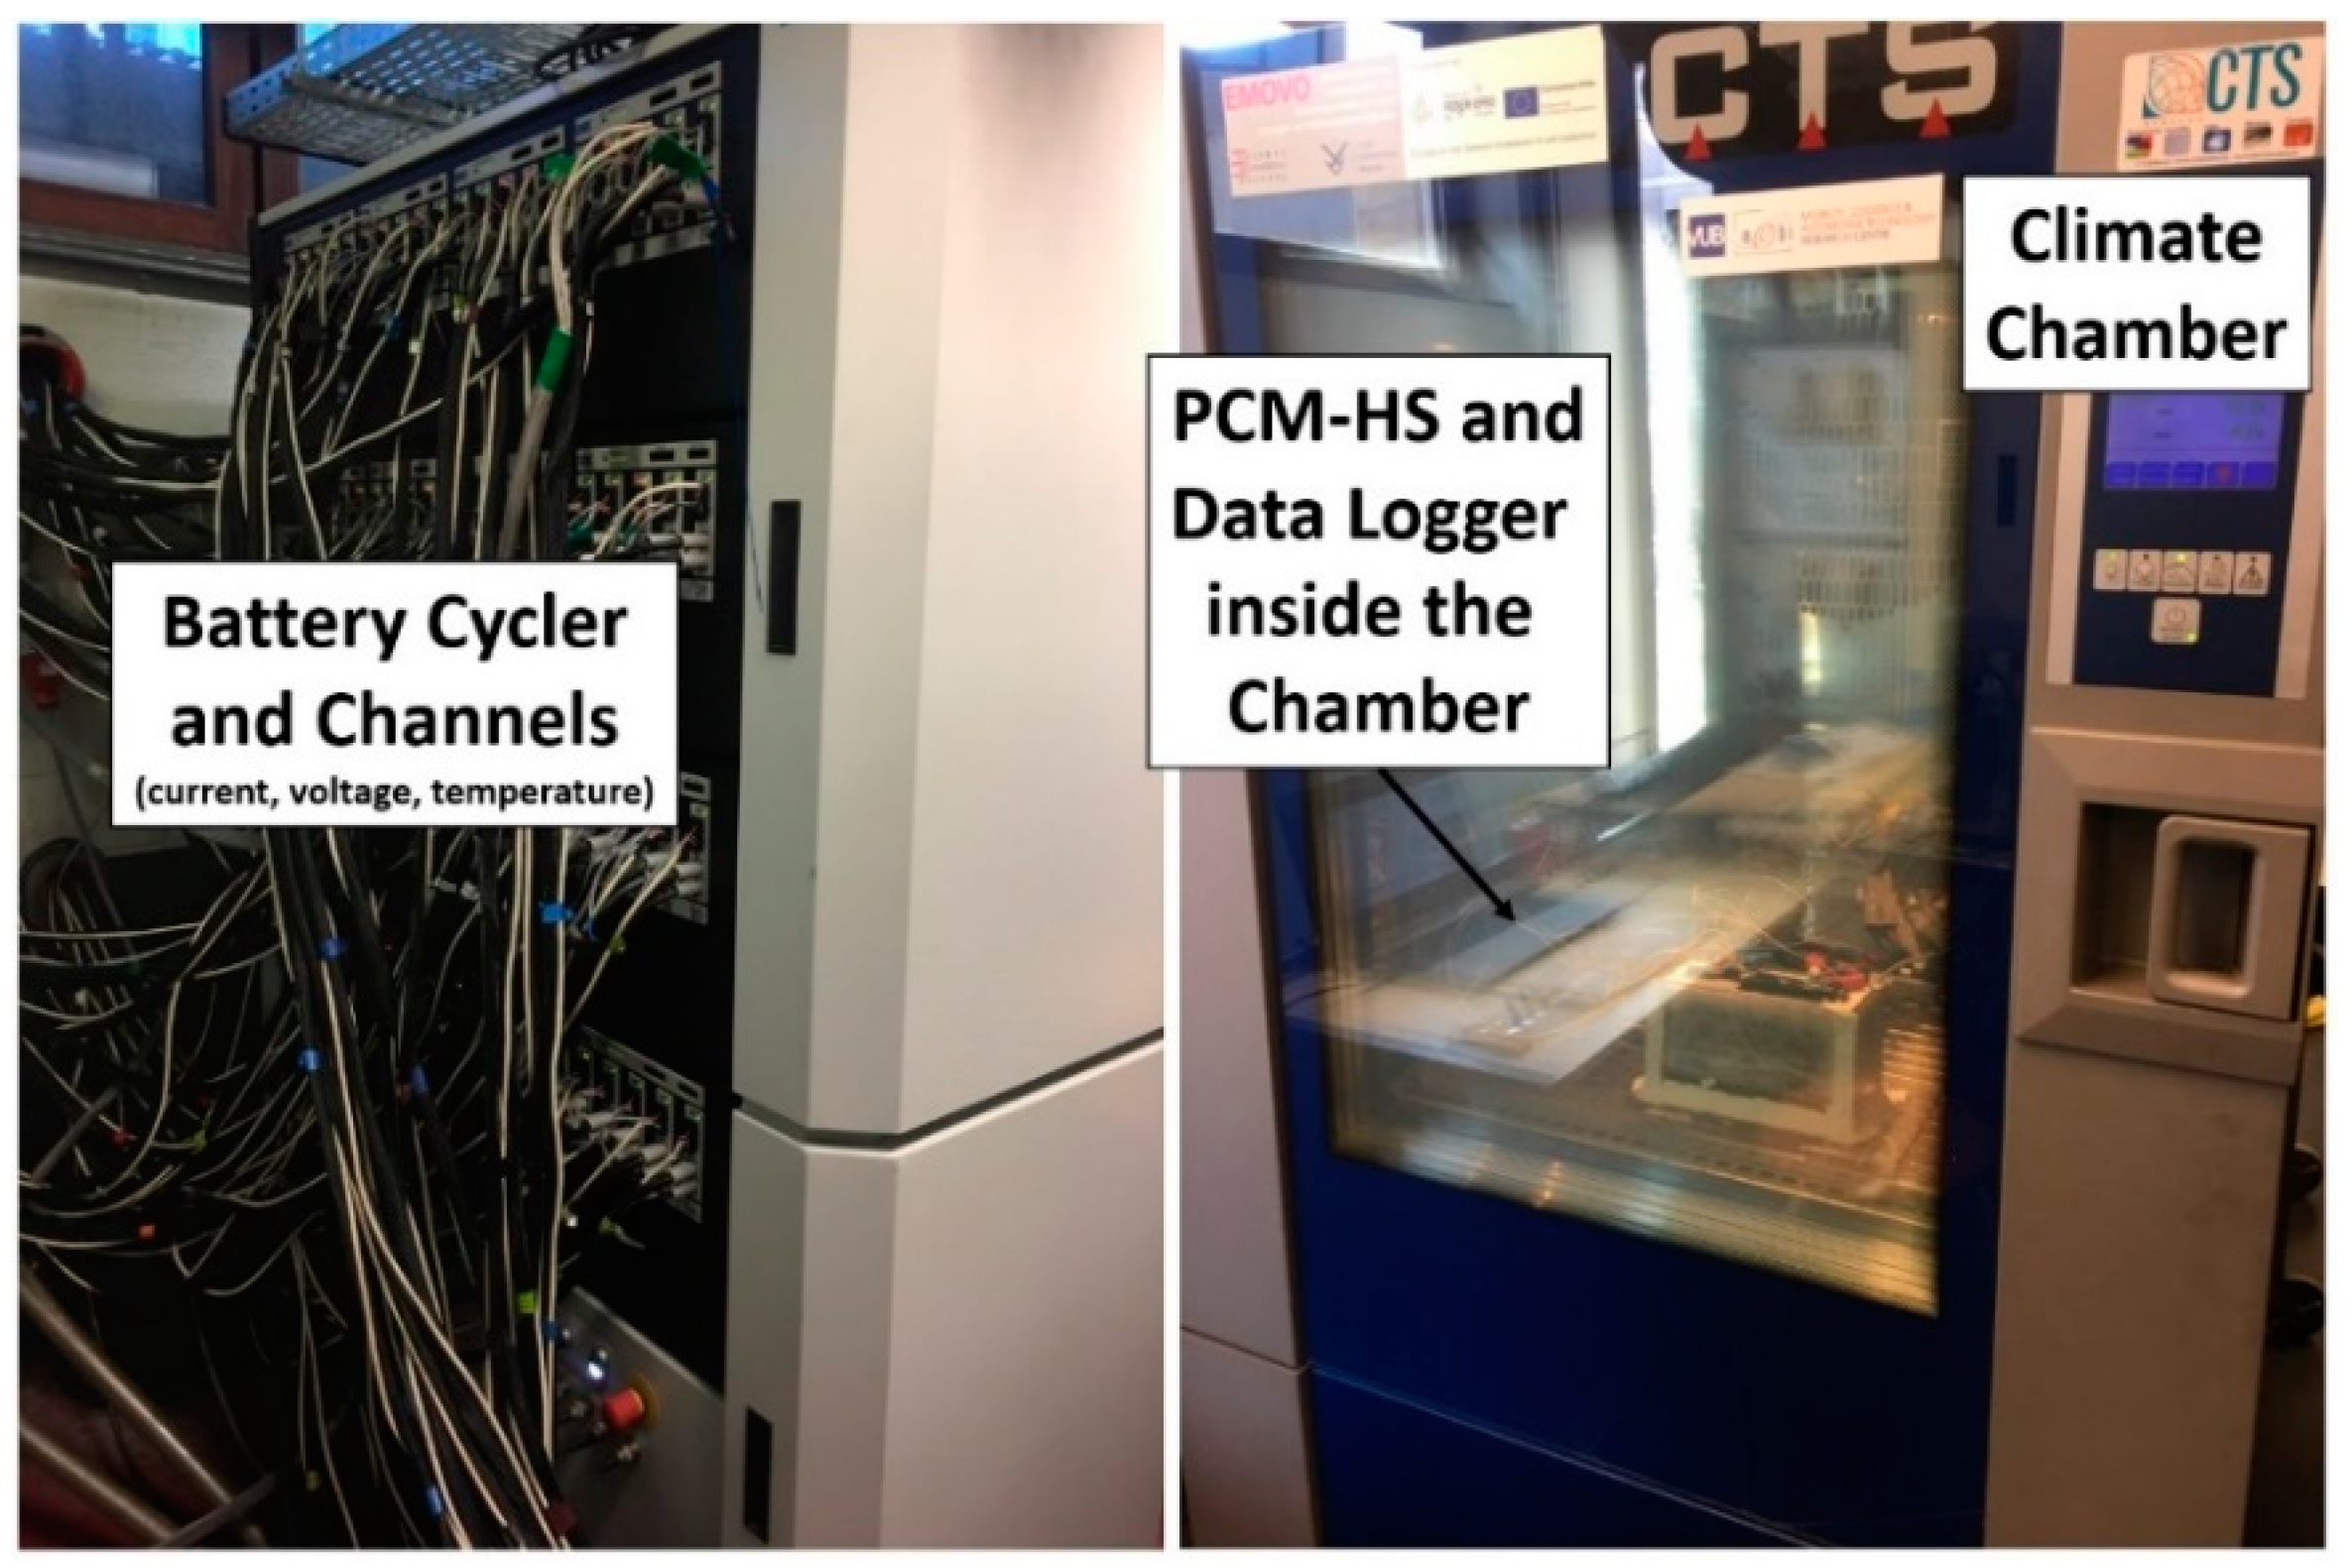
3.1. Experimental Test Bench
3.2. Experimental Results
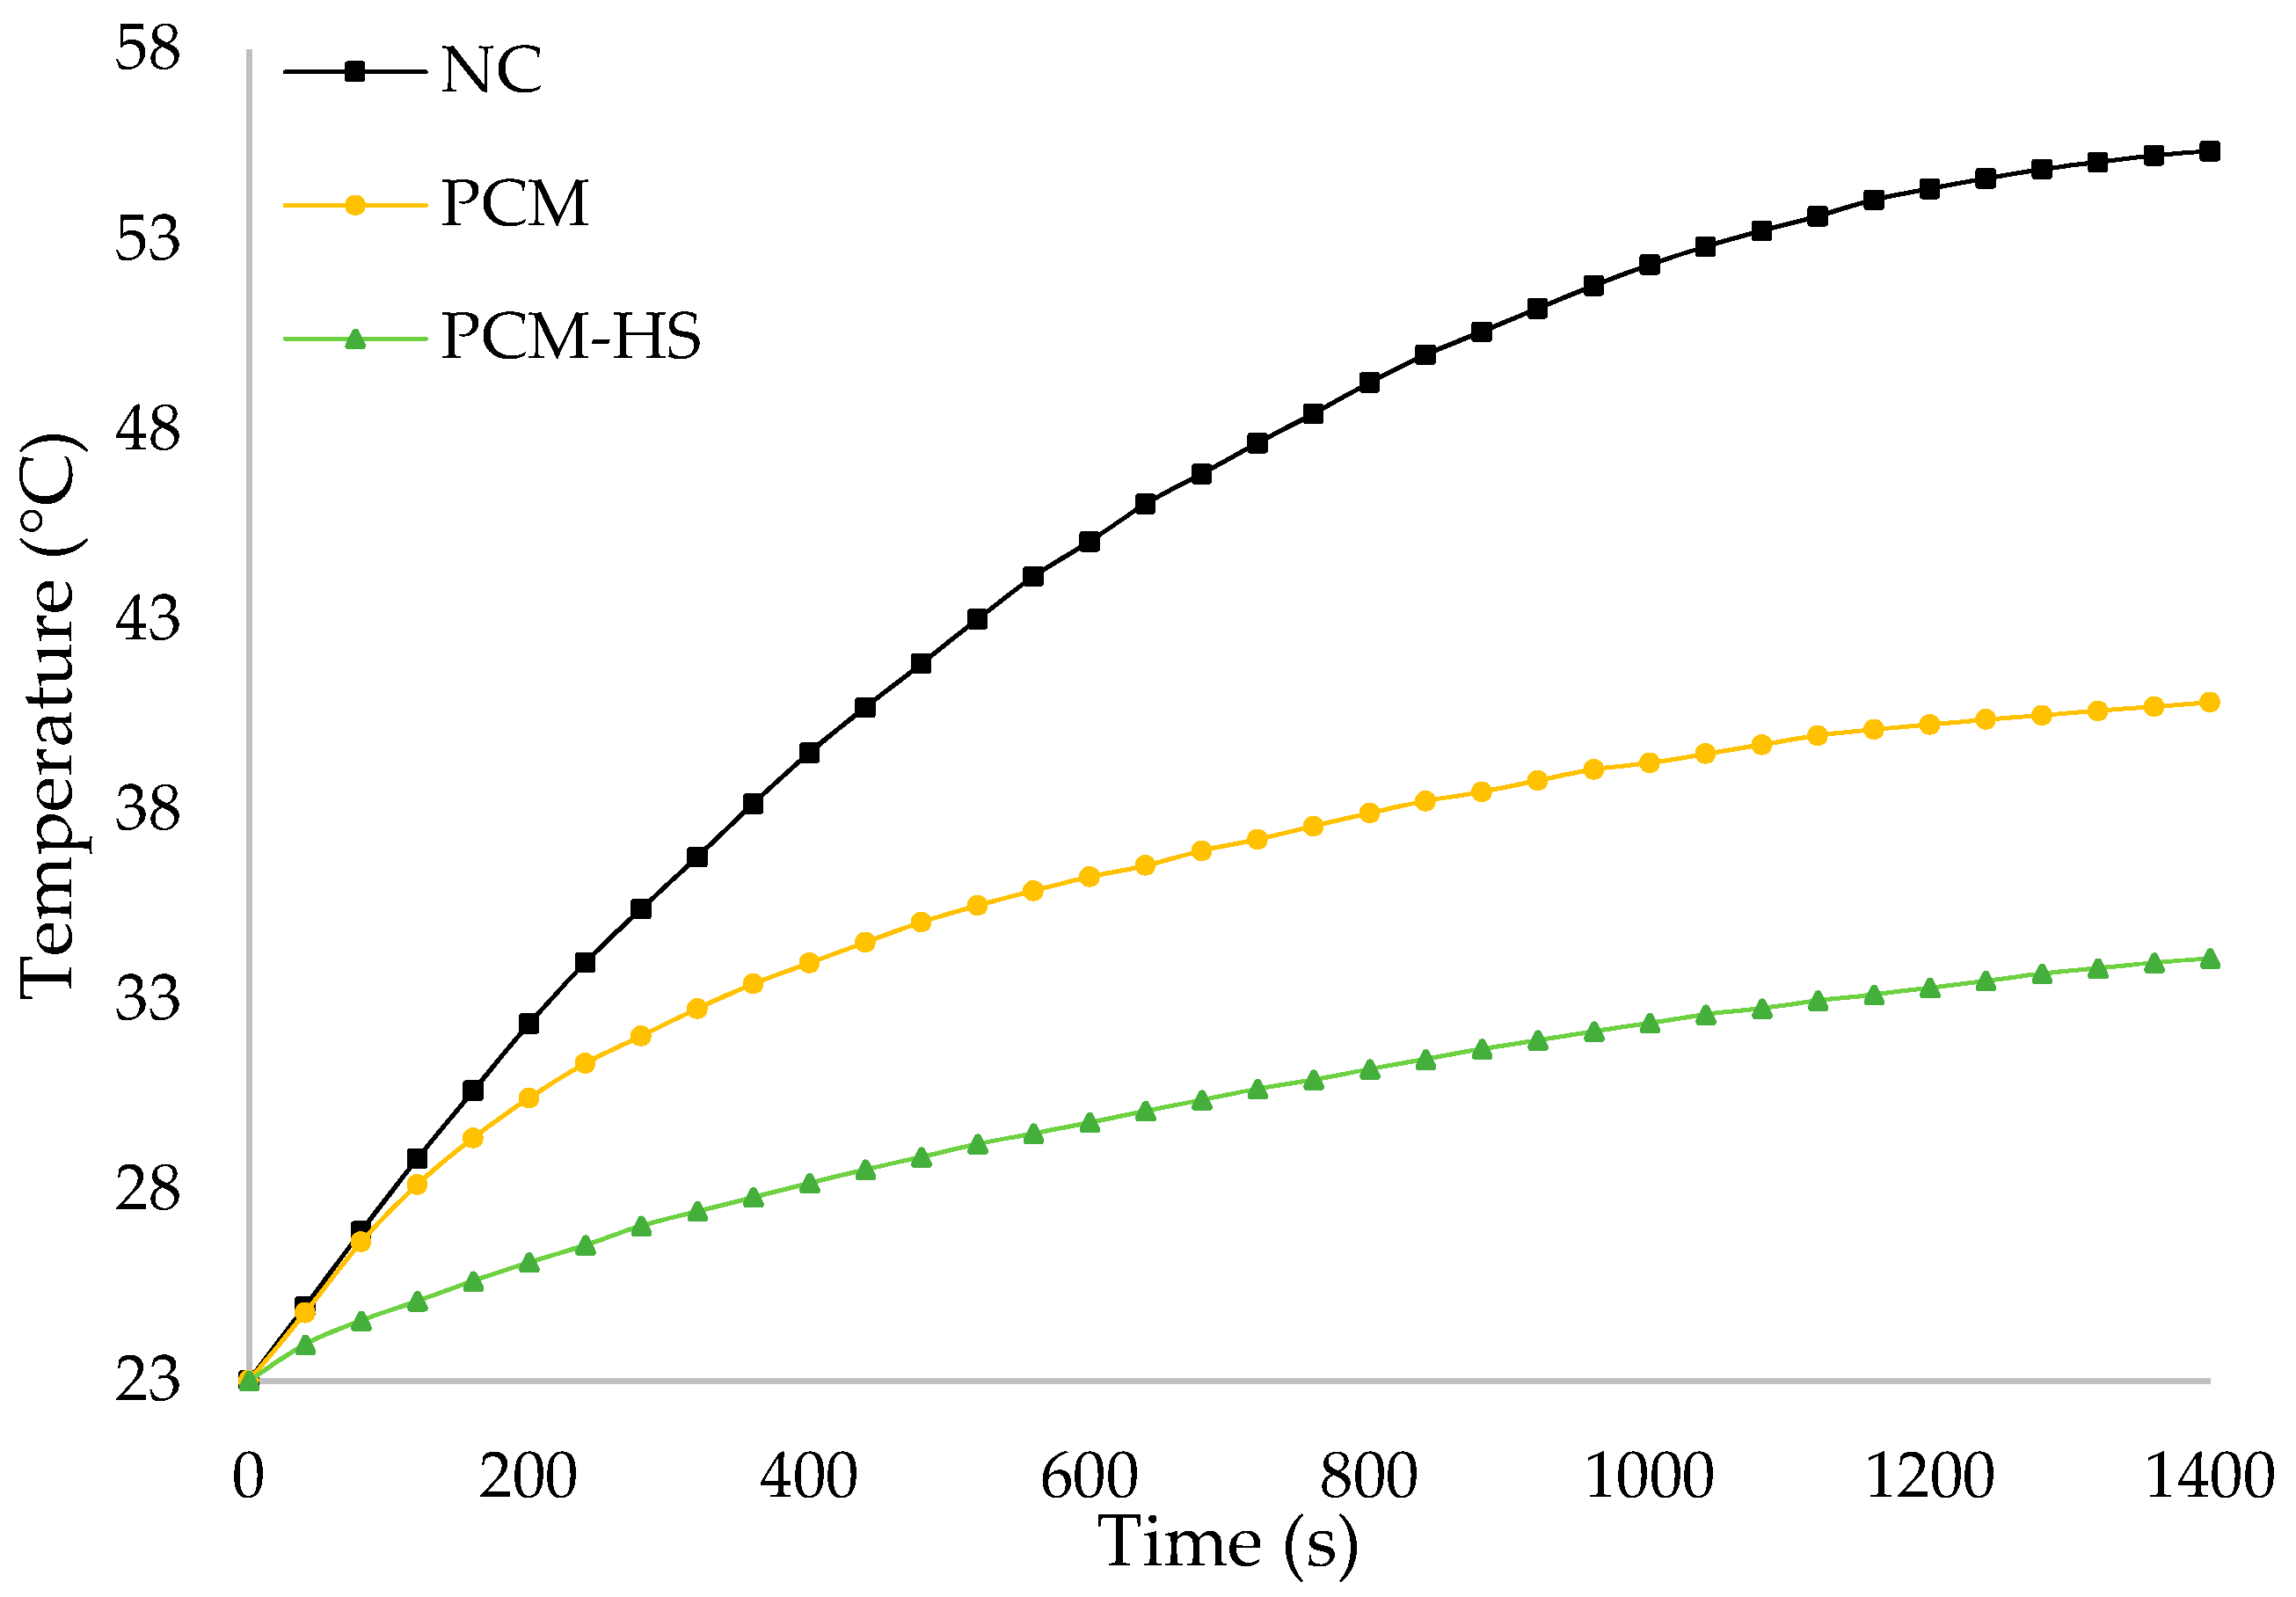
3.2.1. NC
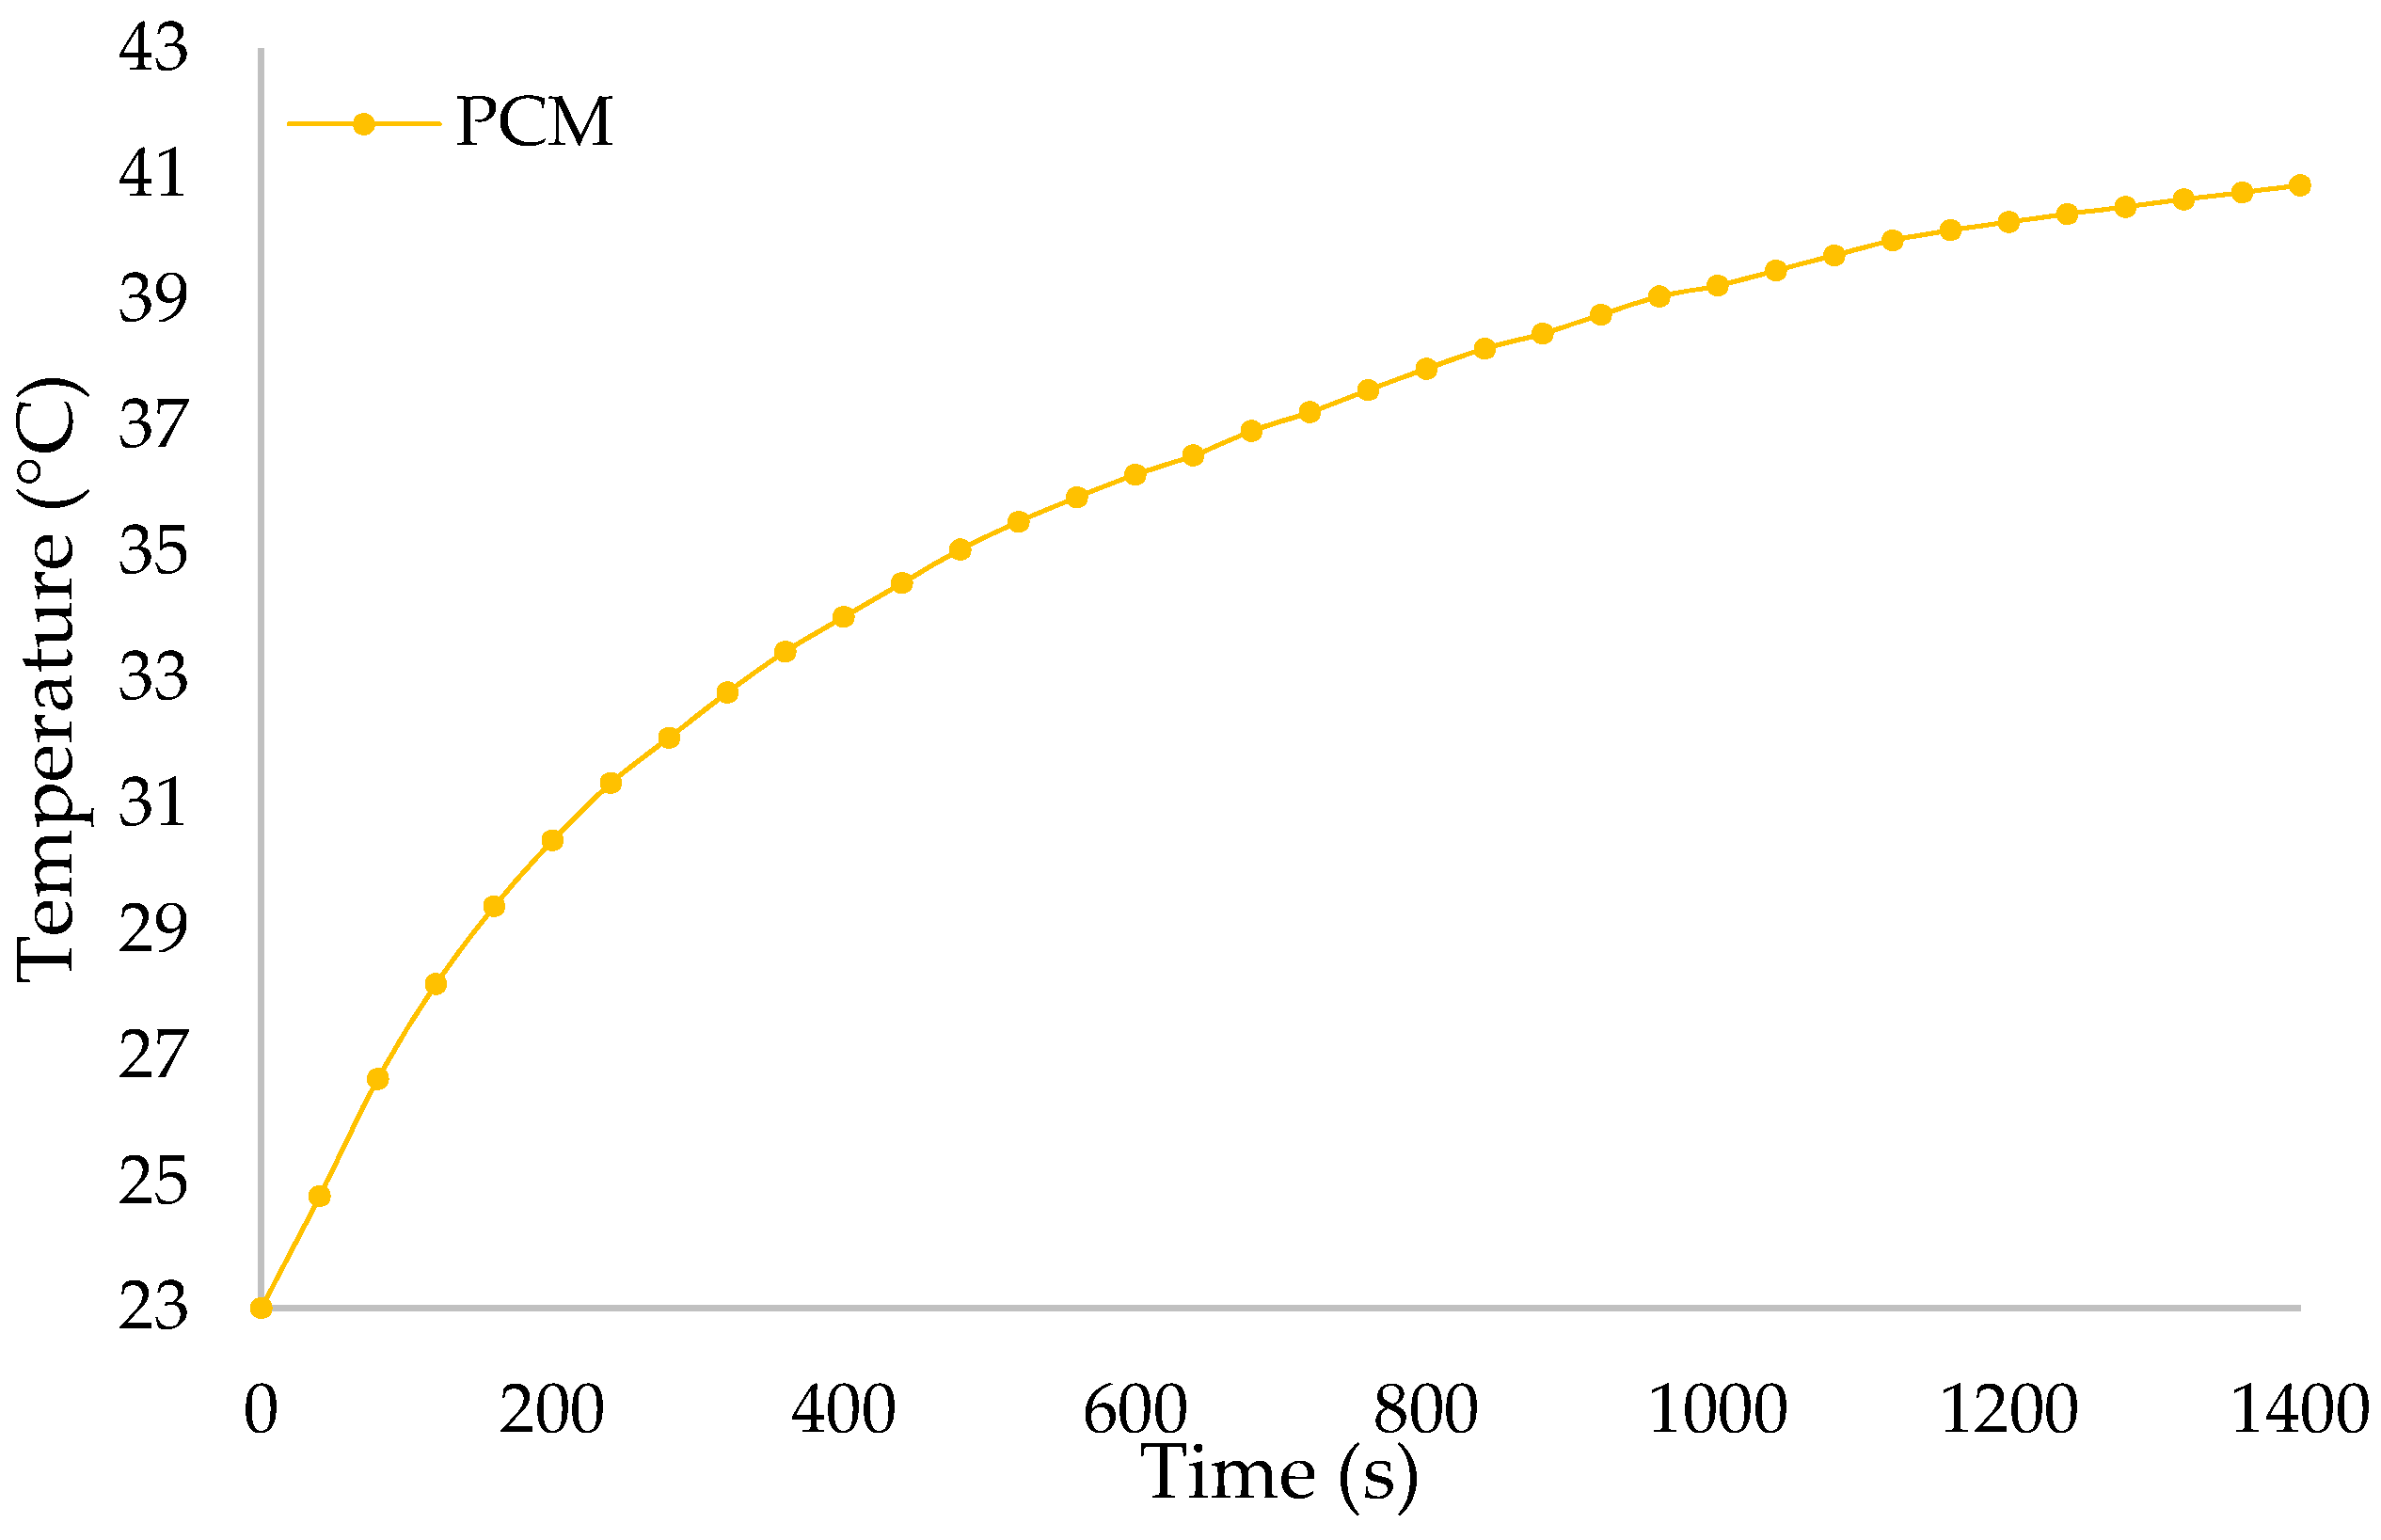
3.2.2. PCM
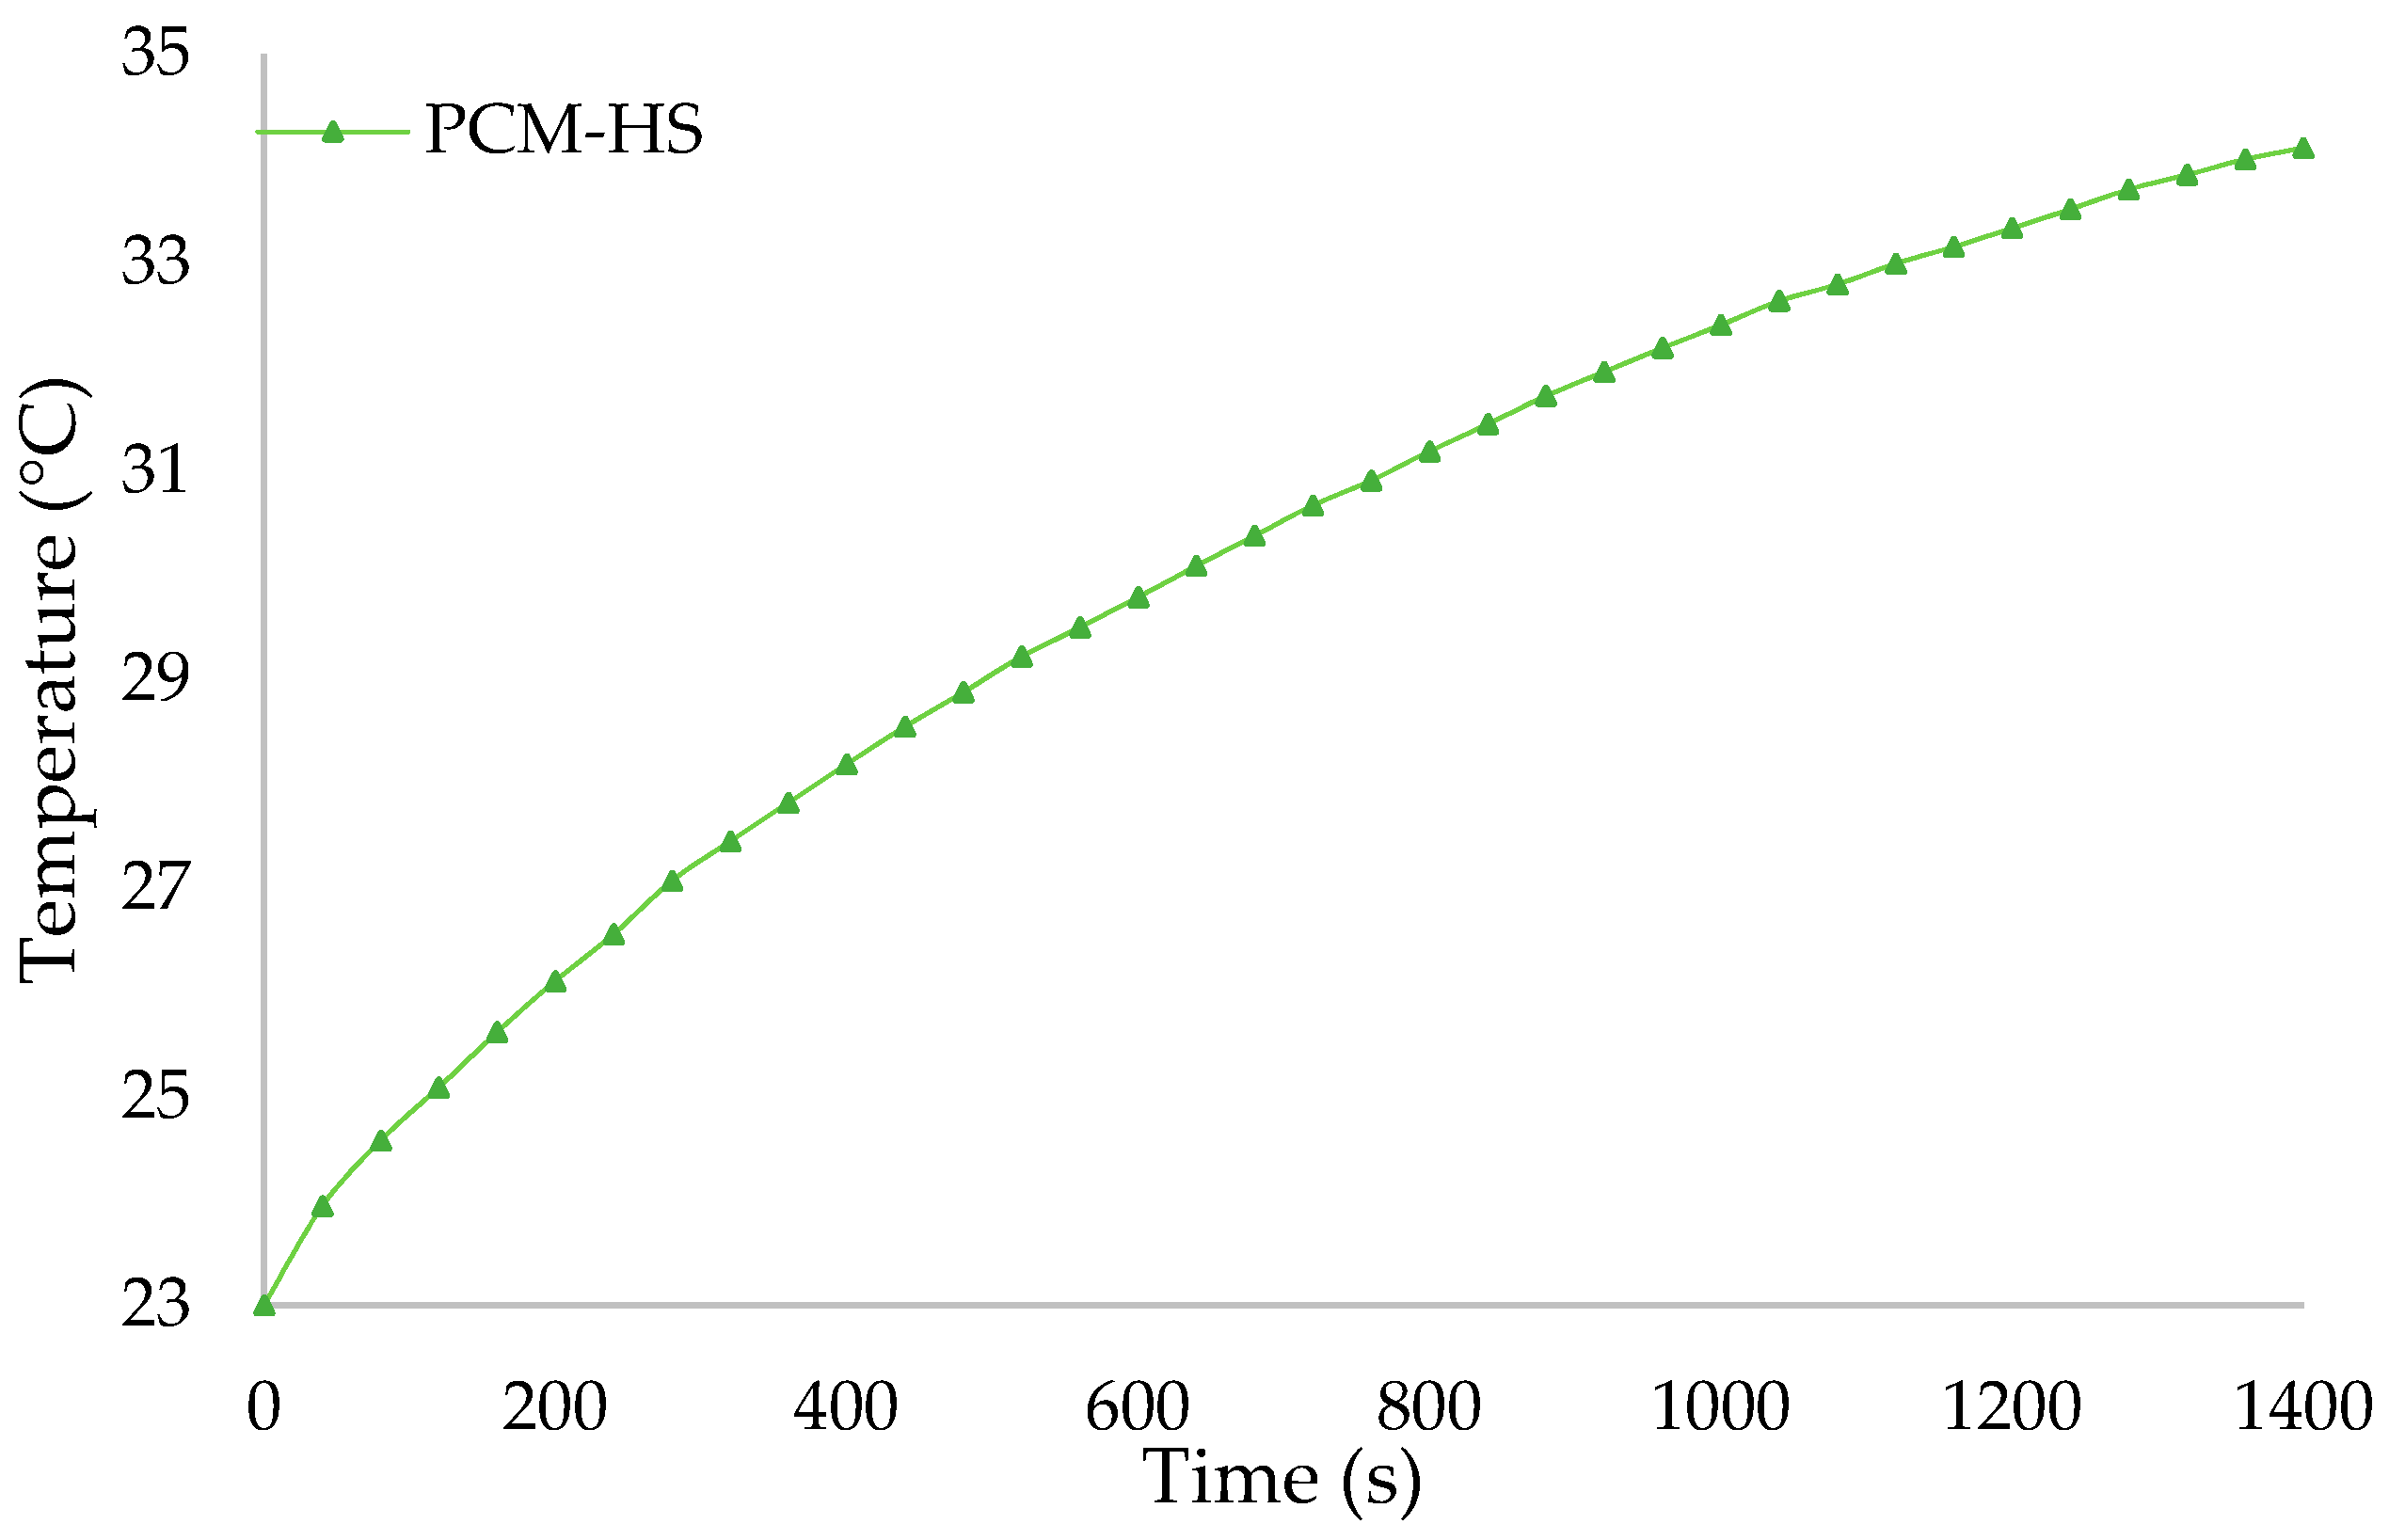
3.2.3. Hybrid PCM-HS
3.2.4. Comparison of the Results
4. CFD Model Development
4.1. Model Development and Equations
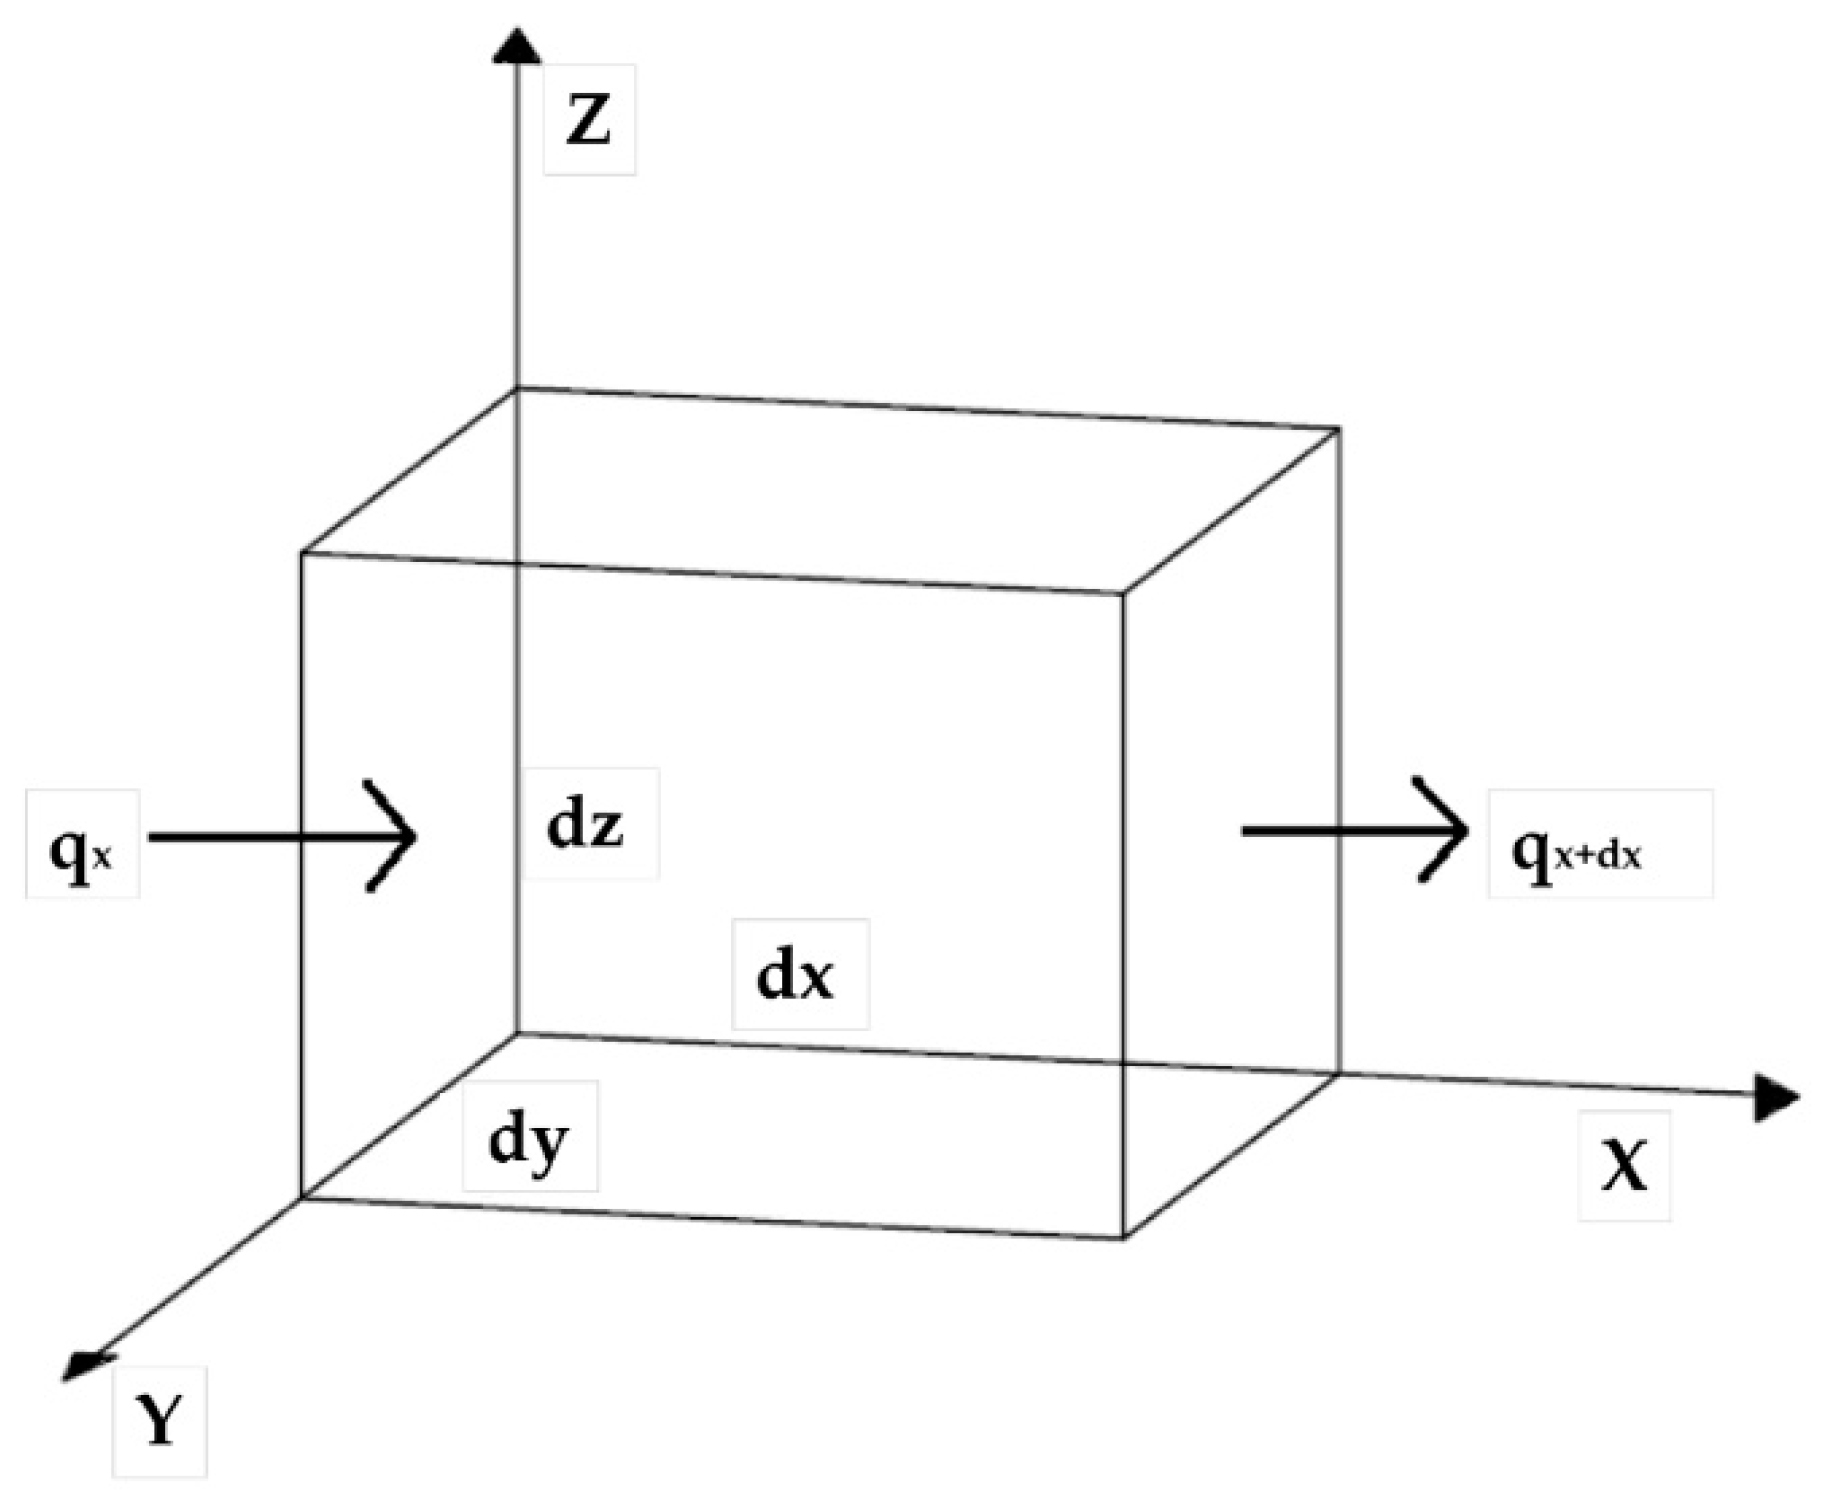
4.1.1. 3D Heat Generation
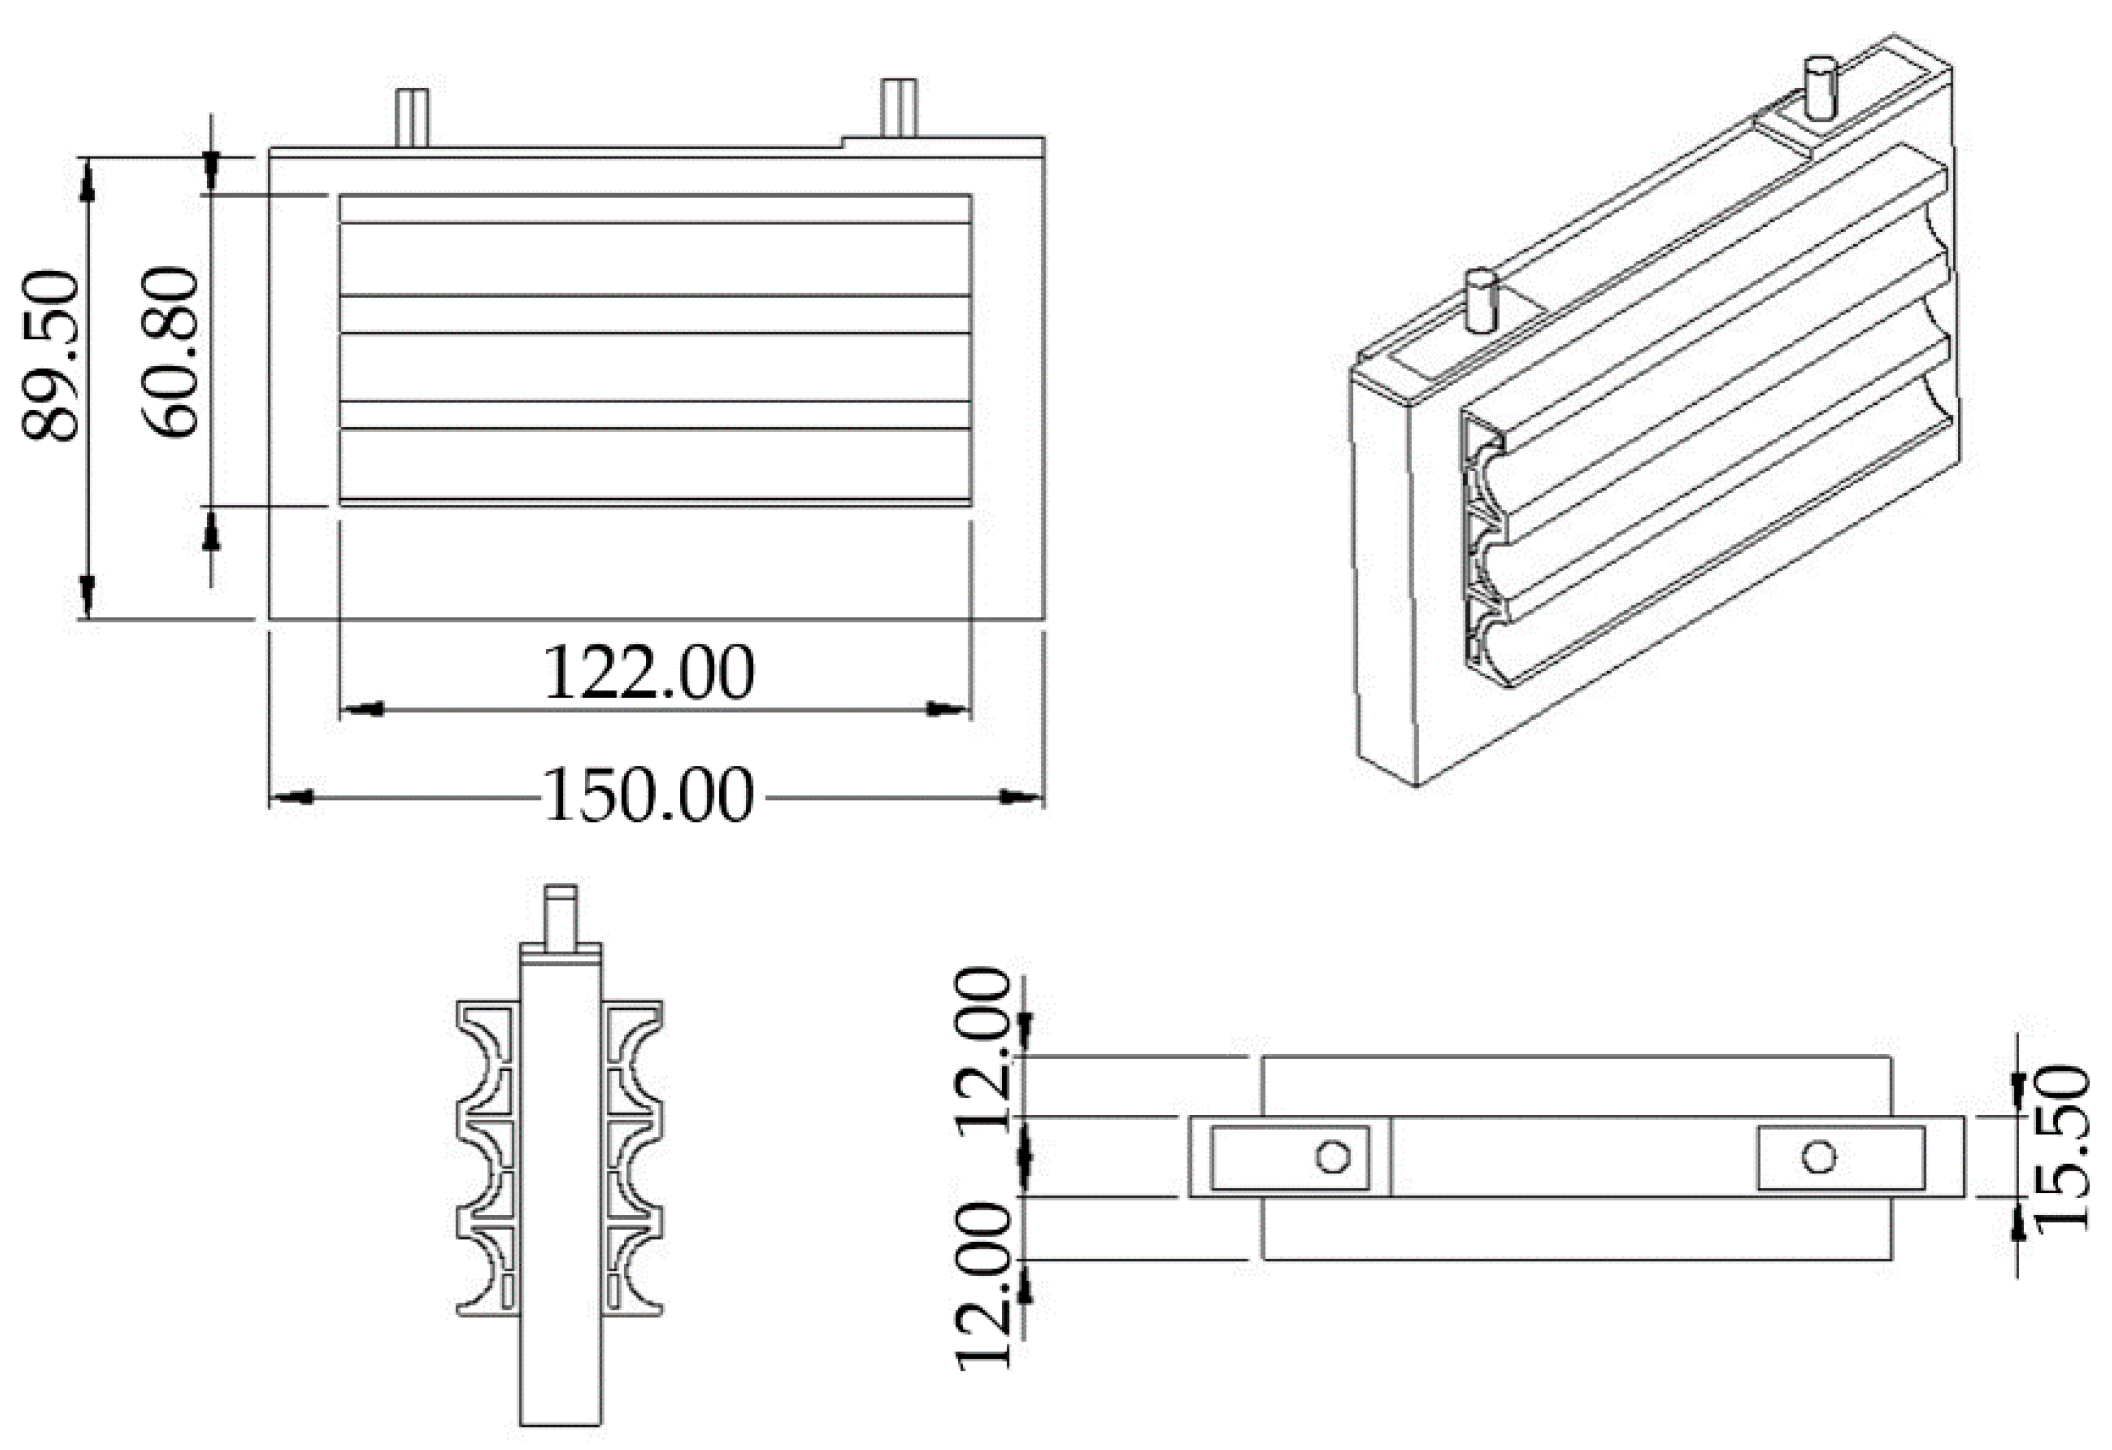
4.1.2. Heat Sink (HS) Modeling
- (1)
- The temperature at the base of the HS is fixed, meaning that . Therefore:
- (2)
- The second case occurs at the HS tip (x = L) that may correspond to one of the three different physical conditions:
- Conditions 1: meaning that the temperature is not too high and the PCM around the HS has not yet melted. The solution becomes:
- Condition 2: Assuming that the heat dissipation at the tip of the fin is negligible, the adiabatic condition can be assumed (). The solution is:
- Condition 3: When the side surface does not dissipate all the heat loss of the cell, the tip of the HS is crossed by a convective flux governed by Newton’s law:
4.1.3. PCM Modeling
4.2. Boundary Conditions
5. Results and Discussion
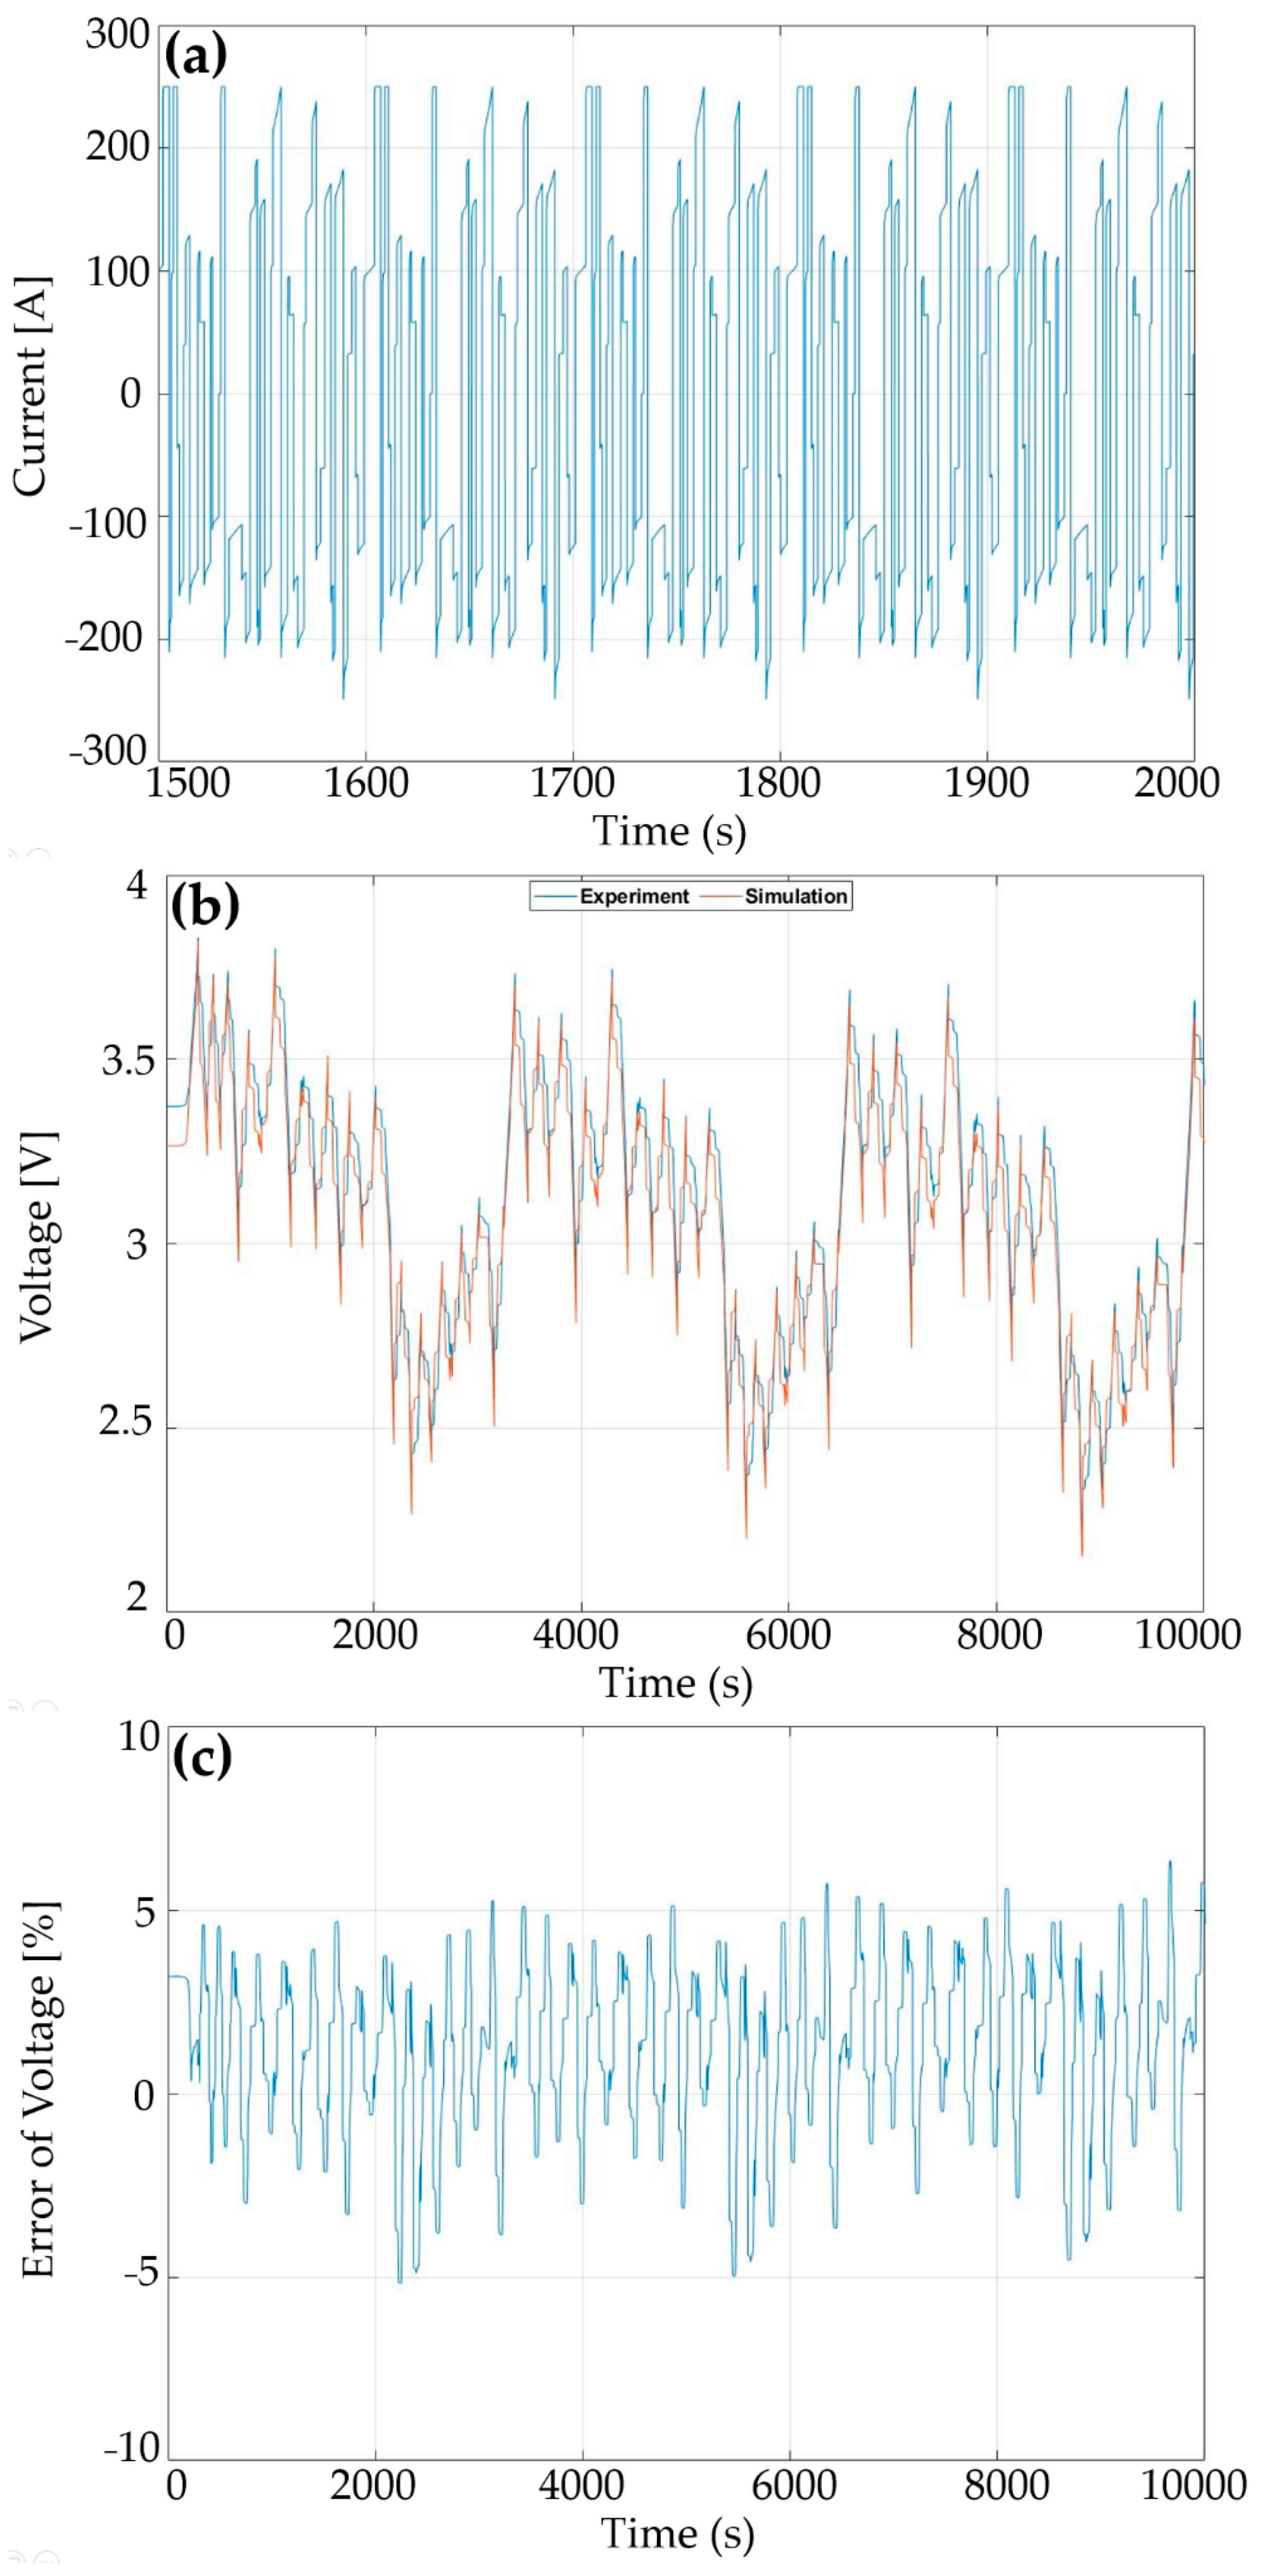
5.1. Results of the 1D Electrical Model
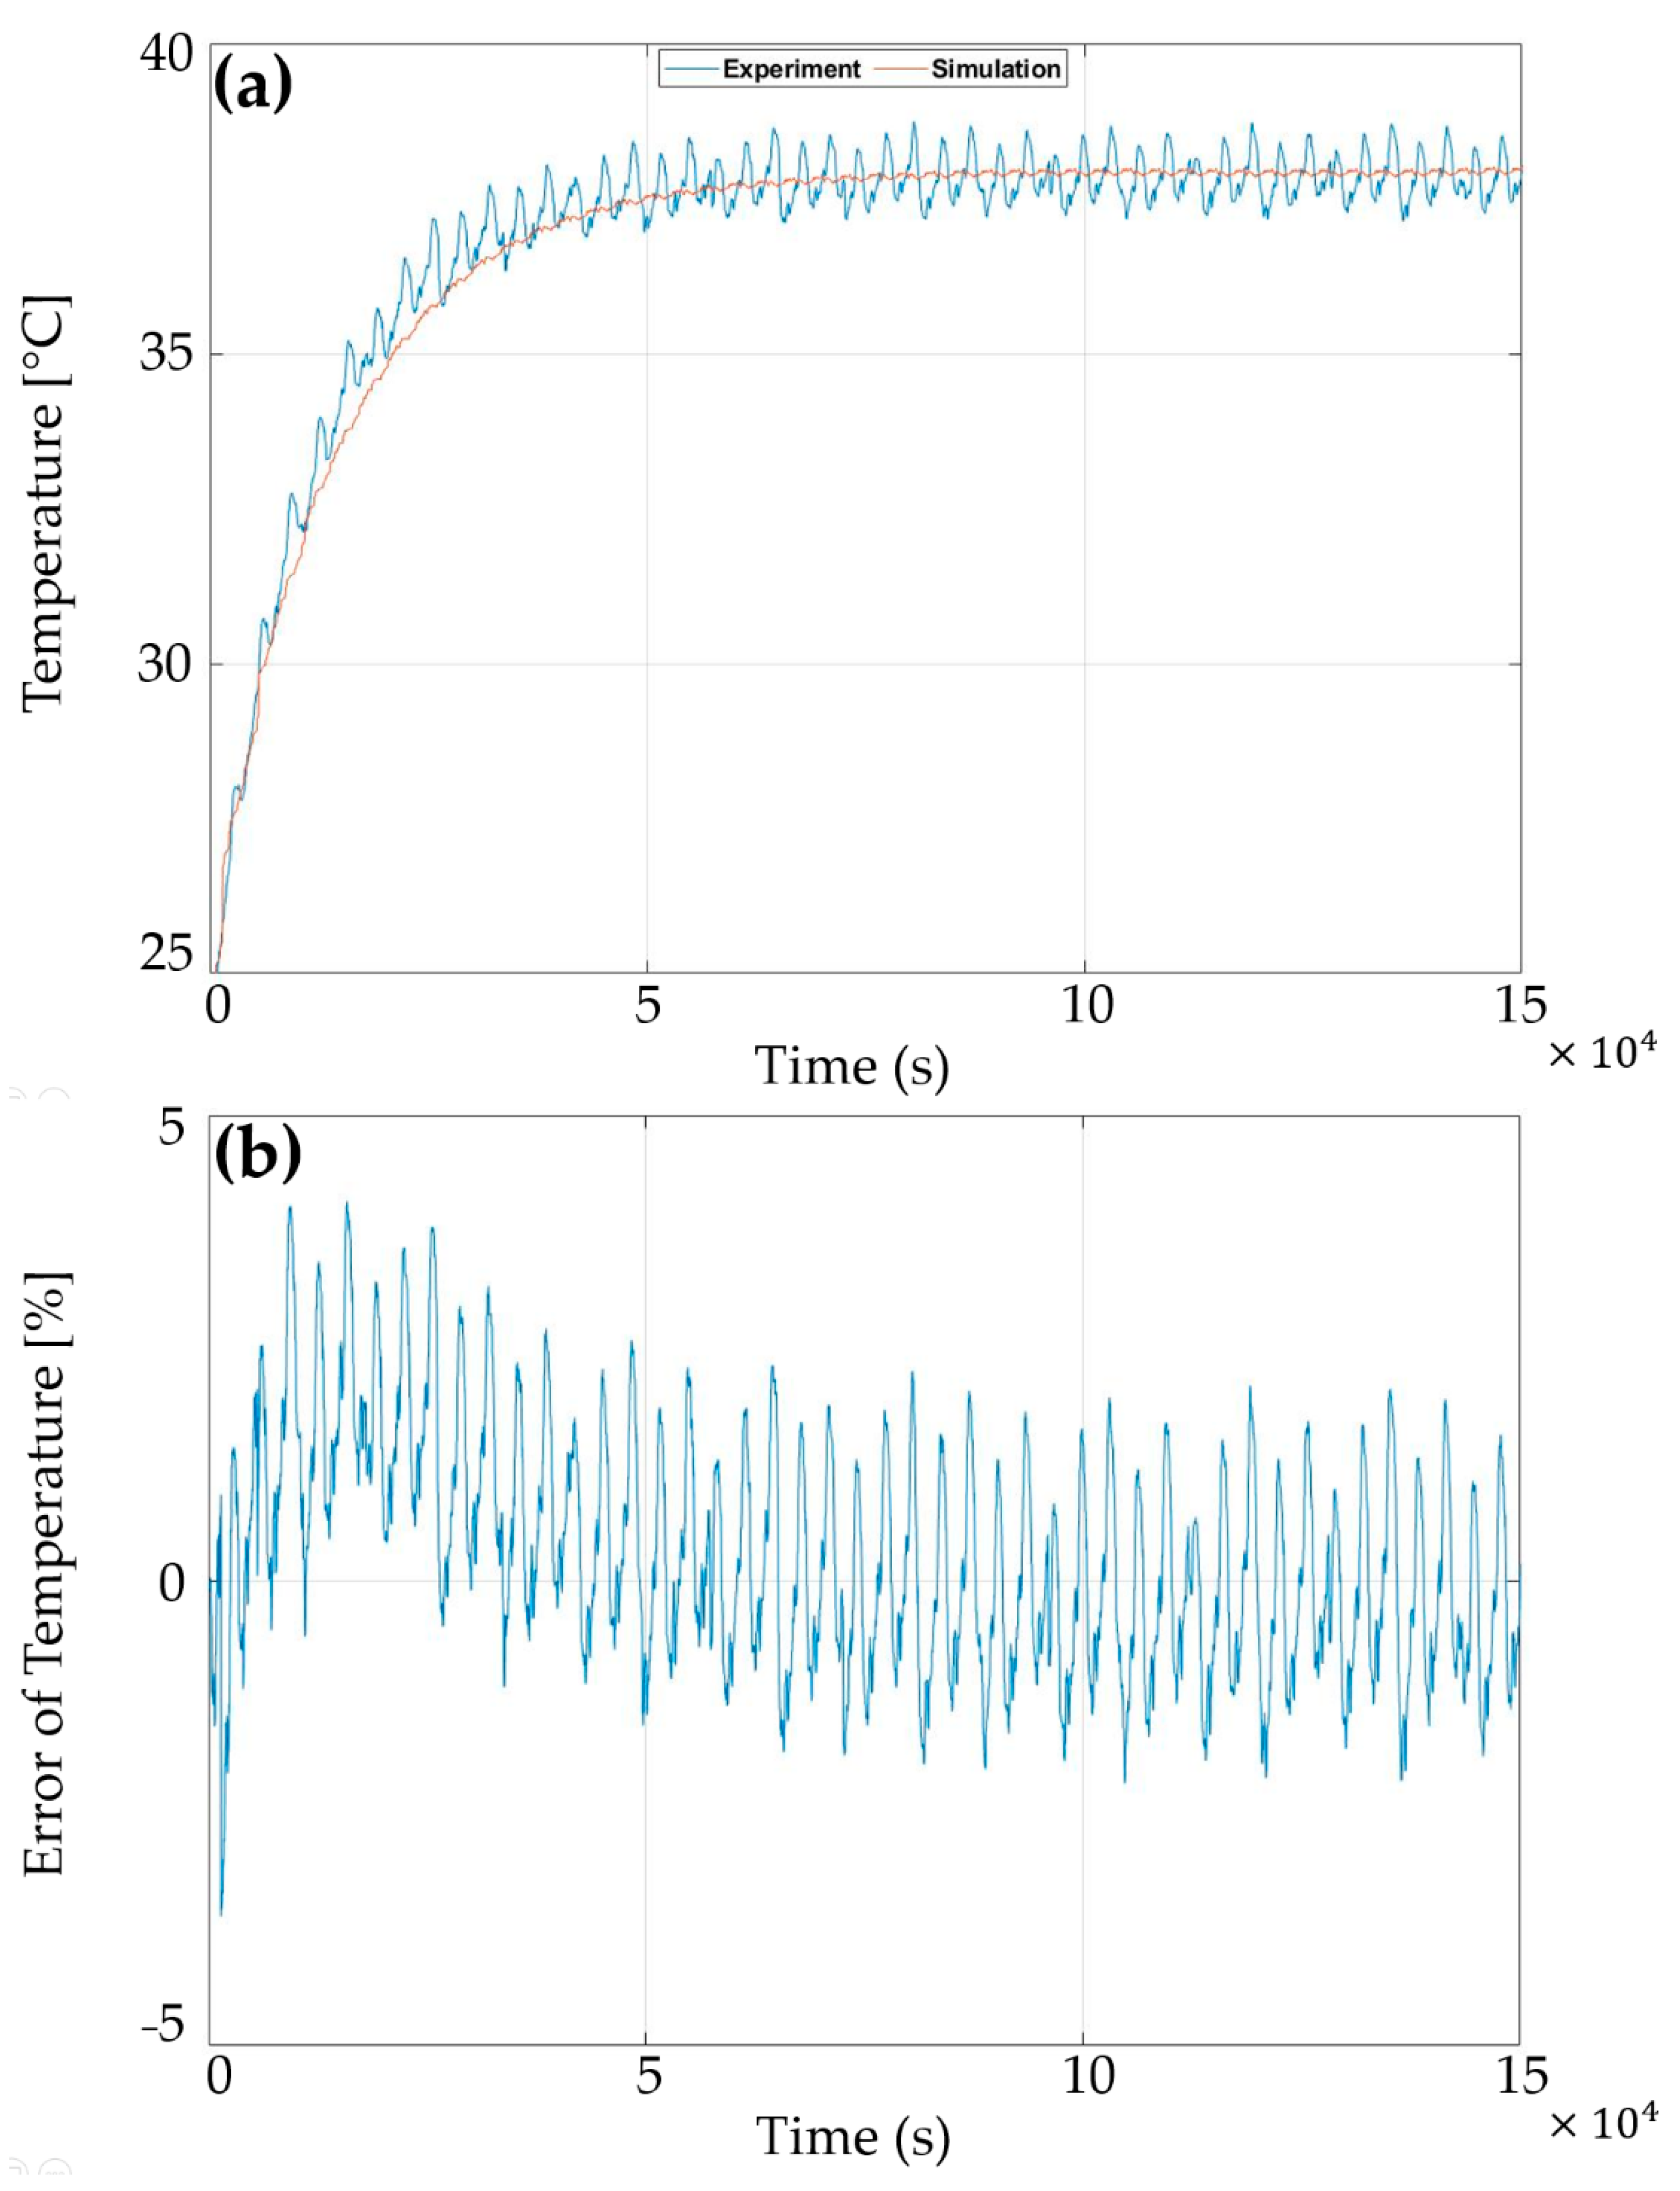
5.2. Results of the 1D Thermal Model
5.3. Results of the 3D CFD Model
6. Conclusions
Author Contributions
Funding
Institutional Review Board Statement
Informed Consent Statement
Data Availability Statement
Acknowledgments
Conflicts of Interest
References
- Soltani, M.; Beheshti, S.H. A comprehensive review of lithium ion capacitor: Development, modelling, thermal management and applications. J. Energy Storage 2020, 34, 102019. [Google Scholar] [CrossRef]
- Gandoman, F.H.; Behi, H.; Berecibar, M.; Jaguemont, J.; Aleem, S.H.A.; Behi, M.; Van Mierlo, J. Chapter 16—Reliability Evaluation of Li-ion Batteries for Electric Vehicles Applications from the Thermal Perspectives. In Uncertainties in Modern Power Systems; Zobaa, A.F., Abdel Aleem, S.H.E., Eds.; Academic Press: Cambridge, MA, USA, 2021; pp. 563–587. [Google Scholar] [CrossRef]
- Khaleghi, S.; Karimi, D.; Beheshti, S.H.; Hosen, M.S.; Behi, H.; Berecibar, M.; Van Mierlo, J. Online health diagnosis of lithium-ion batteries based on nonlinear autoregressive neural network. Appl. Energy. 2021, 282, 116159. [Google Scholar] [CrossRef]
- Soltani, M.; Ronsmans, J.; Kakihara, S.; Jaguemont, J.; Van den Bossche, P.; Van Mierlo, J.; Omar, N. Hybrid battery/lithium-ion capacitor energy storage system for a pure electric bus for an urban transportation application. Appl. Sci. 2018, 8, 1176. [Google Scholar] [CrossRef] [Green Version]
- Jaguemont, J.; Karimi, D.; Van Mierlo, J. Investigation of a passive thermal management system for lithium-ion capacitors. IEEE Trans. Veh. Technol. 2019, 68, 10518–10524. [Google Scholar] [CrossRef]
- Soltani, M.; Berckmans, G.; Jaguemont, J.; Ronsmans, J.; Kakihara, S.; Hegazy, O.; Van Mierlo, J.; Omar, N. Three dimensional thermal model development and validation for lithium-ion capacitor module including air-cooling system. Appl. Therm. Eng. 2019, 153, 264–274. [Google Scholar] [CrossRef]
- Karimi, D.; Khaleghi, S.; Behi, H.; Beheshti, H.; Hosen, M.S.; Akbarzadeh, M.; Van Mierlo, J.; Berecibar, M. Lithium-ion capacitor lifetime extension through an optimal thermal management system for smart grid applications. Energies 2021, 14, 2907. [Google Scholar] [CrossRef]
- Karimi, D.; Behi, H.; Jaguemont, J.; Berecibar, M.; Van Mierlo, J. A refrigerant-based thermal management system for a fast charging process for lithium-ion batteries. In International Conference on Renewable Energy Systems and Environmental Engineering; Global Publisher: Brussels, Belgium, 2020; pp. 1–6. [Google Scholar]
- Hosen, M.S.; Karimi, D.; Kalogiannis, T.; Pirooz, A.; Jaguemont, J.; Berecibar, M.; Van Mierlo, J. Electro-aging model development of nickel-manganese-cobalt lithium-ion technology validated with light and heavy-duty real-life pro fi les. J. Energy Storage 2020, 28, 101265. [Google Scholar] [CrossRef]
- Omar, N.; Daowd, M.; Hegazy, O.; Al Sakka, M.; Coosemans, T.; Van den Bossche, P.; Van Mierlo, J. Assessment of lithium-ion capacitor for using in battery electric vehicle and hybrid electric vehicle applications. Electrochim. Acta 2012, 86, 305–315. [Google Scholar] [CrossRef]
- Firouz, Y.; Omar, N.; Timmermans, J.M.; Van Den Bossche, P.; Van Mierlo, J. Lithium-ion capacitor–Characterization and development of new electrical model. Energy 2015, 83, 597–613. [Google Scholar] [CrossRef]
- Soltani, M.; De Sutter, L.; Ronsmans, J.; Van Mierlo, J. A high current electro-thermal model for lithium-ion capacitor technology in a wide temperature range. J. Energy Storage 2020, 31, 101624. [Google Scholar] [CrossRef]
- Behi, H.; Behi, M.; Karimi, D.; Jaguemont, J.; Ghanbarpour, M.; Behnia, M.; Berecibar, M.; Van Mierlo, J. Heat pipe air-cooled thermal management system for lithium-ion batteries: High power applications. Appl. Therm. Eng. 2020, 183, 116240. [Google Scholar] [CrossRef]
- Behi, H.; Karimi, D.; Jaguemont, J.; Gandoman, F.H.; Kalogiannis, T.; Berecibar, M.; Van Mierlo, J. Novel thermal management methods to improve the performance of the Li-ion batteries in high discharge current applications. Energy 2021, 224, 120165. [Google Scholar] [CrossRef]
- Karimi, D.; Hosen, M.S.; Behi, H.; Khaleghi, S.; Akbarzadeh, M.; Van Mierlo, J.; Berecibar, M. A hybrid thermal management system for high power lithium-ion capacitors combining heat pipe with phase change materials. Heliyon 2021, 7, e07773. [Google Scholar] [CrossRef] [PubMed]
- Karimi, D.; Behi, H.; Jaguemont, J.; Berecibar, M.; Van Mierlo, J. Optimized air-cooling thermal management system for high power lithium-ion capacitors. Energy Perspect 2020, 1, 93–105. [Google Scholar]
- Möller, S.; Karimi, D.; Vanegas, O.; El Baghdadi, M.; Kospach, A.; Lis, A.; Hegazy, O.; Abart, C.; Offenbach, Â.B.Â. Application Considerations for Double Sided Cooled Modules in Automotive Environment. 2020. Available online: https://ieeexplore.ieee.org/document/9097721 (accessed on 16 November 2020).
- Akbarzadeh, M.; Jaguemont, J.; Kalogiannis, T.; Karimi, D.; He, J.; Jin, L.; Xie, P.; Van Mierlo, J.; Berecibar, M. A novel liquid cooling plate concept for thermal management of lithium-ion batteries in electric vehicles. Energy Convers. Manag. 2021, 231, 113862. [Google Scholar] [CrossRef]
- Karimi, D.; Behi, H.; Hosen, M.S.; Jaguemont, J.; Berecibar, M.; Van Mierlo, J. A compact and optimized liquid-cooled thermal management system for high power lithium-ion capacitors. Appl. Therm. Eng. 2021, 185, 116449. [Google Scholar] [CrossRef]
- Behi, H.; Karimi, D.; Behi, M.; Jaguemont, J.; Ghanbarpour, M.; Behnia, M.; Berecibar, M.; Van Mierlo, J. Thermal management analysis using heat pipe in the high current discharging of lithium-ion battery in electric vehicles. J. Energy Storage 2020, 32, 101893. [Google Scholar] [CrossRef]
- Karimi, D.; Behi, H.; Jaguemont, J.; Berecibar, M.; Van Mierlo, J. Investigation of extruded heat sink assisted air cooling system for lithium-ion capacitor batteries. In International Conference on Renewable Energy Systems and Environmental Engineering; Global Publisher: Brussels, Belgium, 2020; pp. 1–6. [Google Scholar]
- Karimi, D.; Jaguemont, J.; Behi, H.; Berecibar, M.; Van Den Bossche, P.; Van Mierlo, J. Passive cooling based battery thermal management using phase change materials for electric vehicles. In EVS33 International Electric Vehicle Symposium; The Electric Drive Transportation Association: Washington, DC, USA, 2020; pp. 1–12. [Google Scholar]
- Behi, H. Experimental and Numerical Study on Heat Pipe Assisted PCM Storage System. 2015. Available online: https://www.diva-portal.org/smash/get/diva2:850104/FULLTEXT01.pdf (accessed on 13 September 2021).
- Behi, H.; Karimi, D.; Behi, M.; Ghanbarpour, M.; Jaguemont, J.; Sokkeh, M.A.; Gandoman, F.H.; Berecibar, M.; Van Mierlo, J. A new concept of thermal management system in Li-ion battery using air cooling and heat pipe for electric vehicles. Appl. Therm. Eng. 2020, 174, 115280. [Google Scholar] [CrossRef]
- Behi, H.; Karimi, D.; Jaguemont, J.; Gandoman, F.H.; Khaleghi, S.; Van Mierlo, J.; Berecibar, M. Aluminum heat sink assisted air-cooling thermal management system for high current applications in electric vehicles. In Proceedings of the 2020 AEIT International Conference of Electrical and Electronic Technologies for Automotive, AEIT Automot, Turin, Italy, 18–20 November 2020; Institute of Electrical and Electronics Engineers Inc.: Piscataway, NJ, USA, 2020. [Google Scholar] [CrossRef]
- Behi, H.; Karimi, D.; Jaguemont, J.; Berecibar, M.; Van Mierlo, J. Experimental study on cooling performance of flat heat pipe for lithium-ion battery at various inclination angels. Energy Perspect 2020, 1, 77–92. [Google Scholar]
- Behi, H.; Ghanbarpour, M.; Behi, M. Investigation of PCM-assisted heat pipe for electronic cooling. Appl. Therm. Eng. 2017, 127, 1132–1142. [Google Scholar] [CrossRef]
- Behi, M.; Mirmohammadi, S.A.; Ghanbarpour, M.; Behi, H.; Palm, B. Evaluation of a novel solar driven sorption cooling/heating system integrated with PCM storage compartment. Energy 2018, 164, 449–464. [Google Scholar] [CrossRef]
- Karimi, D.; Behi, H.; Jaguemont, J.; Sokkeh, M.A.; Kalogiannis, T.; Hosen, M.S.; Berecibar, M.; Van Mierlo, J. Thermal performance enhancement of phase change material using aluminum-mesh grid foil for lithium-capacitor modules. J. Energy Storage 2020, 30, 101508. [Google Scholar] [CrossRef]
- Pu, L.; Zhang, S.; Xu, L.; Ma, Z.; Wang, X. Numerical study on the performance of shell-and-tube thermal energy storage using multiple PCMs and gradient copper foam. Renew. Energy 2021, 174, 573–589. [Google Scholar] [CrossRef]
- Behi, M.; Shakorian-Poor, M.; Mirmohammadi, S.A.; Behi, H.; Rubio, J.I.; Nikkam, N.; Farzaneh-Gord, M.; Gan, Y.; Behnia, M. Experimental and numerical investigation on hydrothermal performance of nanofluids in micro-tubes. Energy 2020, 193, 116658. [Google Scholar] [CrossRef]
- Behi, H.; Karimi, D.; Gandoman, F.H.; Akbarzadeh, M.; Khaleghi, S.; Kalogiannis, T.; Hosen, M.S.; Jaguemont, J.; Van Mierlo, J.; Berecibar, M. PCM assisted heat pipe cooling system for the thermal management of an LTO cell for high-current profiles. Case Stud. Therm. Eng. 2021, 25, 100920. [Google Scholar] [CrossRef]
- Behi, H.; Karimi, D.; Youssef, R.; Suresh Patil, M.; Van Mierlo, J.; Berecibar, M. Comprehensive Passive Thermal Management Systems for Electric Vehicles. Energies 2021, 14, 3881. [Google Scholar] [CrossRef]
- Karimi, D.; Behi, H.; Jaguemont, J.; El Baghdadi, M.; Van Mierlo, J.; Hegazy, O. Thermal Concept Design of MOSFET Power Modules in Inverter Subsystems for Electric Vehicles. In Proceedings of the 2019 9th International Conference on Power and Energy Systems ICPES, Perth, Australia, 10–12 December 2019. [Google Scholar] [CrossRef]
- Kalbasi, R. Introducing a novel heat sink comprising PCM and air–Adapted to electronic device thermal management. Int. J. Heat Mass Transf. 2021, 169, 120914. [Google Scholar] [CrossRef]
- Zhang, C.; Allafi, W.; Dinh, Q.; Ascencio, P.; Marco, J. Online estimation of battery equivalent circuit model parameters and state of charge using decoupled least squares technique. Energy 2018, 142, 678–688. [Google Scholar] [CrossRef]
- Samba, A.; Omar, N.; Gualous, H.; Firouz, Y.; Van Den Bossche, P.; Van Mierlo, J.; Boubekeur, T.I. Development of an Advanced Two-Dimensional Thermal Model for Large size Lithium-ion Pouch Cells. Electrochim. Acta 2014, 117, 246–254. [Google Scholar] [CrossRef]
- Firouz, Y.; Omar, N.; Van Den Bossche, P.; Van Mierlo, J. Electro-thermal modeling of new prismatic lithium-ion capacitors. In Proceedings of the 2014 IEEE Vehicle Power and Propulsion Conference (VPPC), Coimbra, Portugal, 27–30 October 2014; Volume 2, pp. 1–6. [Google Scholar] [CrossRef]
- Sheikholeslami, M.; Ganji, D.D. Heat transfer enhancement in an air to water heat exchanger with discontinuous helical turbulators; experimental and numerical studies. Energy 2016, 116, 341–352. [Google Scholar] [CrossRef]
- Panchal, S.; Dincer, I.; Agelin-Chaab, M.; Fraser, R.; Fowler, M. Experimental and theoretical investigations of heat generation rates for a water cooled LiFePO4 battery. Int. J. Heat Mass Transf. 2016, 101, 1093–1102. [Google Scholar] [CrossRef]
- Dutil, Y.; Rousse, D.R.; Salah, N.B.; Lassue, S.; Zalewski, L. A review on phase-change materials: Mathematical modeling and simulations. Renew. Sustain. Energy Rev. 2011, 15, 112–130. [Google Scholar] [CrossRef]
- Farid, M.M.; Hamad, F.A.; Abu-Arabi, M. Melting and solidification in multi-dimensional geometry and presence of more than one interface. Energy Convers. Manag. 1998, 39, 809–818. [Google Scholar] [CrossRef]
- National Renewable Energy Laboratory (NREL). Battery Lifetime Analysis and Simulation Tool Suite 2014. Available online: https://www.nrel.gov/docs/fy15osti/63246.pdf (accessed on 1 December 2014).


| Parameters | Value | Unit |
|---|---|---|
| Rated Capacitance | 2300 | F |
| Voltage Range | 2.2 to 3.8 | V |
| Nominal Voltage | 3 | V |
| Weight | 0.355 | kg |
| Working Temperature | −30 to +70 | °C |
| Parameter | Value | Unit | |
|---|---|---|---|
| PCM | |||
| Material | Paraffin | / | |
| Latent heat of fusion | 236 | kJ/kg | |
| Melting temperature | 32–44 | °C | |
| Thermal conductivity | 0.2 | W/m·K | |
| HS | |||
| Material | Aluminum | / | |
| Dimension | 77 × 40 × 7 | mm | |
| Density | 2700 | Kg/m3 | |
| Specific heat | 963 | J/kg·K | |
| Thermal conductivity | 218 | W/m·K |
| NC | PCM | Hybrid PCM-HS | |
|---|---|---|---|
| Max. Temperature (°C) | 55.3 | 40.8 | 34.1 |
| Temperature reduction | - | 26.2% | 38.3% |
| Difference with ambient (°C) | 32.3 | 17.8 | 11.1 |
| Parameter | Electrode Domain | Positive Tab | Negative Tab | Units |
|---|---|---|---|---|
| Density | 1500 | 2700 | 8960 | Kg/m3 |
| Thermal conductivity | λlayer = 5; λplanar = 0.3; | 238 | 400 | W/m·K |
| Specific heat | 641 | 900 | 385 | J/kg·K |
Publisher’s Note: MDPI stays neutral with regard to jurisdictional claims in published maps and institutional affiliations. |
© 2021 by the authors. Licensee MDPI, Basel, Switzerland. This article is an open access article distributed under the terms and conditions of the Creative Commons Attribution (CC BY) license (https://creativecommons.org/licenses/by/4.0/).
Share and Cite
Karimi, D.; Behi, H.; Akbarzadeh, M.; Mierlo, J.V.; Berecibar, M. Holistic 1D Electro-Thermal Model Coupled to 3D Thermal Model for Hybrid Passive Cooling System Analysis in Electric Vehicles. Energies 2021, 14, 5924. https://doi.org/10.3390/en14185924
Karimi D, Behi H, Akbarzadeh M, Mierlo JV, Berecibar M. Holistic 1D Electro-Thermal Model Coupled to 3D Thermal Model for Hybrid Passive Cooling System Analysis in Electric Vehicles. Energies. 2021; 14(18):5924. https://doi.org/10.3390/en14185924
Chicago/Turabian StyleKarimi, Danial, Hamidreza Behi, Mohsen Akbarzadeh, Joeri Van Mierlo, and Maitane Berecibar. 2021. "Holistic 1D Electro-Thermal Model Coupled to 3D Thermal Model for Hybrid Passive Cooling System Analysis in Electric Vehicles" Energies 14, no. 18: 5924. https://doi.org/10.3390/en14185924
APA StyleKarimi, D., Behi, H., Akbarzadeh, M., Mierlo, J. V., & Berecibar, M. (2021). Holistic 1D Electro-Thermal Model Coupled to 3D Thermal Model for Hybrid Passive Cooling System Analysis in Electric Vehicles. Energies, 14(18), 5924. https://doi.org/10.3390/en14185924