Abstract
Deterministic forecasting models have been used through the years to provide accurate predictive outputs in order to efficiently integrate wind power into power systems. However, such models do not provide information on the uncertainty of the prediction. Probabilistic models have been developed in order to present a wider image of a predictive outcome. This paper proposes the lower upper bound estimation (LUBE) method to directly construct the lower and upper bound of prediction intervals (PIs) via training an artificial neural network (ANN) with two outputs. To evaluate the PIs, the minimization of a coverage width criterion (CWC) cost function is proposed. A particle swarm optimization (PSO) algorithm along with a mutation operator is further implemented, in order to optimize the weights and biases of the neurons of the ANN. Furthermore, wavelet transform (WT) is adopted to decompose the input wind power data, in order to simplify the pre-processing of the data and improve the accuracy of the predictive results. The accuracy of the proposed model is researched from a seasonal perspective of the data. The application of the model on the publicly available data of the 2014 Global Energy Forecasting Competition shows that the proposed WT-LUBE-PSO-CWC forecasting technique outperforms the state-of-the-art methodology in important evaluation metrics.
1. Introduction
In regard to dealing with global climate change as well as the increasing global energy needs, turning to renewable energy alternatives has been the focus of researchers in recent years. Wind power represents one of the most important renewable resources for wind power generation thanks to its widely distributed nature [1]. On the other hand, the need to efficiently exploit wind power in order to replace conventional energy power generation in power systems has created various operation and planning problems, due to the wind’s stochastic nature and intermittence [1].
Thanks to technological advances, neural networks (NNs) have been introduced and have been excessively used in order to develop accurate wind power forecasting models able to estimate and control wind power generation. Forecasting models are not only able to predict wind power values, but also help in the organization of electricity markets as well as the stabilization of power systems [2]. Throughout the years, NNs have been used as deterministic forecasting models in order to generate point forecasts and provide the user with an estimated wind power output series, which is as accurate as possible. However, such models fail to provide information on the uncertainty of a prediction. Consequently, due to the increasing penetration of wind power into power systems, deterministic models cannot always be efficiently used for real-life problems as well as decision-making tasks.
In order to overcome the limitations of deterministic forecasting models in uncertainty estimation, over the last years, wind power probabilistic forecasting (WPPF) models have been the main focus of researchers. Such models provide a wider view of the predictive outcome of a forecast in the form of prediction intervals (PIs), quantiles, distributions or scenarios and thus offer more rich predictive information to the user [3].
The most common probabilistic forecasting models consider a parametric approach, where the predictive density follows a specific pre-defined distribution shape. However, such an assumption of a specific distribution shape is not always reasonable for real-life problems and as a result the parametric approach is not ideal to cope with decision-making problems.
Various non-parametric methods have been proposed to construct PIs based on NN technology. The work [4] introduced a direct quantile regression-based methodology to generate predictive quantiles without statistical inference or pre-assumption of error distribution. The proposed model efficiently used the extreme learning machine along with the quantile regression for the probabilistic forecasting process. In [5], feed-forward neural networks (FFNNs)-based models were used for the wind power forecasting process and a moving block bootstrap was used for the quantification of the uncertainty of the forecasts. The work [6] proposed a convolutional neural network (CNN)-based hybrid model along with the wavelet transform (WT) methodology. WT was used on the wind power data time-series in order to decompose them to their components for different frequencies and afterwards, the new data were used in a back-propagation CNN to provide the forecasts. In [7], a wavelet-based NN was proposed for PI construction. The proposed methodology was further optimized via an evolving knowledge-based multi-objective artificial bee colony algorithm that was used to improve the NN’s parameters. In [8], a linear NN with tapped delay model was proposed for the execution of the wind power forecasting process at multiple steps. WT was further adapted to the proposed model for the pre-processing of the raw wind power input data.
In [9], a lower upper bound estimation (LUBE) methodology was introduced to efficiently construct PIs. The main advantage of the LUBE method is that it uses a FFNN with two outputs that can directly construct the PI. Each of those outputs represents the lower and upper bound of a PI. As a result, the whole PI construction process is faster and simpler. Moreover, the LUBE methodology avoids the use of pre-defined distributions of the data.
The predictive results of different forecasting methodologies can be further improved via using optimization algorithms appropriately modified to be used for WPPF. The particle swarm optimization (PSO) is a powerful optimization algorithm, which is used for the optimization of the synaptic weights of NNs. In [10], an enhanced PSO algorithm was used in order to determine the weight coefficients of an adaptive network-based fuzzy inference system methodology that was used for the forecasting process. The implementation of a mutation operator could further improve the searching capabilities of the PSO and aid it to not be trapped in local optima. The work [11] proposed a convolutional NN-based model for the wind power forecasting process, in order to exploit its deep-feature extraction potential. The proposed model was further improved by implementing a PSO algorithm that was used to optimize different wind power segments of the wind power sequence.
This article focuses on: (1) the construction of accurate PIs via developing an efficient wind power probabilistic forecasting model, and (2) the analysis of the results from a seasonal perspective. The LUBE methodology is proposed for efficient PI construction. In order to further optimize the LUBE method’s accuracy, a PSO algorithm is implemented for the optimization of the NN parameters. Aiming to simplify the data pre-processing process of the proposed LUBE-PSO model, the WT is adopted to decompose the original raw data. The evaluation of the proposed model is based on the minimization of the coverage width criterion (CWC) cost function that allows the concurrent optimization of both the calibration and the sharpness of the constructed PIs. The results of the proposed WT-LUBE-PSO-CWC model are studied via a seasonal analysis of the provided datasets.
The main contributions of this paper are the following:
- A LUBE-based methodology is adopted for accurate PI construction due to its ability to directly create PIs from the outputs of a FFNN. The PSO algorithm along with a mutation operator is implemented in the model in order to optimize the weights and biases of the NNs used. In order to simplify the pre-processing of the wind power data as well as to improve the prediction accuracy of the model, WT is implemented in the provided dataset. By combining the advantages of WT, LUBE and PSO methods, the proposed WT-LUBE-PSO-CWC model: a) provides PIs of high quality and accuracy, and b) decreases the number of predictive errors when compared to state-of-the-art methodology.
- The Yam-Chow initialization method is proposed in this work in order to efficiently initialize the weights of the FFNN used for the training process. The use of Yam-Chow initialization algorithm into the proposed model manages to improve the training speed of the FFNN by decreasing the initial NN’s error via preventing it to be trapped in using the initial weights. A contribution of this paper is that the Yam-Chow initialization method is further modified to fit the proposed LUBE methodology.
- A k-fold cross validation is implemented in order to further improve the model’s accuracy. The aim of the k-fold cross validation is twofold. It is initially applied to the proposed model in order to determine the optimal NN structure and in five-fold cross validation is further implemented to define the optimal number of the particles of the swarm for the PSO algorithm.
- The accuracy of the proposed model is tested using publicly available wind power forecasting data from the 2014 Global Energy Forecasting Competition [12]. Moreover, the results of the proposed method are compared with the results of another method applied on exactly the same data.
- The analysis of the results using different metrics shows that the proposed method is able to efficiently construct accurate PIs. The forecasting accuracy of the proposed method is further verified by seasonality analysis.
2. Methodology
2.1. Lower Upper Bound Estimation Method
One of the most common problems encountered in methodologies for PI construction from NN predictions is the assumption of the data distribution. While such assumptions of the forecasting errors may simplify the PI construction process, they create other problems concerning the possible deviation of the data from the pre-assumed distribution. As a result, such methodologies are not optimal to cope with real-world applications and they usually suffer from high computational costs.
The main advantage of the LUBE methodology is the simplification of PI construction. LUBE method uses a FFNN to estimate the lower and upper bounds of a PI. The FFNN has two point-forecast outputs that represent the lower and upper bounds of the PI. A schematic diagram of the LUBE method is shown in Figure 1.
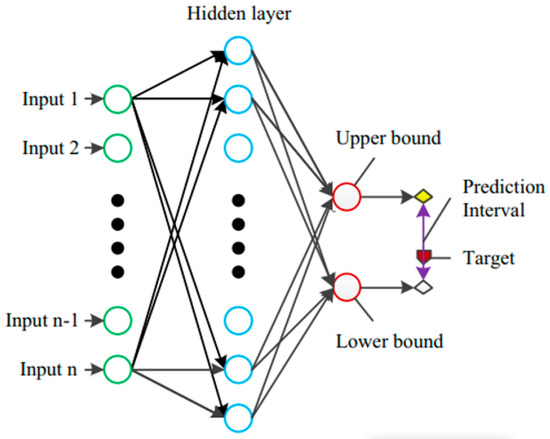
Figure 1.
Representation of an NN used in the LUBE methodology for the lower and upper bound construction.
The evaluation of the constructed PI is a result of the estimation of its calibration and its sharpness [13]. The following metrics are commonly used to compute the calibration and sharpness of the PI.
PI coverage probability (PICP) is the measure related to the quality of the constructed PIs. It represents the percentage of observations (yt) found between the upper bounds (Ut) and lower bounds (Lt) of all observations. The larger the PICP, the more targets are supposed to be found in the corresponding PI. The PICP is computed by:
where N is the total number of samples and ct is defined as:
To maximize the reliability of the PI, the PICP should be as close as possible to the nominal confidence level. It should be noted that for the PICP to be valid, it has to be greater than or equal to the predetermined level of confidence, which is the prediction interval nominal confidence (PINC). The closer the PICP is to the PINC, the more reliable is the PI.
Another metric used in order to estimate the width of a PI is the prediction interval normalized average width (PINAW). Since excessive PIs may cause difficulty in the predictive estimations and thus in decision-making problems, metrics such as PINAW play a vital role to improve the reliability of a PI. PINAW is defined by:
where R is the range of the underlying targets that are used for normalizing the PIs.
Since, during the training process, the bounds of the PIs are not yet constructed, a new indirect training method is proposed in order to concurrently consider the calibration and sharpness aspects of the PIs. As a result, the training process is performed by using a PI-based cost function called coverage width criterion (CWC), which is defined by:
where μ is the confidence level for PIs, and η is a penalty coefficient used when PICP is smaller than μ in order to increase the difference between PICP and μ. Furthermore, γ(PICP, μ) is defined as:
A similar metric to the PINAW that is used for the width evaluation of a PI is the prediction interval normalized root-mean-square width (PINRW):
As its name indicates, PINRW presents the root-mean-square width of a PI, in contrast to PINAW which presents the normalized average width of the PI. Moreover, while PINAW gives equal weights to the widths of a PI, PINRW enlarges wider PIs [14]. As a result, the use of PINRW is preferred in this work over the PINAW. The CWC cost function takes the following form:
During the training process, it is possible that during an iteration, the width of the PIs could be equal to zero, where PINAW = PINRW = 0. According to (7), this would result in CWC = 0. Since the aim is to minimize the cost function, the NN could falsely consider CWC = 0 as an optimal value, while in reality, PICP would be much smaller than the nominal confidence level. To deal with this problem, (7) is modified to:
which is the final cost function used for the training process of the NN in this work.
Another metric used in order to measure the quality of the prediction is the continuous ranked probability score (CRPS), which was introduced in [15]. CRPS is used to compare the predictions with the estimated cumulative distribution function [16] and is computed as:
where ntest is the number of input data, y are the real wind values, yt are the predicted values, is the estimated cumulative distribution function and is an indicator function which is equal to 1 when y > yt and 0 when y < yt.
2.2. Wavelet Transform
Wavelet transform is used to simplify a wind power series and analyze it to its component series. The process aims to decompose the original signal and extract vital characteristics at different decomposition levels [17]. One of the main advantages of the wavelet analysis is its ability to reveal aspects of data that are missed by other signal analysis techniques. As a result, wavelet analysis enables the detection of problems in the data (that conventional techniques fail to notice), such as missing data, discontinuities or false data. The filtering abilities of the wavelet transform offer wind power data series with better overall behavior and thus give the possibility of more accurate predictions [18]. Wind power time-series contain components of different frequencies, where the contributions of the low-frequency and high-frequency components tend to have different dynamic importance to the model’s behavior. Another major advantage of the wavelet analysis is its ability to efficiently deal with non-stationary time series problems, such as wind power data [19].
WTs can be divided in two categories: continuous wavelet transform (CWT) and discrete wavelet transform (DWT). The CWT is presented by:
where f(x) is the signal, (x) is the mother wavelet, scale parameter a controls the spread of the wavelet and translation parameter b determines the central position of the wavelet.
The DWT is presented by:
where f(t) is the signal, T is the length of the signal, t is the discrete time index and the scale parameter a and translation parameter b derive from the integer variables n and m from:
and
The m and n integer variables control the wavelet’s dilation and translation, respectively, and are contained in the set of all integers, positive and negative [20].
A DWT algorithm based on the four filters [21] is considered in this work. Multiresolution, based on Mallat’s algorithm, is proposed to obtain “approximations” and “details” from the signal being analyzed. While the approximation follows the shape of the original signal, the details describe components of the signal from higher frequencies. The decomposition process is presented in Figure 2.
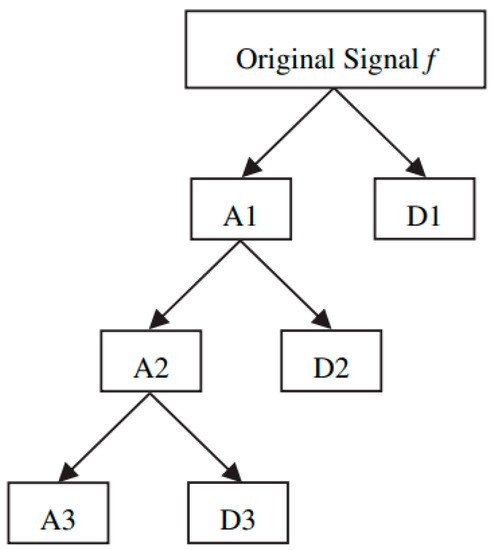
Figure 2.
Wavelet transform decomposition process of the original signal.
A wavelet function of type Daubechies of order 4 (abbreviated as Db4), which is used as the mother wavelet, along with three decomposition levels, is considered in this paper. The proposed methodology uses the approximation A3 and the details D3, D2 and D1 as inputs.
2.3. Particle Swarm Optimization
Particle swarm optimization is a meta-heuristic optimization approach, which belongs to the field of swarm intelligence. It was proposed and introduced as an evolutionary computational method to deal with the optimization of continuous and discontinuous function decision-making problems [22]. Being part of the field of swarm intelligence, PSO considers a search environment where every possible solution is represented as a particle in a swarm. In every problem, each particle flies into the solution space, proposing a potential solution, at each iteration, to the problem being optimized.
The movement of every particle in the solution space is defined as follows: a random position is assigned to each particle that corresponds to a potential solution for the given iteration of the optimization problem. Each particle is defined by a velocity vector, its current position and its best position in the solution space. A fitness function is then used to evaluate the position of each particle in each iteration, representing how close the position to an optimal solution is.
Each particle memorizes its best location throughout the iterations as pbest, and its best value obtained considering the whole swarm is memorized as gbest. The equations used to update the velocity and position of each particle in each iteration are the following:
and
where vn and xn represent the velocity and location of the n-th particle at iteration G; r1, r2 are random variables; c1, c2 are acceleration constants; and w is the inertia weight that is represented by:
where wmax and wmin define the initial and final inertia weight and their values are chosen as 1.2 and 0.2, respectively, and Gmax is the maximum number of iterations. Inertia weight is an important factor in the convergence of the particles of a swarm.
A representation of the particle movement in PSO and the vector representation of each article is shown in Figure 3.
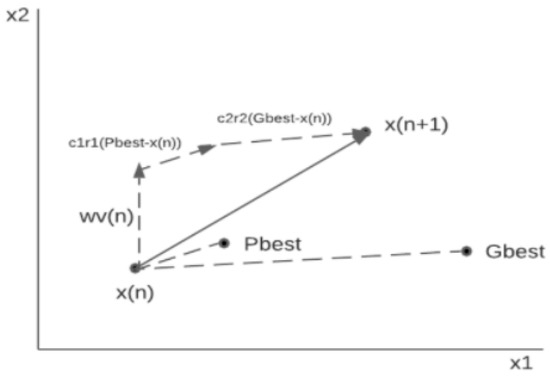
Figure 3.
Vector representation and movement representation of the particles of a swarm in PSO.
2.4. WT-LUBE-PSO Model
This paper proposes the LUBE method for the construction of PIs. A k-fold cross validation method is used in order to determine the optimal NN structure for the proposed model. Feed-forward NNs are used and the number of neurons of the hidden layers is changed from 1 to 20 with a step of 1 neuron. The k-fold cross validation is used on the training set in order to separate it from the test set. The k-fold method divides the training set into k complementary folds, where the k − 1 folds are used for the training process of the NNs and the rest of the folds are used for the validation process [23]. A 5-fold cross validation is proposed in this work.
The PSO algorithm is further used in order to optimize the weights and biases of the neural network. Apart from the definition of the optimal NN structure, a 5-fold cross validation is further implemented to define the optimal number of the particles of the swarm for the PSO algorithm.
The wavelet transformation is implemented in the wind power data in order to further simplify the wind power data series and facilitate the data preprocessing. The provided wind power time-series are decomposed through a Db4 wavelet function in order to be analyzed to their approximation and detail coefficients. Τhe approximation A3 and the details D3, D2 and D1 produced from the decomposition process are used as inputs for the proposed NN model. Consequently, the accuracy of the whole model is improved overall.
The minimization of the CWC cost function is the optimization criterion of the proposed model since it allows the concurrent optimization of both the calibration and the sharpness of the constructed PIs.
3. Case Study
3.1. Data
The dataset used in this work is the one used in the tracks of the Global Energy Forecasting Competition 2014 (GEFCom2014) [12]. It contains hourly data collected from 10 wind farms in Australia, consisting of wind observations from two different altitudes, 10 m and 100 m above ground. For each of the ten cases, the data provided consist of the zonal and meridional wind components (u10, v10, u100, v100) as well as the values of the produced wind power normalized by each farm’s nominal capacity. In this paper, the data from the wind farms of Zone 1 and Zone 7 are used. The wind speed (ws) and wind direction (wd) are computed by:
and
The correlation between wind speed and wind direction with their zonal and meridional wind components is presented in Figure 4.
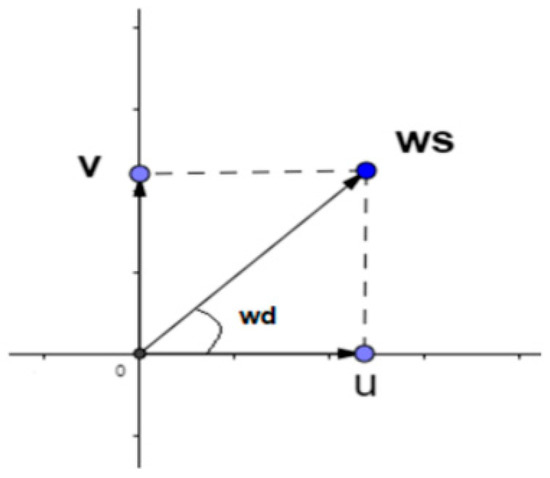
Figure 4.
Correlation between wind speed and wind direction with their zonal and meridional components.
This work is focused on researching the seasonality of the given datasets, as well as the accuracy of the proposed model in every season. As a result, the datasets used for the training and evaluation of the models contain hourly information from 1 June 2012 to 31 May 2013 for each of the wind farms. The wind power data from the training dataset are normalized to [0, 1], while the wind speed and wind direction data are normalized to [−1, 1]. The dataset of each zone is further divided into four seasons in order to make the seasonal analysis possible:
- Summer 2012: 2208 hourly sets of data
- Autumn 2012: 2184 hourly sets of data
- Winter 2012–2013: 2160 hourly sets of data
- Spring 2013: 2208 hourly sets of data
3.2. Methodology of Case Study
A flow chart of the proposed PSO-based LUBE methodology is shown in Figure 5.
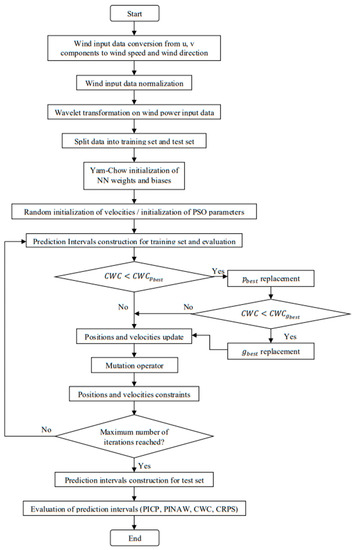
Figure 5.
Flow chart of the proposed WT-LUBE-PSO-CWC methodology.
More specifically, for each one of the two zones researched, the dataset is randomly split into a training set and a test set. Of the data, 75% are used for the training process and the remaining 25% used for testing. The training set is split into sub-training sets and validation sets via the five-fold cross validation method. The five-fold cross validation is further implemented into the PSO algorithm to estimate the optimal number of particles.
A wavelet function of type Daubechies of order 4 is implemented to analyze the wind power data for each component in order to simplify the preprocessing of the wind power database.
The initialization process deals with NN and PSO parameter initialization. An optimal initialization of the NN weights leads to better and more accurate results for the forecasting model. The Yam-Chow initialization method is adopted in this work in order to execute the weight initialization of the FFNN used for the training process. The Yam-Chow initialization algorithm was introduced in [24], in order to improve the training speed of the FFNN. The aim of this method is to decrease the initial NN error by preventing the NN from becoming stuck with the initial weights. The outputs of the hidden layers remain in the active region where the derivative of the activation function gives large values. The optimal values of the weights from the last hidden layer are evaluated by a least-squares method. A flow chart of the Yam-Chow initialization process is presented in Figure 6.
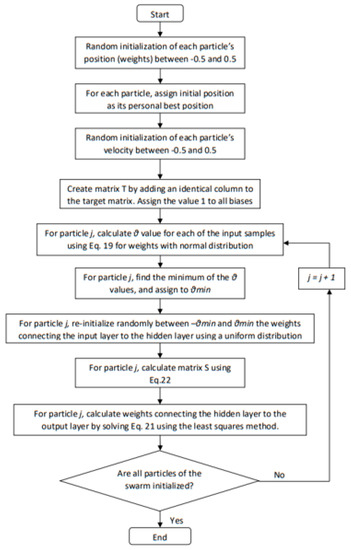
Figure 6.
Flow chart of the Yam-Chow initialization process.
The magnitude of the weights for a pattern p is defined by:
where is the magnitude of weights, Q is the output of layer l and nl is a large number. In order to confirm that the hidden neurons’ outputs remain in the active region, the following value is used:
The initialization process is the following: θl is evaluated by applying (19) and (20), by using the input layers for l = 1. Afterwards, the weights are initialized randomly with a uniform distribution between −θ1 and θ1 or with a normal distribution N. Then, is evaluated by feedforwarding the input patterns through the network with the initialized weights. Afterwards, for l = 1, 2, …, L − 2, θl is evaluated by applying (19) and (20) using the output of layer l. The weights are again initialized randomly with a uniform distribution between −θ1 and θ1 or with a normal distribution N. Then, is evaluated by feedforwarding the outputs of through the network with the initialized weights. When the or is found, the last layer of weights is calculated by a least-squares method and derives from:
where S is a matrix with entries:
where Ki,j are the entries of the target matrix D.
However, due to the fact that the LUBE-based methodology used in this work has two outputs in order to construct the PI bounds, the Yam-Chow initialization methodology is appropriately modified in order for the matrix D to have two output columns instead of one.
As mentioned in Section 2, the velocity and position updates are two core procedures of the PSO algorithm. Through Equations (14) and (15), the velocity and position of the particles of the swarm are updated.
Moreover, a mutation operator is implemented for the PSO. Mutation operators intend to add variability into a population by creating variation in a present individual and as a result decrease the possibility of the population being trapped into local optima [25]. As a result, by implementing a mutation operator into PSO, the proposed methodology manages to further enhance the algorithm’s performance by improving its global search capacity. The Gaussian mutation operator is applied to the particles via:
where xid is the particle position dimension and σ is set to 0.1 times the range of the particle dimension.
The mutation rate linearly decreases during the optimization process in order to provide more search space to the algorithm before the convergence of the particles.
When the update of the weights is complete, the new PIs are constructed via the LUBE methodology, followed by the estimation of PICP, PINRW and the calculation of the CWC cost function. In order to update the pbest and gbest values, the CWC cost function criterion is used. For each particle, when the new CWC value is smaller than the already existing CWC value of pbest, then the pbest for this particle is replaced by the new weights. As for the gbest, if the new value of CWC of the pbest is smaller than the one of the gbest, then the gbest is updated.
The training process is concluded when the maximum number of iterations is reached. The evaluation of the above-presented model is measured by the evaluation metrics of PICP, PINAW, CWC and CRPS. The whole process is repeated five times, in order to be able to statistically analyze the performance of the forecasting model.
A flow chart presenting the whole model’s process is presented in Figure 7.
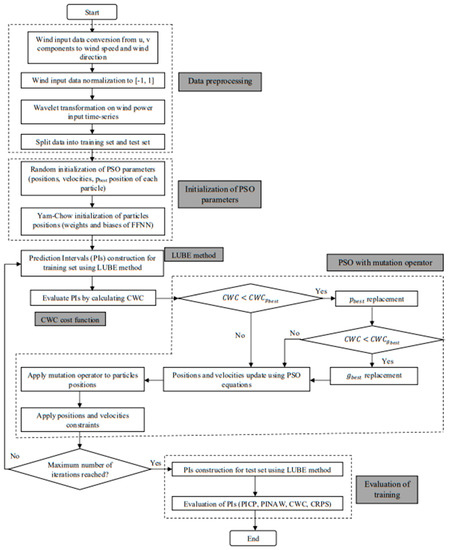
Figure 7.
Complete flow chart of the proposed WT-LUBE-PSO-CWC methodology.
4. Results
Table 1 shows the optimal values of the model’s hyperparameters after fine-tuning while Table 2 shows the optimal BELM model’s hyperparameters.

Table 1.
Optimal values of the proposed model’s hyperparameters.

Table 2.
Optimal values of the BELM’s hyperparameters.
Figure 8 shows the convergence speed of the proposed LUBE-PSO-CWC with and without the Yam-Chow initialization technique. The dataset used to generate the results of Figure 8 is that of the autumn 2012 data of zone 7. With Yam-Chow initialization, the convergence rate is higher and more constant throughout the iterations even though the convergence speed is smaller compared to random initialization. This means that with the Yam-Chow initialization, fewer iterations are needed for the weights and biases to converge to their global optimal values.
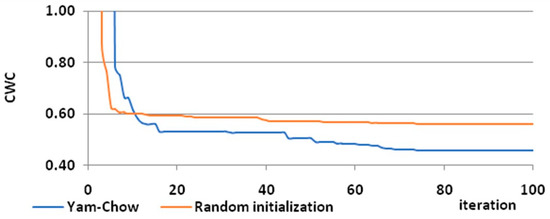
Figure 8.
Convergence speed for the proposed model with and without the Yam-Chow initialization.
Table 3, Table 4, Table 5 and Table 6 present the results of the evaluation of five different training sessions, for each season of zone 1, of the proposed WT-LUBE-PSO-CWC in comparison with the bootstrap extreme learning machine (BELM) [26] for a confidence level of 0.9. The chosen evaluation indices are PICP, PINAW, CWC and CRPS. For each evaluation index, the median value of the five different training sessions is calculated, while the best median values are indicated with bold. Similarly, Table 7, Table 8, Table 9 and Table 10 compare the results of the proposed WT-LUBE-PSO-CWC with the results of BELM, for data corresponding to zone 7.

Table 3.
Results of the evaluation of 5 training sessions of WT-LUBE-PSO-CWC and BELM models in zone 1 for summer 2012 at the 0.9 confidence level.

Table 4.
Results of the evaluation of 5 training sessions of WT-LUBE-PSO-CWC and BELM models in zone 1 for autumn 2012 at the 0.9 confidence level.

Table 5.
Results of the evaluation of 5 training sessions of WT-LUBE-PSO-CWC and BELM models in zone 1 for winter 2012/2013 at the 0.9 confidence level.

Table 6.
Results of the evaluation of 5 training sessions of WT-LUBE-PSO-CWC and BELM models in zone 1 for spring 2013 at the 0.9 confidence level.

Table 7.
Results of the evaluation of 5 training sessions of WT-LUBE-PSO-CWC and BELM models in zone 7 for summer 2012 at the 0.9 confidence level.

Table 8.
Results of the evaluation of 5 training sessions of WT-LUBE-PSO-CWC and BELM models in zone 7 for autumn 2012 at the 0.9 confidence level.

Table 9.
Results of the evaluation of 5 training sessions of WT-LUBE-PSO-CWC and BELM models in zone 7 for winter 2012/2013 at the 0.9 confidence level.

Table 10.
Results of the evaluation of 5 training sessions of WT-LUBE-PSO-CWC and BELM models in zone 7 for spring 2013 at the 0.9 confidence level.
Table 3, Table 4, Table 5, Table 6, Table 7, Table 8, Table 9 and Table 10 show that the proposed WT-LUBE-PSO-CWC outperforms BELM in both PICP and CWC. Specifically, the proposed WT-LUBE-PSO-CWC achieves a higher median PICP in all cases, and a lower median CWC in seven out of eight cases. BELM achieves a slightly better median CWC only for the spring 2013 dataset of zone 1. This means that the generated PIs by WT-LUBE-PSO-CWC have a bigger coverage rate, even though they have a smaller range on average. The proposed model also has a more stable response, since in every run of each case, PICP is equal to or higher than the nominal confidence level. On the other hand, the coverage probability of the PIs generated by BELM cannot reach the nominal confidence level in several runs, resulting in a much higher CWC value. Furthermore, in terms of the CRPS error metric, the proposed model outperformed the BELM model significantly in seven out of eight cases.
In order to further prove the superiority of the proposed model, comparative results between the proposed WT-LUBE-PSO-CWC model and BELM are presented in Table 11 and Table 12 for a confidence level of 0.85 and 0.95, respectively. Due to space limitations, the median values for five training sessions of PICP, CWC and CRPS for each model are presented for every season from summer 2012 to spring 2013. It can be derived that in 14 out of 16 cases, the proposed WT-LUBE-PSO-CWC achieves a higher median PICP, while only in 2 out of 16 cases BELM has a slightly better median PICP. The median PICP values of the proposed model remain equal or higher than the nominal confidence level in all cases. Concerning the median CWC values, the proposed model outperforms the BELM model in all cases. In terms of CRPS, the proposed model outperformed the BELM model in 13 out of 16 cases. More specifically, for the dataset of Zone 1, the proposed model outperformed the BELM model for both the 0.85 and 0.95 confidence level. For the dataset of Zone 7, the BELM model gave slightly better results for autumn for both confidence levels, which is probably a result of the quality of the data compared to the dataset of Zone 1.

Table 11.
Results of the evaluation of WT-LUBE-PSO-CWC and BELM models in zone 1 and zone 7 for summer 2012 to spring 2013 at the 0.85 confidence level.

Table 12.
Results of the evaluation of WT-LUBE-PSO-CWC and BELM models in zone 1 and zone 7 for summer 2012 to spring 2013 at the 0.95 confidence level.
Figure 9 and Figure 10 show the PIs generated by the WT-LUBE-PSO-CWC and the BELM methods, respectively, for the autumn 2012 dataset of zone 7. In each figure, the upper chart shows the PIs for the first 48 predictions of the test set (first two days), and the lower chart shows the predicted PIs for the whole test set (546 samples, i.e., 23 days). The red spots in Figure 9 and Figure 10 refer to the spot forecasts in each case, while the blue lines in the upper charts indicate the PIs’ width. The quality of the PIs generated by WT-LUBE-PSO-CWC is generally higher than the quality of the PIs generated by BELM. For the rest of the seasons researched, the conclusions drawn for the PIs are generally similar for the two methods compared; however, due to space limitations, only one season is presented.
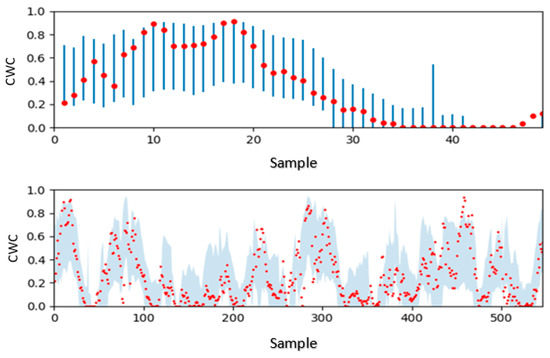
Figure 9.
PIs generated by WT-LUBE-PSO-CWC for the autumn 2012 dataset of zone 7.
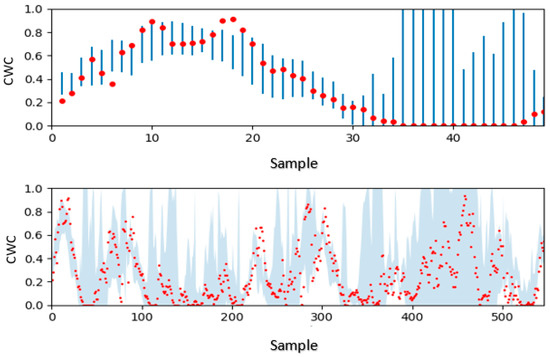
Figure 10.
PIs generated by BELM for the autumn 2012 dataset of zone 7.
In Table 13, an overall comparison between BELM and the proposed WT-LUBE-PSO-CWC model is made for every case of each zone concerning the 0.9 confidence level. The average values of CWC, PICP and the model’s run time are obtained by the corresponding median values of the eight cases shown in Table 3, Table 4, Table 5, Table 6, Table 7, Table 8, Table 9 and Table 10. The average CWC of WT-LUBE-PSO-CWC is 0.487056, which is 5.05% less than the average CWC of BELM. The average PICP of WT-LUBE-PSO-CWC is 0.929234, which is 2.29% more than the average PICP of BELM. The conclusion is that both coverage rate (CWC) and average PI range (PICP) are improved with the proposed WT-LUBE-PSO-CWC model. As expected, however, BELM is faster, since its core consists of extreme learning machines.

Table 13.
Overall comparison of WT-LUBE-PSO-CWC and BELM models for every case of each zone.
In order to achieve a more reliable evaluation of the performance of WT-LUBE-PSO-CWC and BELM, the two models are trained and evaluated again, this time with year-long datasets, containing information from 1 June 2012 to 31 May 2013 for both zones 1 and 7. Thus, the dataset of each zone consists of 8760 hourly sets of data. Again, the training sets consist of 75% of the initial datasets and the remaining 25% correspond to the test sets. The results are shown in Table 14. The median values of PICP, CWC and CRPS for each zone are obtained after five implementations of the training and the evaluation process. In order to show the effect of wavelet transformation, the results are also obtained for LUBE-PSO-CWC without the wavelet transform. Thus, the input data of LUBE-PSO-CWC without wavelet consist only of the original input data of the GEFCom 2014. Again, WT-LUBE-PSO-CWC outperforms BELM in both coverage rate and average PI range, in both zones. Additionally, it can be seen from Table 14 that the application of wavelet transformation improves the obtained results of LUBE-PSO-CWC, in both PICP and CWC.

Table 14.
Results of the WT-LUBE-PSO-CWC, LUBE-PSO-CWC and BELM models for zone 1 and zone 7 for the year-long dataset.
In Table 14, the results of the combined BELM and WT-LUBE-PSO-CWC methods are also presented. Combined PIs can improve forecasts in both accuracy and calibration [27]. The PIs generated by both BELM and WT-LUBE-PSO-CWC are characterized by a low level of overconfidence. Furthermore, the correlation between the two models is small. Thus, the best methods to combine PIs are the average method, the median method and the exterior trimming method [28]. Since there are only two methodologies involved, the average (Avg) method is chosen. Combined PIs do not seem to improve the overall performance of the forecasts. Although the results of the combined method are better than those of BELM, the WT-LUBE-PSO-CWC method still has the best performance. However, if more methods were combined and a more complex combination method was used, the results could probably be improved.
In order to present the accuracy of the results from a seasonal point of view, Figure 11 shows the average value of the median CWC between the proposed WT-LUBE-PSO-CWC and BELM models for each season in zone 1 and 7. For both zones, the worst performance is obtained in summer. The average values per season of the values shown in Figure 11 are presented in Table 15. Again, the highest average CWC is observed in summer. This is expected, since in summer the average wind speed is usually lower than during the rest of the year, resulting in a bigger fluctuation in wind power output, or no power output at all, for longer periods of time. On the other hand, the best results are obtained in spring and autumn. Consequently, in the summer a greater error rate of the wind power forecasts should be expected, while the smallest error rates should be expected in spring and autumn.
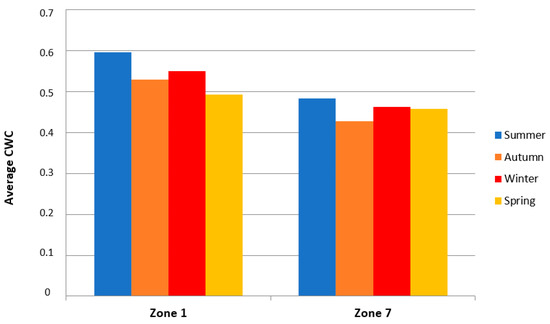
Figure 11.
Average value of the median CWC between WT-LUBE-PSO-CWC and BELM for each season in zone 1 and 7.

Table 15.
Average CWC and standard deviation of CWC per season between both models obtained from both zones.
Table 15 presents the standard deviation of the values of CWC shown in Figure 11. The biggest standard deviation of CWC is obtained in summer, while the lowest standard deviation of CWC is obtained in spring. This means that when using spring data, WT-LUBE-PSO-CWC and BELM have a more stable response, independent from the geographical location of the wind farm. On the other hand, when using summer data, the models have a more unstable response, which means that the quality of the results has a much bigger dependence on the geographical location of the wind farm.
It can be further observed from Figure 11 that there is a slight difference in the median CWC between spring and autumn in Zone 1 and Zone 7. Considering that each data zone concerns wind farms in different locations, the difference in the median CWC could be a result of the different quality of data during those specific seasons. As a result, for Zone 1 the spring data are of better quality than the autumn data, while for Zone 7 the autumn data provide better results. Furthermore, the technical characteristics of the wind farms located in each zone could also play a significant role in the observed difference in the median CWC between spring and autumn in Zone 1 and Zone 7.
Table 16 presents the average number of observations below the lower limit and above the upper limit of the PIs. For the BELM method, the average number of observations above the upper prediction limit is significantly higher than the observations below the lower prediction limit, for almost every test case. This is even more evident for the WT-LUBE-PSO-CWC method. This is probably related to the fact that more target values of the datasets lie near 0 instead of 1, since the output of a wind farm is rarely close to its nominal level. The fact that for the WT-LUBE-PSO-CWC method the observations below the lower prediction limit are less compared to those for the BELM method proves that the WT-LUBE-PSO-CWC method is more accurate. The only test cases where the average number of observations below the lower prediction limit is higher than the average number of observations above the upper prediction limit are those related to the summer datasets. Due to space limitations, only the observations exceeding the PI limits for a confidence level of 0.9 are presented, since the results for confidence levels of 0.85 and 0.95 were relatively similar to those presented in Table 16.

Table 16.
Average number of observations below the lower limit and above the upper limit of the PIs for 0.9 confidence level.
It is concluded that the proposed WT-LUBE-PSO-CWC model with the proposed Gaussian mutation operator overall achieves better results than the state-of-the-art BELM methodology. Its PIs have on average a bigger coverage rate, while maintaining a smaller average range. These results are observed for both seasonal datasets and year-long datasets, for both zone 1 and zone 7. Additionally, WT-LUBE-PSO-CWC has a much more stable response than BELM, since its coverage rate is equal to or higher than the nominal confidence level in all cases. Initializing the weights and biases of LUBE-PSO-CWC with the Yam-Chow technique leads to a higher convergence rate, while using the wavelet transformation further improves the results of the model in both PICP and CWC. In summer, the generated PIs are of the lowest quality, both in terms of CWC and stability. On the other hand, the best results are obtained in autumn and spring. In spring, not only is the best average CWC obtained, but also the standard deviation of the results is the lowest, resulting in high stability.
5. Discussion and Future Research
A LUBE method was proposed in this paper for the PI construction and was further developed and extended. A wavelet transformation methodology was applied to the wind power data of the publicly available GEFCom2014 database, in order to analyze the wind power series down to its components and simplify the preprocessing procedure. In order to evaluate the constructed PIs, the PINRW evaluation index was proposed over PINAW, since PINRW enlarges wider PIs, while PINAW gives equal weights to the widths of a PI. The CWC cost function was developed and further modified in order to research the case study as a single objective optimization problem. A PSO algorithm along with a mutation operator was implemented in order to further optimize the WT-LUBE methodology. The proposed WT-LUBE-PSO-CWC model was finally used to minimize the cost function and provide optimal PIs.
Datasets from two zones of the provided data were used in this paper in order to evaluate the proposed model’s accuracy. The seasonality of zone 1 and zone 7 of the provided data was researched. A five-fold cross validation method was used to define the optimal NN structure as well as to estimate the optimal number of the particles of the PSO. Furthermore, being a LUBE-based model, the proposed methodology successfully allowed for an easier and faster PI construction.
Compared to the state-of-the-art BELM model, the proposed methodology managed to efficiently construct higher-quality PIs, by achieving higher PICP as well as narrower PINAW evaluation metrics. Moreover, the Yam-Chow initialization technique further improved the training speed of the FFNNs, since fewer iterations are needed for the weights and biases to converge to their global optimal values.
Aiming to further improve and develop the efficiency and the accuracy of the proposed methodology, various possible directions exist.
5.1. Multi-Objective Methodology
The work presented in this paper focuses on minimizing the CWC cost function and thus on optimizing a single objective problem. In the future, in order to further highlight the efficiency of the proposed model in real-life problems, the focus should be to develop a multi-objective optimization methodology based on the proposed WT-LUBE-PSO-CWC model. Focusing on evaluating multi-objective optimization problems from different research fields, and adapting them to deal with wind power forecasting problems, could be a possible extension of the proposed methodology.
5.2. Spatio-Temporal Correlation
Recent works aim to highlight the importance of the spatio-temporal correlation between different wind farms’ datasets in order to provide more efficient wind power forecasting models. Instead of limiting the input datasets to one wind farm, exploiting different historical or meteorological data from different wind farms could increase the amount of data and consequently improve the accuracy of the proposed model. Developing the proposed method from a spatio-temporal viewpoint and comparing it with novel spatio-temporal-based methodologies, i.e., the calibrated regime-switching method [29], could be a significant extension of our proposed model.
5.3. Data Tests
The proposed methodology relied on the use of the dataset’s wind components and the generated normalized wind power values. Further use of meteorological data or the use of a greater amount of historical data could further improve the accuracy of the proposed model as well as further improve its computational cost. Furthermore, adapting the proposed work to more complex data could further improve its accuracy, as well as its adaptability to different situations.
6. Conclusions
In the proposed work, a LUBE method was adopted in order to efficiently provide accurate PIs of wind power predictions. The PSO algorithm was proposed for the optimization process, while the wavelet transform was adopted to perform the preprocessing of the input data.
Compared to the state-of-the-art BELM method, the results of the proposed work are encouraging. The proposed WT-LUBE-PSO-CWC model successfully managed to surpass the BELM model in the majority of the comparisons presented in Section 4. The main advantage of the proposed model is its architecture. Considering the fact that it is a model based on NN technology, it offers a lot of possibilities in its use. By successfully modifying input data for different problems, the proposed model could efficiently adapt to real-life forecasting problems. Thanks to its NN-based technology, the proposed work is not limited by the technical parameters of wind farms. Moreover, its adaptation in a seasonal context showed that the seasonal results follow a specific pattern. This could further allow adapting the forecasting model according to the forecasting season of interest in order to optimize the forecasting results from a seasonal perspective. The proposed combination of different methodologies, not only for the forecasting process, but also for the preprocessing and the optimization processes, offers high development potential that is not limited to only wind power forecasting.
Author Contributions
Conceptualization, I.K.B., M.A.K.-K. and P.S.G.; methodology, I.K.B. and P.S.G.; software, I.K.B., M.A.K.-K. and T.K.; validation, I.K.B., M.A.K.-K. and T.K.; formal analysis, I.K.B. and M.A.K.-K.; investigation, I.K.B. and M.A.K.-K.; resources, P.S.G.; data curation, T.K.; writing—original draft preparation, I.K.B.; writing—review and editing, P.S.G.; visualization, I.K.B. and P.S.G.; supervision, P.S.G.; project administration, P.S.G.; funding acquisition, P.S.G. All authors have read and agreed to the published version of the manuscript.
Funding
This research was co-financed by the European Union and Greek national funds through the Operational Program Competitiveness, Entrepreneurship and Innovation, under the call RESEARCH—CREATE—INNOVATE (project code: T1EDK-00450).
Data Availability Statement
The proposed work used the publicly available wind power forecasting data from the 2014 Global Energy Forecasting Competition.
Conflicts of Interest
The authors declare no conflict of interest.
References
- Georgilakis, P. Technical challenges associated with the integration of wind power into power systems. Renew. Sustain. Energy Rev. 2008, 12, 852–863. [Google Scholar] [CrossRef] [Green Version]
- Tsikalakis, A.; Katsigiannis, Y.; Georgilakis, P.; Hatziargyriou, N. Impact of wind power forecasting error bias on the economic operation of autonomous power systems. Wind Energy 2009, 12, 315–331. [Google Scholar] [CrossRef] [Green Version]
- Bazionis, I.; Georgilakis, P. Review of deterministic and probabilistic wind power forecasting: Models, methods and future research. Electricity 2021, 2, 2. [Google Scholar] [CrossRef]
- Wan, C.; Lin, J.; Wang, J.; Song, Y.; Dong, Z.Y. Direct Quantile Regression for Nonparametric Probabilistic Forecasting of Wind Power Generation. IEEE Trans. Power Syst. 2017, 32, 2767–2778. [Google Scholar] [CrossRef]
- Khosravi, A.; Nahavandi, S.; Creighton, D. Prediction Intervals for Short-Term Wind Farm Power Generation Forecasts. IEEE Trans. Sustain. Energy 2013, 4, 602–610. [Google Scholar] [CrossRef]
- Wang, H.; Li, G.; Wang, G.; Peng, J.; Jiang, H.; Liu, Y. Deep learning based ensemble approach for probabilistic wind power forecasting. Appl. Energy 2017, 188, 56–70. [Google Scholar] [CrossRef]
- Shen, Y.; Wang, X.; Chen, J. Wind power forecasting using multi-objective evolutionary algorithms for wavelet neural network-optimized prediction intervals. Appl. Sci. 2018, 8, 185. [Google Scholar] [CrossRef] [Green Version]
- Sahora, S.; Aggarwal, S.K. Wind power forecasting using wavelet transforms and neural networks with tapped delay. CSEE J. Power Energy Syst. 2018, 4, 197–209. [Google Scholar]
- Khosravi, A.; Nahavandi, S.; Creighton, D.; Atiya, A. Lower upper bound estimation method for construction of neural network-based prediction intervals. IEEE Trans. Neural Netw. 2011, 22, 337–346. [Google Scholar] [CrossRef]
- Chang, W. Short-term wind power forecasting using the enhanced particle swarm optimization based hybrid method. Energies 2013, 6, 4879–4896. [Google Scholar] [CrossRef] [Green Version]
- Yang, X.; Zhang, Y.; Yang, Y.; Lv, W. Deterministic and probabilistic wind power forecasting based on bi-level convolutional neural network and particle swarm optimization. Appl. Sci. 2019, 9, 1794. [Google Scholar] [CrossRef] [Green Version]
- Hong, T.; Pinson, P.; Fan, S.; Zareipour, H.; Troccoli, A.; Hyndman, R.J. Probabilistic energy forecasting: Global energy forecasting competition and beyond. Int. J. Forecast. 2016, 32, 896–913. [Google Scholar] [CrossRef] [Green Version]
- Wu, Y.K.; Su, P.E.; Wu, T.Y.; Hong, J.S.; Hassan, M.Y. Probabilistic Wind Power Forecasting Using Weather Ensemble Models. In Proceedings of the 2018 IEEE/IAS 54th I&CPS, Niagara Falls, ON, Canada, 7–10 May 2018. [Google Scholar]
- Quan, H.; Srinivasan, D.; Khosravi, A. Particle swarm optimization for construction of neural network-based prediction intervals. Neurocomputing 2014, 127, 172–180. [Google Scholar] [CrossRef]
- Ding, Y. Data Science for Wind Energy; Chapman & Hall/CRC Press: Boca Raton, FL, USA, 2019. [Google Scholar]
- Gneiting, T.; Raftery, A.E. Strictly proper scoring rules, prediction, and estimation. J. Am. Stat. Assoc. 2007, 102, 359–378. [Google Scholar] [CrossRef]
- Li, L.; Chang, Y.; Tseng, M.; Liu, J.; Lim, M. Wind power prediction using a novel model on wavelet decomposition-support vector machines-improved atomic search algorithm. J. Clean. Prod. 2020, 270, 121817. [Google Scholar] [CrossRef]
- Catalao, J.; Pousinho, H.; Mendes, V. Short-term wind power forecasting in Portugal by neural networks and wavelet transform. Renew. Energy 2011, 36, 1245–1251. [Google Scholar] [CrossRef]
- Liu, Y.; Guan, L.; Hou, C.; Han, H.; Liu, Z.; Sun, Y.; Zheng, M. Wind power short-term prediction based on LSTM and discrete wavelet transform. Appl. Sci. 2019, 9, 1108. [Google Scholar] [CrossRef] [Green Version]
- Addison, P. The Illustrated Wavelet Transform Handbook, 1st ed.; Taylor & Francis: Boca Raton, FL, USA, 2002. [Google Scholar]
- Mallat, S. A theory for multiresolution signal decomposition-the wavelet representation. IEEE Trans. Pattern. Anal. Mach. Intell. 1989, 11, 674–693. [Google Scholar] [CrossRef] [Green Version]
- Kennedy, J.; Eberhart, R. Particle swarm optimization. In Proceedings of the IEEE International Conference on Neural Networks, Perth, WA, Australia, 27 November–1 December 1995. [Google Scholar]
- Wright, J.; Manic, M. Neural network architecture selection analysis with application to cryptography location. In Proceedings of the 2010 IJCNN, Barcelona, Spain, 18–23 July 2010. [Google Scholar]
- Yam, J.; Chow, T. A weight initialization method for improving training speed in feedforward neural network. Neurocomputing 2000, 30, 219–232. [Google Scholar] [CrossRef]
- Andrews, P. An investigation into mutation operators for particle swarm optimization. In Proceedings of the IEEE Congress on Evolutionary Computation, Vancouver, BC, Canada, 16–21 July 2006. [Google Scholar]
- Wan, C.; Xu, Z.; Pinson, P.; Dong, Z.; Wong, K. Probabilistic forecasting of wind power generation using extreme learning machine. IEEE Trans. Power Syst. 2014, 29, 1033–1044. [Google Scholar] [CrossRef] [Green Version]
- Grushka-Cockayne, Y.; Richmond, R.; Jose, V. Combining prediction intervals in the M4 competition. Int. J. Forecast. 2020, 36, 178–185. [Google Scholar] [CrossRef]
- Gaba, A.; Tsetlin, I.; Winkler, R.L. Combining Interval Forecasts. Decis. Anal. 2017, 14, 1–20. [Google Scholar] [CrossRef]
- Ezzat, A.; Jun, M.; Ding, Y. Spatio-temporal short-term forecast: A calibrated regime-switching method. Ann. Appl. Stat. 2019, 13, 1484–1510. [Google Scholar] [CrossRef] [PubMed]
Publisher’s Note: MDPI stays neutral with regard to jurisdictional claims in published maps and institutional affiliations. |
© 2021 by the authors. Licensee MDPI, Basel, Switzerland. This article is an open access article distributed under the terms and conditions of the Creative Commons Attribution (CC BY) license (https://creativecommons.org/licenses/by/4.0/).