Article

Energy Curtailment Scheduling MILP Formulation for an Islanded Microgrid with High Penetration of Renewable Energy

1
Graduate School of Energy Convergence, Gwangju Institute of Science and Technology, Gwangju 61005, Korea
2
Hawaii Natural Energy Institute, Honolulu, HI 96822, USA
*
Author to whom correspondence should be addressed.
Energies 2021, 14(19), 6038; https://doi.org/10.3390/en14196038
Submission received: 17 August 2021 / Revised: 12 September 2021 / Accepted: 17 September 2021 / Published: 23 September 2021

Abstract

:
The efficiency of photovoltaic (PV) cells has improved significantly in the last decade, making PV generation a common feature of the sustainable microgrid. As the PV-powered microgrid reaches high penetrations of intermittent PV power, optimum scheduling of over-production is necessary to minimize energy curtailment. Failure to include an accurate assessment of curtailed energy costs in the scheduling process increases wasted energy. Moreover, applying an objective function without considering the cost coefficients results in an inefficient concentration of curtailed power in a specific time interval. In this study, we provide an optimization method for scheduling the microgrid assets to evenly distribute curtailment over the entire daily period of PV generation. Each of the curtailment intervals established in our optimization model features the application of different cost coefficients. In the final step, curtailment costs are added to the objective function. The proposed cost minimization algorithm preferentially selects intervals with low curtailment costs to prevent the curtailment from being concentrated at a specific time. By inducing even distribution of curtailment, this novel optimization methodology has the potential to improve the cost-effectiveness of the PV-powered microgrid

1. Introduction

While non-hydro renewable energy for electricity generation globally has steadily increased since 1965, renewable energy capacity has experienced rapid growth in the last two decades [1]. According to the International Energy Agency (IEA), renewable energy capacity added in 2020 alone increased by 45% to 280 gigawatts (GW), the biggest year-over-year growth [2].
This drastic recent increase in intermittent wind and solar renewable energy resources or distributed energy resources (DERs) often results in overproduction during peak production periods that result in a curtailment of generation. Such curtailment of DERs has increased dramatically since 2014 [3]. Grid system imbalances are exacerbated by misalignment of widely variable DER generation during shifts in daily demand, particularly in systems with extremely high renewable energy penetration rates [4].
Microgrids (MGs) in islanded and remote locations have been utilized as a means to improve grid stability into power systems with high penetrations of DERs [5]. The environment of an islanded MG is significantly different from that of a large-scale power grid driven by a competitive power market. An islanded MG typically has limited generation sources in an isolated grid that does not permit export of oversupplied generation through a generation or grid-tie to other grids. In this environment, the MG needs a new generation scheduling formulation that is capable of taking into consideration curtailment of DERs.
Previous research has been conducted to cope with uncertainty in power generation and supply during MG islanded operation, for example, in [6] and [7]. Additionally, to stabilize the frequency of MG operation under the unscheduled islanded mode in [8], frequency-aware constraints were added to provide a stable dispatch plan for the microgrid-independent operation. Research to date, however, has largely neglected consideration of DER curtailment in an islanded MG [6,7,8].
In [9], a methodology has been proposed to coordinate the operations scheduling of battery energy storage system s (BESS) and thermal generators based on photovoltaic (PV) DER generation forecasts.
The PV power is curtailed based on a simple rule, which is to curtail PV power if the available PV power is larger than the sum of the scheduled BESS charging power. In [10], the PV curtailment was considered in the algorithm; however, the algorithm is focused on the selecting of prosumers to be curtailed. To achieve the power balance of PV generation, a curtailment was obtained as an optimal power flow of a multi-purpose function in [11]. However, it approached the scheduling problem using sequential quadratic programming (SQP), rather than in terms of the mixed-integer linear programming (MILP), which is the scope of this study.
In [12], demand response management was considered to minimize wind energy curtailment. Robust scheduling considering the uncertainty in high renewables penetration condition was proposed and in [13] and [14], and the impact of wind profiles on thermal units scheduling was investigated. However, the renewable energy curtailment was not directly incorporated into the formulation. In [15,16,17], the robust optimal scheduling of microgrid with islanding constraints was proposed. The authors considered the uncertainty of DERs and reflected spinning reserve cost into the objective functions. However, the DER curtailment was not considered in the problem formulation.
In [18], renewable energy curtailment would have to have occurred for several time zones to avoid baseload generators turning off. In [19,20], the uncertainty of renewable energy power prediction is quantified using a method based on Rényi entropy. The entropy of PV power generation recorded a high value in the daytime, which indicates high uncertainty of forecast at a certain time zone, and error varies by different time zone in [20]. However, the previous works did not consider a method to distribute the renewable energy curtailment among the multiple time slots evenly, as shown in Figure 1a for responding to the different uncertainty of each time slot. Considering an islanded microgrid environment, it has only a few types of generations and does not operate based on the power market (e.g., peak shave or load shift). Hence, renewable energy curtailment could be concentrated in a single or several time slots, as shown in Figure 1b, since there is no physical cost difference between distribution and concentration of energy curtailment with respect to time slots.
Considering the curtailment cost proportional to the amount of curtailed energy could cause inefficiency in islanded microgrids, as shown in Figure 1b [18]. Furthermore, since the uncertainty of DER output power is dependent on each time interval [11], the curtailment should be distributed among different time slots, considering the uncertainty risk diversification.
To overcome the disadvantages of the previously researched DER curtailment method, in this paper, a graded PV curtailment scheduling is newly formulated and incorporated into islanded MG optimal generation scheduling. To verify the effectiveness of the proposed formulation, a real MG test site within the HOST Park of the Natural Energy Laboratory of Hawaii Authority (NELHA), Hawaii, is considered as the target MG. Hawaii’s plentiful natural resources result in photovoltaic systems generating excessive electricity during the day. Therefore, it is necessary to curtail the output of excessively generated solar power to stabilize the system. With the capacity of PV and BESS planned for installation, PV curtailment is inevitable during islanded mode operation.
The rest of this paper is organized as follows. Section 2 presents the problem formulation for an MG that needs optimal scheduling. Section 3 illustrates the proposed PV curtailment problem formulation, including a newly proposed PV curtailment gradation cost. Section 4 shows the simulation results, and Section 5 outlines the conclusion.

2. Problem Formulation

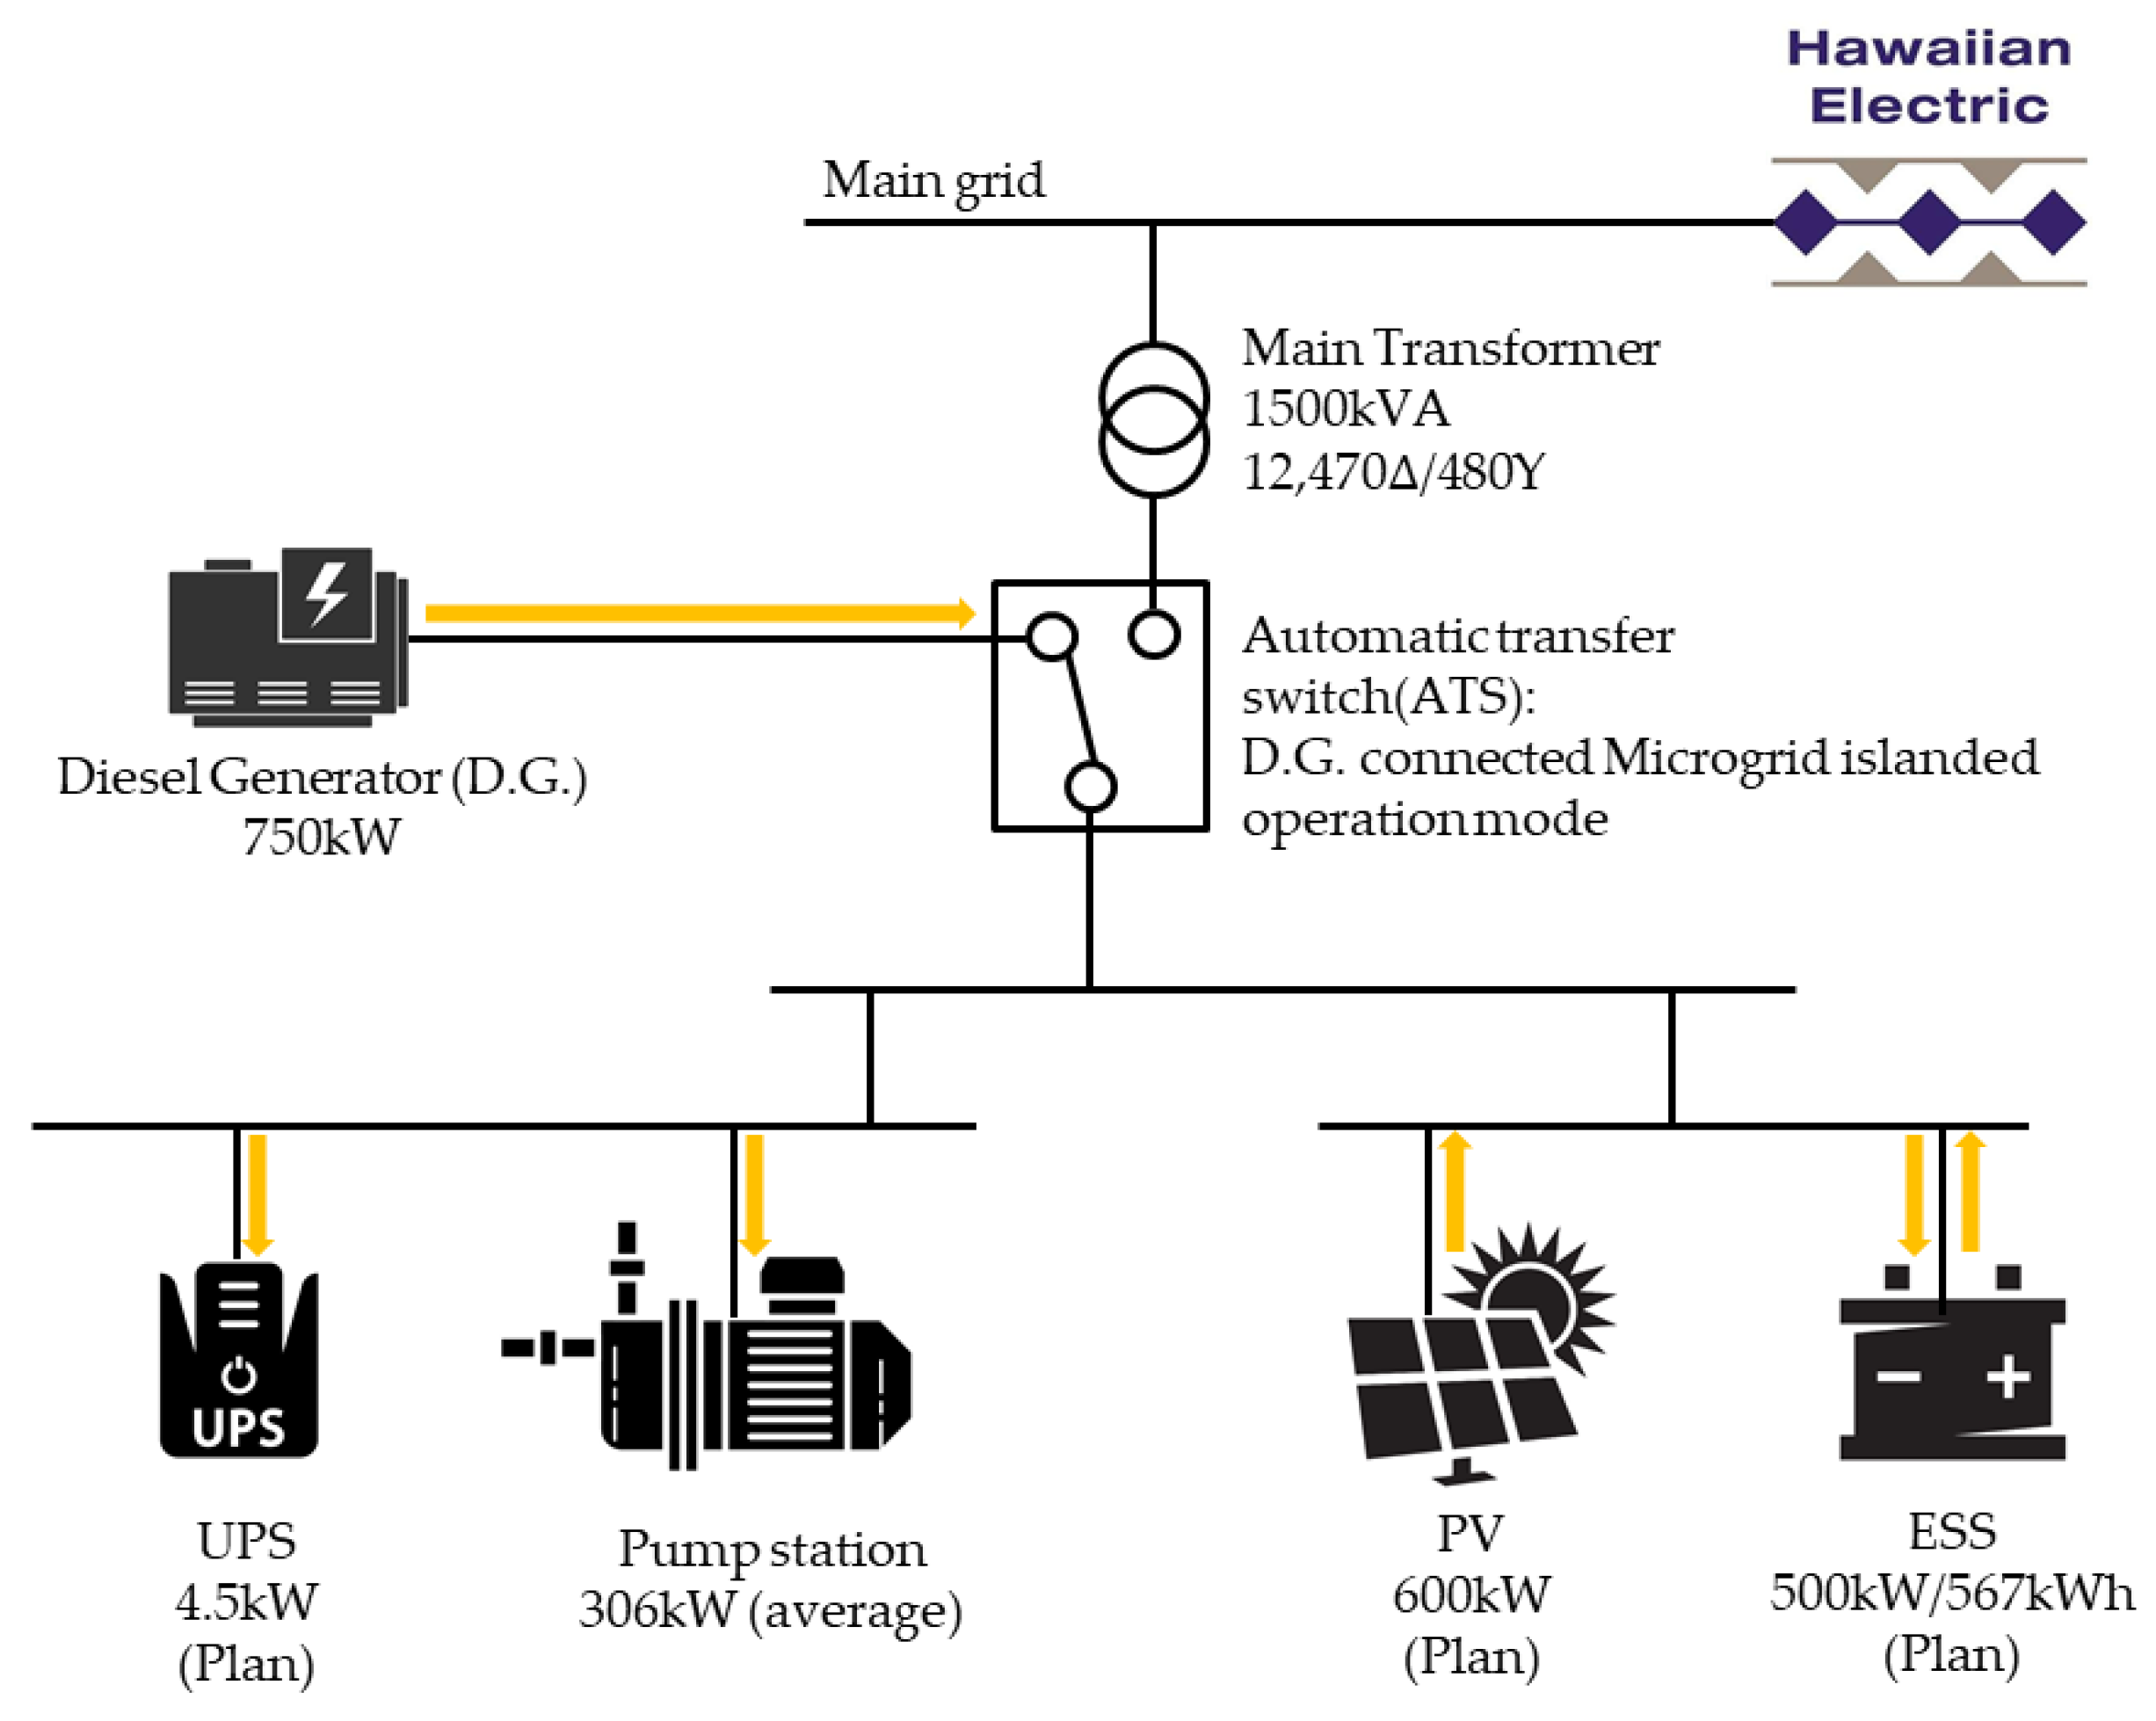
2.1. System Configuration

In this study, a real Hawaii Ocean, Science and Technology Park (HOST) microgrid (MG) operated by the Natural Energy Laboratory of Hawaii Authority (NELHA) was systemically configured for the verification of scheduling effectiveness. HOST Park consists of three loads: research campus, farm compound, and 55-inch pump station. However, because of the unclear tariff and interconnection implications of an advanced hybrid microgrid, the 55-inch pump station location was chosen for the first microgrid development [5]. Figure 2 shows a line diagram of the MG.
The MG system consists of a 750 kW diesel generator, 600 kW of PV power, and 500 kW/567 kWh of ESS. The load considered in this study is the 55-inch pump station and the UPS for the pump. The pump station must be operated at all times in a Hawaiian microgrid; it consumes an average of 306 kW for 24 h, and the UPS must supply power to the pump station in an emergency, but it usually consumes 4.5 kW of power.
Normally, the automatic transfer switch (ATS) is connected to the main grid from Hawaiian Electric and provides electricity to the load. In the case of islanded mode operation, Figure 2 shows that the ATS is connected to the diesel generator and supply electricity within the system. The PV and ESS connected to the system are utilized to extend the use of the diesel generator during outages of the broader grid.

2.2. Formulation for MILP of Conventional Microgrid Scheduling

In this study, the optimization method focuses on MILP, which is a conventional microgrid scheduling method and allows the total capacity of a whole power supply to be calculated using the most used distribution system reliability indicators [21,22] for the expansion of research.
In the system, the fuel of diesel generators incurs costs to supply power demand within the microgrid system. Operators should establish a system of operation scheduling that is the most economical grid operation plan. Therefore, the objective function is to minimize the cost of diesel generators for the islanded operation of microgrids. The cost function of diesel generators is expressed as follows:
C D , t = a U D + b × P D + c × P D 2 ,
In the diesel generator cost function, the fuel cost coefficient is obtained using the MATLAB curve-fitting tool for the diesel generator’s on/off state [23]. The values of a , b , and c are 32,000, 210, and 0.097, respectively. Subscript t is the duration during the interval of each time index. The thermal power system has a minimum cost operating state [24]; diesel generator status U D is multiplied by parameter a to establish theoretically appropriate constraints so that algorithms can operate under other constraints in different environments.
The MILP method of calculation is assumed to be accurate for the grid operation issues in [25] and [26]. For applying scheduling problems to MILP, a piecewise linear technique is utilized to calculate diesel power generation cost. The cost function of diesel fuel consumption is expressed as follows:
C D , t = a U D , t + l Ω L S l P D , l , t ,
where S l is the slope of each diesel cost linear function, which represents dividing 10 sections of the diesel cost quadratic function interval slope rate. Subscript l is an index of each diesel generation cost linear function; Ω L is a set of slopes. Table 1 represents the slope of the diesel cost function piecewise in 10 intervals.
In order to acquire an optimal solution to economical operation scheduling, the objective function is to minimize the diesel generation operation cost.
min   P D , t , P Curt , t t Ω T ( ( C D , t ( P D , t ) ) × Δ t ,
where subscript t is the time index, P D is the output power of the diesel generator, and C D is the cost function of the diesel generator.
The following is the constraint condition of the optimization problem, which satisfies t Ω T and l Ω L :
l Ω L P D , l , t + P ESS , t + P PV , t P C u r t , t = P L , t ,
where P D is the output power of the diesel generator, P ESS is the ESS output power of ESS, P PV is the output power of PV, P C u r t , k is the curtailment of PV output power, and P L is the load demand.
P D , l , min P D , l , t P D , l , max , t , l
l Ω L P D , l , t U D , t P D Max , t
R DE down Δ t l Ω L P D , l , t l Ω L P D , l , t 1 R DE up Δ t , t ,
where P D , l , min and P D , l , max are diesel generator minimum and maximum power at l th interval, P D Max is the maximum rated output power of diesel generator, U D is diesel generator on/off status, and R DE down and R DE up are the ramp-down and ramp-up rate of the diesel generator.
U Ed , t + U Ec , t 1 , t
0 P ESSdis , t U Ed , t P ESS , max , t
U Ec , t P ESS , max P ESSchg , t 0 , t
P ESS , t = P ESSdis , t + P ESSchg , t , t
S O C min S O C t S O C max , t
S O C o = S O C N ,
where P ESSchg and P ESSdis are the charge and discharge output power of ESS, respectively; U Ed and U Ec are variables indicating the state of ESS, respectively; and P ESS , max is the ESS maximum output power. S O C min and S O C max are the minimum and maximum values of SOC, respectively. The ESS is designed to operate in a way that does not completely charge and discharge by setting the maximum and minimum values because performance problems may occur during full discharge, and fire accidents may occur during overcharging ([27] and [28]). S O C o and S O C N are the initial and last values of SOC. By setting the initial and last value of SOC as equal, the battery operation for one day becomes one cycle, and the cycle gradation of lithium batteries can be analyzed more accurately [29]. At time t, the SOC of ESS is represented as:
S O C t = S O C t 1 + η ESS c h g × P ESS c h g , t × Δ t C A P + P ESS d i s , t × Δ t η ESS d i s × C A P , t
where η ESSchg and η ESSdis are the ESS discharging and charging efficiencies, respectively, and C A P is capacity of ESS.

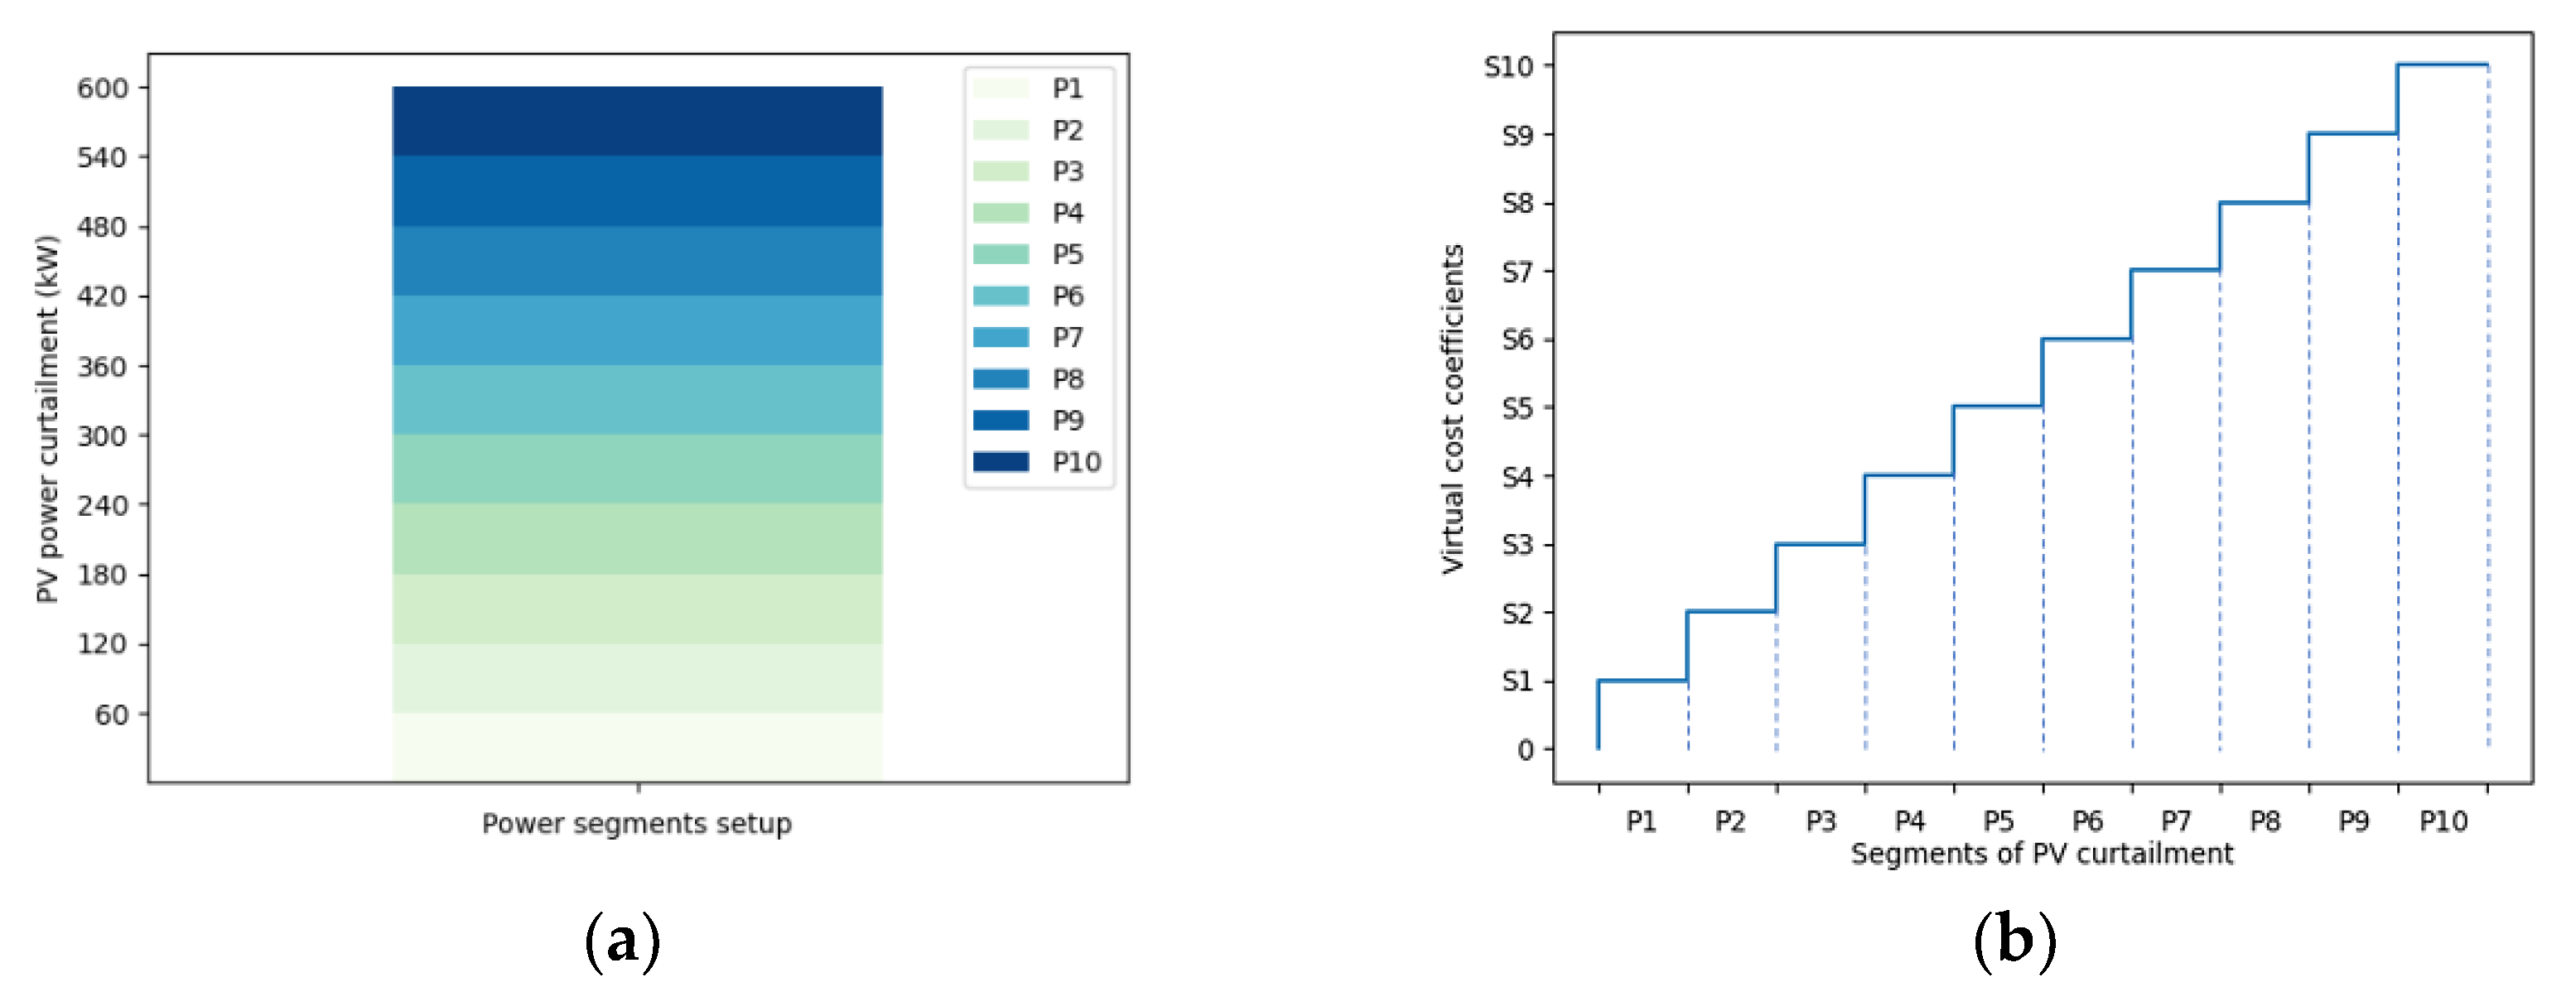
3. Curtailment Cost Gradation Method

A novel MILP optimal scheduling for PV curtailment gradation cost of an MG system is proposed. To gradate the cost of PV curtailment, the total PV curtailment in a time index is divided into a random number of K . To prevent curtailment from being concentrated in a particular time zone, the gradation cost of PV curtailment is generated as follows:
P Curt , k , t = P Curt , t K , t , k
C Curt , t = k Ω K S k P Curt , k ,
where P Curt is the curtailment of PV surplus generation, and subscript k is the index of the PV curtailment interval in a time index. C Curt , t is the virtual cost function of PV curtailment, k is the set of curtailment intervals, and S k is the differential cost coefficient for each curtailment interval. S k is differentially specified according to the algebraic relationship from low to high intervals of power curtailment intervals, and it induces a preferential selection of PV curtailment intervals in the cost minimization algorithm.
In this study, PV curtailment is specified as 600 kW, which is scheduled to be installed and is divided into 10 sections. Curtailment cost coefficients are generated that increase step-by-step from low curtailment to high curtailment sections. Figure 3 shows PV curtailment divided by 10 sections and the cost coefficients of each interval. The amount of each interval PV curtailment in Equation (16) has a range of 60 kW.
Since the cost coefficient function satisfies the algebraic relationship between intervals, coefficients are set to less than five decimal places to reduce being reflected in the actual cost, considering that it is a virtual cost that is being modeled in this study. Table 2 shows the curtailment cost function coefficients for each curtailment interval. The virtual cost function for PV curtailment is multiplied by the corresponding cost coefficient for each interval. The objective function is redefined as follows:
min   P D , t , P Curt , t t Ω T ( ( C D , t ( P D , t )   + C Curt , t ( P Curt , t ) ) × Δ t ,
PV curtailment gradation cost applied optimal scheduling constraints; the power supply and demand equation is expressed as follows:
l Ω L P D , l , t + P ESS , t + P PV , t k Ω K P C u r t , k , t = P L , t ,
Equations (5)–(14) are the same as the constraints of the proposed method.
Figure 4 shows the flowchart of the proposed method, which derives an MG optimal operation schedule with a distributed curtailments plan by adding PV curtailment gradation virtual costs in MILP modeling.

4. Simulation Results and Discussion

4.1. Simulation Environment

In this study, the Hawaii Ocean, Science and Technology Park demonstration test area was the basis for the study, and data from NELHA’s 17.5 kW PV system were used to conduct the process. The pump station consumes an average of 306 kW for operation of a sea farm, and the UPS for the pump station was designed to consume 4.5 kW. For PV generation, the 17.5 kW PV data were utilized. The installation was not complete yet; it was scaled up to 600 kW, which is scheduled to be installed. The ESS inputted the estimated installation capacity of 567 kWh; the initial SOC of the ESS was set at 50% and was set at a minimum of 20% and a maximum of 80% during the system operation. Setting the minimum output power limit for diesel generators is required for diesel generator efficiency [30]. In this study, the diesel generator’s output minimal power limit was set at 30% of its rated power, which was 225 kW. To verify the results of the proposed method, data for each of seven days of June were utilized as input data. The MG optimal scheduling problem was solved by using python PuLP library.

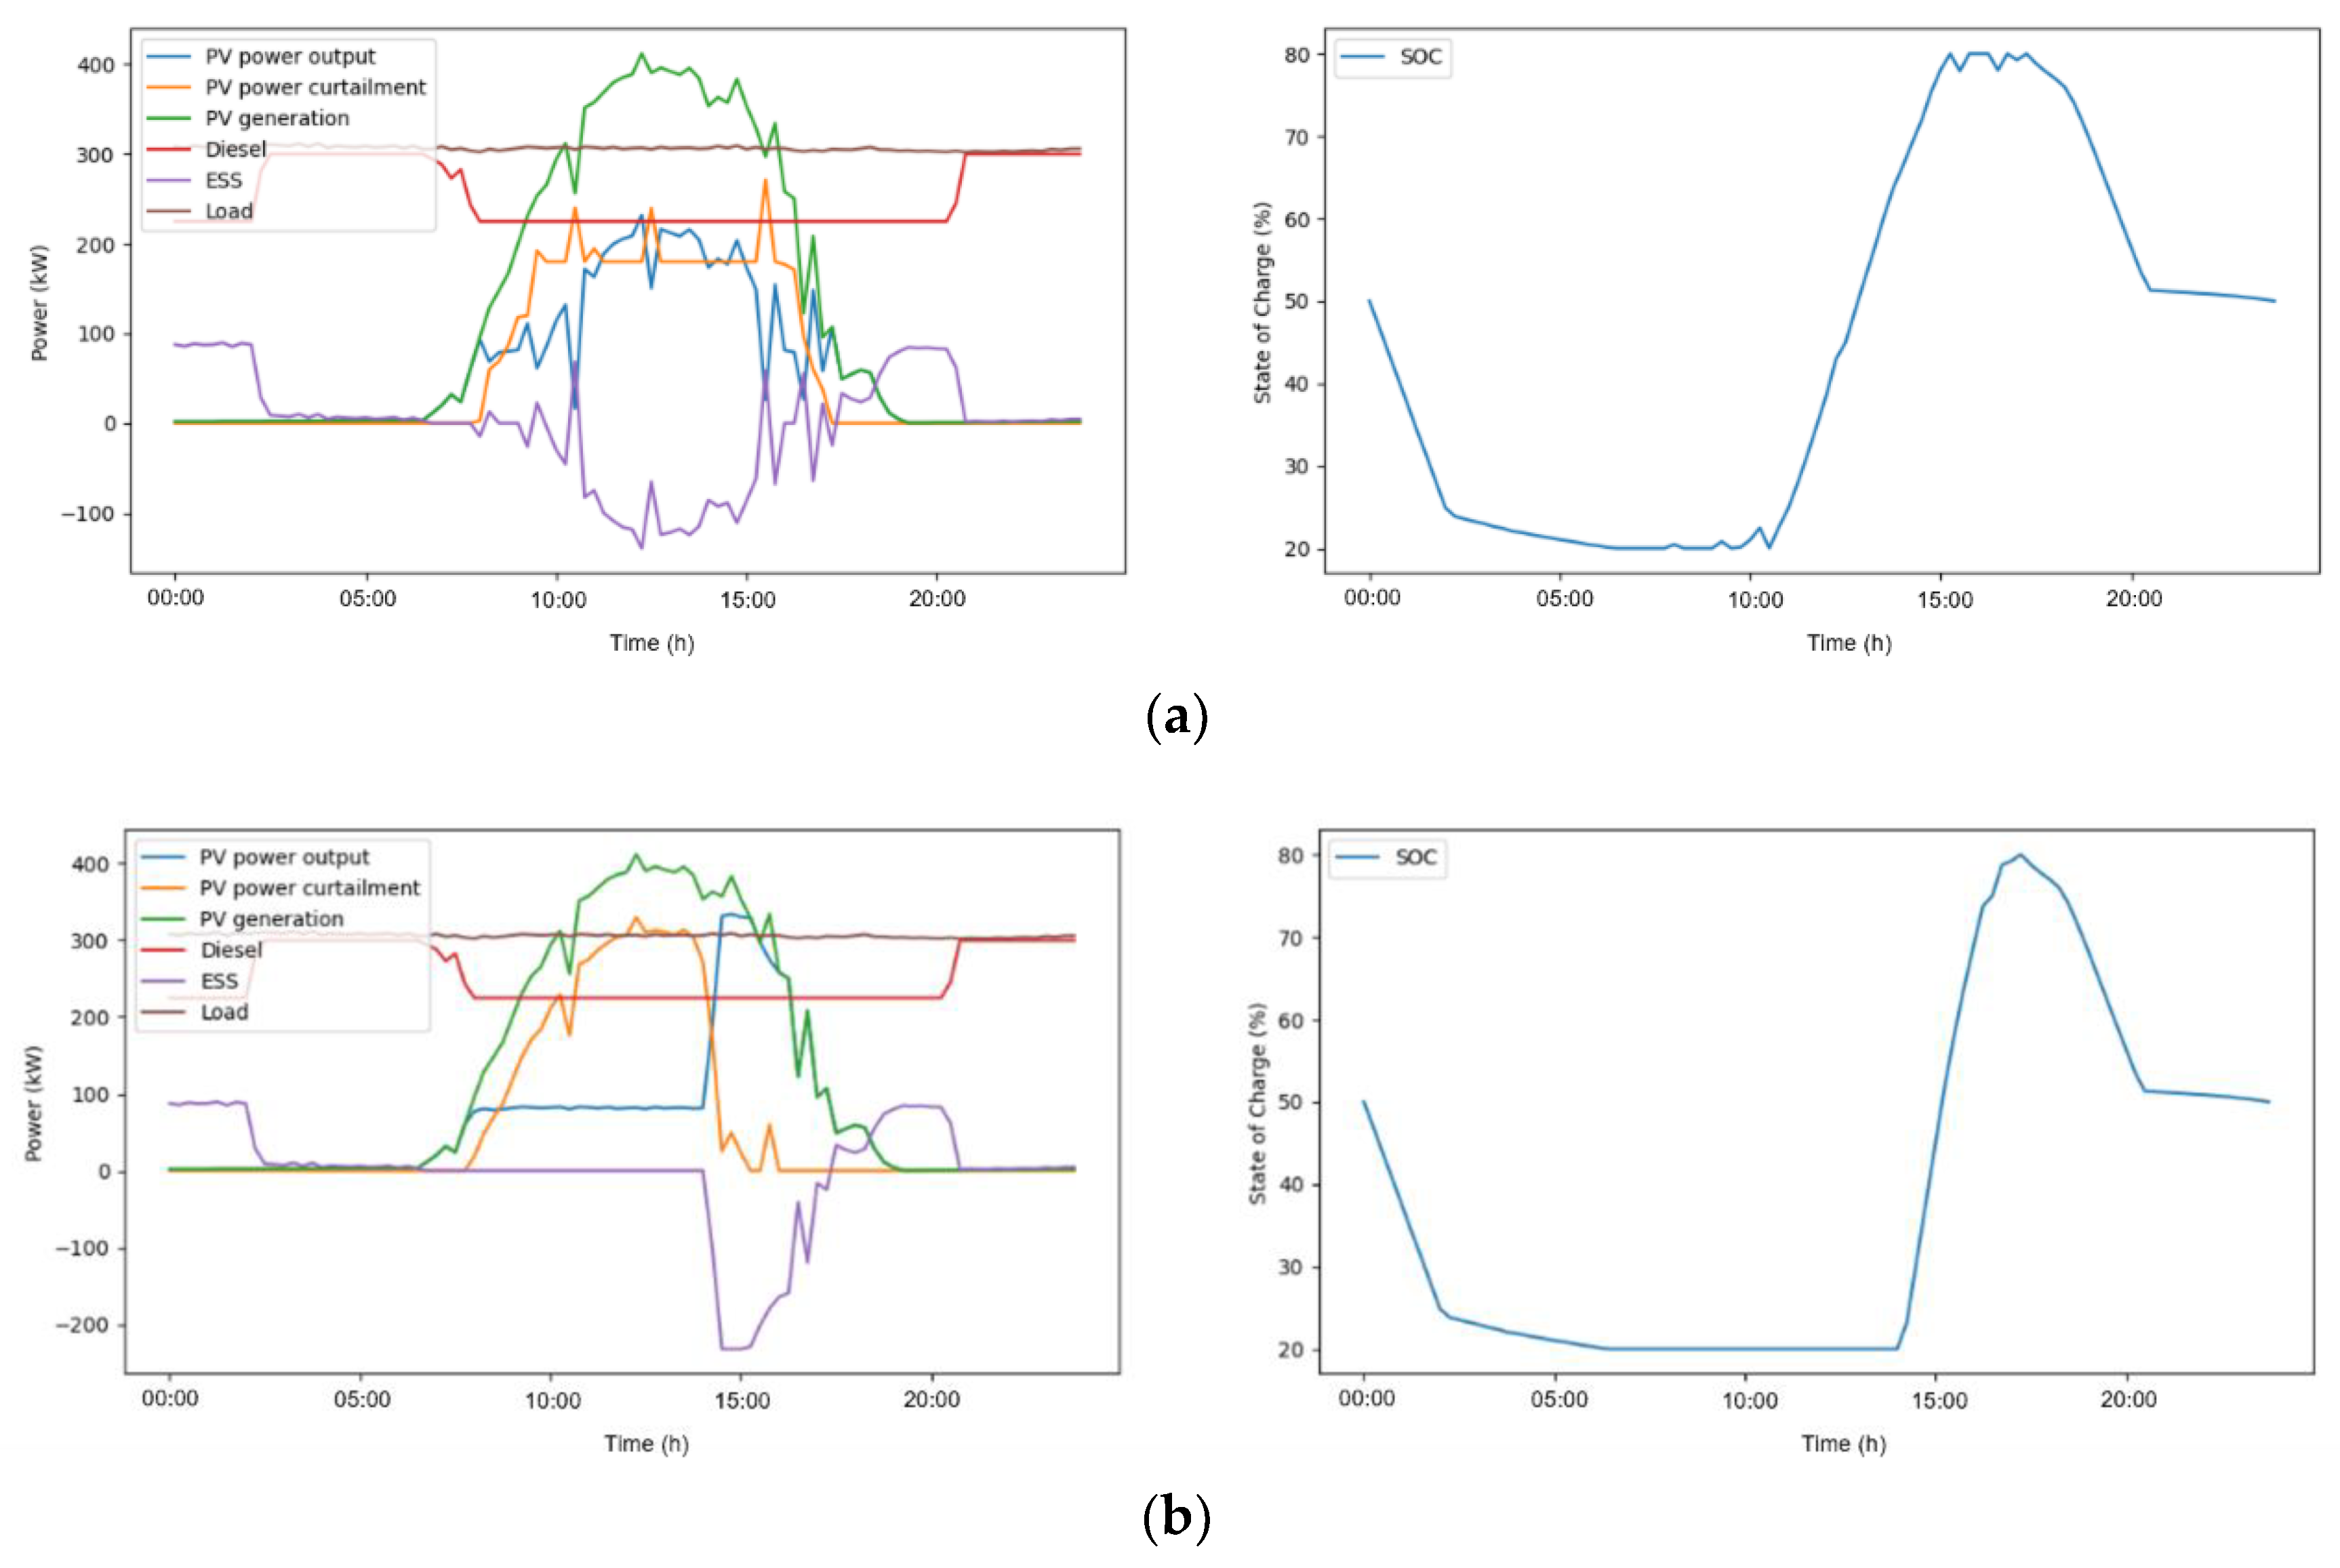
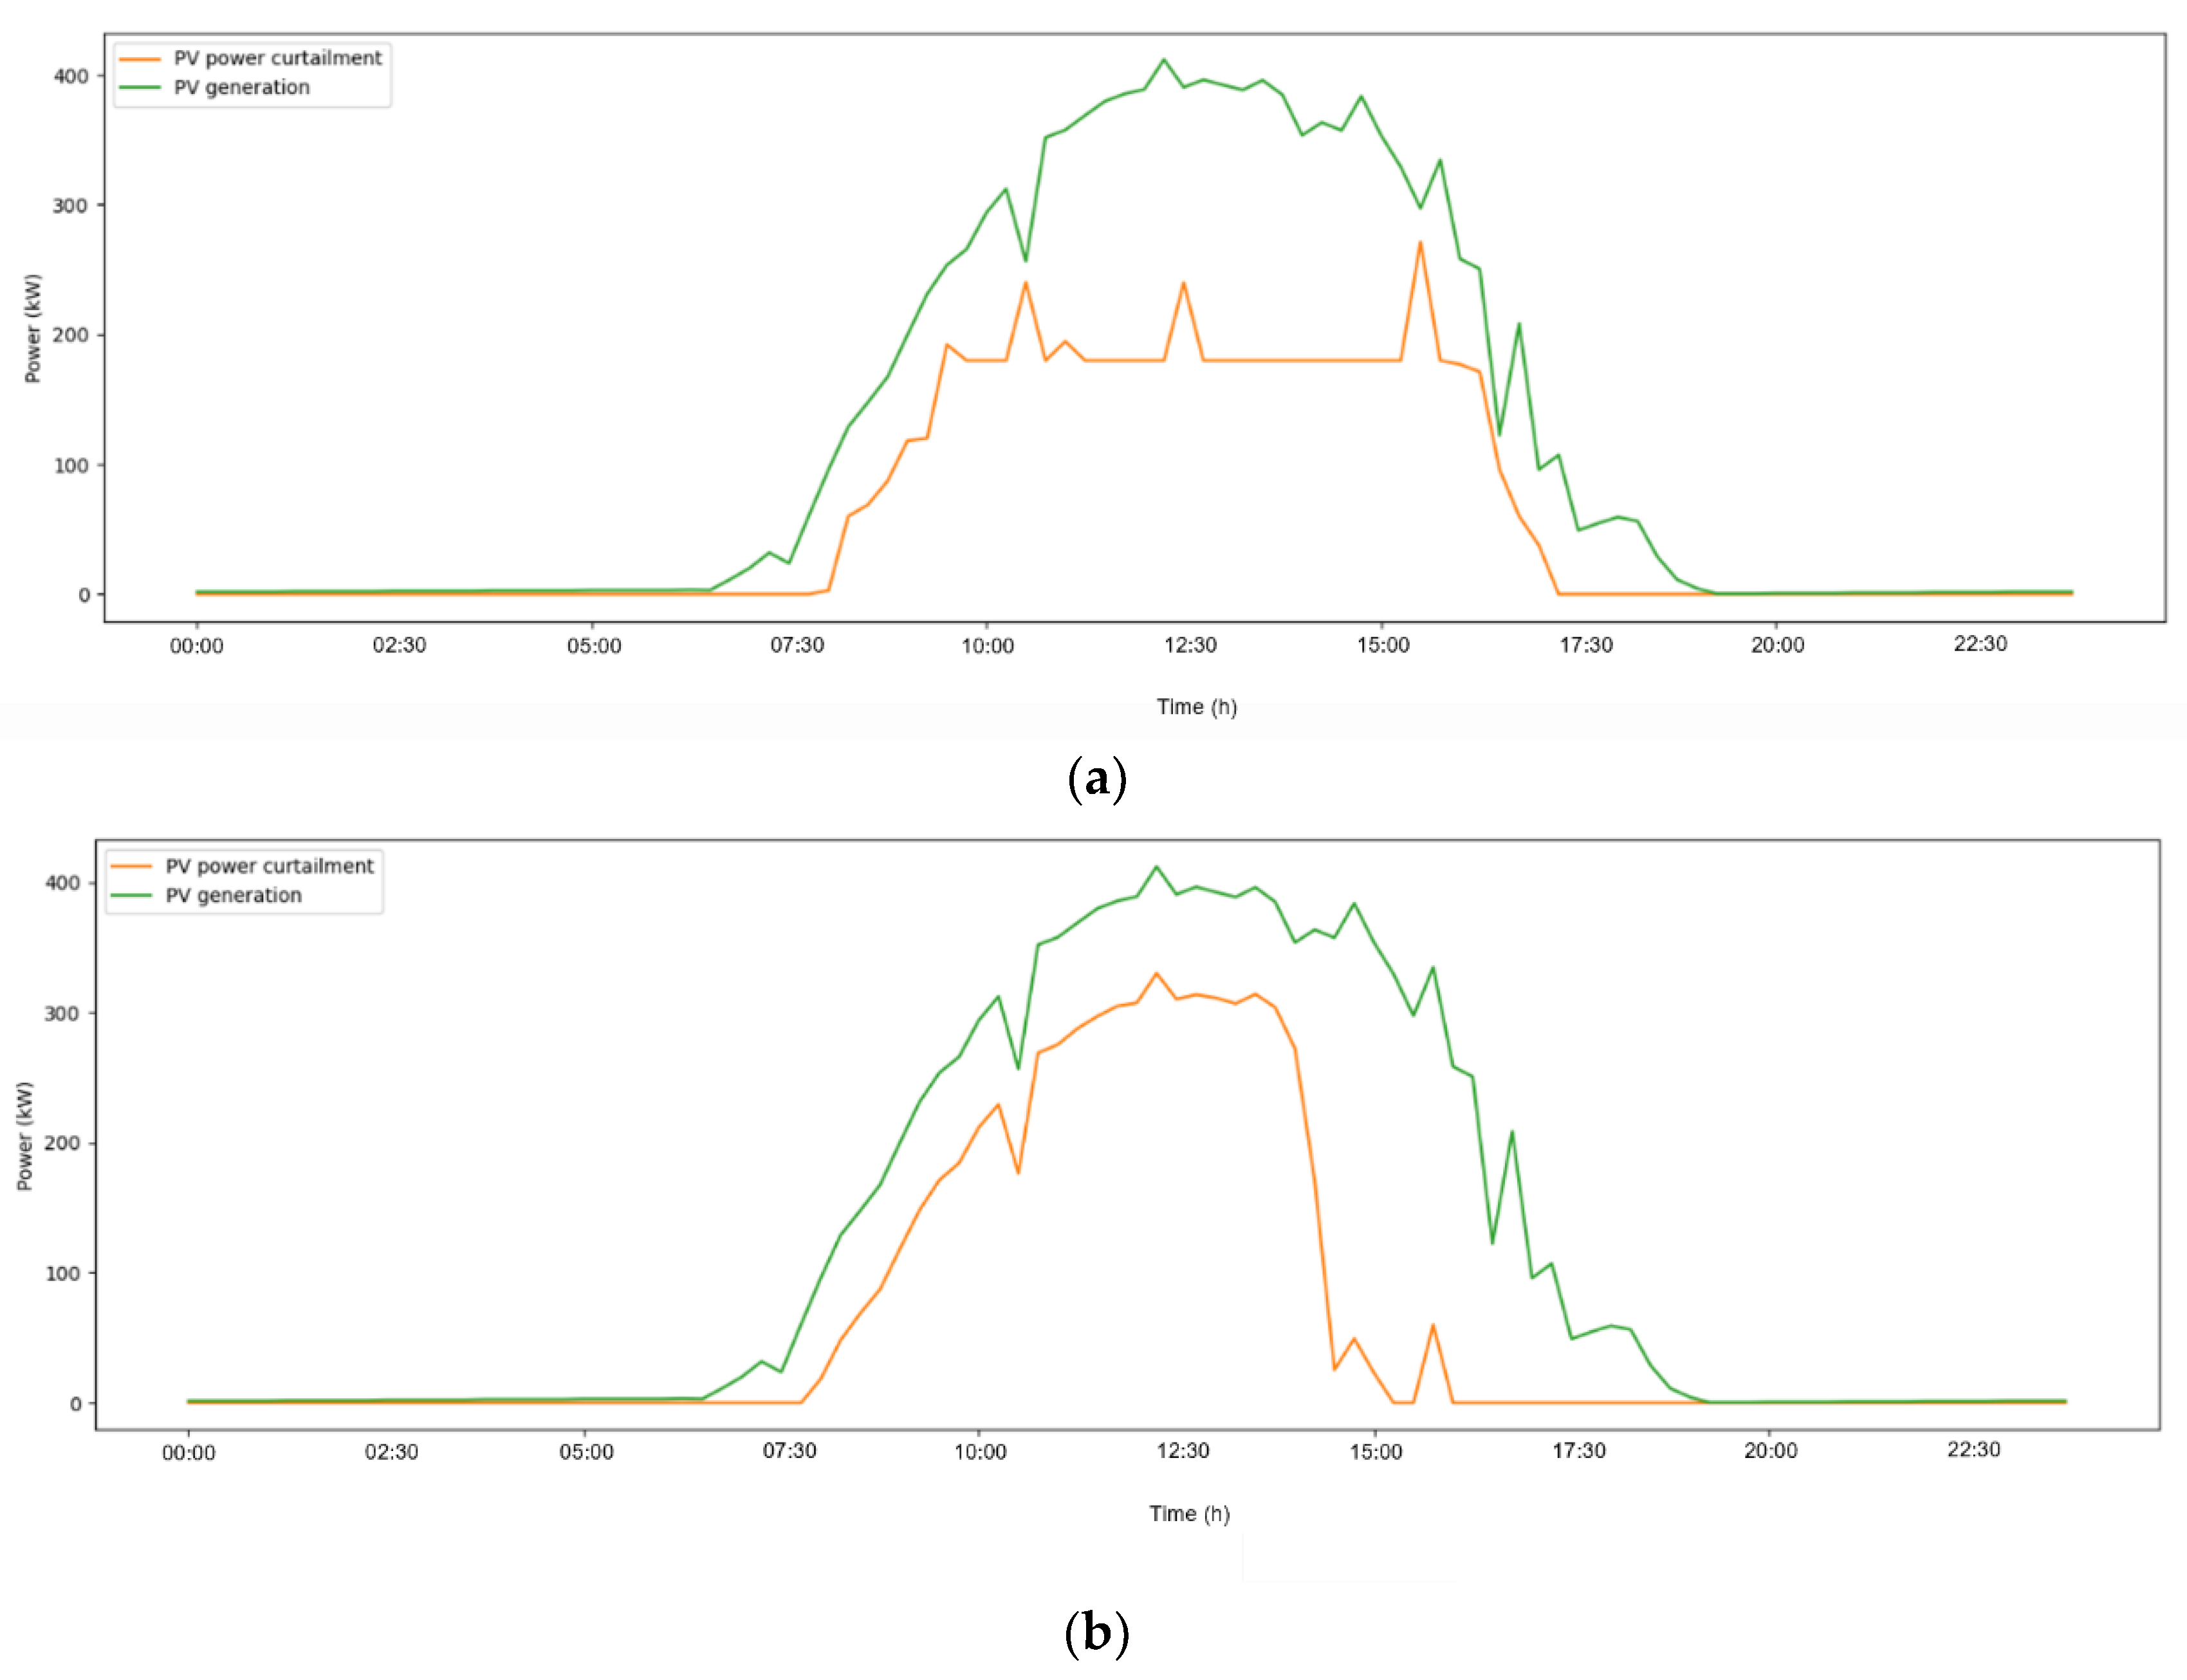
4.2. Single Day Simulation Results

We compared the microgrid optimal scheduling results obtained from the pro-posed PV curtailment cost gradation method and conventional curtailment cost non-reflected method. Figure 5 shows that the proposed method (a) distributed cur-tailments between all PV generation intervals, while the conventional method (b) shows that the curtailment was concentrated in the time zone ahead of the certain time. The PV curtailment of a single day and the amount of curtailment in the genera-tion time zone are shown in Figure 6 and Table 3 respectively.
As solar power increased at around 08:00, both the proposed and conventional method both showed that the amount of curtailment increased as well. However, from 09:45 to 17:00, the two methods showed different trends in curtailment. In the proposed method, the curtailment was distributed until solar power decreased and performed 180 kW of curtailment during most of the time index. On the other hand, the conventional method showed that the amount of curtailment continued to increase with increasing solar energy during the morning. At 12:45, when solar power peaks, the maximum amount of curtailment was performed, which was 313 kW. The curtailment then decreased with a decrease in solar power generation, showing a sharp drop in curtailment of 246 kW between 14:00 and 14:30. From 15:15, the curtailment was not performed, recording 0 kW till the end, expected at 15:45.
Accordingly, in the proposed method, ESS was charged for an even period of time due to the distribution of curtailments at the solar power generation time, while the conventional method showed that the ESS remained at a minimum state of charge and was charged at a rapid rate at around 14:30 because of a sharp decrease in curtailment. The difference in the curtailment was also different with regard to the charging speed of the ESS. In Figure 5, when comparing the SOC of the two methods, the proposed method took approximately five hours from minimum to maximum SOC, while the existing method took approximately half the time of the proposed technique for ESS from minimum to maximum SOC. The charging rate difference in ESS under the different curtailment methods had an effect on ESS aging ([31] and [32]). The difference in charging speed because of differences in curtailment between the proposed and conventional method will be improved in future research by including ESS cost calculations in the optimization problems.
The results of the proposed and conventional cost minimization algorithms are shown in Table 4. The optimal solution for the two techniques was the same value at 2,242,795 KRW. PV curtailment gradation cost is a virtual cost for distributing curtailment, and the virtual cost was applied below the decimal point of the optimal solution so that it would not be reflected in the actual cost. For PV curtailment, the proposed and conventional methods produced different results for mean values and standard deviations. In the case of the standard deviation, the proposed method recorded a value that was 29% lower than the conventional method because the curtailment was evenly distributed in the generation time.

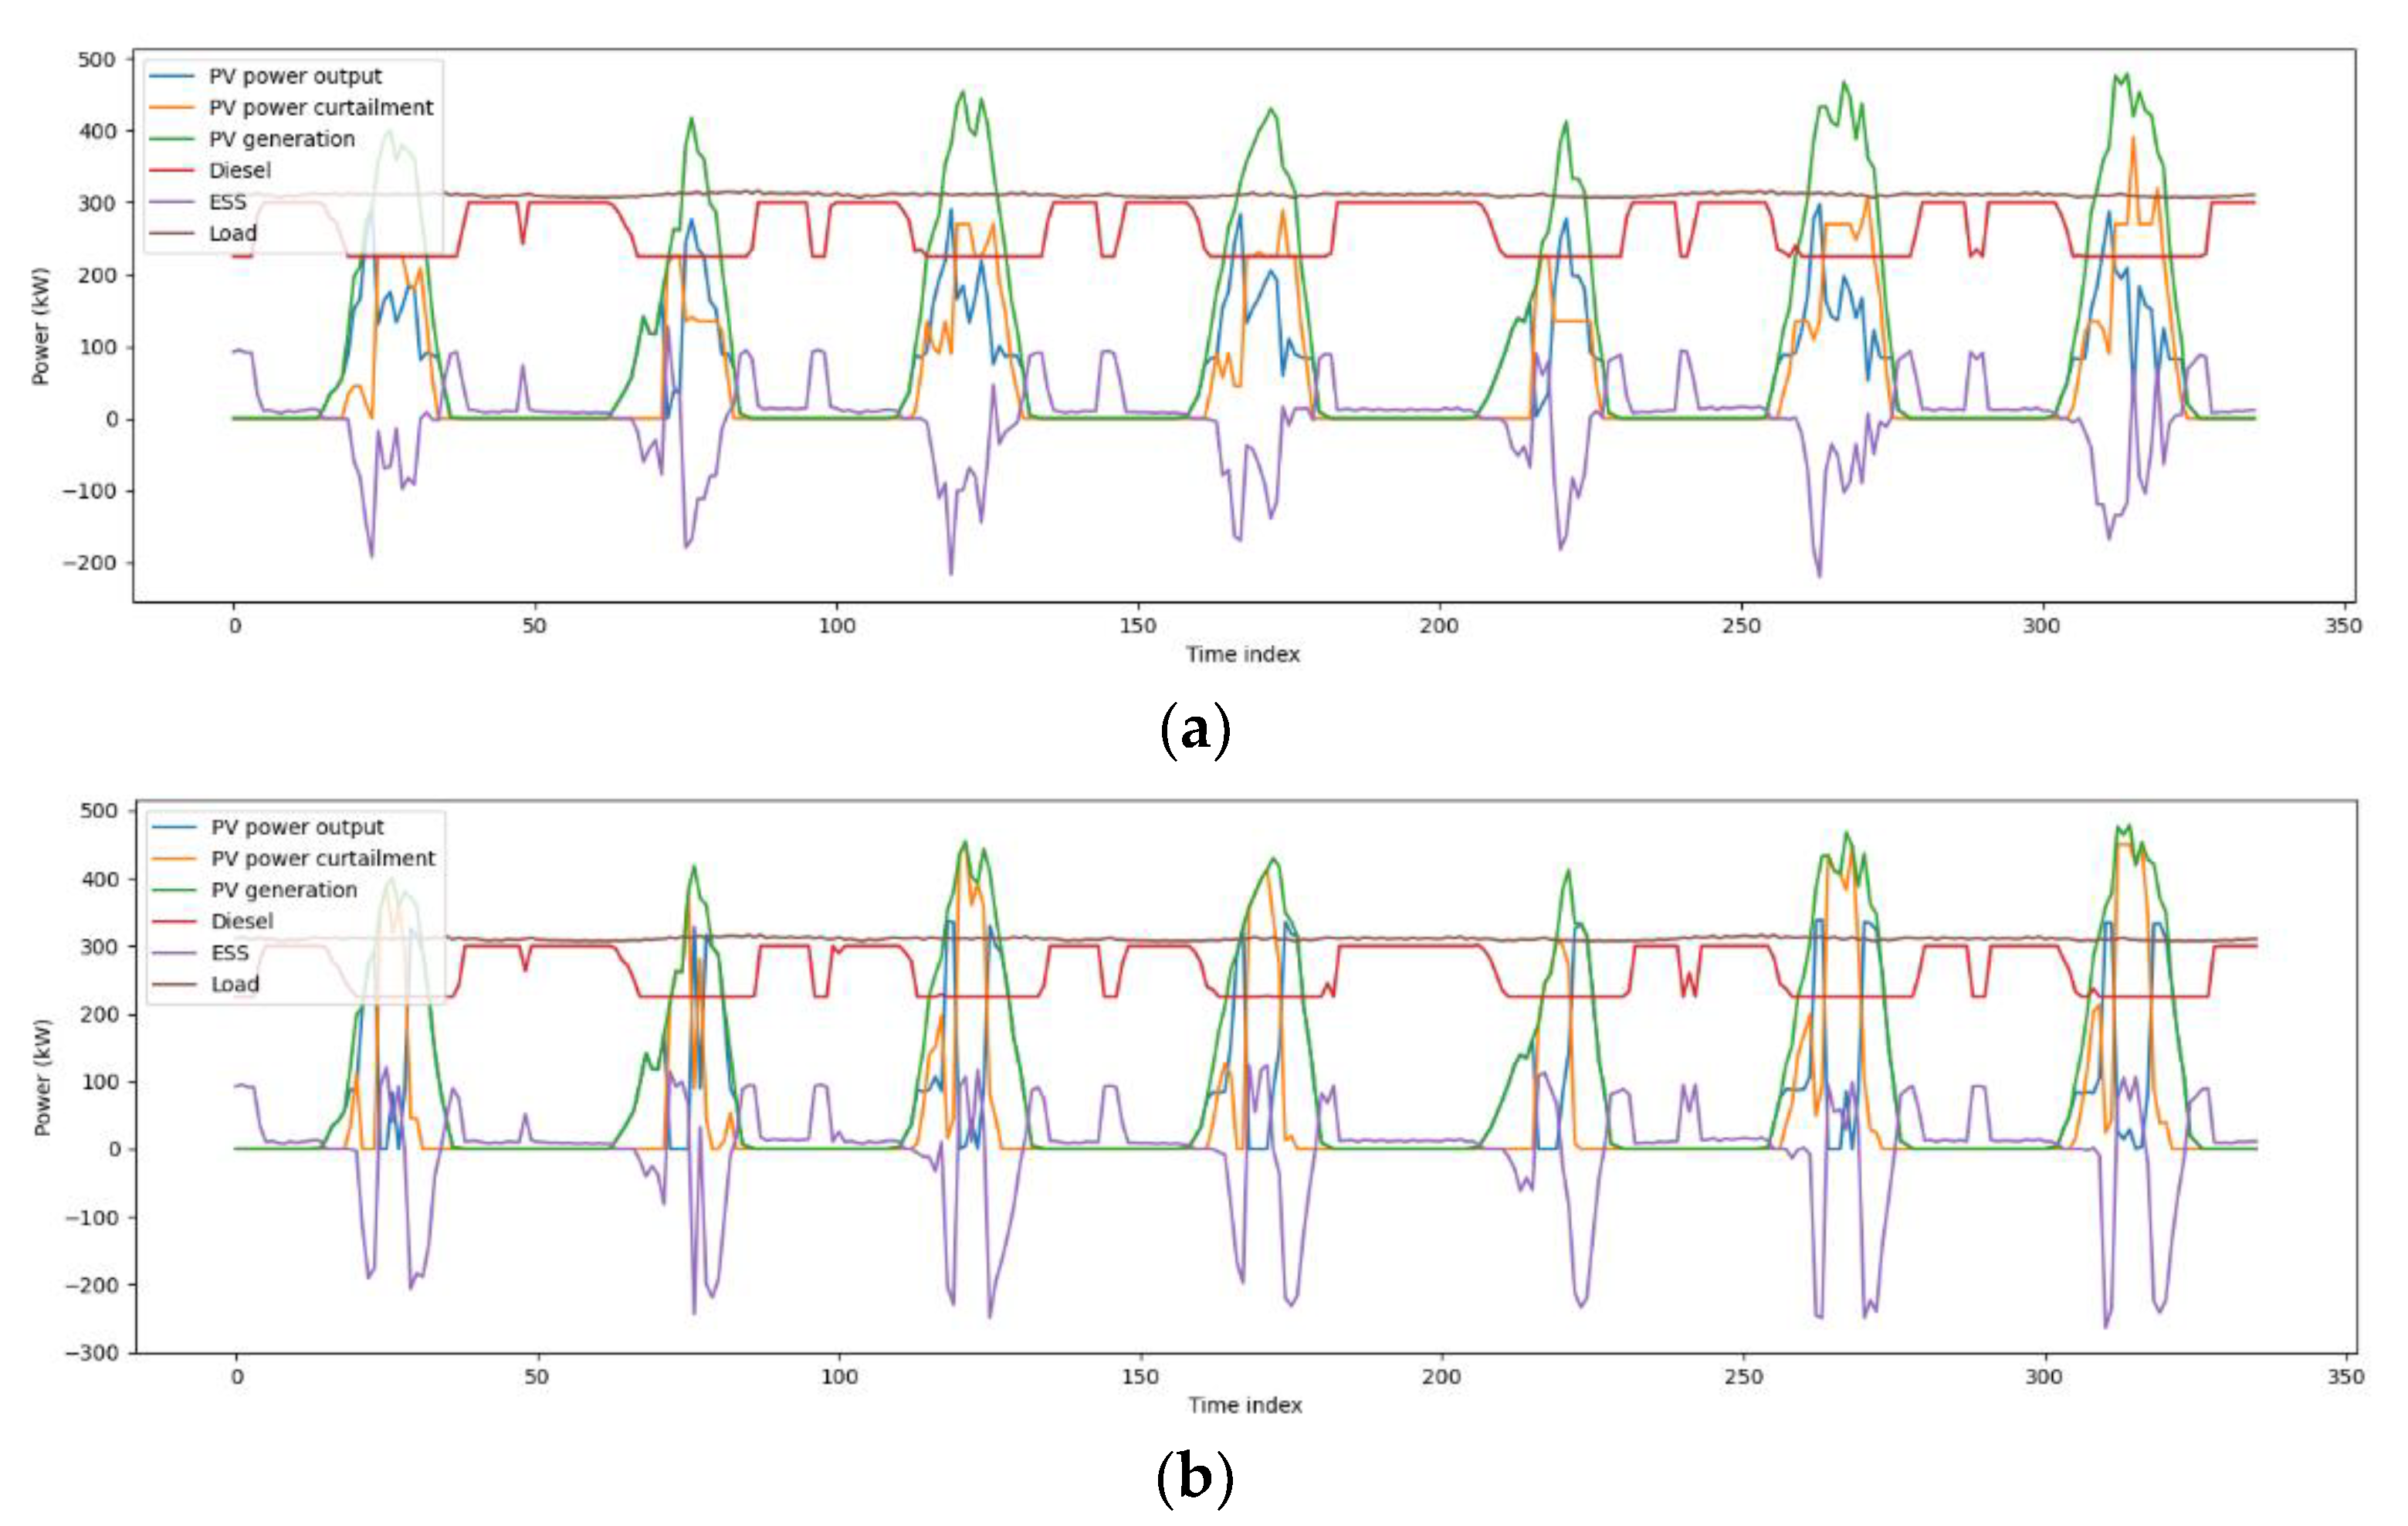
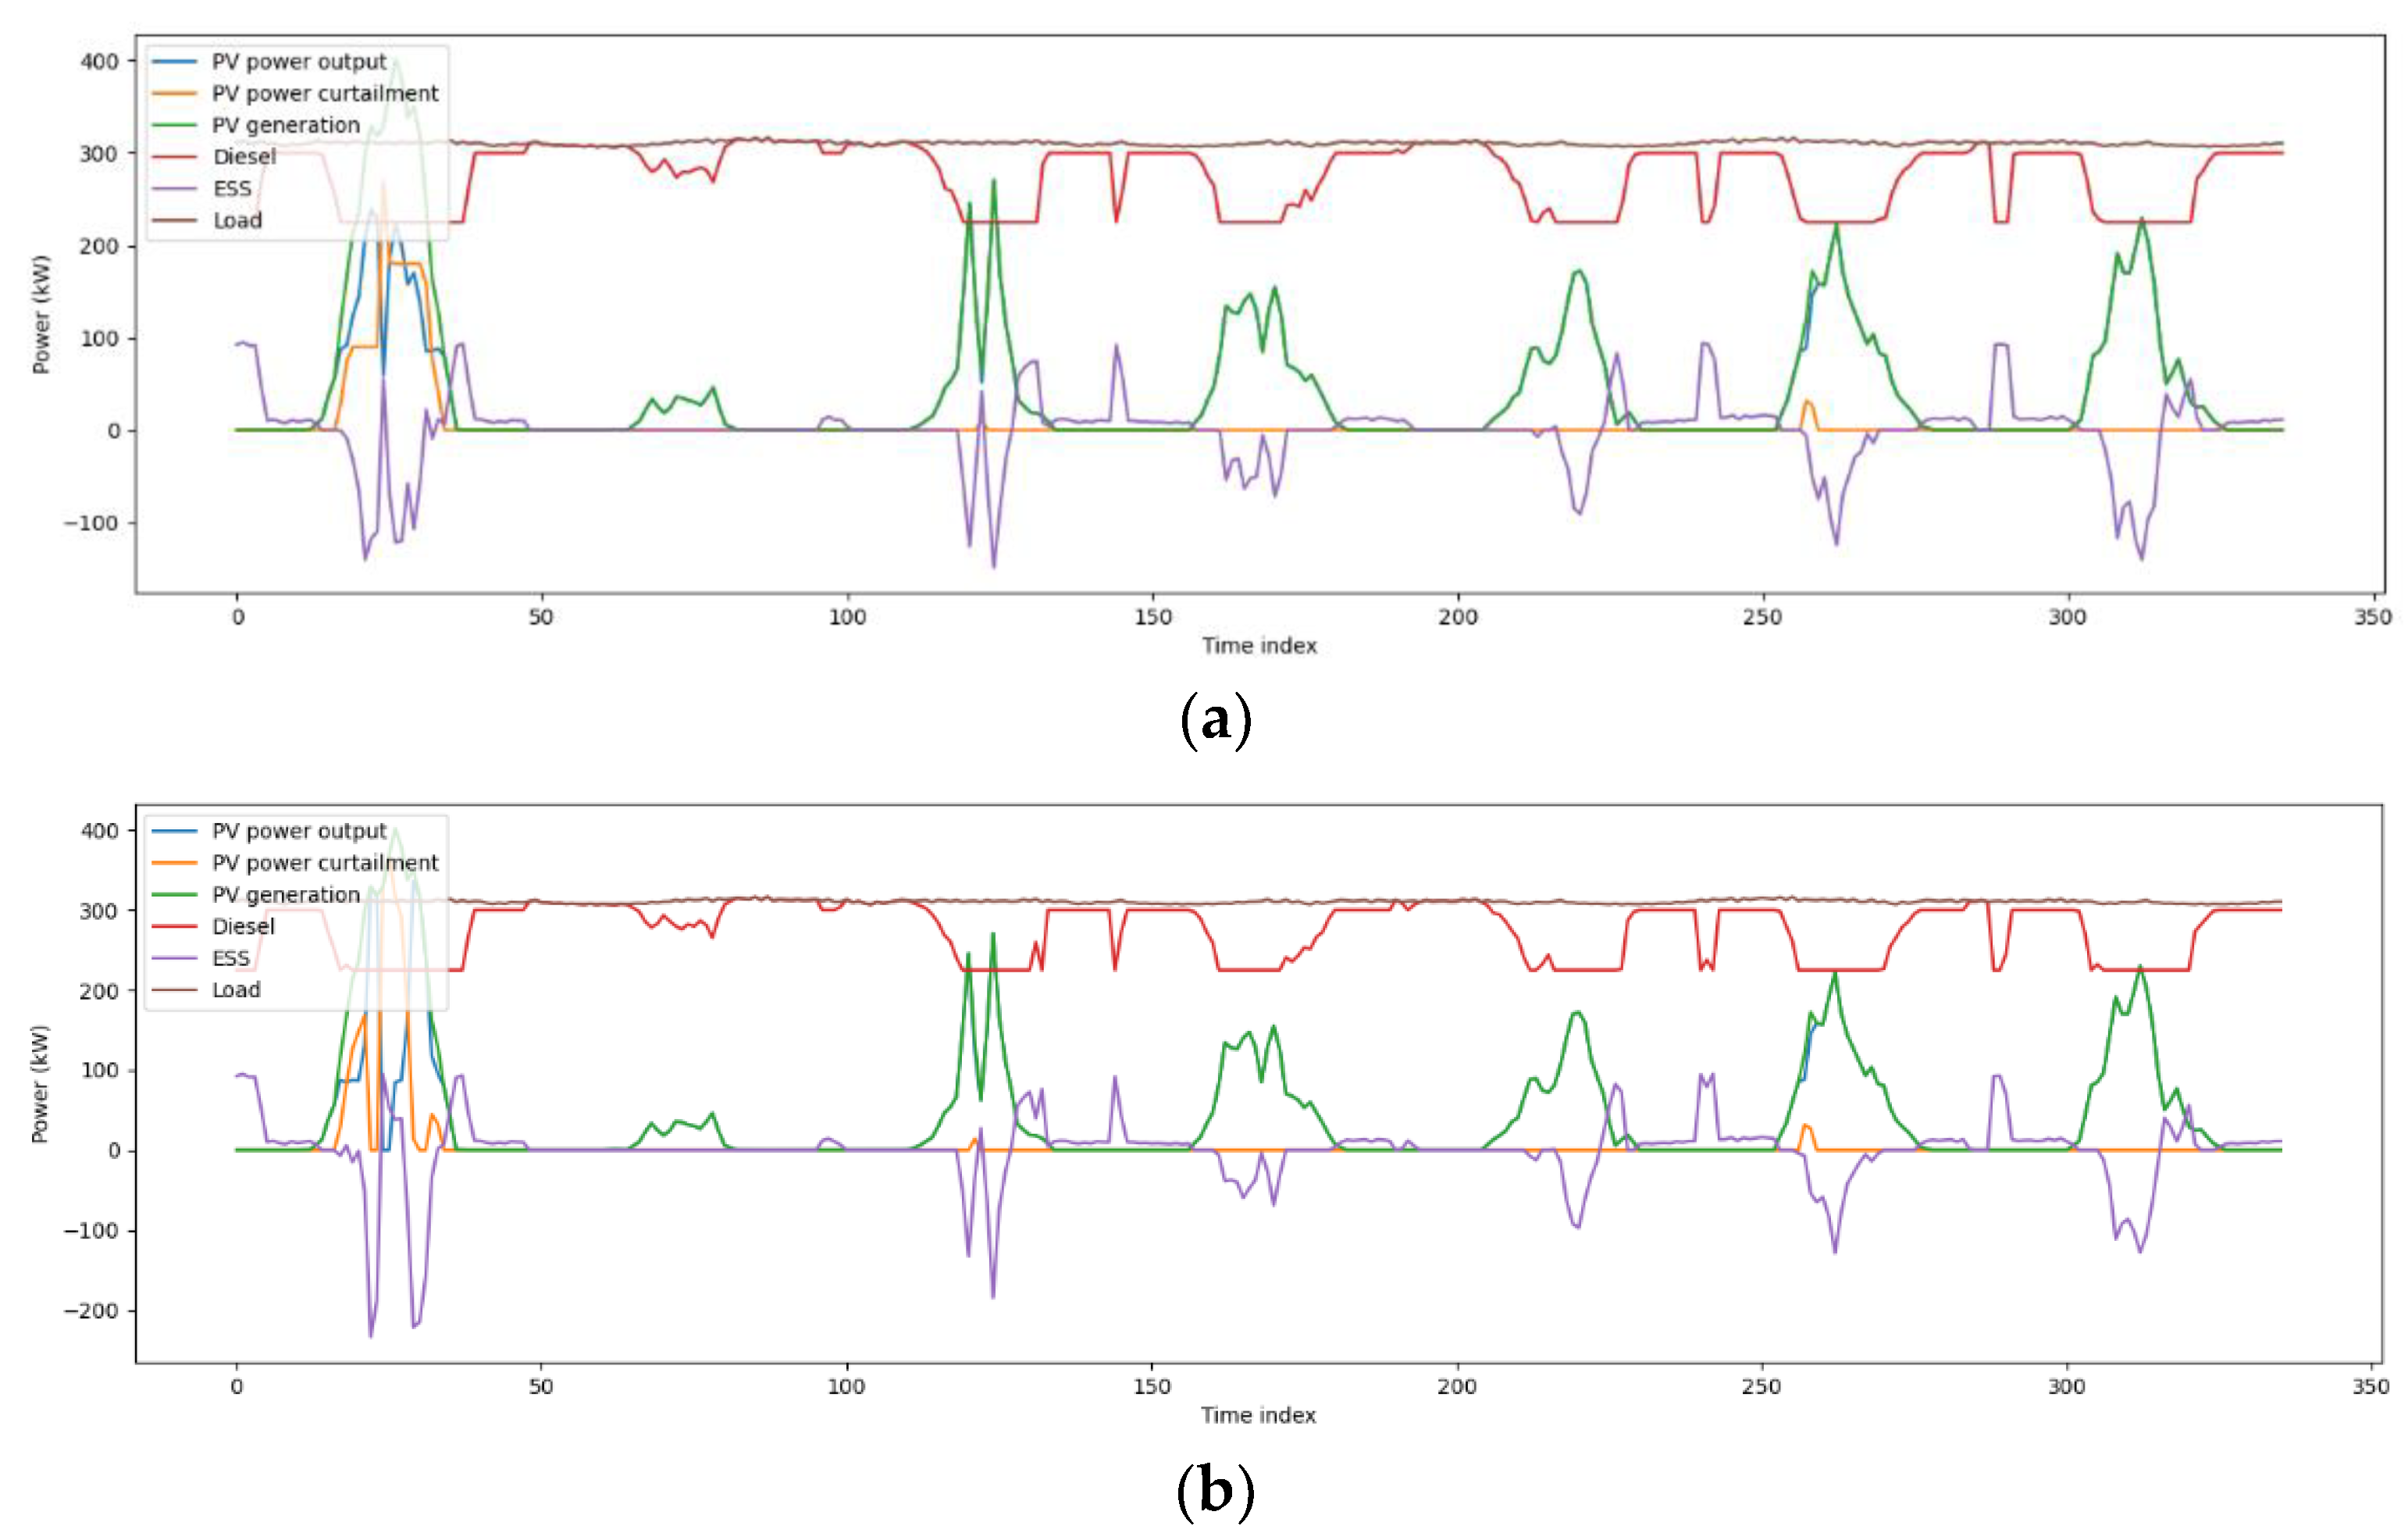
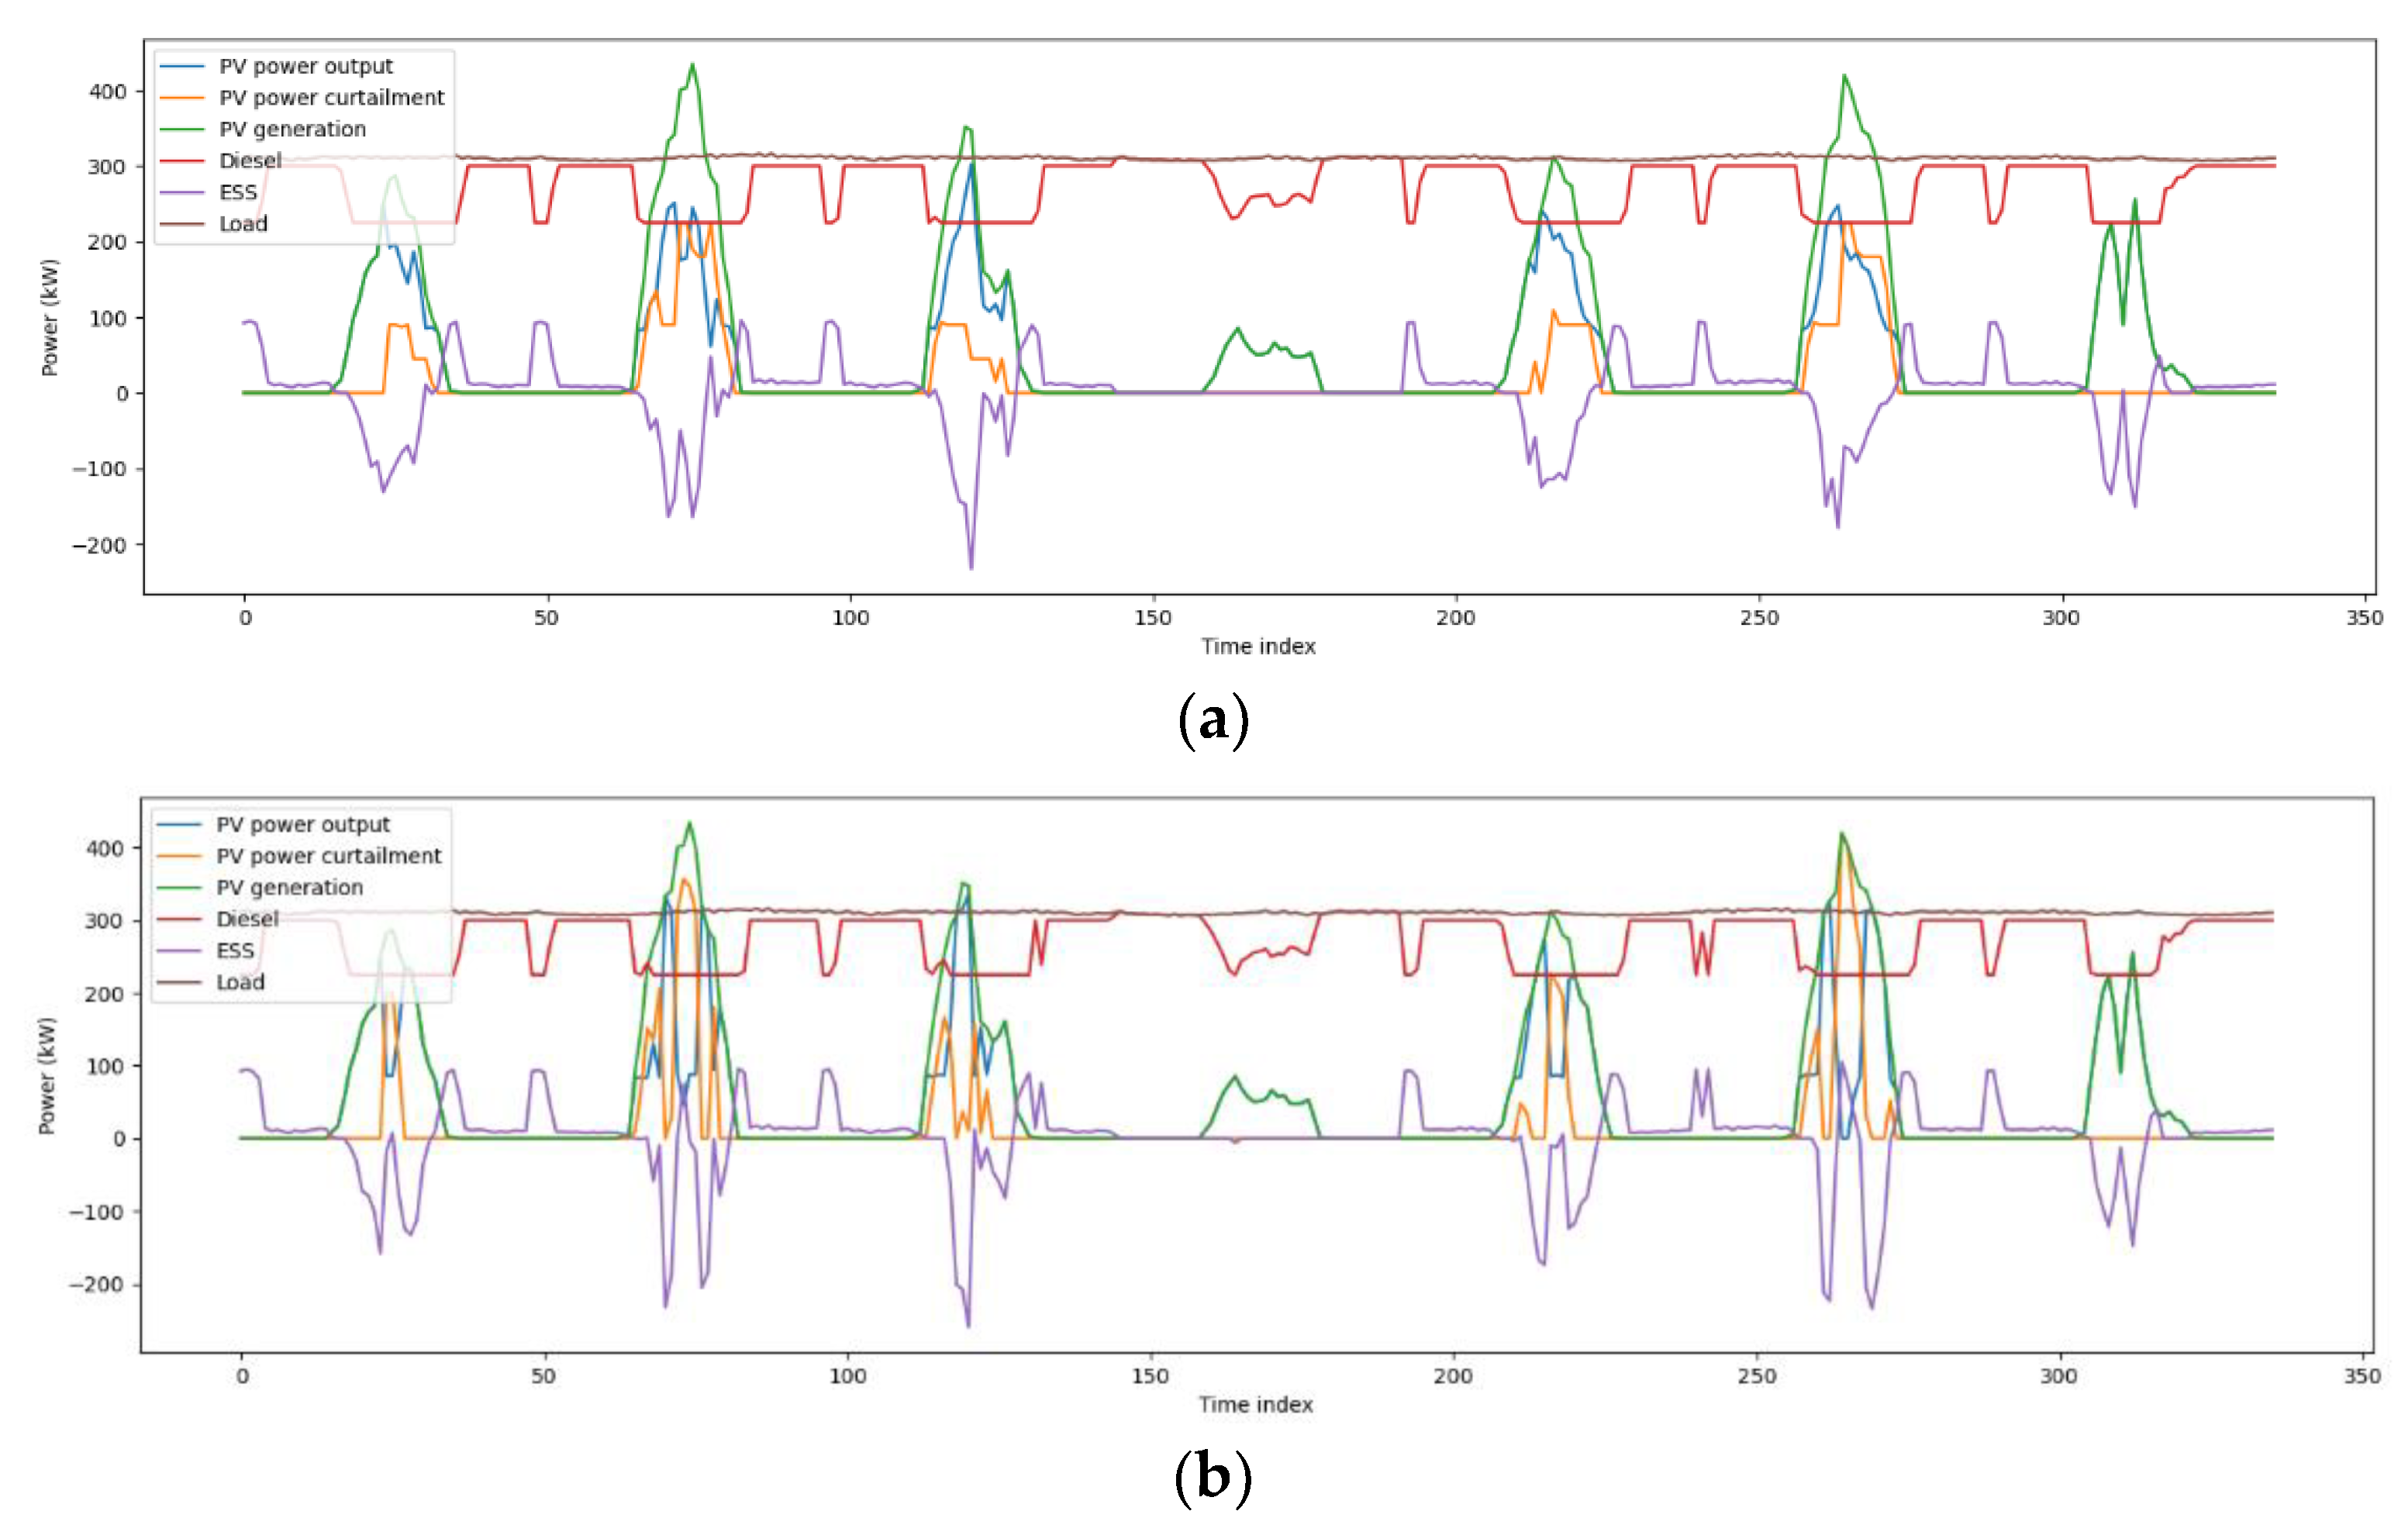
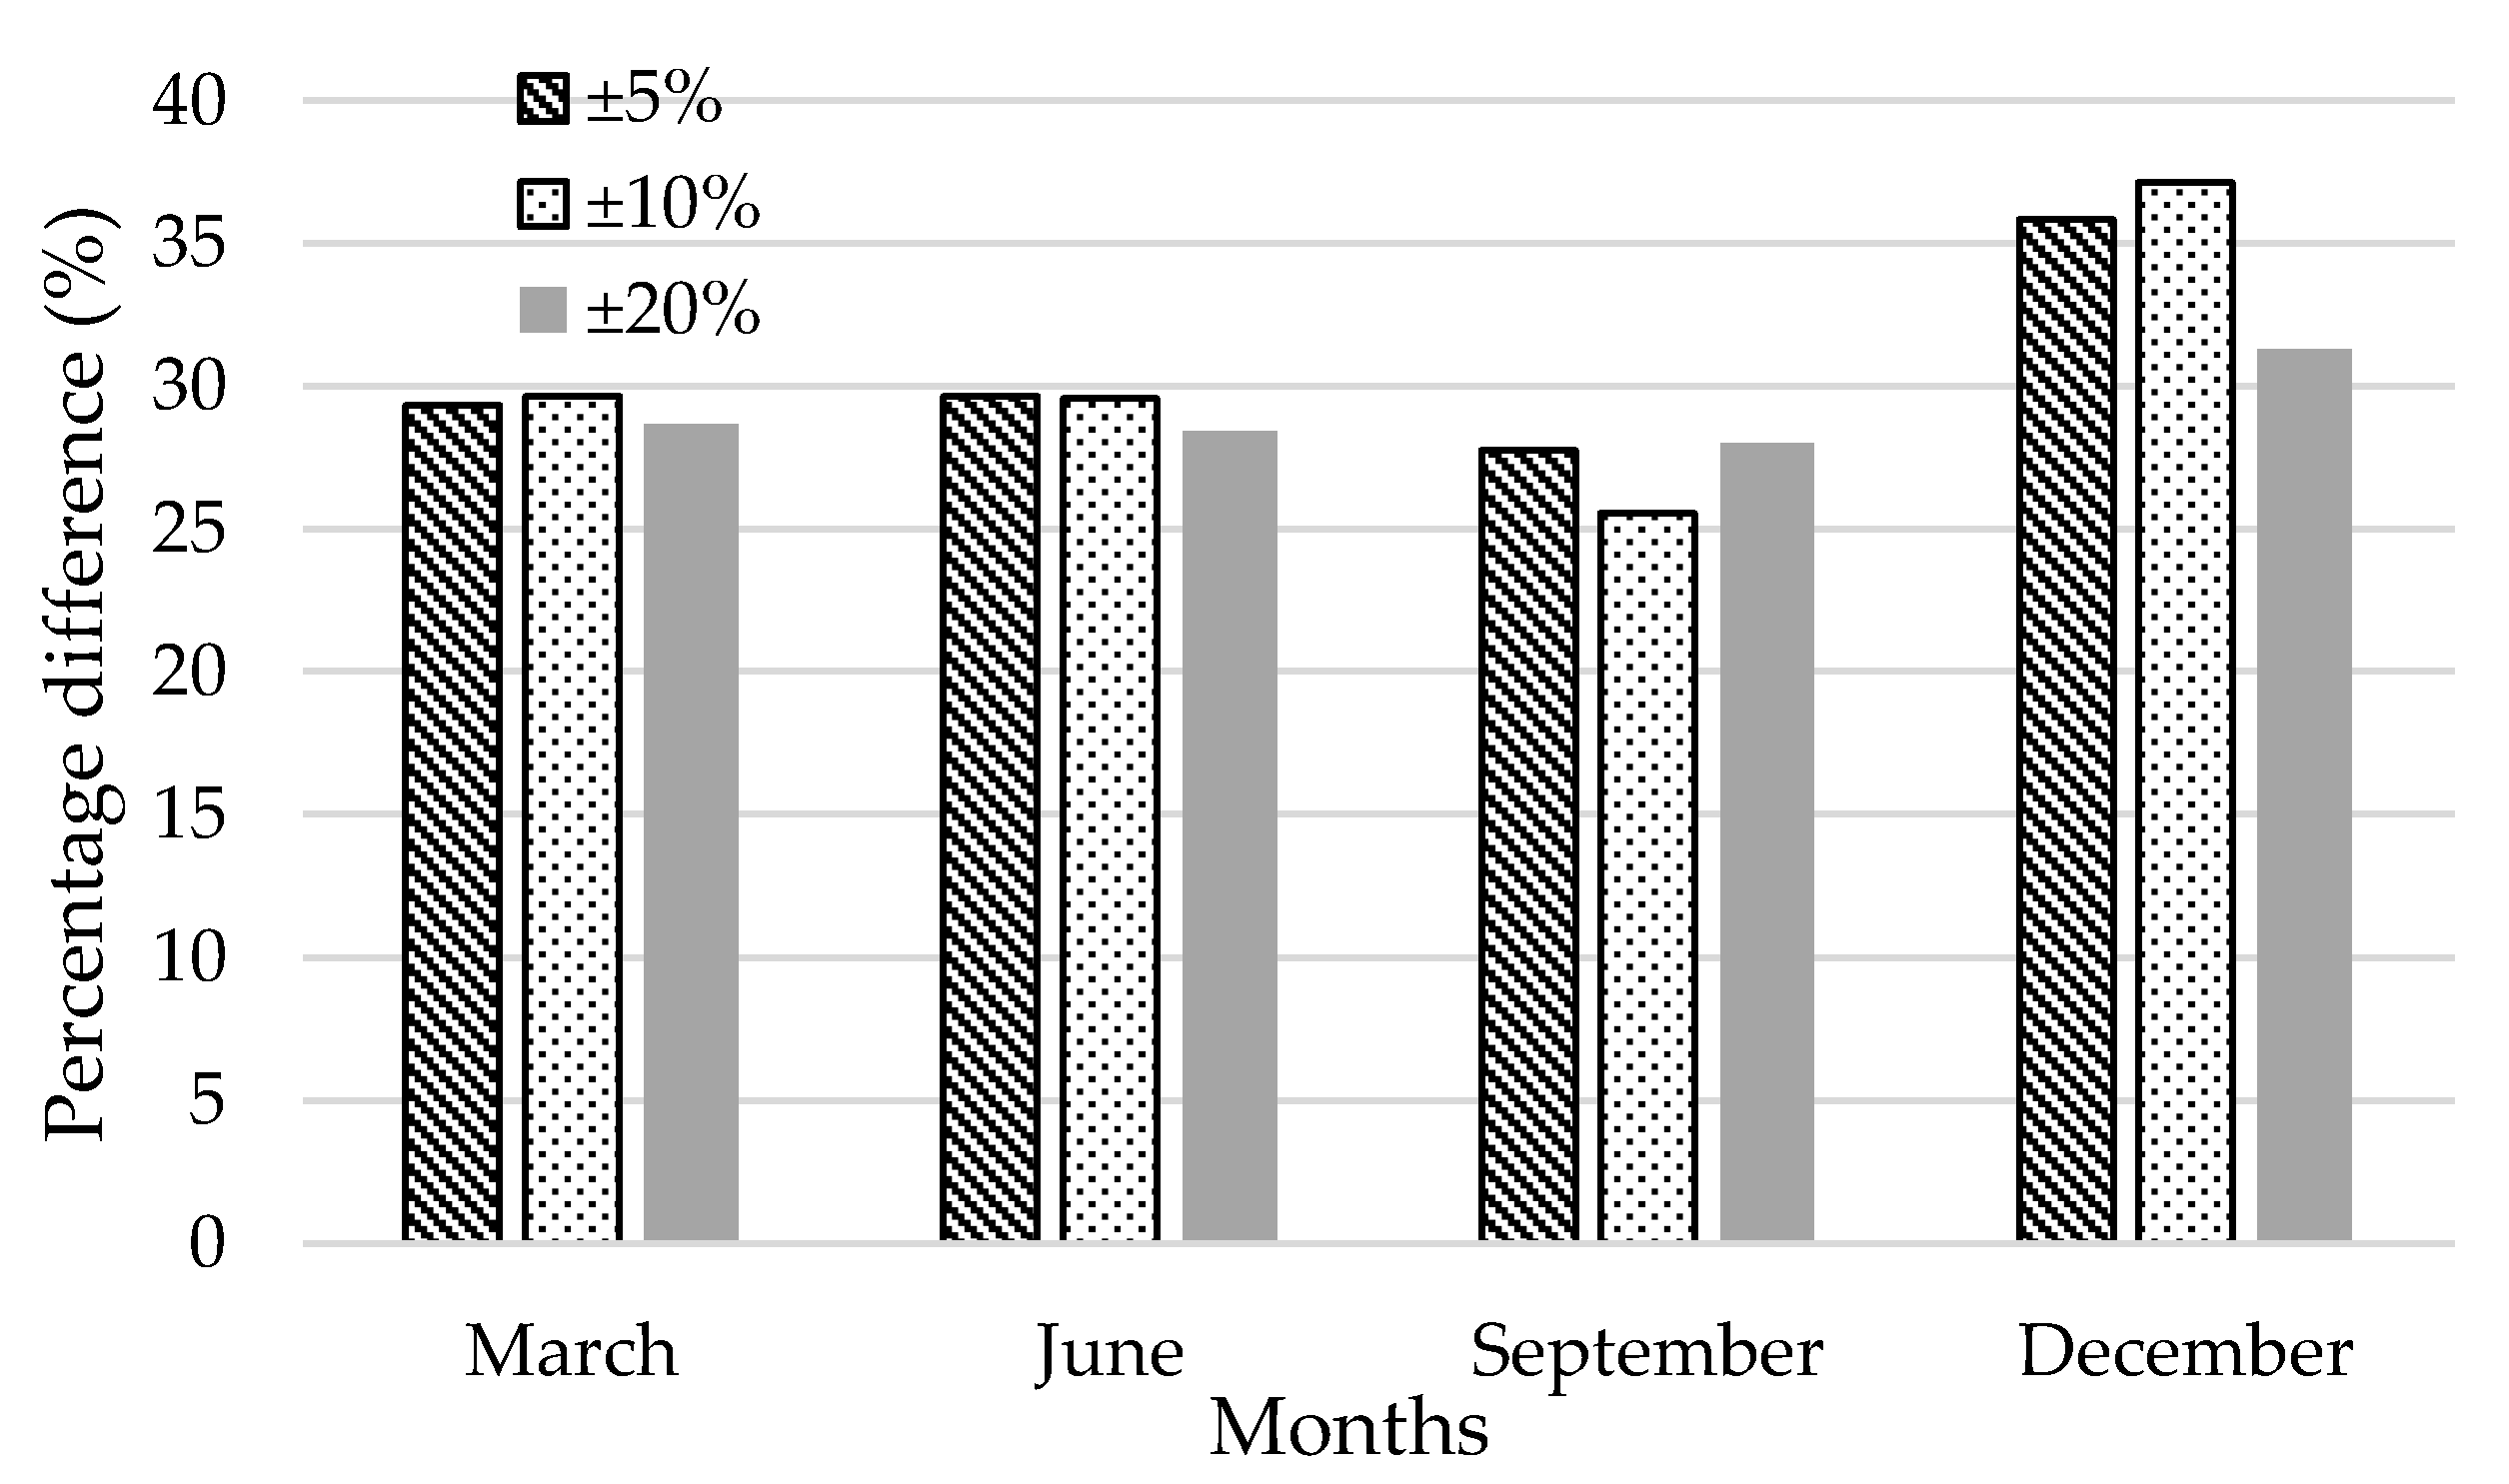
4.3. Case Study and Discussion

In order to demonstrate the efficiency of the PV curtailment gradation cost applied optimal algorithm, we compared the proposed and conventional methods when solar power generation had errors. In [17], according to historical data, PV generation error is always within nominal values at the generation period. In [33], a neural network prediction model predicted PV generation within the tolerance level of ±5%, ±10%, and ±20%. Therefore, in this case study, the PV data reflected the three levels of error tolerance and derived optimal scheduling for seven days in June, March, September, and December.
To verify the result of the proposed technique, Table 5 shows the optimal operating cost of the microgrid and the standard deviation of the PV curtailment when the error by the case is reflected in the PV power generation in the selected seven days of microgrid scheduling. The optimal solution of the microgrid operation cost unit is KRW. Since the virtual cost of PV curtailment is added to the objective function, the configuration of the cost is diesel cost above the decimal point and PV curtailment virtual cost below the decimal point.
Figure 7 shows the weather during the seven days of March. In this case, PV generation tended to increase to its peak time every day and then decrease. The proposed method shows that curtailment was more uniformly performed during power generation time than the conventional method, which shows curtailment was rapidly increased and decreased during a day. Table 5 shows that the standard deviation of PV curtailment for the proposed method was recorded as being 26.64, 26.81, and 26.05 lower than the conventional method for ±5%, ±10%, and ±20% error-occurring situations, while the optimal operating costs of microgrids did not differ significantly for any error situations.
Figure 8 shows the scheduling results of the proposed technique for seven days of June. For the first three days, the proposed method shows that the curtailment was distributed in the solar power generation time zone. On the other hand, the existing method shows that curtailment was concentrated in the early and late generation time of the day; thus, ESS was rapidly charged and discharged at a time when the curtailment was rapidly reduced and increased. On the fourth and sixth day, when PV was less generated, PV generation was not curtailed. With no significant change in power consumption from the previous day, day 5 PV generation peaked, and curtailment was shown to be more distributed over power generation time in the proposed method than in the conventional method. In the case of day 7, PV generation was partially reduced during the daytime compared with graphs of one, two, or three days. The proposed method shows that curtailment was distributed both before and after the partial decrease in photovoltaic power generation during the daytime, while, the conventional method resulted in a rush of curtailments before PV generation was partially reduced. The standard deviation of PV curtailment was 22.55, 22.43, and 21.15 lower than the conventional method for ±5%, ±10%, and ±20% error-occurring situations, respectively.
Figure 9 shows the results of the seven-day microgrid scheduling in September. On day 1, the curtailment of solar power was even during power generation in the proposed technique, while the existing method showed that the ESS had a rapid charge in the early hours and a rapid discharge in the afternoon due to a sharp decrease in curtailment. Since the second day, solar power generation was entirely less than electricity consumption, showing that little current occurred only on day 6. The standard deviation of PV curtailment in September was 8.73, 8.07, and 8.91 lower than the conventional method for ±5%, ±10%, and ±20% error-occurring situations, respectively.
Figure 10 shows the scheduling for seven days in October, and it shows the results under various weather conditions. PV curtailment was performed with surplus solar power on days 1, 2, 3, 5, and 6, and PV curtailment was not performed on days 4 and 7. The proposed method on days 1, 2, and 3 shows that the PV curtailment took place at power generation time, while the conventional method shows that the curtailment of photovoltaic power was concentrated at a certain time, resulting in rapid PV power control. Similarly, PV generation was more evenly performed during power generation in the proposed method than the conventional method on day 5 and day 6. When ±5%, ±10%, and ±20% errors were reflected in the photovoltaic generation, the proposed technique recorded standard deviations that were 16.7, 17.26, and 14.23 lower, respectively.
In the proposed method, the standard deviation results were lower than those of the conventional method in all months when PV generation error was reflected. Figure 11 shows the difference between the proposed and conventional methods in the standard deviation of curtailment. In March and June, the proposed method recorded about a 29% lower standard deviation than the conventional method in ±5% and ±10% error situations, and about 28% lower standard deviation in ±20% error situations. In September, the standard deviation percentage difference was recorded as being lower than other months for all error cases. In ±10% error situations, the standard deviation was recorded as being 25% lower compared with the conventional method, and in ±5% and ±10% error situations were recorded as being 28% of the percentage difference between the proposed and conventional methods. In December, the standard deviation in the proposed method showed the largest difference compared with the conventional method. In ±10% error situations, the standard deviation of the proposed method was recorded as being 37% lower than the conventional method, and in ±5% error, the standard deviation of the proposed method was 35% lower, while in ±20% error situations, the proposed technique was 31% lower than the conventional method.
In the case study, the Hawaii microgrid test only has a water pump and a UPS that consumes constant power and has little change in load power consumption for 24 hours. Therefore, only the uncertainty of PV power generation was considered. In a future study, more load will be connected to the microgrid, and the research will be conducted considering the uncertainty of the load power consumption. Additionally, a detailed ESS gradation model considering cycle deintercalation research was conducted in [27]. Although the current study did not reflect the lifetime performance of ESS in scheduling, a future study plans to create a microgrid schedule that reflects the performance of ESS.

5. Conclusions

In this study, an optimization method was proposed to enhance the PV power curtailment in an islanded microgrid. It was shown that the curtailment of PV power DER is usually concentrated in a specific period within the day. This trend adversely affects the ESS lifetime and increases the operation cost. The proposed optimization method aimed to evenly distribute the PV power curtailment within the day. It responded to uncertainty in predicting the PV power generation in an islanded microgrid via scheduling the microgrid’s assets—namely, ESS, diesel generator, and PV systems. System modeling for simulation was constructed using real water pump data from the Natural Energy Laboratory of Hawaii Authority (NELHA) microgrid test site. The cost coefficients of the curtailed PV power were included in the objective function. After adding differential cost coefficients for each curtailment section, the objective function was incorporated with curtailment penalty cost to prevent excess curtailment. The simulation results show that the PV curtailment trend was distributed over the operation hours rather than concentrated in a specific period. The simulation test was conducted for 7 days of June; the outcome demonstrated that the optimized schedule system worked not only for a specific day, but also various PV generation environments operated the microgrid assets more safely.

Author Contributions

Methodology, software and validation, W.-H.P.; writing—review and editing, W.-H.P., H.A., and M.B.G.; conceptualization and writing—original draft preparation, Y.-S.K. All authors have read and agreed to the published version of the manuscript.

Funding

This research was funded by Korea Electric Power Corporation (Grant number: R21XO01-34) in 2021.

Acknowledgments

This work was supported by Korea Electric Power Corporation (Grant number: R21XO01-34), the Korea Institute of Energy Technology Evaluation and Planning (KETEP), and the Ministry of Trade, Industry, and Energy (MOTIE) of Korea (Grant number: 20188550000410) in 2021.

Conflicts of Interest

The authors declare no conflict of interest.

Nomenclatures

t Index for operation time intervals
Ω T Set of time periods
l Index for linearized diesel generation cost slop
Ω L Set of diesel generation cost slopes
k Index for step curtailment cost slope
Ω k Set of step curtailment cost slope
P D , min / max Minimum/maximum output power of diesel generator
P ESS , max Maximum output power of energy storage system (ESS)
S O C min / max Minimum/maximum state of charge (SOC) of ESS
C A P Rating capacity of ESS
Δ t Duration of each time interval
a , b , c Cost coefficients of diesel generator
S l Slope rate of the diesel generation cost
S k Cost coefficients of step curtailment
P D Output power of diesel generator
P ESS d i s / ESSc h g Discharge/charge output power of ESS
P PV Output power of photovoltaic (PV) generation system
P L Load demand power
U D Diesel generator ON/OFF status
U Ed / Ec ESS discharging/charging status
η ESS d i s / ESS c h g ESS discharging/charging status

References

  1. Robert Rapier, Renewable Energy Growth Continues at a Blistering Pace, Forbes. 2 August 2020. Available online: https://www.forbes.com/sites/rrapier/2020/08/02/renewable-energy-growth-continues-at-a-blistering-pace/?sh=38b874c676b6 (accessed on 6 August 2021).
  2. IEA. Renewable Energy Market Update 2021; IEA: Paris, France, 2021; Available online: https://www.iea.org/reports/renewable-energy-market-update-2021 (accessed on 22 June 2021).
  3. Schermeyer, H.; Vergara, C.; Fichtner, W. Renewable energy curtailment: A case study on today’s and tomorrow’s congestion management. Energy Policy 2018, 112, 427–436. [Google Scholar] [CrossRef]
  4. Bird, L.; Cochran, J.; Wang, X. Wind and Solar Energy Curtailment: Experience and Practices in the United States; National Renewable Energy Laboratory: Denver, CO, USA, 2014. Available online: https://www.nrel.gov/docs/fy14osti/60983.pdf (accessed on 24 June 2021).
  5. Kim, R.-K.; Glick, M.B.; Olson, K.R.; Kim, Y.-S. MILP-PSO Combined Optimization Algorithm for an Islanded Microgrid Scheduling with Detailed Battery ESS Efficiency Model and Policy Considerations. Energies 2020, 13, 1898. [Google Scholar] [CrossRef] [Green Version]
  6. Hernandez-Aramburo, C.A.; Green, T.C.; Mugniot, N. Fuel Consumption Minimization of a Microgrid. IEEE Trans. Ind. Appl. 2005, 41, 673–681. [Google Scholar] [CrossRef] [Green Version]
  7. Khodaei, A. Microgrid Optimal Scheduling With Multi-Period Islanding Constraints. IEEE Trans. Power Syst. 2014, 29, 1383–1392. [Google Scholar] [CrossRef]
  8. Wen, Y.; Chung, C.Y.; Liu, X.; Che, L. Microgrid Dispatch With Frequency-Aware Islanding Constraints. IEEE Trans. Power Syst. 2019, 34, 2465–2468. [Google Scholar] [CrossRef]
  9. Kobauashi, D.; Masuta, T.; Ohtake, H. Coordinated operation scheduling method for BESS and thermal generators based on photovoltaic generation forecasts released every several hours. In Proceedings of the 2017 IEEE Innovative Smart Grid Technologies-Asia (ISGT-Asia), Auckland, New Zealand, 4–7 December 2017. [Google Scholar]
  10. Bandyopadhyay, S.; Kumar, P.; Arya, V. Planning curtailment of renewable generation in power grids. In Proceedings of the Proceedings of the International Conference on Automated Planning and Scheduling, London, UK, 12–17 June 2016. [Google Scholar]
  11. Su, X.; Masoum, M.A.S.; Wolfs, P.J. Optimal PV Inverter Reactive Power Control and Real Power Curtailment to Improve Performance of Unbalanced Four-Wire LV Distribution Networks. IEEE Trans. Sustain. Energy 2014, 5, 967–977. [Google Scholar] [CrossRef]
  12. Bitaraf, H.; Rahman, S. Reducing Curtailed Wind Energy Through Energy Storage and Demand Response. IEEE Trans. Sustain. Energy 2018, 9, 228–236. [Google Scholar] [CrossRef]
  13. Yi, J.; Lyons, P.F.; Davison, P.J.; Wang, P.; Taylor, P.C. Robust Scheduling Scheme for Energy Storage to Facilitate High Penetration of Renewables. IEEE Trans. Sustain. Energy 2016, 7, 797–807. [Google Scholar] [CrossRef]
  14. Albadi, M.; El-Saadany, E. Comparative study on impacts of wind profiles on thermal units scheduling costs. IET Renew. Power Gener. 2010, 5, 26–35. [Google Scholar] [CrossRef]
  15. Liu, G.; Starke, M.; Xiao, B.; Tomsovic, K. Robust optimisation-based microgrid scheduling with islanding constraints. IET Gener. Transm. Distrib. 2017, 11, 1820–1828. [Google Scholar] [CrossRef]
  16. Qiu, H.; Gu, W.; You, F. Bilayer Distributed Optimization for Robust Microgrid Dispatch With Coupled Individual-Collective Profits. IEEE Trans. Sustain. Energy 2021, 12, 1525–1538. [Google Scholar] [CrossRef]
  17. Qiu, H.; Gu, W.; Xu, X.; Pan, G.; Liu, P.; Wu, Z.; Wang, L. A historical-correlation-driven robust optimization approach for microgrid dispatch. IEEE Trans. Smart Grid 2020, 12, 1135–1148. [Google Scholar] [CrossRef]
  18. Lee, J.; Lee, J.; Wi, Y.-M.; Joo, S.-K. Stochastic wind curtailment scheduling for mitigation of short-term variations in a power system with high wind power and electric vehicle. Appl. Sci. 2018, 8, 1684. [Google Scholar] [CrossRef] [Green Version]
  19. Hodge, B.-M.; Orwig, K.; Milligan, M. Examining Information Entropy Approaches as Wind Power Forecasting Performance Metrics; National Renewable Energy Lab. (NREL): Golden, CO, USA, 2012. [Google Scholar]
  20. Zhang, J.; Hodge, B.-M.; Florita, A.; Lu, S.; Hamann, H.F.; Banunarayanan, V. Metrics for Evaluating the Accuracy of Solar Power Forecasting; National Renewable Energy Lab. (NREL): Golden, CO, USA, 2013. [Google Scholar]
  21. Lyzwa, W.; Wierzbowski, M.; Olek, B. MILP formulation for energy mix optimization. IEEE Trans. Ind. Inform. 2015, 11, 1166–1178. [Google Scholar] [CrossRef]
  22. Jooshaki, M.; Abbaspour, A.; Fotuhi-Firuzabad, M.; Moeini-Aghtaie, M.; Lehtonen, M. MILP model of electricity distribution system expansion planning considering incentive reliability regulations. IEEE Trans. Power Syst. 2019, 34, 4300–4316. [Google Scholar] [CrossRef] [Green Version]
  23. Approximate Diesel Fuel Consumption Chart. Available online: https://www.generatorsource.com/Diesel_Fuel_Consumption.aspx (accessed on 8 September 2021).
  24. Wood, A.J.; Wollenberg, B.F.; Sheblé, G.B. Power Generation, Operation, and Control; John Wiley & Sons: Hoboken, NJ, USA, 2014. [Google Scholar]
  25. Lee, H.-L.; Chun, Y.-H. Using piecewise linearization method to PCS input/output-efficiency curve for a stand-alone microgrid unit commitment. Energies 2018, 11, 2468. [Google Scholar] [CrossRef] [Green Version]
  26. Wouters, C.; Fraga, E.S.; James, A.M. An energy integrated, multi-microgrid, MILP (mixed-integer linear programming) approach for residential distributed energy system planning–a South Australian case-study. Energy 2015, 85, 30–44. [Google Scholar] [CrossRef] [Green Version]
  27. Park, K.-M.; Kim, J.-H.; Park, J.-Y.; Bang, S.-B. A Study on the Fire Risk of ESS through Fire Status and Field Investigation. Fire Sci. Eng. 2018, 32, 91–99. [Google Scholar] [CrossRef]
  28. Choi, S.; Min, S.-W. Optimal Scheduling and Operation of the ESS for Prosumer Market Environment in Grid-Connected Industrial Complex. IEEE Trans. Ind. Appl. 2018, 54, 1949–1957. [Google Scholar] [CrossRef]
  29. Cho, S.-M.; Kim, J.-S.; Kim, J.-C. Optimal Operation Parameter Estimation of Energy Storage for Frequency Regulation. Energies 2019, 12, 1782. [Google Scholar] [CrossRef] [Green Version]
  30. Goudarzi, A.; Li, Y.; Xiang, J. Efficient energy management of renewable resources in microgrids. In Renewable Energy Microgeneration Systems; Elsevier: Amsterdam, The Netherlands, 2021; pp. 285–321. [Google Scholar]
  31. Han, X.; Lu, L.; Zheng, Y.; Feng, X.; Li, Z.; Li, J.; Ouyang, M. A review on the key issues of the lithium ion battery degradation among the whole life cycle. ETransportation 2019, 1, 100005. [Google Scholar] [CrossRef]
  32. Barré, A.; Deguilhem, B.; Grolleau, S.; Gérard, M.; Suard, F.; Riu, D. A review on lithium-ion battery ageing mechanisms and estimations for automotive applications. J. Power Sources 2013, 241, 680–689. [Google Scholar] [CrossRef] [Green Version]
  33. Shah, A.A.; Ahmed, K.; Han, X.; Saleem, A. A Novel Prediction Error Based Power Forecasting Scheme for Real PV System using PVUSA Model: A Grey Box Based Neural Network Approach. IEEE Access 2021, 9, 87196–87206. [Google Scholar] [CrossRef]
Figure 1. Energy curtailment (a) distributed evenly among multiple time slots and (b) concentrated in a single time slot.
Energies 14 06038 g001
Figure 2. NELHA Microgrid configuration (the photovoltaic (PV), the energy storage system (ESS), and Uninterruptible Power Supply system (UPS) are planned to be installed) [5].
Energies 14 06038 g002
Figure 3. (a) PV power curtailment interval setting and (b) differential cost coefficients.
Energies 14 06038 g003
Figure 4. Flowchart of solving mixed-integer linear programming (MILP) with virtual PV curtailment gradation cost.
Energies 14 06038 g004
Figure 5. Microgrid optimal scheduling results comparison of curtailment gradation cost method (a) with linear curtailment cost method (b).
Energies 14 06038 g005
Figure 6. Comparison of PV curtailment scheduling with proposed curtailment gradation cost result (a) and conventional linear curtailment cost result (b).
Energies 14 06038 g006
Figure 7. Simulation results of proposed method (a) and conventional method (b) for 7 days of March.
Energies 14 06038 g007
Figure 8. Simulation results of proposed method (a) and conventional method (b) for 7 days of June.
Energies 14 06038 g008aEnergies 14 06038 g008b
Figure 9. Simulation results of proposed method (a) and conventional method (b) for 7 days of September.
Energies 14 06038 g009
Figure 10. Simulation results of proposed method (a) and conventional method (b) for 7 days of December.
Energies 14 06038 g010
Figure 11. Differences in the PV curtailment standard deviation of the conventional method based on the proposed method.
Energies 14 06038 g011
Table 1. Slope rate of each diesel generation interval [5].
Interval P D , 1 P D , 2 P D , 3 P D , 4 P D , 5 P D , 6 P D , 7 P D , 8 P D , 9 P D , 10
Slope rate
(KRW/kWh)
217.3231.8246.4260.9275.5290.0304.6319.1333.7348.2
Table 2. Slope rate of each PV curtailment interval.
Interval S 1 S 2 S 3 S 4 S 5 S 6 S 7 S 8 S 9 S 10
Curtailment cost
coefficients
1E-52E-53E-54E-55E-56E-57E-58E-59E-510E-5
Table 3. Optimal PV curtailment scheduling results during generation time.
TimeCurtailment (kW) Curtailment (kW)
Proposed MethodConventional MethodTimeProposed MethodConventional Method
8:0021812:45180313
8:15604813:00180311
8:30686813:15180306
8:45878713:30180313
9:0011811813:45180303
9:1512014814:00180272
9:3019217114:15180170
9:4518018414:3018025
10:0018021114:4518049
10:1518022915:0018023
10:3024017615:151800
10:4518026815:302710
11:0019427515:4518060
11:1518028716:001770
11:3018029616:151710
11:4518030416:30960
12:0018030716:45600
12:1518032917:00370
12:3024031017:1500
Table 4. Comparison of proposed and conventional method results.
Optimal Cost
(KRW/Day)
Curtailment
Standard Deviation
Proposed method2,242,79585.75
Conventional method2,242,795110.98
Table 5. Optimal microgrid scheduling results during generation time.
Optimal Solution of Microgrid Operation Cost (KRW)Curtailment Standard Deviation
±5%±10%±20%±5%±10%±20%
MarchProposed method15,709,850.6215,706,037.7915,709,403.9190.8390.4890.85
Conventional method15,709,850.3715,706,037.5515,709,403.66117.47117.29116.90
JuneProposed method15,720,649.0115,727,001.915,733,890.3576.0675.8474.44
Conventional method15,720,648.8415,727,001.7715,733,890.1898.6198.2795.59
SeptemberProposed method16,312,087.0216,317,394.416,300,945.9331.4431.5831.81
Conventional method16,312,086.9916,317,394.3916,300,945.9040.1739.6540.72
DecemberProposed method16,111,120.1416,108,491.316,124,666.0246.6146.4945.50
Conventional method16,111,120.0816,108,491.1916,124,665.9763.3163.7559.73
Publisher’s Note: MDPI stays neutral with regard to jurisdictional claims in published maps and institutional affiliations.

