Article

Fuel Reactor CFD Multiscale Modelling in Syngas-Based Chemical Looping Combustion with Ilmenite

by
Vlad-Cristian Sandu
,
Ana-Maria Cormos
* and
Calin-Cristian Cormos
Faculty of Chemistry and Chemical Engineering, Babeș-Bolyai University, Arany Janos 11, RO-400028 Cluj-Napoca, Romania
*
Author to whom correspondence should be addressed.
Energies 2021, 14(19), 6059; https://doi.org/10.3390/en14196059
Submission received: 13 August 2021 / Revised: 14 September 2021 / Accepted: 20 September 2021 / Published: 23 September 2021

Abstract

:
As global power generation is currently relying on fossil fuel-based power plants, more anthropogenic CO2 is being released into the atmosphere. During the transition period to alternative energy sources, carbon capture and storage seems to be a promising solution. Chemical-looping combustion (CLC) is an energy conversion technology designed for combustion of fossil fuel with advantageous carbon capture capabilities. In this work, a 1D computational fluid dynamics (CFD) multiscale model was developed to study the reduction step in a syngas-based CLC system and was validated using literature data ( R = 0.99 ). In order to investigate mass transfer effects, flow rate and particle dimension studies were carried out. Sharper mass transfer rates were seen at lower flow rates and smaller granule sizes due to suppression of diffusion limitations. In addition, a 3D CFD particle model was developed to investigate in depth the reduction within an ilmenite particle, with focus on heat transfer effects. Minor differences of 1 K were seen when comparing temperature changes predicted by the two models during the slightly exothermic reduction reaction with syngas.

1. Introduction

The climate is changing at an alarmingly rapid rate as a consequence of increasing concentrations of greenhouse gases in the atmosphere. Most anthropogenic CO2 emissions are a result of energy production based on fossil fuels. Ideally, a switch from fossil fuel-based energy production to energy production using non-fossil and other renewable sources would considerably reduce CO2 emissions. However, during this transition period, fossil fuels will continue to be the dominant global energy source [1].
A solution that enables fossil fuel usage, while mitigating CO2 emissions, is carbon capture and storage (CCS). CCS is the process through which CO2 is captured at large industrial process facilities, transported to a storage site, and injected into rock formations for permanent storage. Conventional CO2 separation techniques from diluted streams lead to significant additional energy costs and decrease in overall power efficiency [2]. This drawback can be overcome by chemical-looping combustion (CLC) [3].
CLC enables fuel combustion capable of producing a pure CO2 exhaust stream at reduced energy penalties, achieved by avoiding direct contact between air and fuel, essentially circumventing the need to separate CO2 and N2 from the flue gas [4]. In CLC, a solid oxygen carrier (OC) (metal/metal oxide) acts as an intermediate between alternating oxidation and reduction reactions taking place in different reactors [5]. During oxidation, the OC reacts with air and forms an oxidized solid, producing heat, while during reduction, the oxidized OC reacts with fuel producing CO2 and water. Following separation of water by condensation, a pure stream of CO2 is obtained. The same amount of heat is released from CLC as from traditional combustion [6].
Conventionally, CLC takes place in an interconnected system of fluidized beds. The two reactors are an air reactor (a riser), where oxidation takes place, and a fuel reactor (a bubbling fluidized bed), where reduction takes place [7]. Drawbacks of the system are related to OC transportation due to additional energy requirements, as well as a challenging gas–particle separation at the high pressures and temperatures of the system [8].
A different approach on CLC was proposed by Noorman et al. [9], where the system uses a fixed bed reactor configuration with stationary OC. The reactor is operated dynamically by switching the gas feed streams and the OC is periodically exposed to oxidizing or reducing conditions. The main benefit to such a concept is circumventing the need for gas-particle separation due to the stationary nature of the OC. In order to mimic a continuous process, two separate parallel reactors are required [10].
This paper presents numerical modelling and simulation work supported by experimental validation with the goal of investigating the process dynamics of a fuel reactor taking part in a syngas-based CLC system. Figure 1 shows a graphical representation of the fuel reactor, as well as the three different fuel gases considered in simulations.
The novelty of the paper lies in the modelling work and results. A multiscale 1D model was developed to simulate the reduction step taking place in a CLC process with ilmenite, a titanium-iron oxide, as the oxygen carrier and was validated using breakthrough data published by Gallucci et al. [11]. Modelling work was simplified by only considering the iron component of the OC, leading to the following reduction reactions:
Fe 2 O 3 + H 2 2 FeO + H 2 O
Fe 2 O 3 + CO 2 FeO + CO 2
Subsequently, a study of the system dynamics was carried out to examine the effects of varying flow rates, as well as different particle dimensions. Furthermore, a 3D CFD model was developed to study the behavior of ilmenite particles during the reduction phase of a CLC process, with focus on heat transfer effects.

2. Materials and Methods

In order to accurately describe the behavior of a CLC system, it is crucial to understand the phenomena occurring during the reduction step. To this end, complex CFD models accounting for mass, energy, and momentum transport were developed using COMSOL Multiphysics.
A 1D multiscale model of a fuel reactor was developed to investigate combustion with syngas. The model accounts for macroscale interactions in the packed bed, represented by the bed length, a 1D space dimension, as well as interactions at the microscale within the particles, represented by the particle radius, and a 1D space dimension. A graphical representation of the model concept can be seen in Figure 2.
Moreover, the packed bed domain was considered homogenous and was modelled as porous media. Mass, momentum, and heat transfer equations were coupled together with reduction kinetics and solved numerically in space and time using the finite element method. Three different cases were considered for the gas feed composition: H2, CO, and syngas (Table 1).
The model was validated using H2 and CO breakthrough curves published by Gallucci et al. [11]. The experimental measurements were taken using a high temperature resistant steel packed bed reactor and a corresponding test rig. The lab-scale reactor could be operated at conditions of up to 1150 °C and 10 bar. Gas pre-heating to inlet temperature was carried out using ovens, while no additional heating systems were present in the reactor. By using 20 thermocouples installed at different axial positions inside the bed, as well as a mass spectrometry analysis at the reactor outlet, accurate measurement of the bed temperature and gas composition at the outlet was possible. To enable validation, the same operating conditions were considered in the simulations (Table 2). Reaction kinetics published by Parker [12] were used to simulate reduction with H2 and CO. An additional first order reaction rate was added to account for the carbon deposition observed to be occurring in the experimental measurements. Model predicted concentration profiles of the gas and solid, as well as bed temperature profiles, were investigated. Furthermore, sensitivity studies regarding flow rate and particle dimension were performed for reduction with syngas.
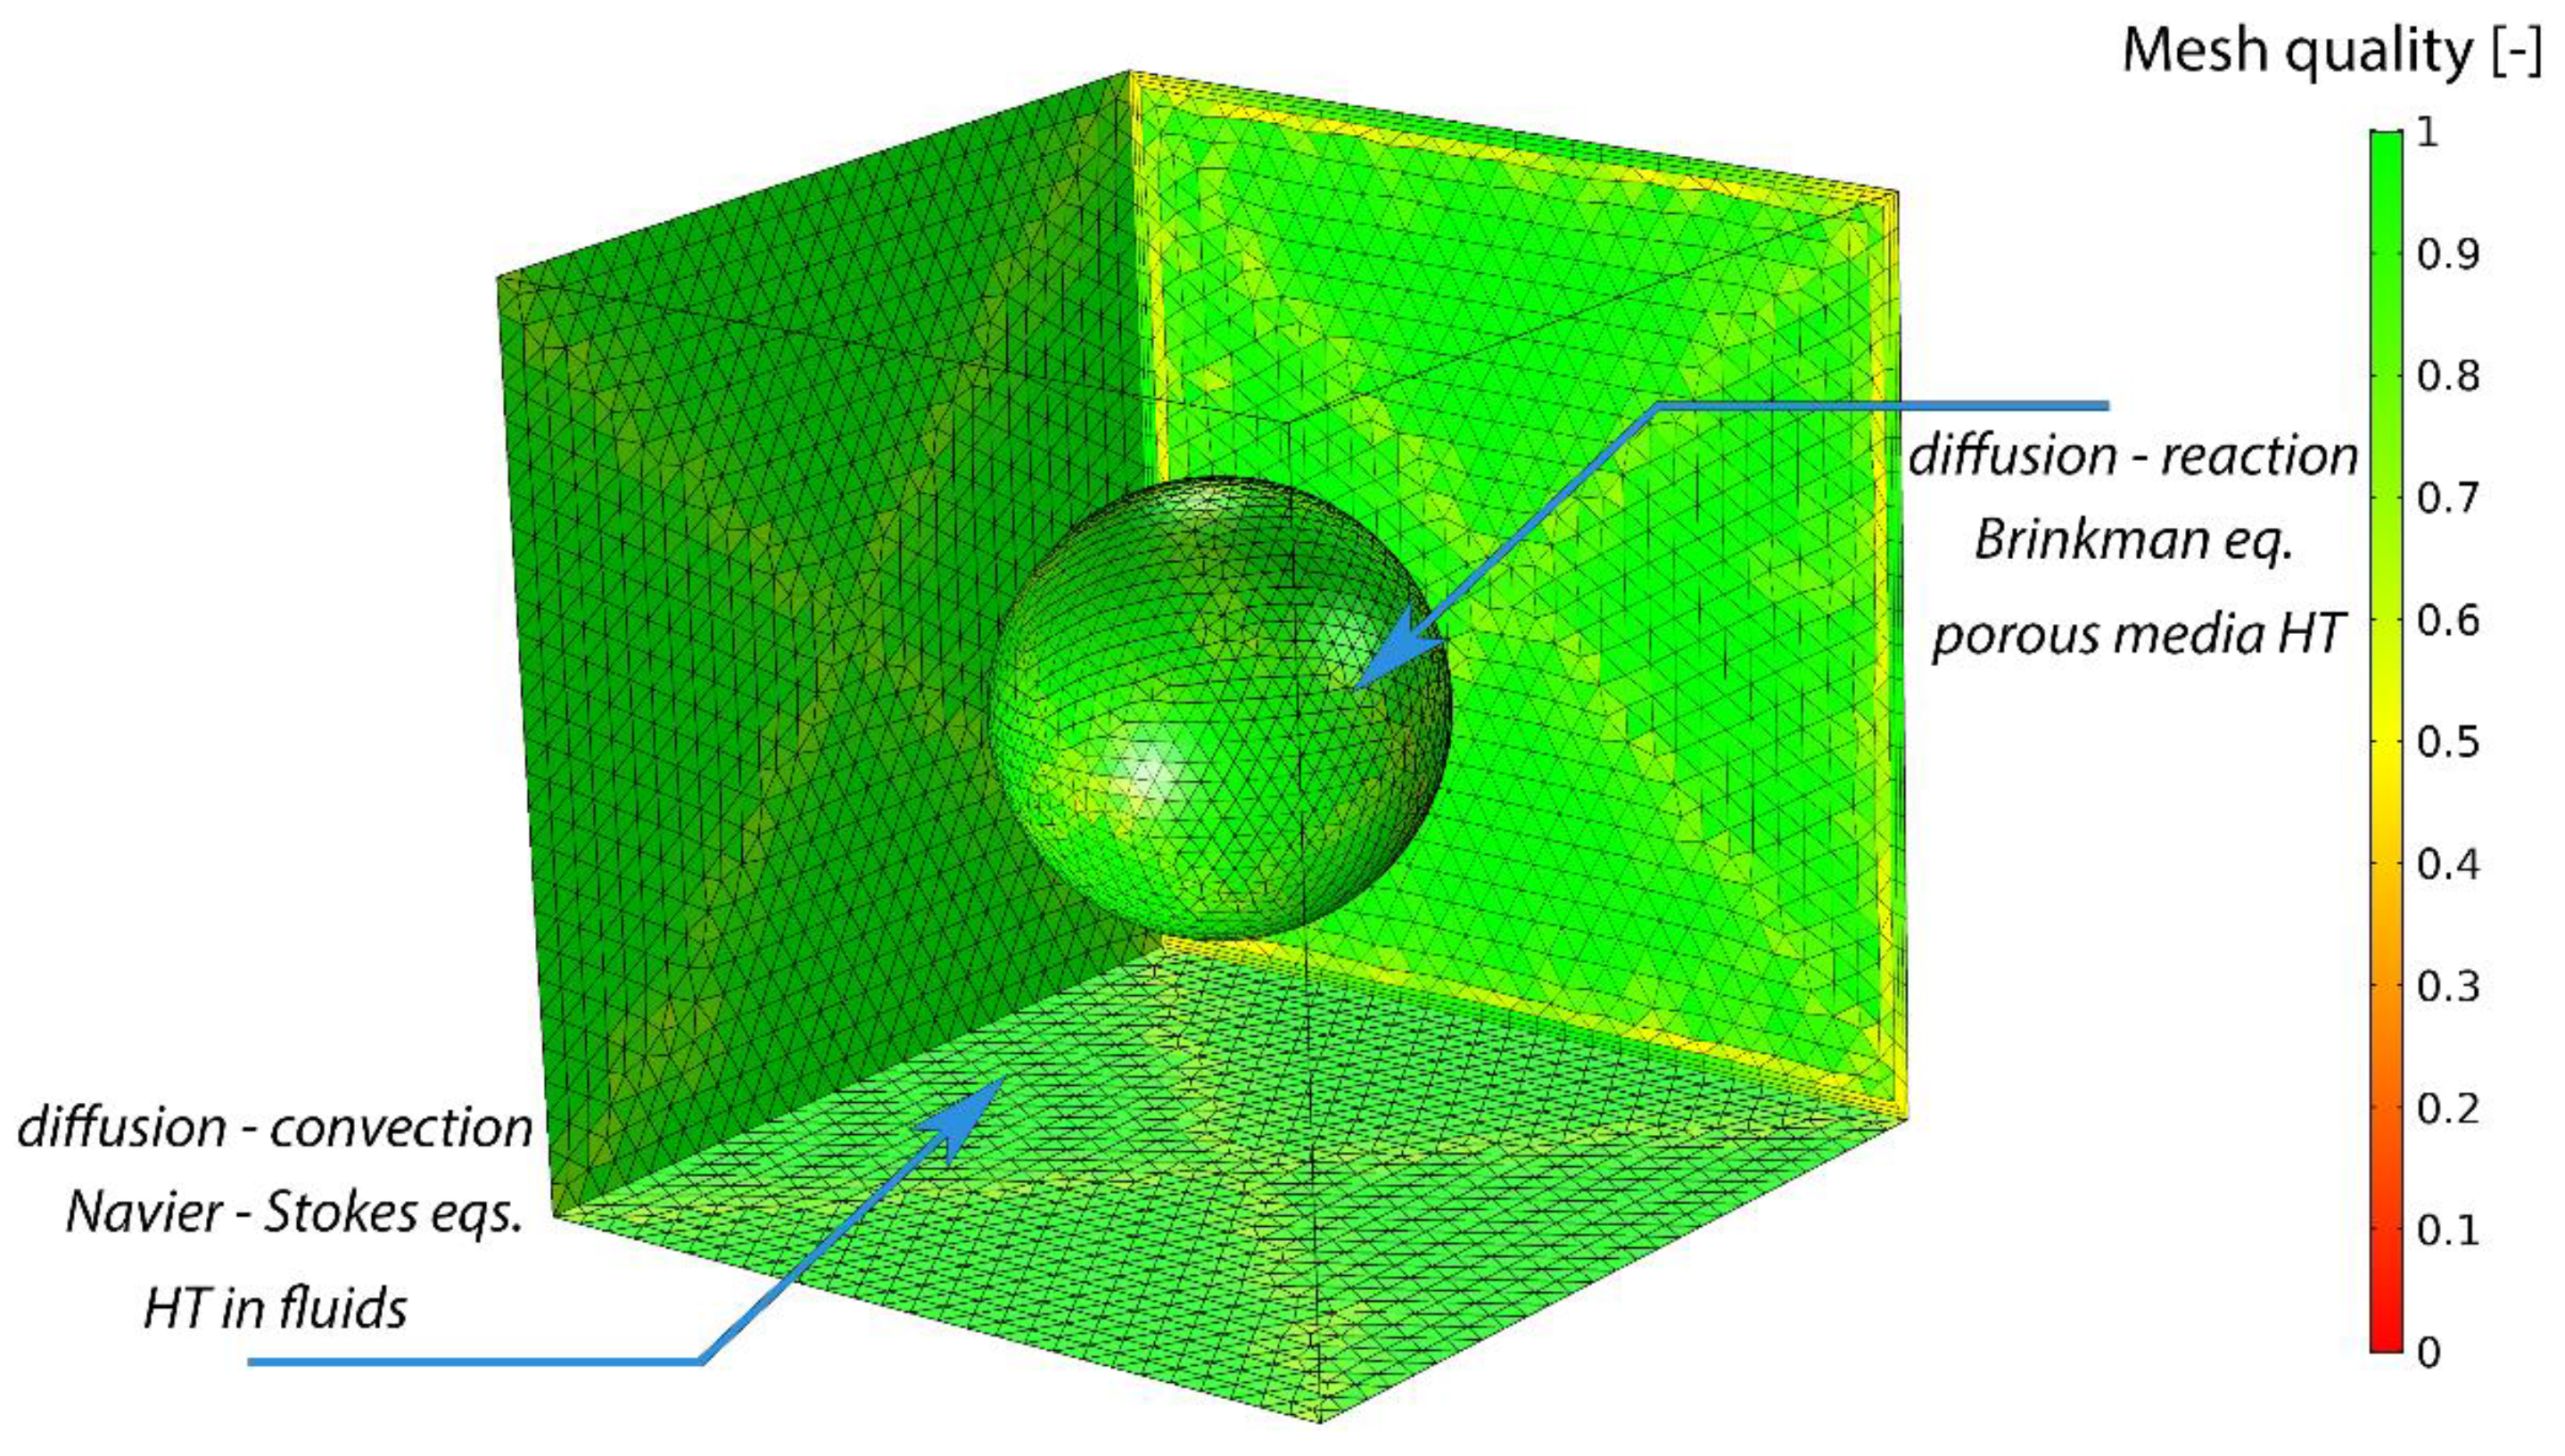
As the multiscale model had limitations regarding particle temperature behavior and could only predict an average particle temperature, a 3D CFD model was developed to better simulate the reduction reaction taking place within an ilmenite particle. The fluid domain was represented with a cube geometry, while the ilmenite particle domain was represented using a sphere (Figure 3). It was necessary to simulate in three dimensions of space due to the complexity of forced convection over a particle. The model accounted for mass, momentum, and heat transport. The flow regime was established to be laminar based on the calculated Reynolds number of 320. Fluid flow and heat transfer were initially simulated in stationary state, after which the solutions from the stationary study were passed on as initial values to be used in the transient study. During reduction, grain dimensions and particle porosity were assumed constant, meaning no change with solid composition in effective diffusivity of the gas within the particle. In addition to higher complexity in temperature prediction, momentum predictions were also enhanced, by describing the laminar fluid flow surrounding the particle and its effects over mass transport. The computational domain for fluid flow was considered as the void between the particles. The dimension of the fluid flow region was calculated by assuming evenly distributed pellets in the reactor bed. While the 3D single particle model had certain constraints, such as not being able to capture the underlying complexities of an entire packed bed of particles, the scope of the 3D single particle model was the in-depth analysis of the intraparticle phenomena occurring during the reduction reaction, with strong emphasis on heat transport related effects.
For both 1D multiscale and 3D particle models, the mesh was sufficiently refined until mesh convergence was achieved. Figure 3 displays the high quality of the mesh in terms of element skewness and the increased density of elements discretizing the particle domain. Additionally, the tolerance factor was tightened accordingly to guarantee solution accuracy.

2.1. Model Assumptions

Model assumptions are presented below:
  • the packed bed domain was considered homogenous;
  • the solid iron-based OC particles were considered stationary;
  • the reduction reaction occurred within the OC particles;
  • the OC particles were identical, with a spherical shape and constant radius;
  • diffusion was described using Fick’s law;
  • axial dispersion was considered;
  • compressible laminar fluid flow was considered;
  • there was no heat loss to the environment.

2.2. Model Equations

2.2.1. Continuity Equation

All equations were solved in transient state for both models. The expression for the continuity equation (Equation (3)) in both models was:
t ( ρ ) + · ( ρ u ) = 0
where ρ was fluid density and u was velocity.

2.2.2. Ergun’s Equation

The packed bed in the fuel reactor model was assumed to be a uniform porous domain filled with ilmenite OC granules. The distribution of pressure along the reactor length was solved with the differential form of Ergun’s equation (Equation (4)) [13]:
P x = 150 μ u D p e 2 · ( 1 ε b ) 2 ε b 3 + 1.75 ρ u 2 D p e · ( 1 ε b ) ε b 3
where ε b was bed voidage, D p e was pellet diameter and μ was fluid viscosity.

2.2.3. Navier-Stokes and Brinkman Equations

The particle model used the Navier–Stokes equations (Equation (5)) together with the continuity equation (Equation (3)) to solve laminar fluid flow surrounding the granule:
ρ u t + ρ ( u · ) u = · ( p I + τ )
where τ was the viscous stress tensor and was calculated with Equation (6):
τ = μ ( u + ( u ) T ) 2 3 μ ( · u ) I
The Brinkman equations (Equation (7)) were used to describe porous media flow in the laminar regime within the ilmenite particle:
1 ε p ρ u t + 1 ε p ρ ( u · ) u 1 ε p = · ( p I + 1 ε p τ ) μ κ
where ε p was particle porosity and κ was permeability.

2.2.4. Species Transport

The fuel reactor model solved a convection–diffusion equation (Equation (8)) to represent mass transport in the bed:
ε b · c i t D L , i 2 c i x 2 + u · c i x = 0
where c was the concentration in the bulk and D L was the axial dispersion coefficient estimated with a correlation for packed beds (Equation (9)), published by Wakao and Funazkri [14], based on the Reynolds, Peclet, and Schimdt numbers:
D L , i = ( 20 R e · S c + 1 2 ) · 2 · u i · r p
Mass transfer within the particle in the multiscale model was represented by diffusion of gas components as a result of a concentration gradient, as well as the reduction reaction between the OC solid and fuel. A diffusion–reduction reaction equation (Equation (10)) was solved along a dimensionless radial coordinate ranging from the center to the particle surface for each of the gas components:
4 π N { r 2 r p 2 ε p c p , i t + r ( r 2 D p e f f , i c p , i r ) = r 2 r p 2 R i }
and for the solid OC components (Equation (11)):
4 π N { r 2 r p 2 ( 1 ε p ) c p , i t = r 2 r p 2 R i }
where r was a dimensionless radial coordinate, r p was the particle radius, N was the number of granules per unit volume of bed, R was the reduction reaction rate described with kinetics published by Parker (Equations (21) and (22)) [12], and D p e f f was the effective diffusion coefficient within the particle calculated using the Millington and Quirk model (Equation (12)):
D p e f f , i = ε p 4 / 3 D p , i
The coupling between macroscale and microscale dimensions was achieved by assuming film resistance at the fluid–pellet interface, calculating the surface flux with Equation (13):
N i , i n w a r d = h D , i ( c i c p , i )
where h D , i was the mass transfer coefficient calculated with Equation (14):
h D , i = S h   D p , i r p
For the 3D particle model, mass transport in the fluid domain was described with a convection-diffusion equation (Equation (15)):
c i t + · ( D i c i ) + u · c i = 0
Within the particle, a diffusion–reduction reaction was used to describe mass transfer of the gas components (Equation (16)):
ε p c i t + · ( D p e f f , i c i ) = ε p R i
and for the solid OC components (Equation (17)):
( 1 ε p ) c i t = R i
Intraparticle diffusion (Equation (12)) and reaction rate (Equations (21) and (22)) were calculated with the same expressions as in the multiscale model. Film resistance at the fluid–particle interface was also accounted for and calculated with Equation (14).

2.2.5. Energy Transport

For both multiscale and particle models, a homogenized approach was chosen to describe heat transport by assuming the local thermal equilibrium hypothesis [15], meaning local fluid temperature was considered identical to porous media temperature and only one temperature variable needed to be computed at each spatial location in the domain. A single heat transfer equation was solved (Equation (18)):
( ρ C p ) e f f T t + ρ f C p , f u · T + · ( k e f f T ) = Q R
The effective material properties accounting for both fluid and porous domain properties were defined through volumetric averaging. As such, for effective heat capacity (Equation (19)):
( ρ C p ) e f f = ( 1 ε p ) ρ p C p , p + ε p ρ f C p , f
and for effective thermal conductivity (Equation (20)):
k e f f = ( 1 ε p ) k p + ε p k f
The external term Q R was either a heat source or sink term depending on the enthalpy of reaction and the gas composition chosen for reduction with the ilmenite OC.

2.2.6. Reduction Reaction Kinetics

For both multiscale and particle models, the kinetic model used to calculate the reduction reactions with the ilmenite OC was published by Abad et al. [16]. The model assumed process velocity was subject to reaction rate, neglecting mass transfer effects related to pellet-fluid film resistance and intraparticle diffusion, both of which were accurately described in the CFD models. The following equations, subsequently adjusted by Parker et al. [12], were used in this work for defining reduction with H2 (Equation (21)):
d n F e O d t = 142.153 e 7.81814 10 3 T m F e 2 O 3 2 / 3 m p 1 / 3 c H 2
and reduction with CO (Equation (20)):
d n F e O d t = 229.279 e 9.70652 10 3 T m F e 2 O 3 2 / 3 m p 1 / 3 c C O 0.8
Moreover, to highlight the carbon deposition effect observed in the experimental measurements by Gallucci et al. [11], a first order reaction rate as a function of CO concentration was added to the models (Equation (23)):
d c C O , d d t = k C O , d c C O
where k C O , d was the first order rate constant determined using published experimental data [11].

2.3. Model Parameters and Operating Conditions

In order to enable model validation, the parameters used in the models were taken from a paper in which Gallucci et al. [11] published experimental measurements of a syngas-based CLC process with ilmenite as OC. Process, operating, and geometry parameters are shown in Table 2.

3. Results and Discussion

3.1. Multiscale Model (1D)

3.1.1. Model Validation–Reduction with H2

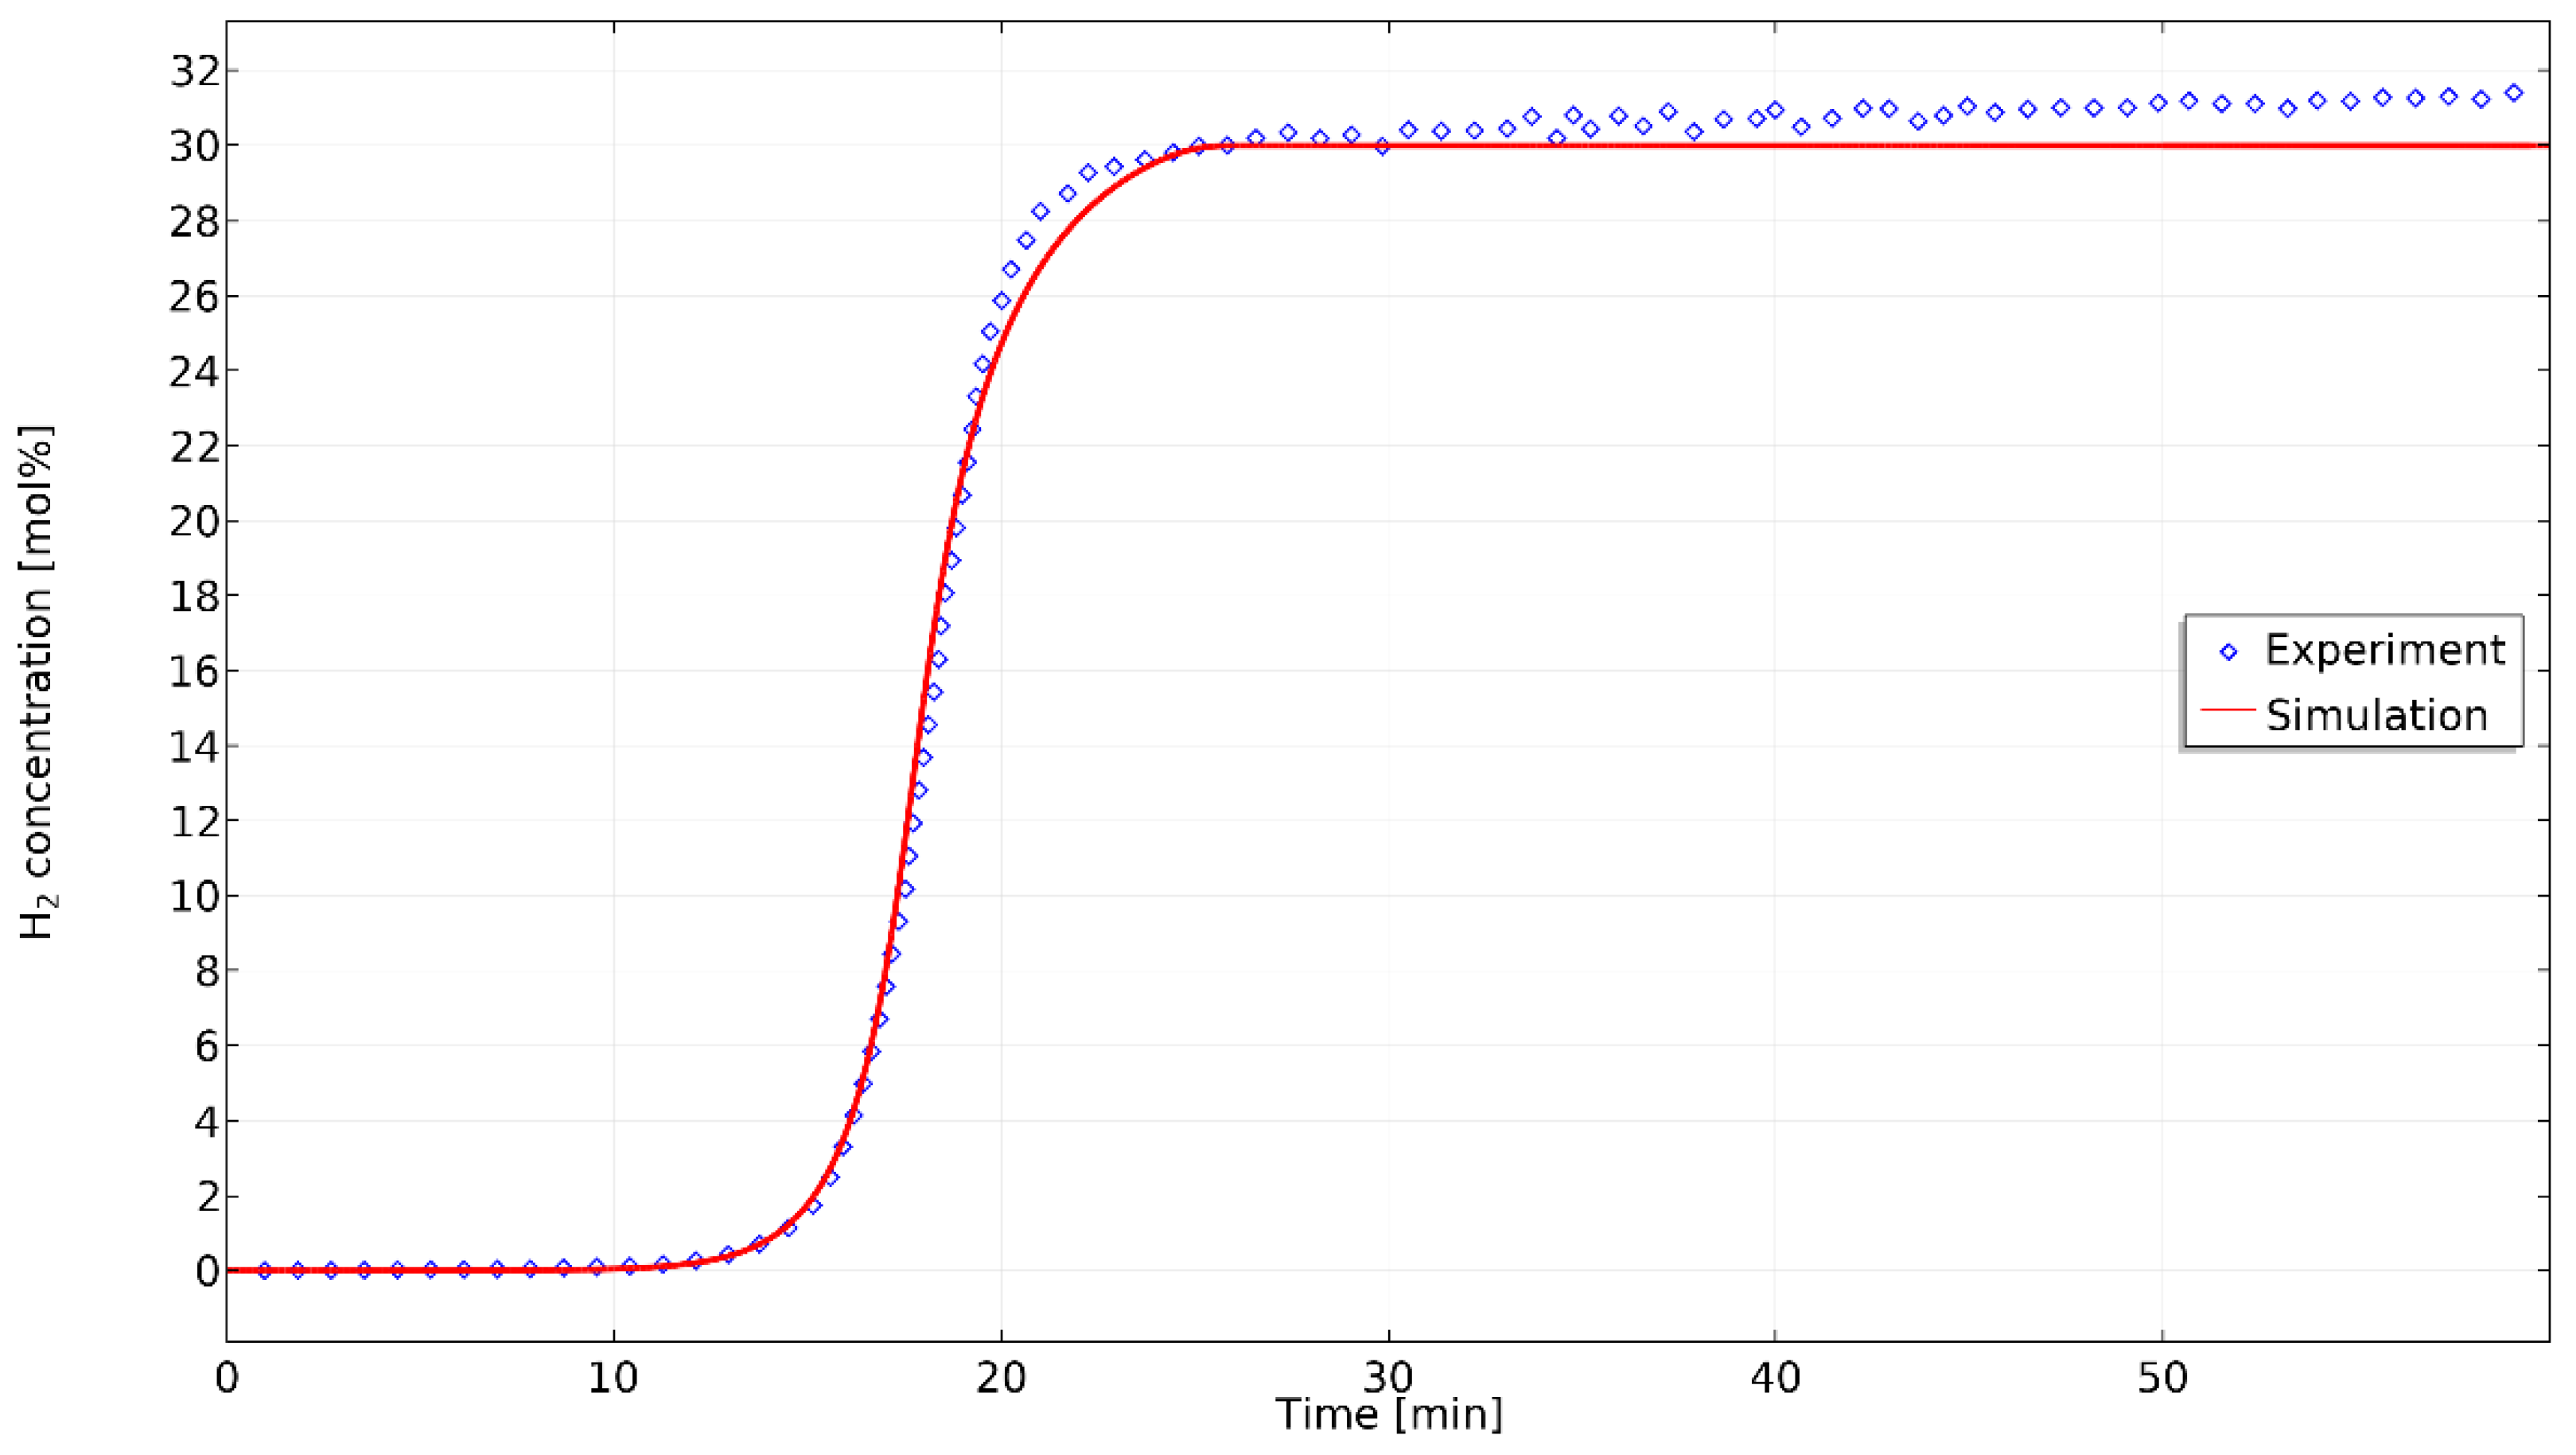
The model simulating iron-based OC reduction with H2 was validated using H2 breakthrough curves published by Gallucci et al. [11]. Figure 4 shows the comparison between experimental and model predicted H2 breakthrough curves.
It can be noticed that the experimental measurements showed an increase in H2 concentration over the feed concentration when steady state was reached. Gallucci et al. [11] reasoned that a steam–iron process was occurring during the experiments and led to some hydrogen being produced during reduction. While the steam–iron process was not accounted for in the model, a good agreement was seen between experimental and model predicted breakthrough curves when calculating the Pearson coefficient correlation ( R ) with a value of 0.9995.
Figure 5 shows H2 bulk concentrations and concentrations in the center of the iron-based OC particles represented as a function of reactor axial position at various simulation times.
The difference between H2 concentration in the bulk and center of the particle was attributed to mass transfer effects, such as film resistance at the fluid–particle interface and intraparticle diffusion. Furthermore, the iron-based OC was reduced as the H2 gas diffused further within the particle.
Figure 6 presents the change in concentration of Fe2O3 and FeO within four iron-based OC particles selected at different axial positions of 0.2 m, 0.4 m, 0.6 m, 0.8 m, and at a simulation time of 700 s. The normalized concentrations of Fe2O3 and FeO were represented as function of normalized particle radius. The normalized particle radius was defined as the ratio of the spatial radial coordinate in the particle to the particle radius, meaning that the particle modelling domain ranged from 0 (centre) to 1 (particle perimeter). The normalized concentrations of the oxides were calculated by dividing Fe2O3 concentration at simulation time by the initial concentration of Fe2O3 and by dividing FeO concentration at simulation time by the final concentration of FeO.
It can be noticed that Fe2O3 was fully converted to FeO and reduction had ended within the iron OC particle at 0.2 m, while the reduction reaction was still ongoing for the OC particles situated at 0.4 m and 0.6 m. In the case of the final OC particle at 0.8 m, the H2 gas had not reached the particle thus far and reduction had not occurred. The changes seen in Figure 6 can be correlated with the H2 concentration presented in Figure 5 at simulation time 700 s (green line).
Temperature profiles, predicted from the multiscale model during the reduction reaction of ilmenite with H2, are shown in Figure 7.
In their experimental measurements, Gallucci et al. [11] used G11 ilmenite particles with a weight percentage of 35% iron oxide and 65% titanium (see Table 2) and reported a rise in temperature during the reduction experiments with H2, meaning an exothermic reaction took place. This work considered only the iron component of the ilmenite OC to describe the reduction reactions (see Equations (1) and (2)) and the redox pair of FeO and Fe2O3 would have been normally used to describe an endothermic reaction with H2; however, in order to match the experimental measurements, the enthalpies of reaction of the redox pair of FeOTiO4 and Fe2TiO5 were selected to calculate change in temperature. Therefore, it can be noticed that the model predicted a temperature increase along the reactor length, from an initial temperature of 873 K, as a result of the exothermic reduction reaction of ilmenite with H2.

3.1.2. Model Validation–Reduction with CO

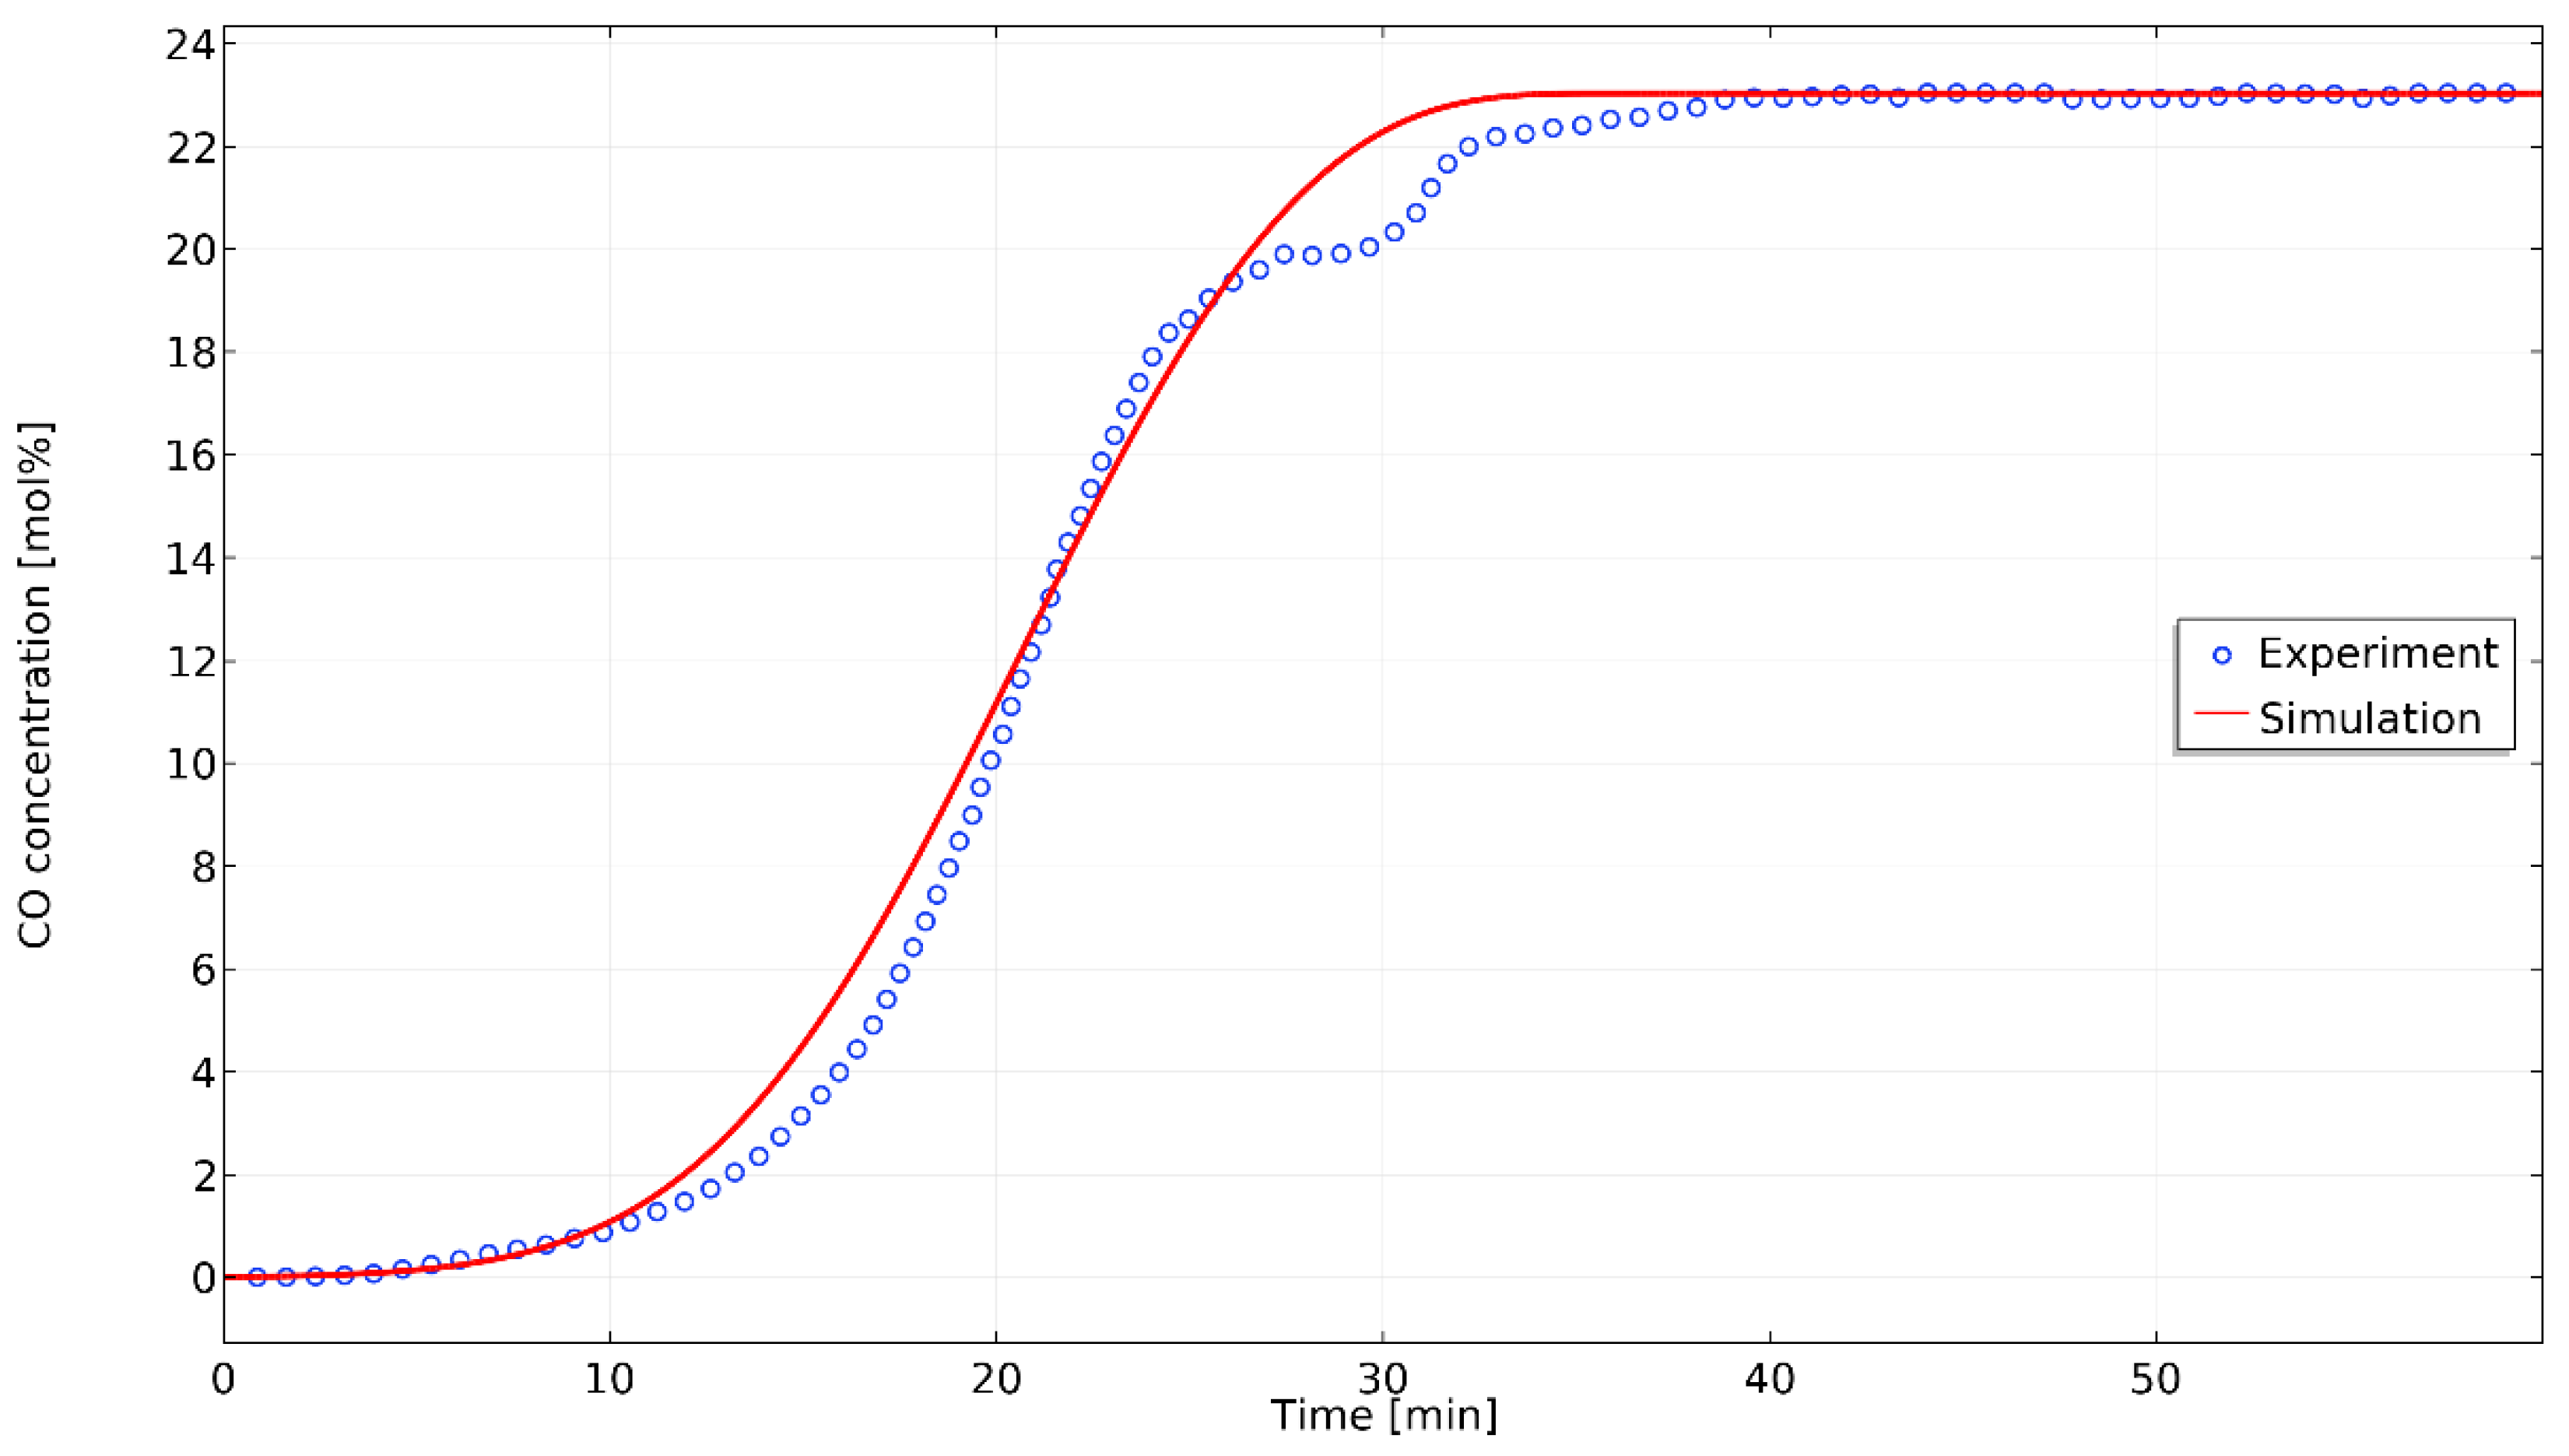
The model describing iron-based OC reduction with CO was validated using CO breakthrough curves published by Gallucci et al. [11]. Figure 8 shows the comparison between experimental and model predicted CO breakthrough curves.
The feed concentration of CO was 30 mol% (see Table 1, case 2), while the concentration at the outlet was 23 mol%. The supplementary consumption of CO was measured experimentally and was attributed to carbon deposition during the reduction reaction. Therefore, an additional first order reaction rate was added to the model to account for carbon deposition (Equation (23)). The slight misalignment of the lower section can be attributed to an overestimation of axial dispersion by the model. The reason for the deviation seen in the upper sections of the breakthrough curves was assumed to be due to the mass transfer limitations, unaccounted for by the first order reaction used to describe carbon deposition. Normally, operation of the CLC reactor should be performed in such a manner to suppress carbon deposition; for instance, adding steam to the syngas composition. The calculated Pearson correlation coefficient ( R ) of 0.9971 showed a good agreement between experimental and model predicted breakthrough curves.
Figure 9 presents CO concentrations in the bulk and in the center of the iron-based OC particles represented as a function of reactor axial position at various simulation times.
The concentrations in the bulk and at the center of the particle were close to overlapping, with a correlation coefficient ( R ) of 1, meaning the reaction rate was slow and the gas diffused quicker within the particle than reduction took place. Moreover, by comparing with the concentration profiles in Figure 5, H2 showed a higher reaction rate than CO.
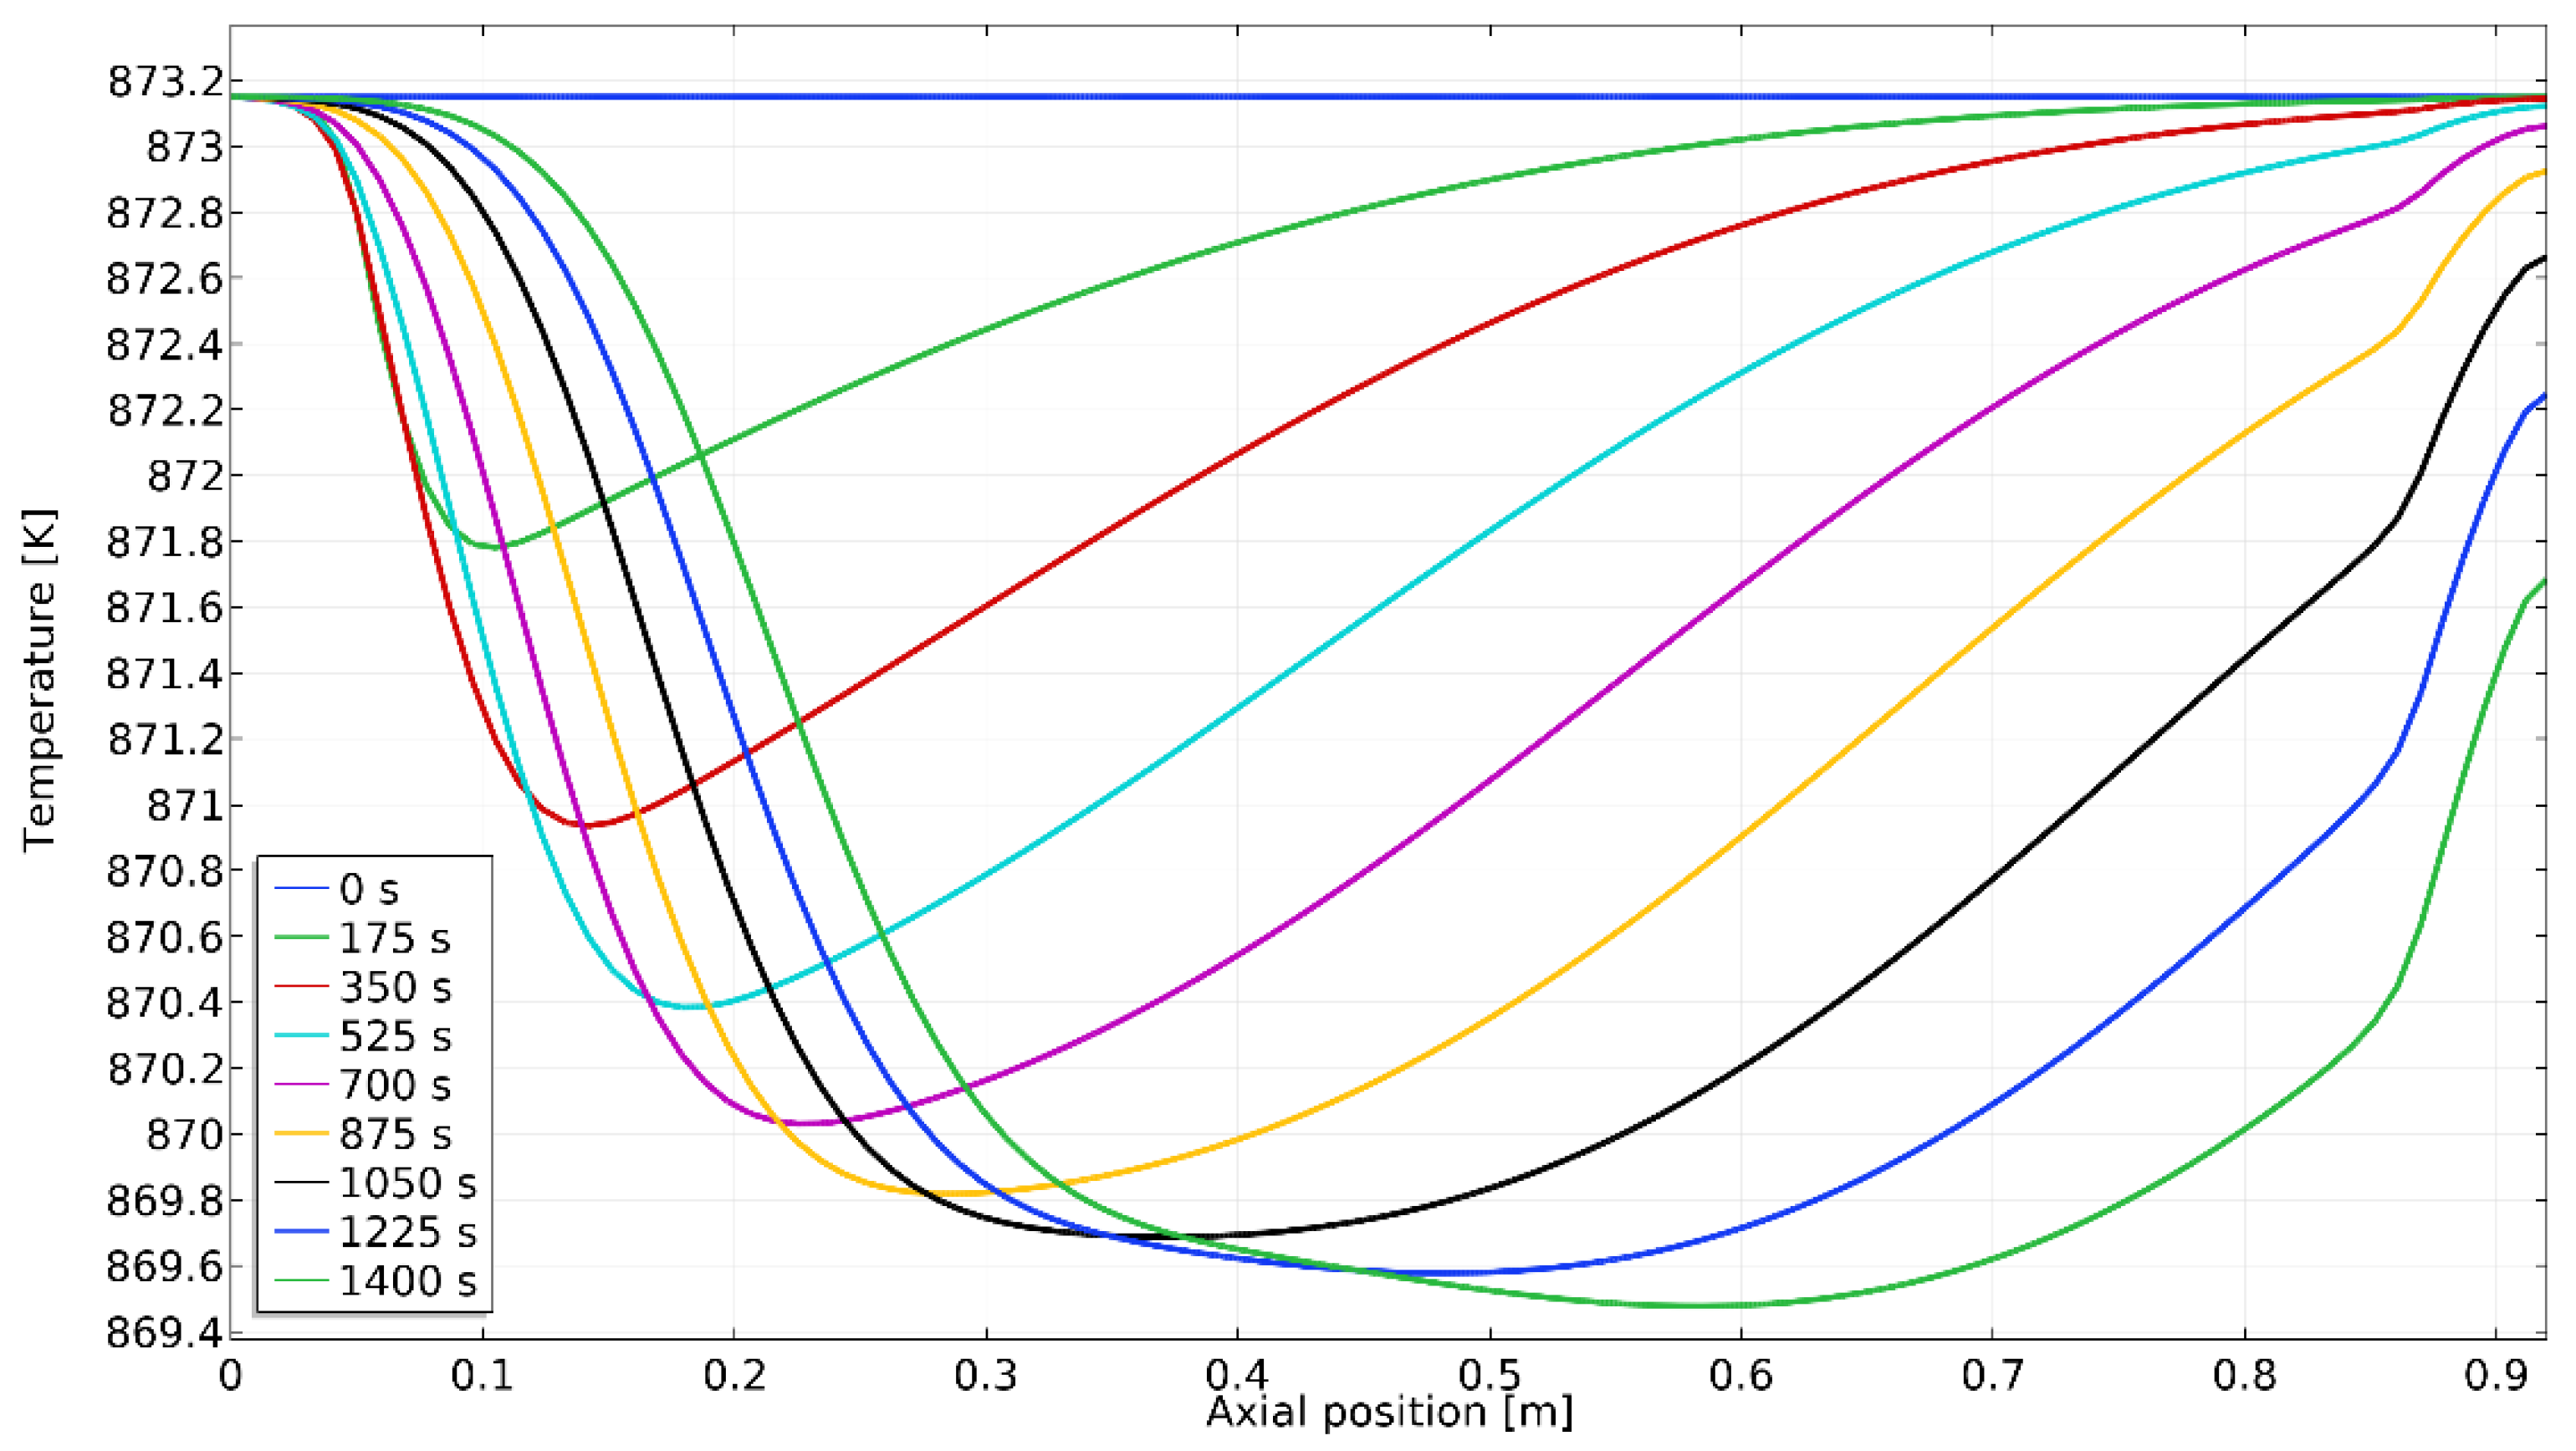
Initial reactor temperature during reduction with CO was 873 K. A slight decline in temperature can be seen in Figure 10 along the reactor length at various simulation times, as a result of the endothermic reduction reaction of ilmenite with CO.

3.1.3. Reduction with Syngas

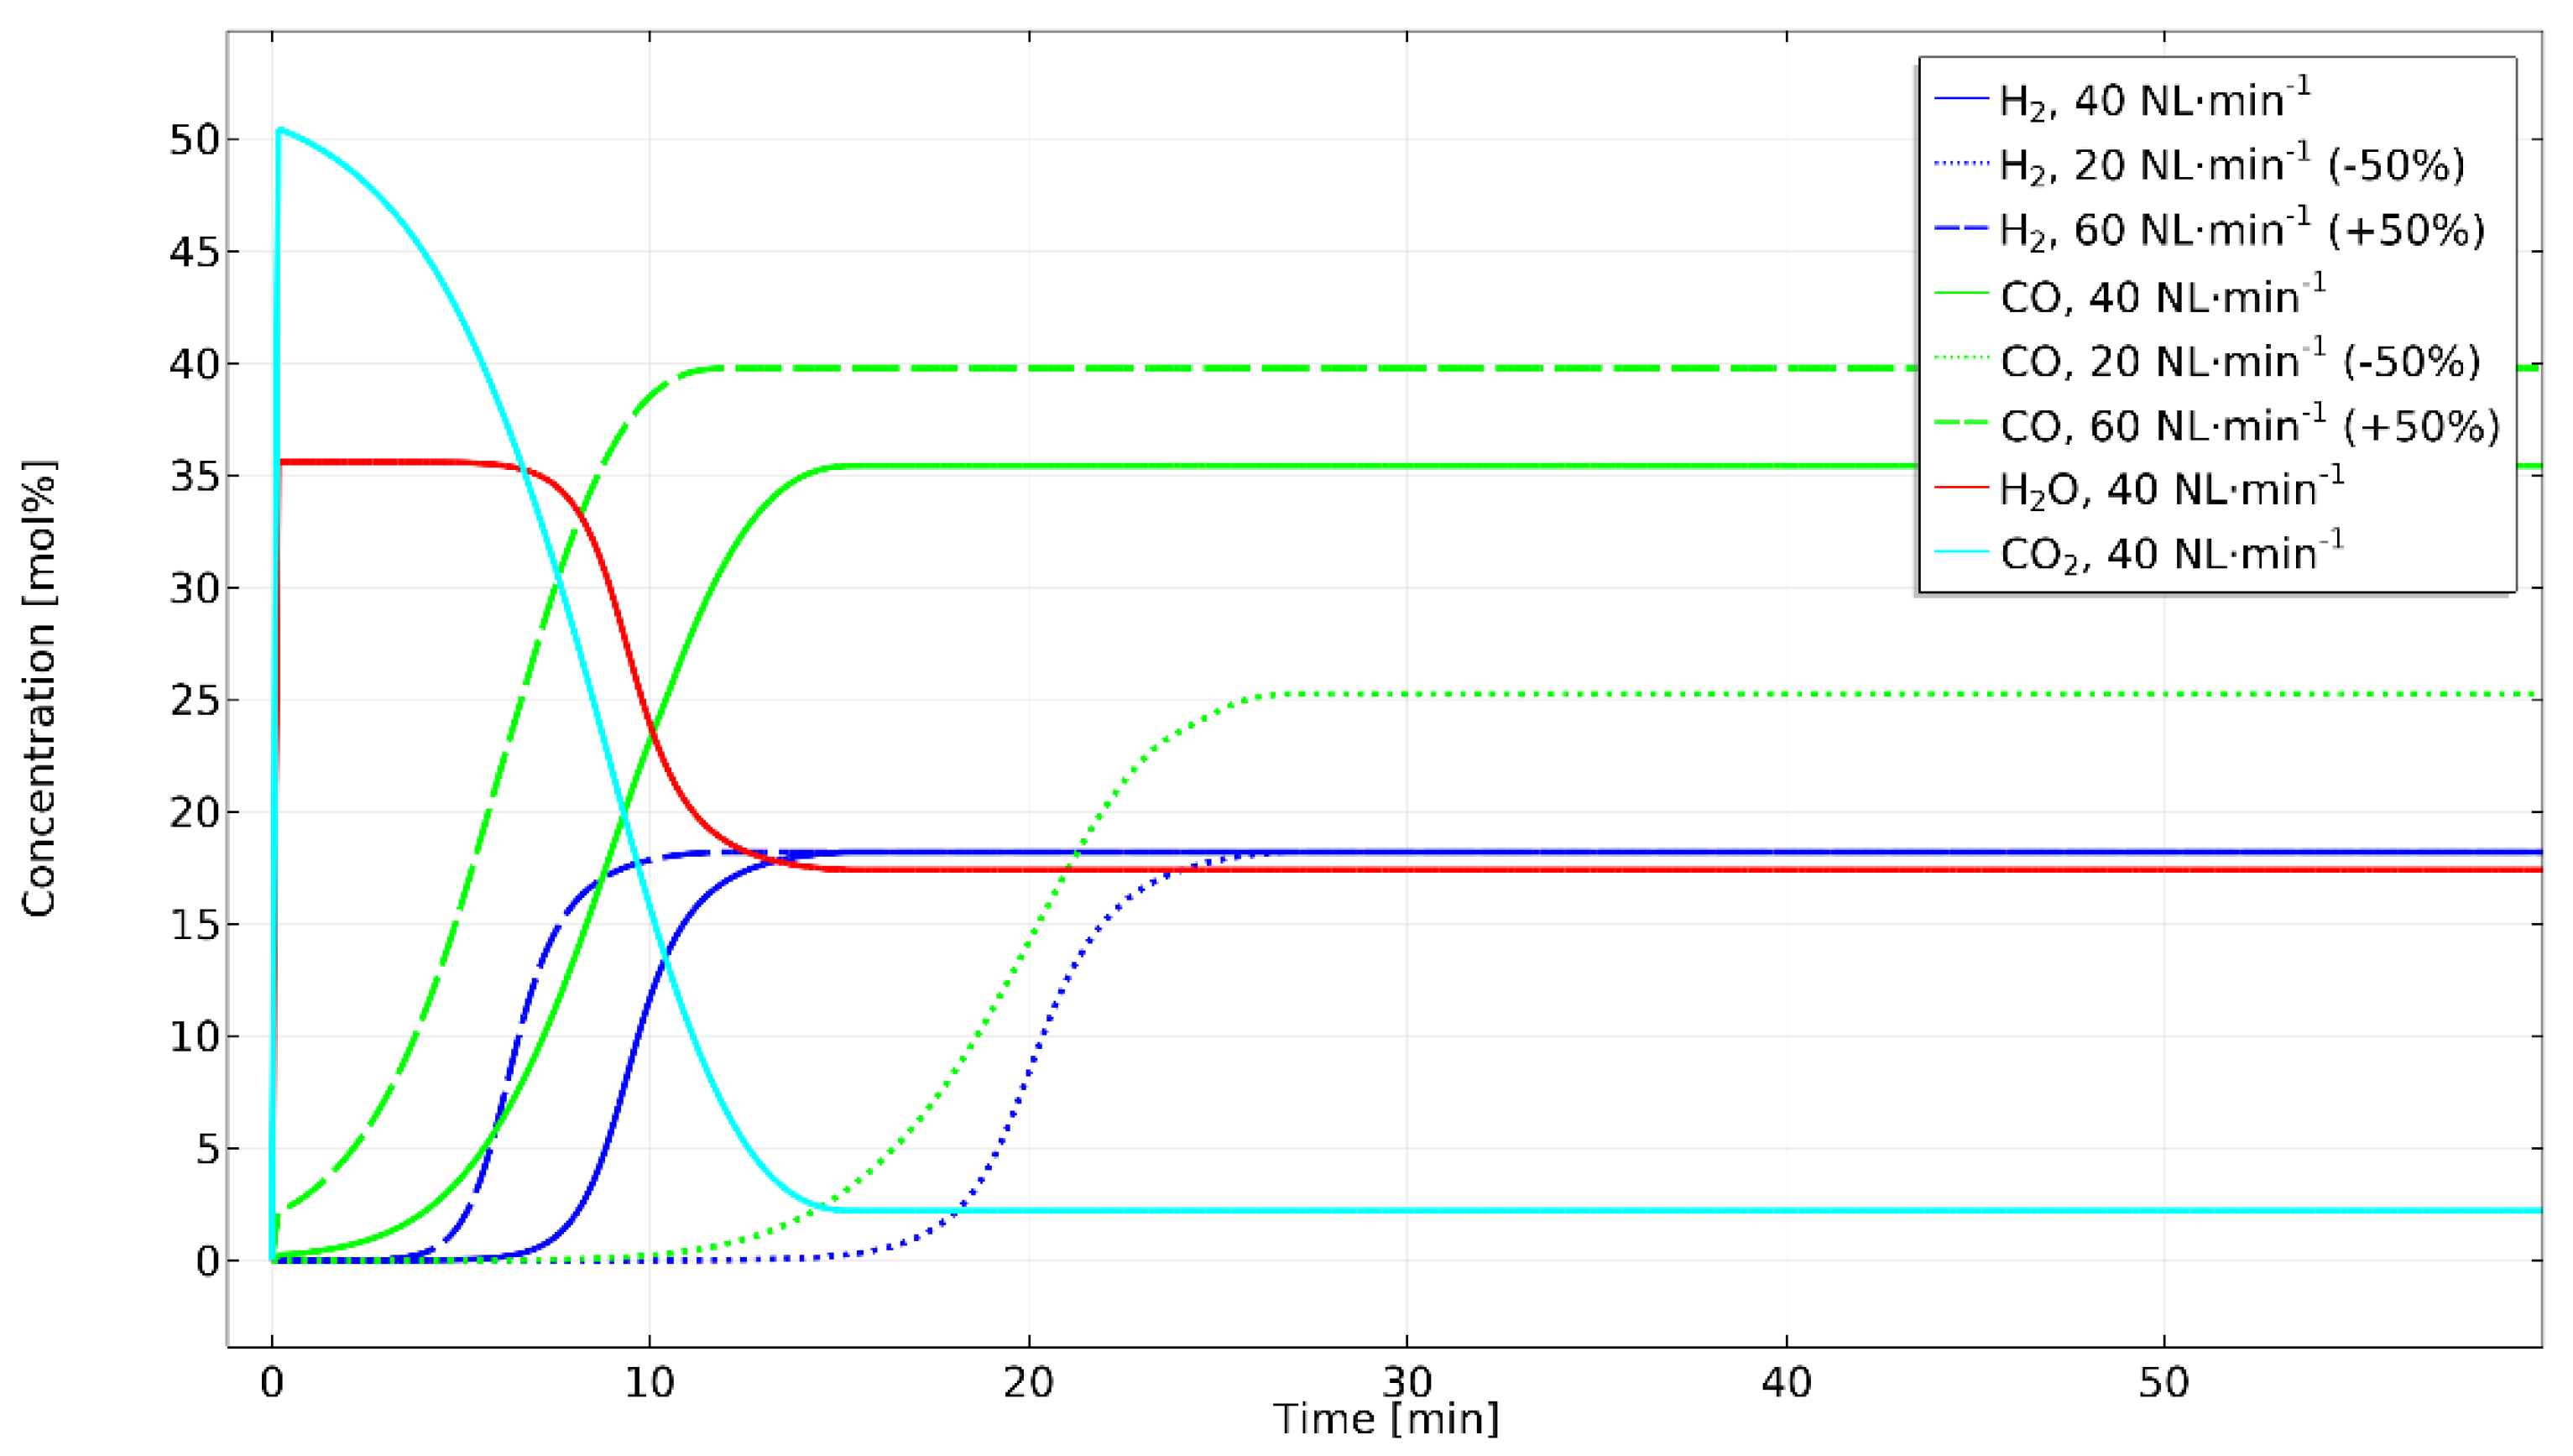
As a result of validation of the models describing iron-based OC reduction with H2 and CO, a model simulating ilmenite reduction with syngas was developed. The composition of syngas considered can be seen in Table 1, case 3. Moreover, additional simulations considering flow rates with a standard deviation of 20 NL·min−1 relative to the initial flow rate (see Table 2), as well as particle dimensions with a standard deviation of 2.76 mm from the initial particle dimension (Table 2), were carried out.
It can be noticed that breakthrough of H2 and CO, the moment at which the values of H2 and CO concentrations in the effluent remained unchanged due to the oxygen from the OC being entirely consumed and the reduction reactions ending (see Figure 11), occurred in much less time after reduction with syngas when compared to the breakthrough times following reduction with the gases separately (Figure 4 and Figure 8). The same flow rate and mass of OC was considered in all three cases; however, the presence of both H2 and CO consuming the oxygen provided by the OC, as well as higher concentrations, naturally led to a quicker breakthrough of the gases. When looking at the different flow rates, breakthrough was achieved the quickest at the highest flow rate due to H2 and CO traveling at a higher velocity and consuming the available oxygen in less time. On the other hand, the largest breakthrough time was seen in the case of the lowest flow rate.
A similar effect can also be observed when investigating the different CO concentrations due to carbon deposition at steady state, after breakthrough. A short residence time translates into less carbon being deposited during reduction with CO.
In order to investigate mass transfer efficiency, normalized concentration was plotted against normalized time in Figure 12. Normalized concentration for H2 was calculated by dividing concentration at simulation time with inlet concentration, while for CO it was calculated by dividing concentration with concentration at steady state, after breakthrough (due to carbon deposition). The normalized time was calculated by dividing the simulation time with the time corresponding to a breakthrough point of 0.5.
Assessment of the shape of the breakthrough curves showed steeper profiles at all flow rates for H2, rather than for CO, meaning faster kinetics, a smaller mass transfer zone, and a higher reaction rate when reducing iron-based OC with H2, corresponding with findings published by Ortiz et al. [17] on redox kinetics regarding ilmenite granules used in CLC. Finally, with increasing flow rate, the breakthrough profiles lost sharpness, which was expected behavior.
The effects of particle dimension over mass transfer rate can be seen in Figure 13.
The mass of ilmenite OC was identical for all cases; as such, the breakthrough times were also identical. In order to investigate mass transfer efficiency, normalized concentration at the outlet was plotted against normalized time. The sharpest profile for both CO and H2 was seen when considering the smallest particle dimension due to the shorter diffusion path length inside the particle, leading to suppressing diffusion limitations and maximizing the reduction reaction inside the OC. This then indicates that mass transfer efficiency increased with a decrease in particle size.
Figure 14 reported the change in concentration of Fe2O3 and FeO within four iron-based OC particles selected at different axial positions of 0.2 m, 0.4 m, 0.6 m, and 0.8 m, and at a simulation time of 60 s.
It can be noticed that the most Fe2O3 converted to FeO was within the iron OC particle at 0.2 m, while the reduction reaction was still ongoing for all the other OC particles situated at 0.4 m, 0.6 m, and 0.8 m. The concentrations of the oxides were much closer between the selected particles than when compared to reduction with H2 (Figure 6), due to the fact that oxygen consumption during reduction with syngas was much higher.
Figure 15 presents the change in temperature along the reactor length at various simulation times during reduction with syngas. There was an overall rise in temperature as the exothermic reduction with H2 released more energy than was required by the endothermic reduction with CO.

3.2. Single Particle Model (3D)–Reduction with Syngas

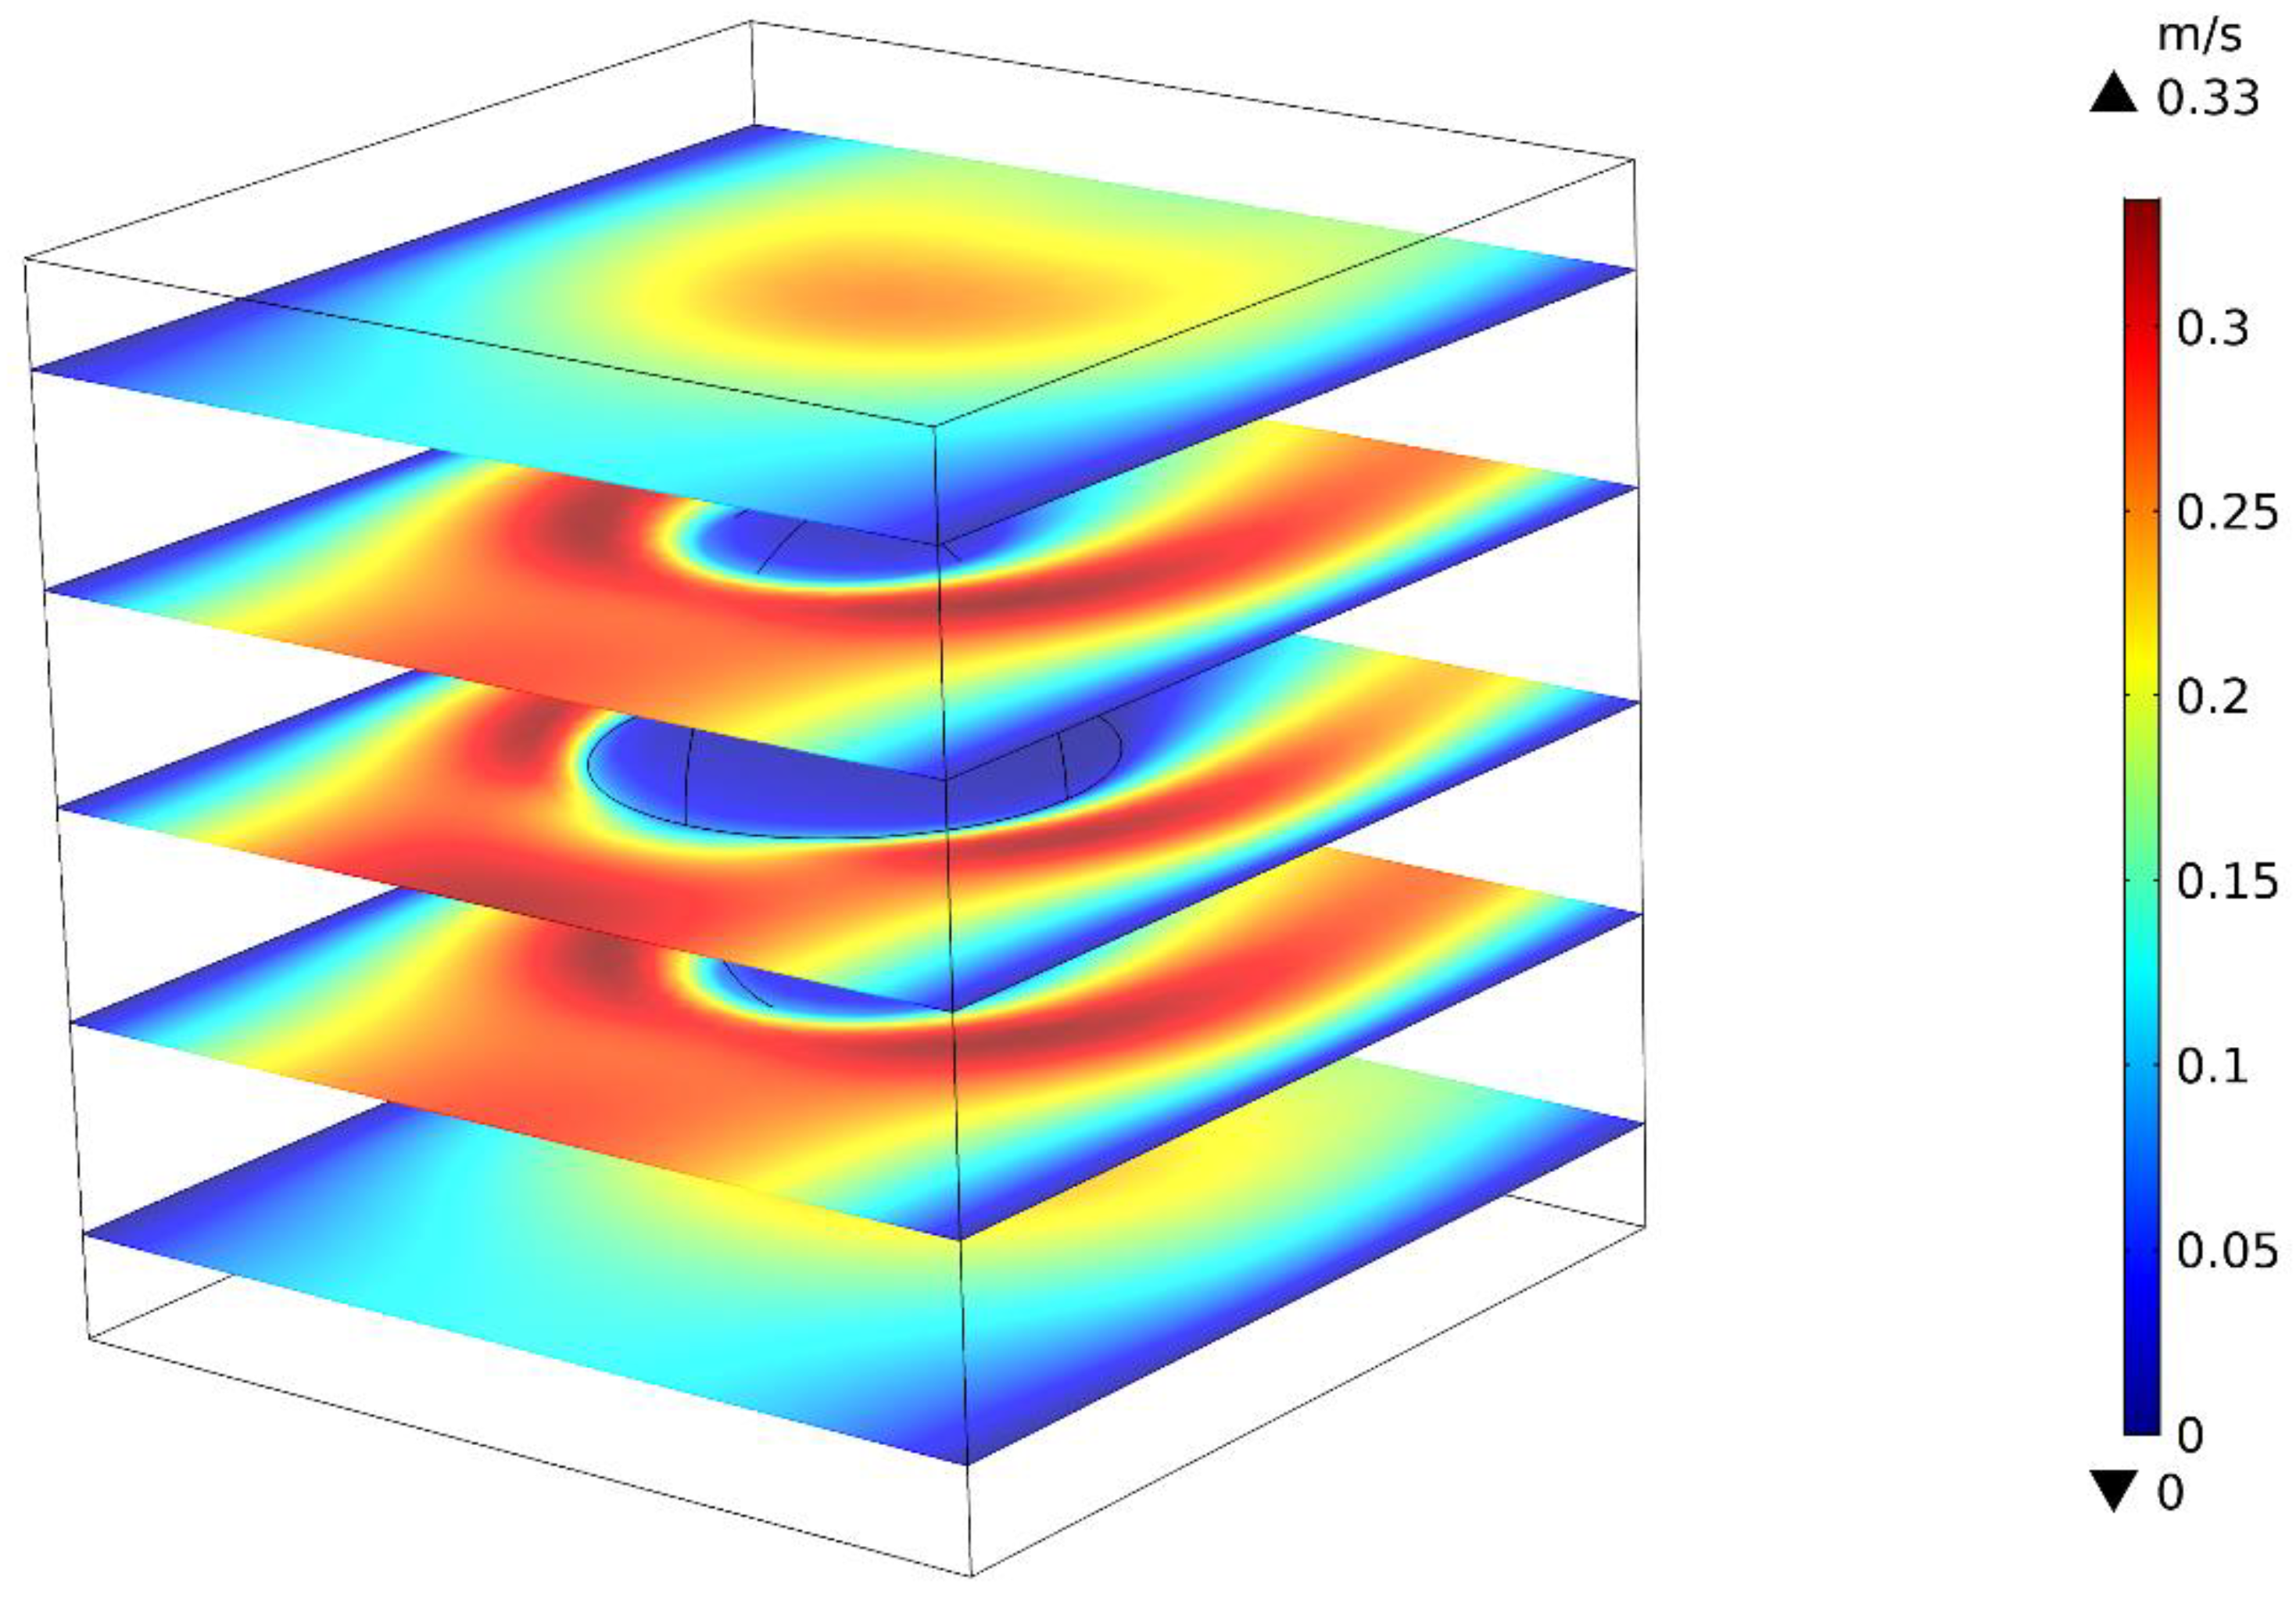
In order to further study the behavior of ilmenite particles during the reduction phase of the CLC process, a 3D CFD transient model was developed. Fluid flow was initially solved in stationary state. Cross-sectional surfaces highlighting the velocity profiles can be seen in Figure 16.
A boundary condition assuming fully developed laminar flow was considered at the inlet of the fluid domain. The slices in Figure 16 accurately described the laminar nature of the flow, with a lower velocity near the edges and inside of the particle, as well as near the edges of the fluid domain, while a higher velocity was seen in the center of the fluid sections surrounding the particle.
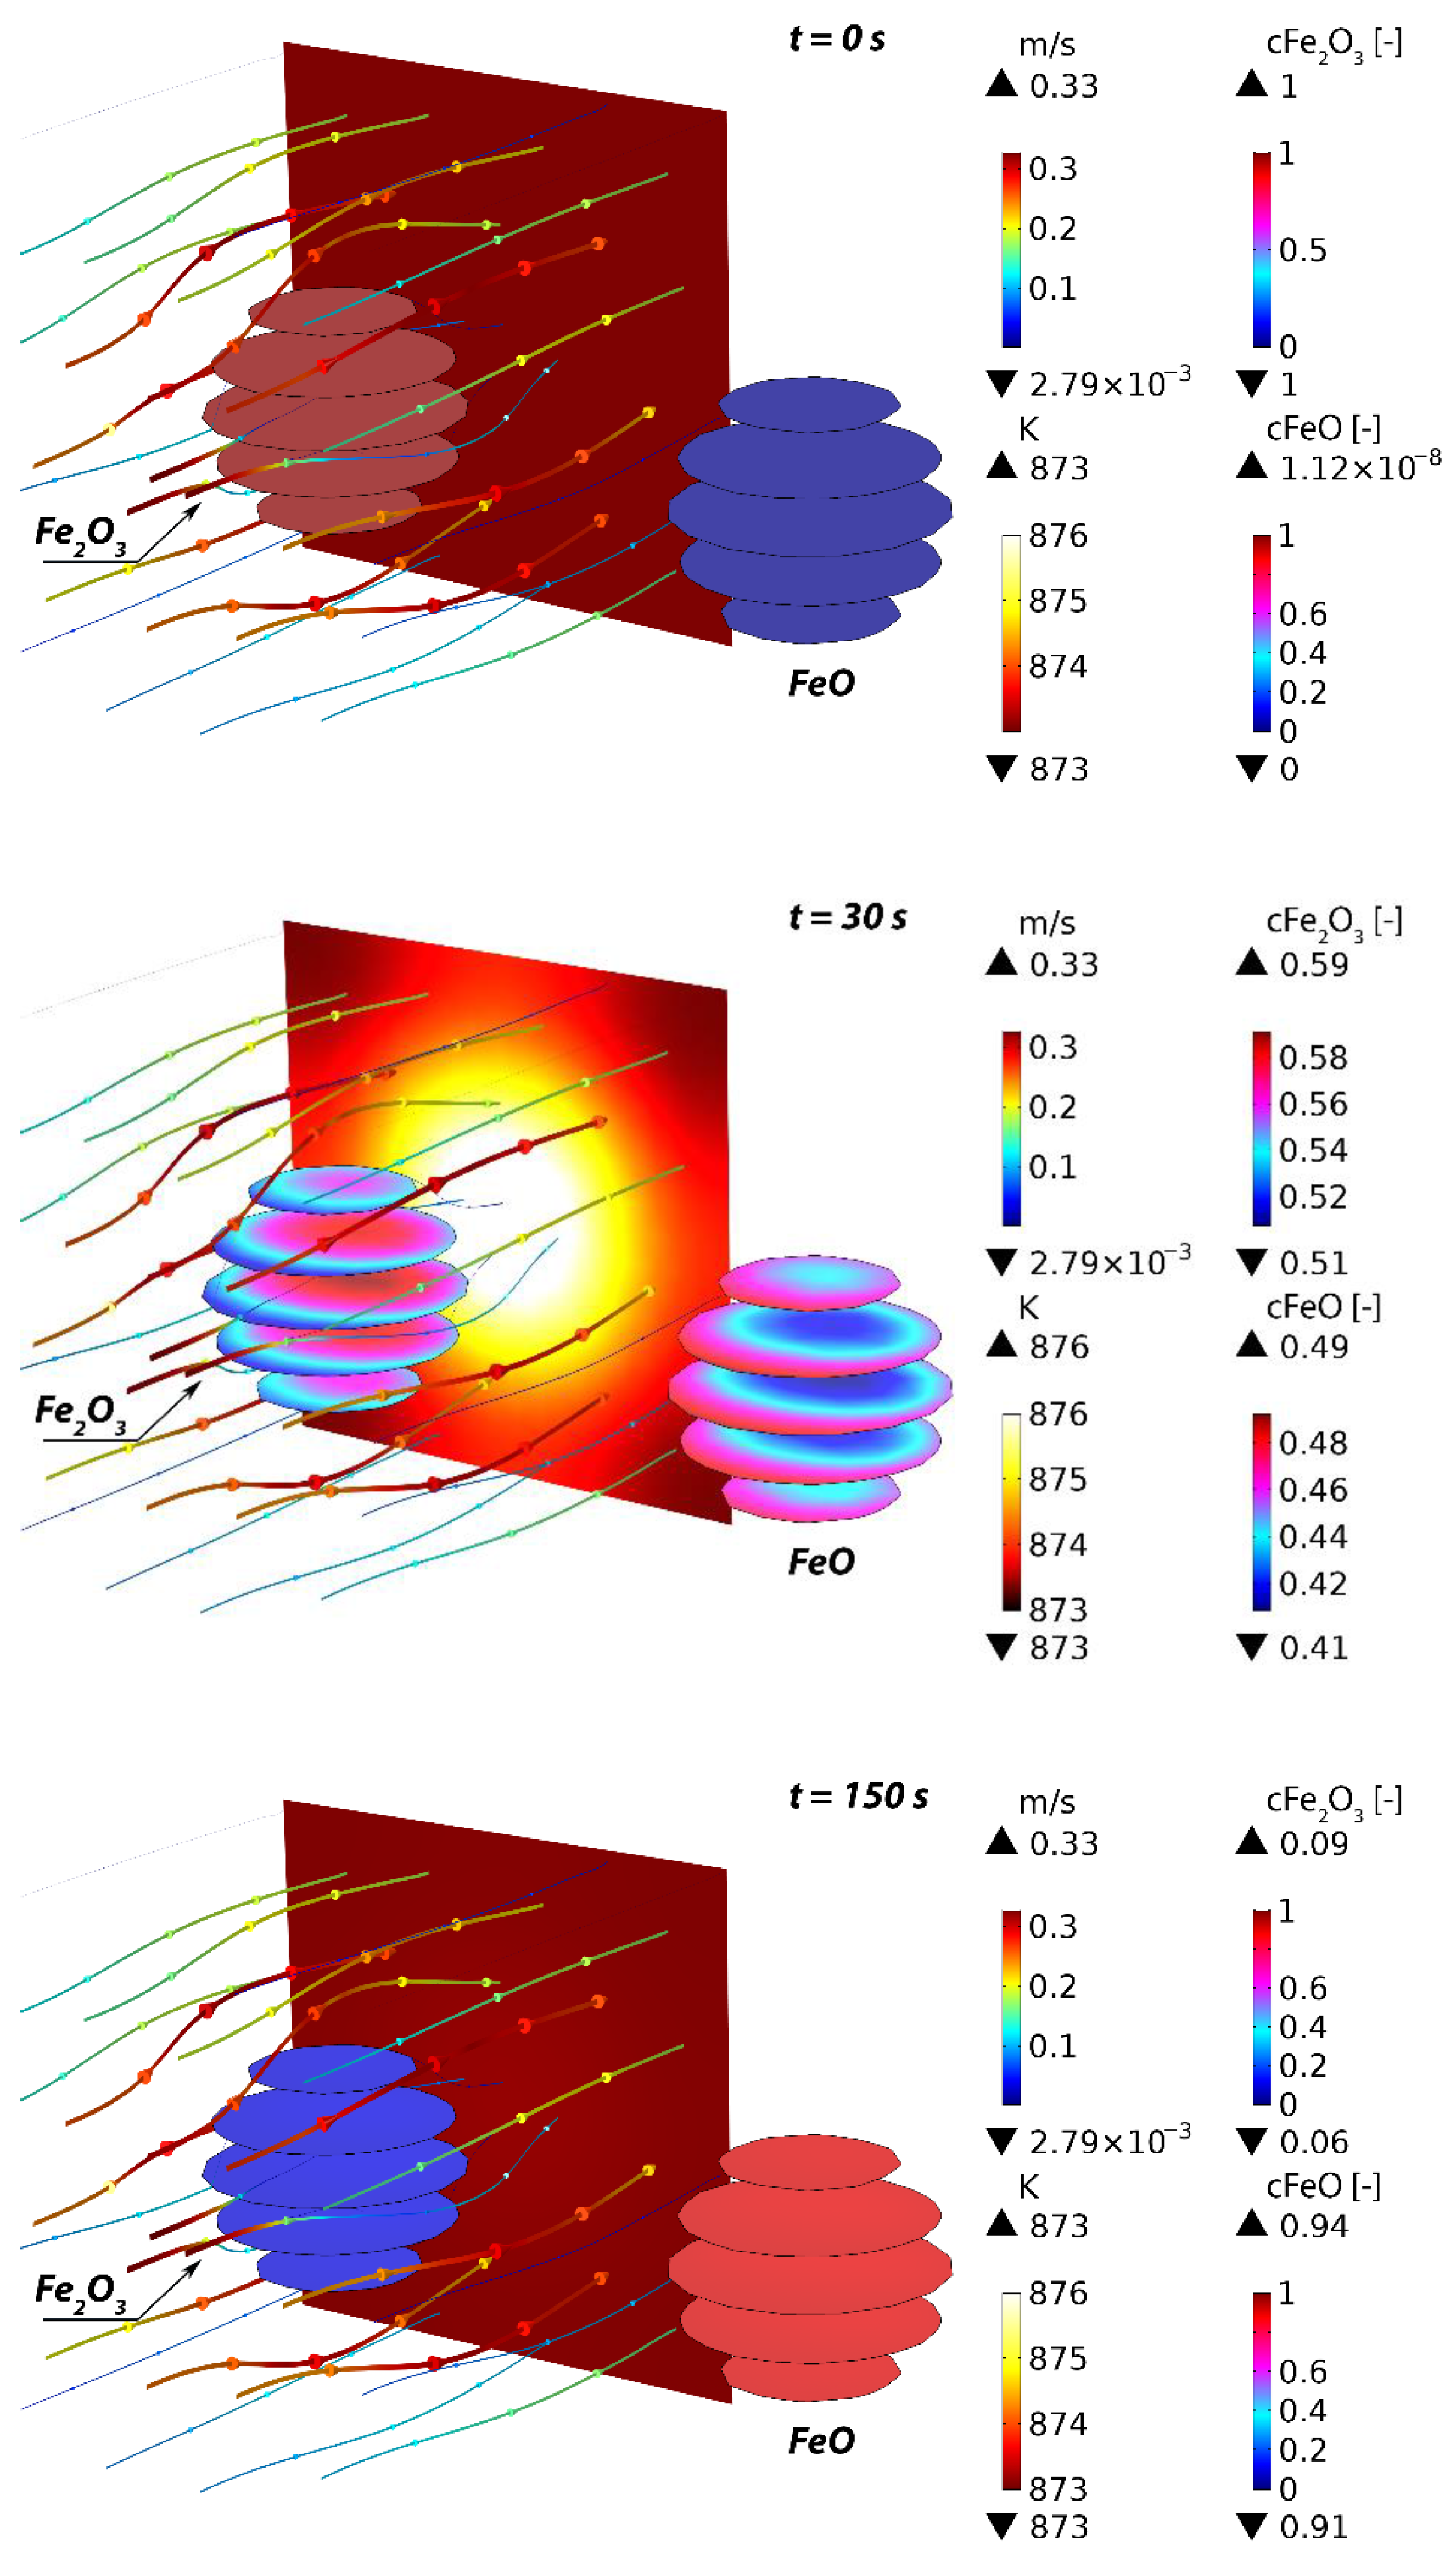
The evolution of the OC particle during reduction can be observed in Figure 17, as well as the interdependency between the phenomena accounted for in the model.
The relative concentration of Fe2O3 was represented by slices within the particle domain, seen in the center of the fluid domain, while the relative concentration of FeO can be observed outside of the fluid domain, also represented by slices of the particle. Moreover, the path of flow and velocity field can be visualized using streamlines with color and thickness proportional to the velocity magnitude. Finally, Figure 17 highlights temperature distribution at the outlet boundary with a temperature contour plot. Initially at simulation time of 0 s (top), only nitrogen was present in the fluid domain and Fe2O3 was unconsumed. After syngas entered the fluid domain and diffused within the particle, the reduction reaction began and oxygen was consumed from the OC. At simulation time of 30 s (middle), we notice that Fe2O3 concentration decreased, while FeO concentration increased proportionately, according to reaction kinetics. The effects of forced convection were also noticeable, as the heat released within the particle due to the slightly exothermic reduction reaction was transported and the temperature at the outlet boundary increased to 876 K. At 150 s (bottom), the reduction reaction was near its end and the oxygen from the OC was almost entirely consumed, as evidenced by the relative concentration of the FeO of 0.94. Furthermore, the colder inlet temperature and the slower reaction rate led to a decrease in the temperature at the outlet boundary.
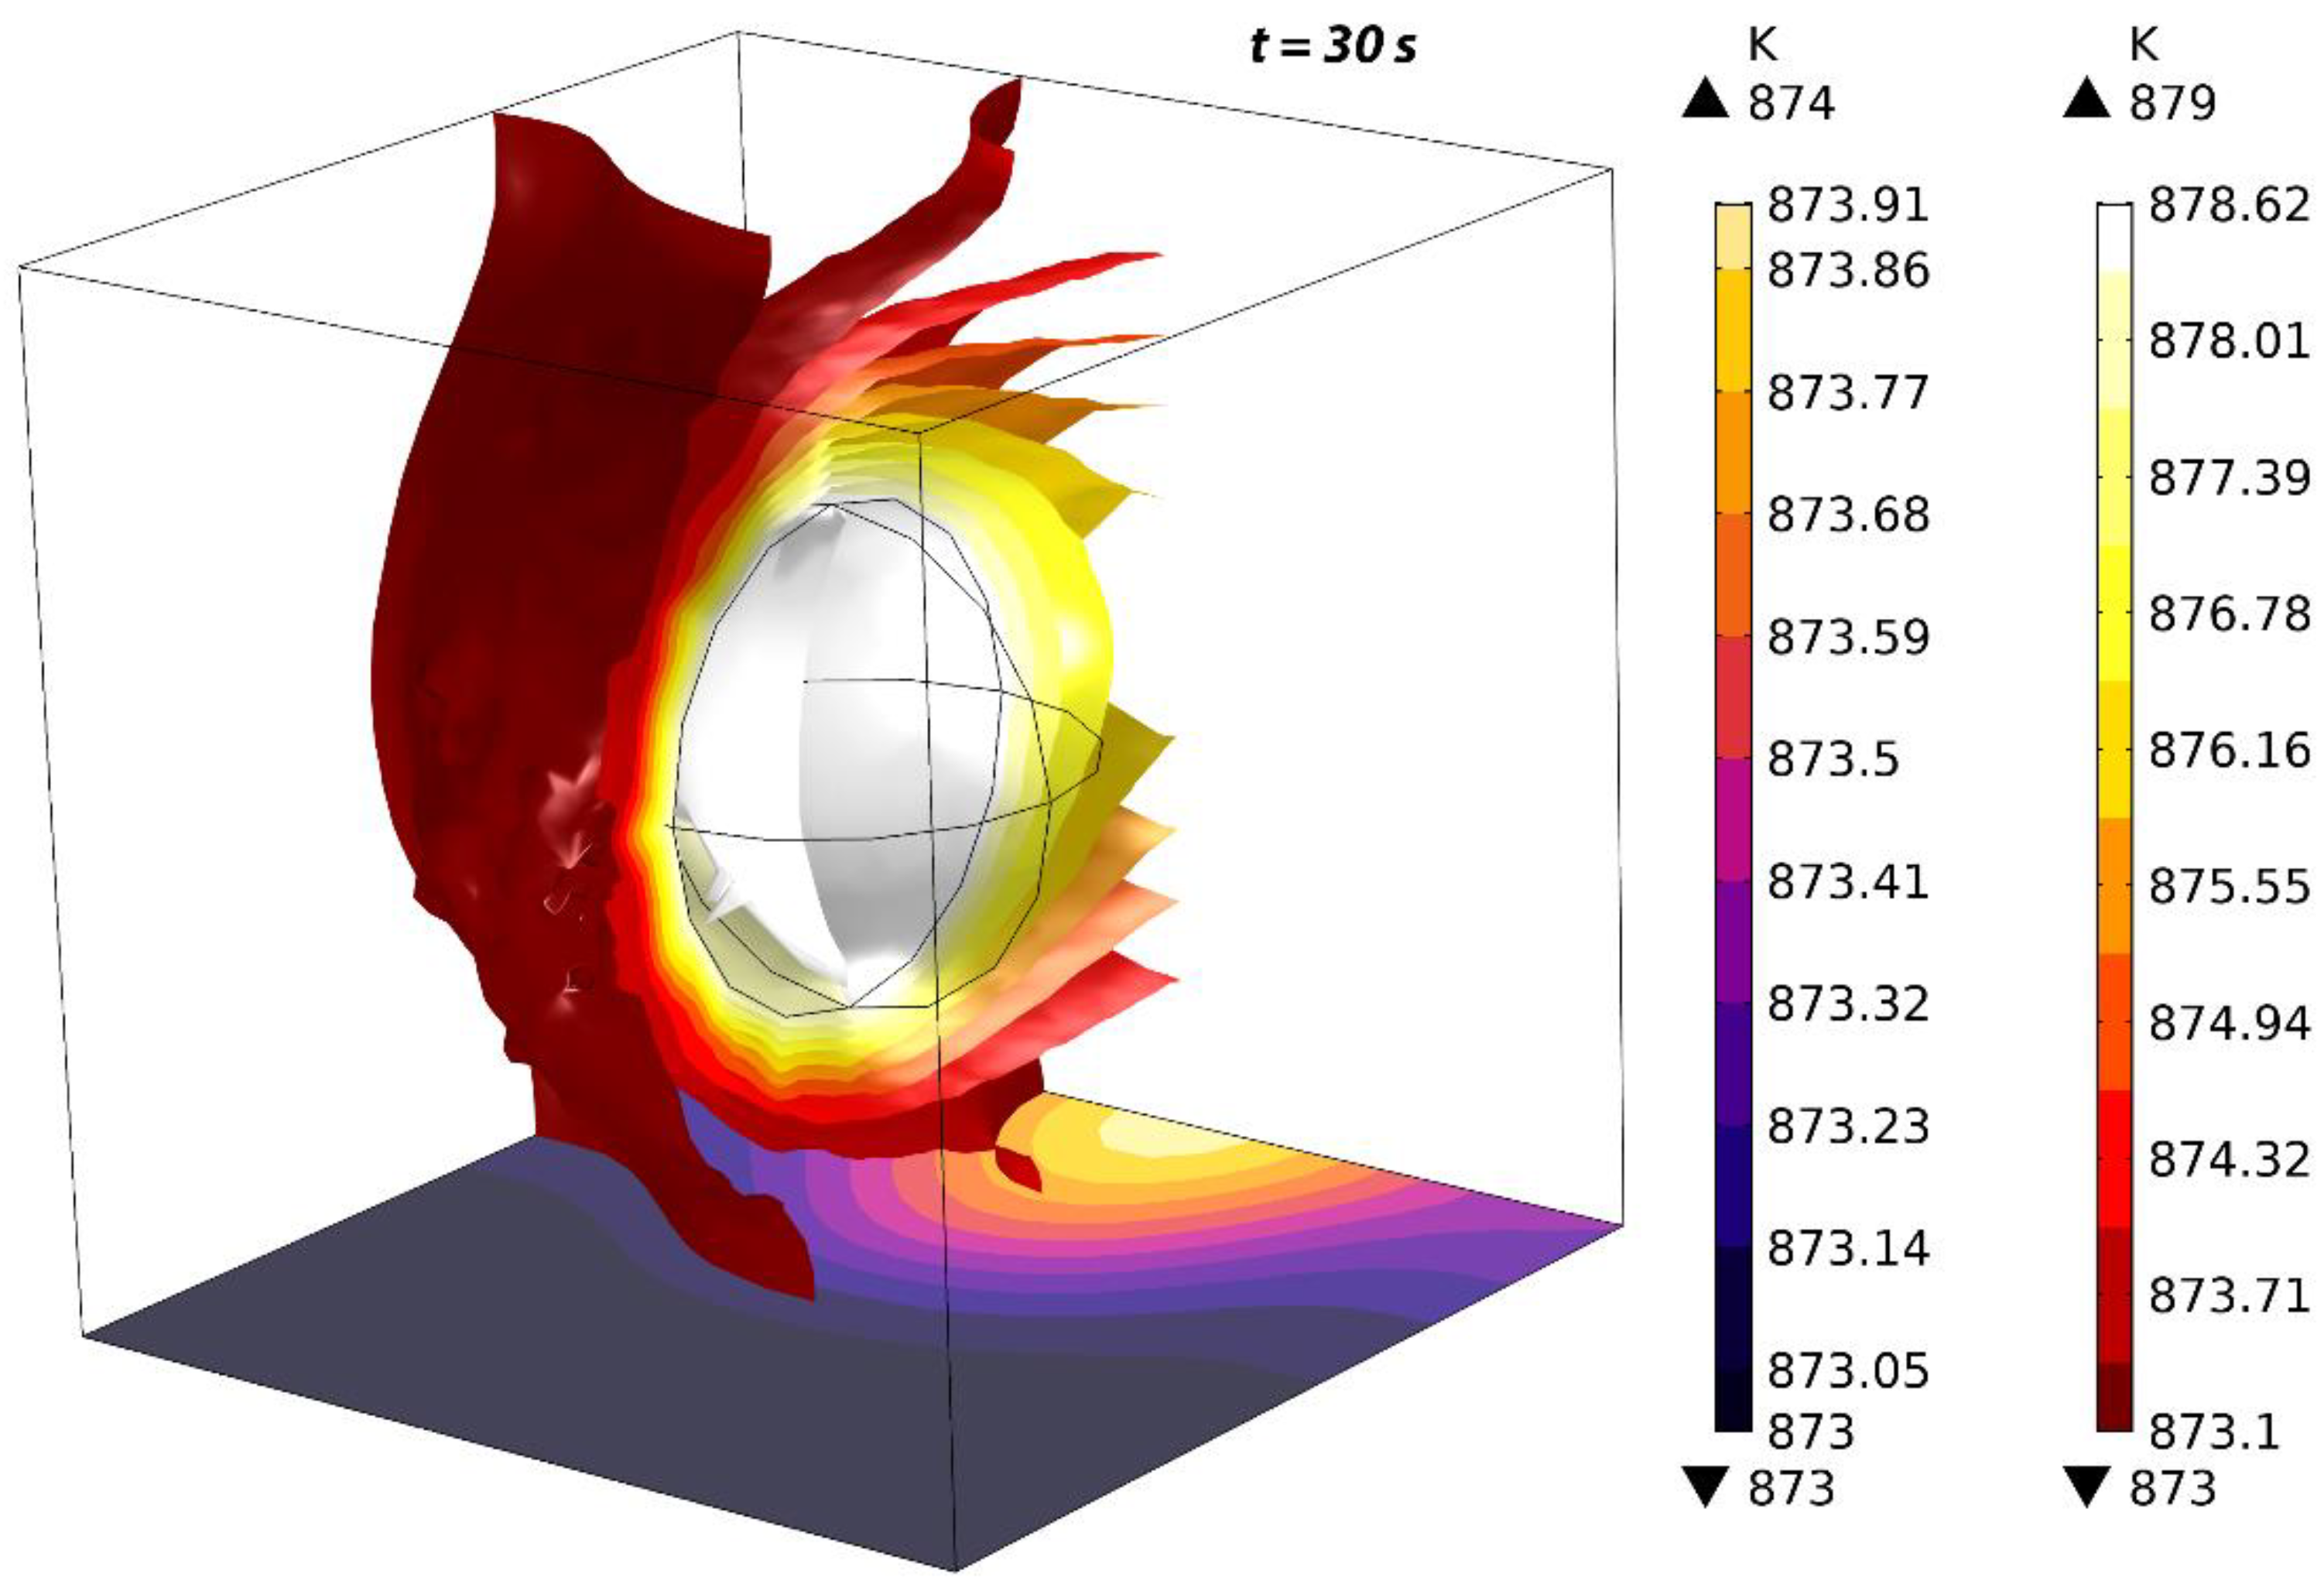
Heat transfer and fluid flow were solved together in steady state, after which the stationary solution was used as an initial value for the transient solver to avoid inconsistent initial values. Figure 18 shows an isothermal surface plot of temperature within the fluid and particle domains, as well as a contour plot of temperature at the bottom boundary of the fluid domain.
The highest temperature change was seen at 30 s, with a maximum temperature of 878 K within the particle as a result of the exothermic reduction reaction. The released heat diffused outside of the particle and was carried away by the flow, as evidenced by the isothermal surface plot surrounding the particle. Moreover, the temperature of the bottom boundary of the fluid domain had also increased. Comparing the heat transfer results of the particle model with the temperature increase predicted by the multiscale model at 30 s of 878 K (marked with black triangle symbols in Figure 15), the difference between model predictions was only 1 K.

4. Conclusions

A 1D multiscale CFD packed bed reactor model within a syngas-based CLC system with ilmenite OC granules was developed using COMSOL Multiphysics. The model described the reduction step, with equations accounting for mass, heat, and momentum transfer. The model predicted breakthrough curves for reduction with H2 ( R = 0.999 ) and CO ( R = 0.997 ) showed a good agreement with published experimental data. Subsequently, the model was used to study flow rate and particle dimension effects over mass transfer rate when considering syngas as feed gas. A higher flow rate achieved breakthrough sooner, but the mass transfer rate was less sharp when compared to lower flow rates. The particle size sensitivity analysis indicated a more efficient mass transfer with decreasing particle size due to suppressing diffusion limitations and maximizing reduction inside the OC particle.
Additionally, a 3D CFD particle model was developed to enable a detailed investigation into the reduction step at the microscale level. The model described the reduction reaction using syngas within an ilmenite particle, with equations accounting for mass, heat, and momentum transfer. The individual phenomena involved, as well as the interdependency between them, were studied and discussed. As opposed to the multiscale model which considered a dynamic reactor temperature, but a constant particle temperature, the particle model’s complexity led to an accurate description of heat transfer on a microscale level. However, comparison of temperature changes predicted by the models indicated a small difference of just 1 K during the exothermic reduction reaction under identical operating conditions.
Future work will focus on model development in order to simulate the oxidation step, thus enabling the simulation of a full cycle of the syngas-based CLC system with ilmenite OC, followed by process optimization studies to extract useful data for process scale-up.

Author Contributions

Conceptualization, V.-C.S., A.-M.C. and C.-C.C.; validation, V.-C.S., A.-M.C. and C.-C.C.; formal analysis, V.-C.S., A.-M.C. and C.-C.C.; investigation, V.-C.S., A.-M.C. and C.-C.C.; resources, A.-M.C., and C.-C.C.; methodology, V.-C.S., A.-M.C. and C.-C.C.; supervision, A.-M.C. and C.-C.C.; writing—review and editing, V.-C.S., A.-M.C. and C.-C.C. All authors have read and agreed to the published version of the manuscript.

Funding

This research was financed by two grants of Romanian Ministry of Education and Research, CCCDI-UEFISCDI, project numbers: PN-III-P2-2.1-PED-2019-0181 and PN-III-P4-ID-PCE-2020-0032, within PNCDI III.

Institutional Review Board Statement

Not applicable.

Informed Consent Statement

Not applicable.

Data Availability Statement

Data sharing not applicable.

Conflicts of Interest

The authors declare no conflict of interest.

Nomenclature

c i component concentrationmol·m−3
c p , i component concentration inside pelletmol·m−3
C p heat capacityJ·kg−1·K−1
D i component diffusion coefficientm2·s−1
D L , i component axial dispersion coefficientm2·s−1
D p , i component diffusion coefficient inside porous domainm2·s−1
D p e pellet diameterm
D p e f f , i component effective diffusion coefficient inside the pelletm2·s−1
k thermal conductivityW·m−1·K−1
k C O , d first order rate constant for carbon deposition reactions−1
N number of pellets per unit volume of bed-
P fluid pressurePa
Q R heat sourceW·m−3
r radial coordinate from center to pellet surface-
r p pellet radiusm
R correlation coefficient-
R i component reaction ratemol·m−3·s−1
t times
T fluid temperatureK
u fluid velocitym·s−1
u i interstitial velocitym·s−1
Greek
ε b bed porosity (void fraction)-
ε p particle porosity (void fraction)-
μ fluid dynamic viscosityPa·s
κ porous domain permeabilitym2
ρ fluid densitykg·m−3
τ viscous stress tensorPa
Abbreviations
CCScarbon capture and storage
CFDcomputational fluid dynamics
CLCchemical looping combustion
OCoxygen carrier

References

  1. Global Warming of 1.5 °C—IPCC. Available online: https://www.ipcc.ch/sr15/ (accessed on 15 September 2021).
  2. The Global Status of CCS Report 2020—Global CCS Institute. Available online: https://www.globalccsinstitute.com/resources/global-status-report/ (accessed on 15 September 2021).
  3. Lyngfelt, A.; Brink, A.; Langørgen, Ø.; Mattisson, T.; Rydén, M.; Linderholm, C. 11,000 h of chemical-looping combustion operation—Where are we and where do we want to go? Int. J. Greenh. Gas Control 2019, 88, 38–56. [Google Scholar] [CrossRef]
  4. Brenault, R.W. Handbook of Chemical Looping Technology; Wiley-VCH: Weinheim, Germany, 2018. [Google Scholar] [CrossRef]
  5. Pudasainee, D.; Kurian, V.; Gupta, R. Coal: Past, present, and future sustainable use. In Futur Energy Improv Sustain Clean Options Our Planet; Elsevier: Amsterdam, The Netherlands, 2020; pp. 21–48. [Google Scholar] [CrossRef]
  6. Chisalita, D.A.; Cormos, A.M. Dynamic simulation of fluidized bed chemical looping combustion process with iron based oxygen carrier. Fuel 2018, 214, 436–445. [Google Scholar] [CrossRef]
  7. Mattisson, T.; Keller, M.; Linderholm, C.; Moldenhauer, P.; Rydén, M.; Leion, H.; Lyngfelt, A. Chemical-looping technologies using circulating fluidized bed systems: Status of development. Fuel Process Technol. 2018, 172, 1–12. [Google Scholar] [CrossRef] [Green Version]
  8. Adanez, J.; Abad, A.; Garcia-Labiano, F.; Gayan, P.; De Diego, L.F. Progress in chemical-looping combustion and reforming technologies. Prog. Energy Combust. Sci. 2012, 38, 215–282. [Google Scholar] [CrossRef] [Green Version]
  9. Noorman, S.; Gallucci, F.; Van Sint Annaland, M.; Kuipers, J.A.M. Experimental investigation of chemical-looping combustion in packed beds: A parametric study. Ind. Eng. Chem. Res. 2011, 50, 1968–1980. [Google Scholar] [CrossRef]
  10. Han, L.; Bollas, G.M. Dynamic optimization of fixed bed chemical-looping combustion processes. Energy 2016, 112, 1107–1119. [Google Scholar] [CrossRef] [Green Version]
  11. Gallucci, F.; Hamers, H.P.; van Zanten, M.; van Sint Annaland, M. Experimental demonstration of chemical-looping combustion of syngas in packed bed reactors with ilmenite. Chem. Eng. J. 2015, 274, 156–168. [Google Scholar] [CrossRef]
  12. Parker, J.M. CFD model for the simulation of chemical looping combustion. Powder Technol. 2014, 265, 47–53. [Google Scholar] [CrossRef]
  13. Ergun, S. Fluid flow through packed columns. Chem. Eng. Prog. 1952, 48, 89–94. [Google Scholar]
  14. Wakao, N.; Funazkri, T. Effect of fluid dispersion coefficients on particle-to-fluid mass transfer coefficients in packed beds. Correlation of sherwood numbers. Chem. Eng. Sci. 1978, 33, 1375–1384. [Google Scholar] [CrossRef]
  15. Nield, D.A.; Bejan, A. Convection in Porous Media, 5th ed.; Springer: Berlin/Heidelberg, Germany, 2017. [Google Scholar] [CrossRef]
  16. Abad, A.; Adánez, J.; Cuadrat, A.; García-Labiano, F.; Gayán, P.; de Diego, L.F. Kinetics of redox reactions of ilmenite for chemical-looping combustion. Chem. Eng. Sci. 2011, 66, 689–702. [Google Scholar] [CrossRef] [Green Version]
  17. Ortiz, M.; Gallucci, F.; Snijkers, F.; Van Noyen, J.; Louradour, E.; Tournigant, D.; van Sint Annaland, M. Development and testing of ilmenite granules for packed bed chemical-looping combustion. Chem. Eng. J. 2014, 245, 228–240. [Google Scholar] [CrossRef]
Figure 1. The reduction step of the CLC process using iron-based OC.
Energies 14 06059 g001
Figure 2. Multiscale model approach with macroscale (bed length) and microscale (particle radius) 1D dimensions.
Energies 14 06059 g002
Figure 3. Particle model geometry, phenomena considered, and mesh quality in terms of element skewness (1 was highest quality).
Energies 14 06059 g003
Figure 4. Experimental (blue diamonds) and model predicted (red line) H2 breakthrough curves.
Energies 14 06059 g004
Figure 5. Axial concentration in the fuel reactor at different moments in time during reduction with H2.
Energies 14 06059 g005
Figure 6. Change in concentration of the iron oxides within four particles selected at various axial positions inside the bed at simulation time 700 s.
Energies 14 06059 g006
Figure 7. Model predicted axial temperature profiles during reduction with H2.
Energies 14 06059 g007
Figure 8. Experimental (blue circles) and model predicted (red line) CO breakthrough curves.
Energies 14 06059 g008
Figure 9. Axial concentration in the fuel reactor at different moments in time during reduction with CO.
Energies 14 06059 g009
Figure 10. Model predicted axial temperature profiles during reduction with CO.
Energies 14 06059 g010
Figure 11. Model predicted breakthrough curves after iron-based OC reduction with syngas.
Energies 14 06059 g011
Figure 12. Mass transfer effects following a flow rate sensitivity analysis during reduction with syngas.
Energies 14 06059 g012
Figure 13. Mass transfer effects following a particle dimension sensitivity analysis during reduction with syngas.
Energies 14 06059 g013
Figure 14. Change in concentration of the iron oxides within four particles selected at various axial positions inside the bed at simulation time 60 s.
Energies 14 06059 g014
Figure 15. Model predicted axial temperature profiles during reduction with syngas.
Energies 14 06059 g015
Figure 16. Velocity profiles computed by the 3D particle model for laminar flow.
Energies 14 06059 g016
Figure 17. Change in OC concentration predicted by the 3D particle model at 0 s (top), 30 s (middle), and 150 s (bottom).
Energies 14 06059 g017
Figure 18. Change in temperature predicted by the 3D particle model at 30 s.
Energies 14 06059 g018
Table 1. Inlet mole fractions during the three cases simulated with iron-based OC [11].
CaseH2
[mol%]
CO
[mol%]
H2O
[mol%]
CO2
[mol%]
N2 (Balance)
[mol%]
130-15-55
2-30-1555
3 (syngas)18.250.22.217.412
Table 2. Parameters used in the fuel reactor model [11].
ParameterValue
Reactor length [m]0.92 (0.05 inert, 0.82 ilmenite OC, 0.05 inert)
Reactor diameter [m]0.063
Particle diameter [m]0.0055
Ilmenite mass [kg]3.3
Oxygen carrier [wt%]35 Fe2O3 on TiO2
Solid bulk density [kg·m−3]1469
Work pressure [bar]4
Feed temperature [K]873.15
Feed flow rate [NL·min−1]40
Publisher’s Note: MDPI stays neutral with regard to jurisdictional claims in published maps and institutional affiliations.