1. Introduction
Over the last few years, a strong penetration of Intermittent Renewable Energy Sources (IRES) in the Italian Power System has been observed. IRES growth is essential for achieving the objectives of the Integrated National Energy and Climate Plan (PNIEC) [
1] for 2030 in terms of expected reduction in polluting and climate-change emissions. In parallel, Italy intends to accelerate the transition from traditional (e.g., fossil) fuels to renewable sources, by promoting the gradual phasing out of coal-fired power plants. The goal is to move towards an electricity generation mix, mainly based on renewables, supported by extensive deployment of storage technologies (needed to ensure safe integration of IRES and to prevent overgeneration conditions).
Conventional production units, unlike IRES, are able to guarantee programmable energy production. In addition, when a disturbance event in the electricity system occurs, they are able to provide frequency regulation services. A shift from conventional units to IRES could reduce the regulation capacity available to the TSO, and at the same time, could increase the amount of potential imbalances to be coped with (due to deviations between scheduled and actual IRES infeed). In this sense, it is crucial to investigate how to increase the amount of balancing capacity available. This could be achieved by working in three different directions. Firstly, increasing the ability of IRES to provide ancillary services (also considering storage integration). Secondly, integrating balancing markets to exploit the full potential of the European (EU) market integration, making resources accessible to all countries. Thirdly, improving the coherency of market price signals and reserve procurement at the EU level, ensuring that a proper amount of regulating capacity is available in the Italian ancillary service market (in Italian, “Mercato per il Servizio di Dispacciamento, MSD”), in particular Replacement Reserve (RR) resources, for the security and flexibility of the system [
2,
3]. Hence, making the energy transition a concrete reality requires appropriate changes to the market and regulatory framework and processes.
In this framework, the consultation document “Testo Integrato del Dispacciamento Elettrico” (TIDE) [
4], published by the Italian National Regulatory Authority (ARERA), provides a useful insight on the main actions that could be envisaged to properly reform dispatching activity, so as to improve its efficiency and to ensure the adequacy and security of the national electricity system, in view of the energy transition.
The integrated day-ahead market (Single Day Ahead Coupling) allows maximization of the efficiency of energy trades and optimally allocated cross-zonal capacity. After this market, there are few opportunities for a TSO to adapt import/export schedules: If the price signals arising from this market do not (fully) anticipate potential scarcity conditions, the adequacy of the national power system is endangered. For this reason, the Italian Transmission System Operator (TSO), Terna, started to investigate the opportunity to align its approach of reserve procurement to the one adopted in most EU countries, procuring (at least partially) Replacement Reserve (RR) in dedicated auctions held in advance of the day-ahead market. This would help in maintaining the current high-quality adequacy standards.
This paper deals with the results obtained through quantitative analysis carried out in order to estimate the impact of these auctions in terms of outcomes and costs of both the energy and ancillary services markets in Italy. Firstly, the current reserve procuring rules adopted by Terna in the Italian Ancillary Service market (MSD) are described, together with the main issues that suggest evaluation of the opportunity of introducing replacement reserve capacity auctions. Based on the European benchmark, in particular the reserve market designs adopted in Germany and in France, the characteristics of a possible new reserve-procurement model are then outlined. Finally, a set of quantitative simulations are presented, investigating the links between different market sessions. Different scenarios are identified in order to find the optimal solution to improve the reserve-procurement process so as to minimize system costs, and at the same time, to cope with high system security standards.
The paper is organized into six sections.
Section 2 describes the Italian electricity market and its organization.
Section 3 explains the reasons underlying the possible introduction of dedicated RR capacity auctions, defining the main characteristics of the RR auction.
Section 4 is dedicated to illustrating the simulation chain applied for performing the quantitative assessments.
Section 5 reports the main results of each step of this simulation chain.
Section 6 reports the main findings and conclusions.
3. Ancillary Service Market Current Reform
In Italy, Terna currently procures balancing capacity (reserve) and energy in the MSD, which runs after the Energy Markets (MGP and MI). In contrast, in France and Germany, balancing capacity is procured through dedicated auctions held in advance of the day-ahead market [
14]. This difference in ancillary service procurement mechanisms leads to asymmetry in the energy price signals arising from the day-ahead energy market. It means that, under conditions of reserves scarcity, the Italian day-ahead energy market (MGP) gives weaker price signals than those of the other EU countries. The reason is that in these EU markets, the balancing capacity procured before the energy markets cannot be sold in the day-ahead market. Consequently, the impact of the already constrained capacity is reflected in the day-ahead market prices (leading to higher values).
Hence, in case of simultaneous scarcity conditions, the import coming from these countries is lower than that which could be observed if the reserve capacity were procured in the same way.
Hence, if this scenario materializes, the Italian power system may not have sufficient resources to ensure real time balance and secure operation. In case of simultaneous scarcity conditions, the energy market could schedule all the available generation capacity in Italy in order to export toward neighboring countries, leaving no spare capacity to ensure a proper reserve capacity for coping with Italian power system requirements.
Electricity markets experienced this kind of behavior on 15 September 2020: In a general state of lack of resources among EU countries, schedules from the day-ahead market implied a flow from Italy to France, which was experiencing reduced adequacy margins due to a reduced availability of French nuclear power plants. As a result of this event, the Italian power system had a potential lack of Replacement Reserve (RR) capacity, so the cooperation procedure with other TSOs was activated (since the lack of capacity was small, this procedure was able to solve the issue, but it may not be enough in case of more stressed conditions).
The possibility of Italy introducing dedicated auctions to procure replacement tertiary control reserve (European Replacement Reserve, RR) before the energy markets is thus assessed in this study.
3.1. European Benchmark
German and French markets designs are taken as reference points to define the characteristics of balancing capacity auctions [
14].
In Germany, the four TSOs use public auctions to procure three balancing products: primary (FCR), secondary (aFRR) and tertiary (mFRR) reserve capacity. All auctions take place the day before the delivery day and products are traded in blocks of four hours. Participation is not mandatory and the capacity must be offered in an aggregated form. Primary reserve bids consist of a quantity and its reservation price. The selected offers are paid as bid and the actual use of the capacity is not rewarded separately. Both secondary and tertiary reserve bids consist of three parts: a quantity, a reservation price for reserving the capacity and an energy price for reserve capacity actually used. The offers are selected according to a merit order criterion based on the reservation price only. Again, a pay-as-bid approach is employed. The reserve market in Germany provides that the minimum acceptable bid to participate in the auctions for the primary reserve and the aFRR is 1MW while for the mFRR is 5 MW.
France, on the other hand, adopts a mixed procurement model: the provision of secondary reserve is mandatory with capacity remuneration while FCR and tertiary reserve (both mFRR and RR) are procured through separate auctions.
In particular, the auction for primary reserve is held daily (D-1) and a pay-as-bid settlement of capacity is in force. In France, manual Frequency Restoration Reserve (mFRR) and Replacement Reserve (RR) are currently procured yearly (Y-1), and only reserved capacity is remunerated by pay-as-clear (marginal price pricing rule).
3.2. Balancing Market for Italy
The introduction of dedicated auctions to procure RR balancing capacity must provide equal opportunities to all market participants and increase market efficiency in order to avoid situations that could compromise the security of the power system. Based on the European benchmark, the following assumptions have been adopted to define the auction configuration [
14]:
Market access is voluntary for all power plants currently enabled for MSD which meet a set of technical requirements included in the Italian Network Code and its annexes. In the future this pool of resources can be expanded, with the aim of also allowing participation in Intermittent Renewable Energy Resources (IRES), storage and demand side response devices connected to the distribution network.
Capacity can be offered unit-by-unit or in an aggregate form. A unit-based approach is assumed to carry out the quantitative analysis. This is useful for defining offer strategies adopted by market participants, taking into account observed bidding strategies in the past for each unit;
The auction takes place daily, before the execution of the day-ahead market for the successive delivery day D;
The requirement (RR capacity demand submitted to the auction by the TSO) is defined for each bidding zone and also for the whole Italian power system;
RR capacity is traded in 8-h blocks;
The bids are activated according to the merit order, that is, the cheapest bids are activated first. Marginal pricing is applied in the auction;
Only balancing capacity (BC) is contracted in the auction, without any constraint on the related balancing energy (BE) price (in accordance with K. Poplavskaya e L. de Vries findings [
15]);
The activation of the capacity reserved will take place in the MSD/MB according to the existing procedures.
Once the auction has ended, market participants awarded with RR contracts are obliged to withhold the reserved balancing capacity from the energy markets and to make this quantity available in MSD.
4. Identification of a New Methodology
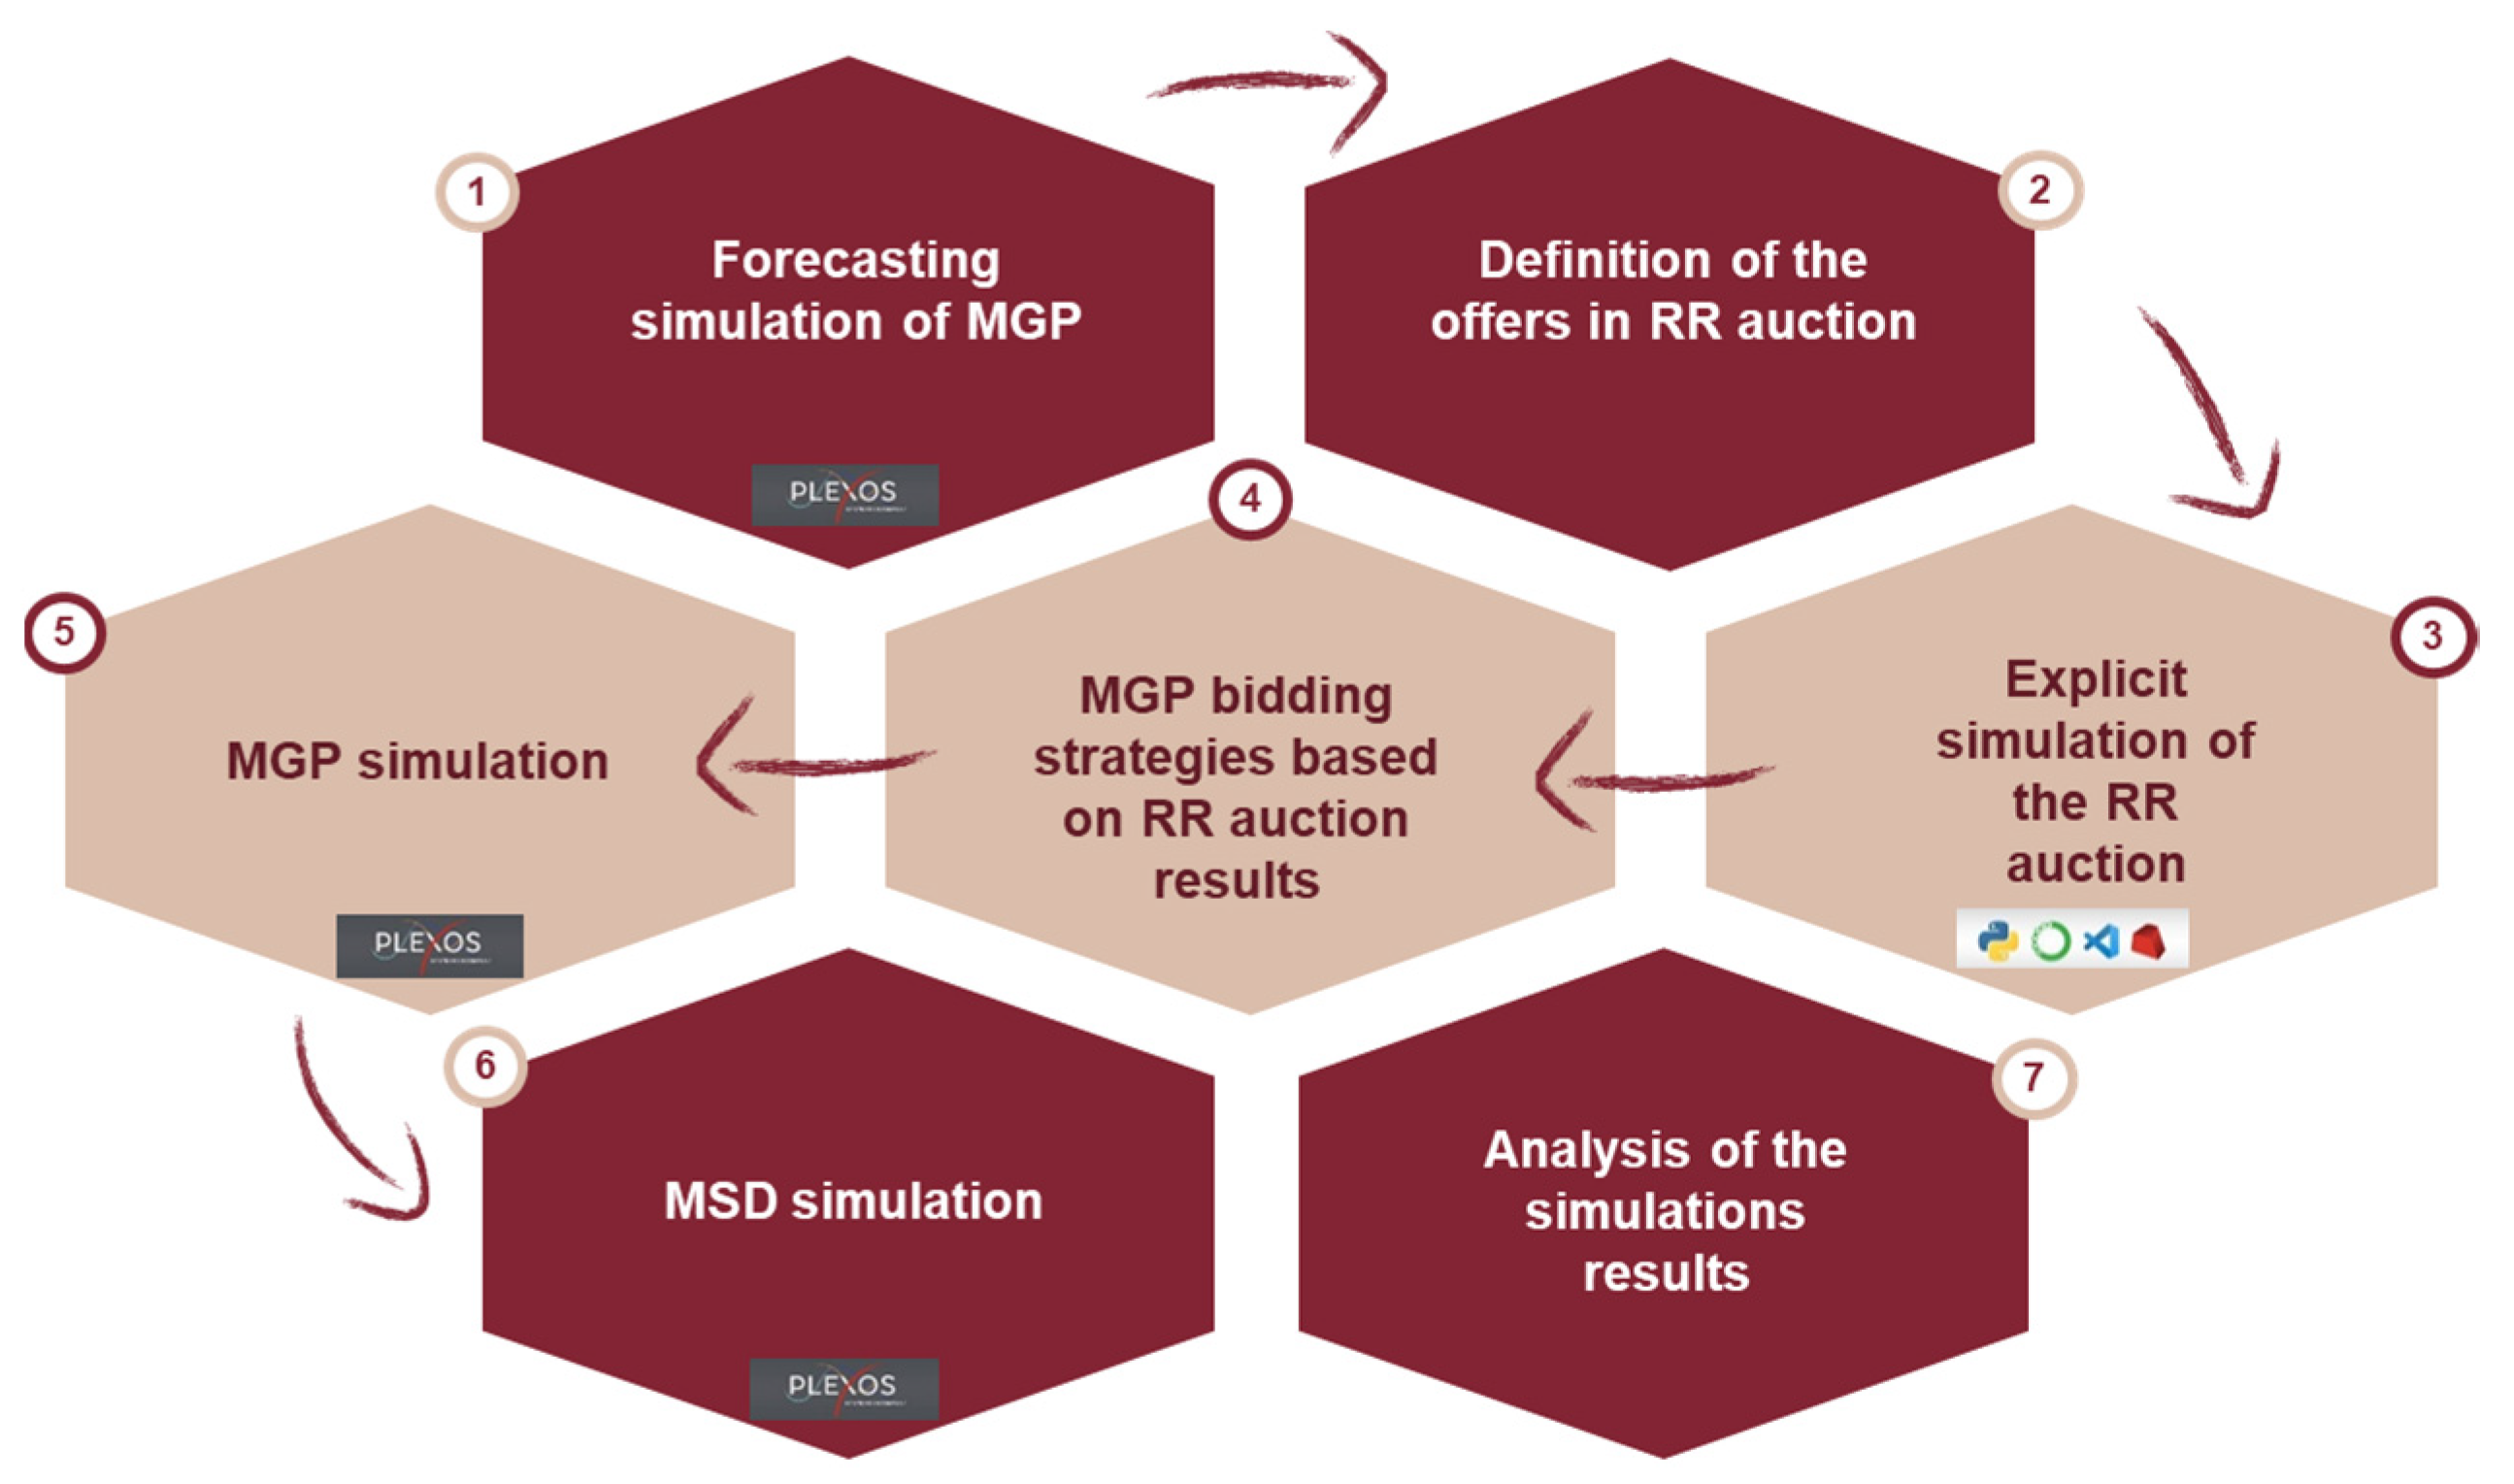
In order to understand the impact of this potential alternative methodology for RR procurement in the Italian Electricity Markets, a proper simulation chain has been set up and performed. The adopted procedure includes seven main steps, as shown in
Figure 1.
In the first stage, a forecasting simulation of MGP, based on historical data relating to the day-ahead energy market offers in the year 2019, has been performed. This step aims to emulate the forecasting exercise carried out by market participants in order to anticipate day-ahead market (MGP) outcomes and to reflect these expectations when submitting offers for the RR auction.
Coherently to this view, based on the results obtained from the initial step, in the second step of the procedure, RR auction offers are defined.
Having outlined the characteristics of the offers by means of which the balancing capacity is traded, the auction has been explicitly simulated. An optimization mathematical model developed in the Python programming language has been used (using Gurobi to solve the problem).
In the fourth step, offers to be submitted in the day-ahead market (MGP) are defined considering the results of the auction for replacement reserve.
In the next phase, the day-ahead market (MGP) has been simulated considering the offers defined in the previous step. In order to make the schedules consistent with the technical constraints of the production units, a simulation of the intraday market has also been carried out using a model similar to MGP.
In the sixth phase, a simulation of the Italian Ancillary Service Market (MSD) has been performed in order to identify potential savings in the cost of RR procurement in this market. So, a comparison was made between the total cost of the Electricity Markets (both MGP and MSD) with and without RR auctions.
At the end of the simulation chain, a check on the final profits of each market participant was conducted with the aim of testing the coherency of the bidding strategies identified: potentially, the procedure could be iterated by integrating a learning process into the procedure (further work is ongoing on this item).
4.1. PLEXOS Software
Plexos Market Simulation Software has been used to test the new methodology. Plexos is a problem-solving engine created by the company Energy Exemplar that allows simulation of the operation and management of a real-size power system as well as the development of a multitude of different scenarios.
In order to investigate the impact of the RR capacity auctions in Italy, steps one, five and six of the simulation chain (
Figure 1) have been developed and performed in Plexos. Input data and modelling parameters have been adapted according to simulation needs. The entire Italian 380/220 kV network has been represented in the developed Plexos model, in line with the current network topology adopted in MSD/MB and in the security assessments for operational planning tasks.
All thermoelectric and hydroelectric generating units enabled for MSD have been explicitly modelled in Plexos (regardless of the voltage level to which they are connected), as well as all thermoelectric and hydroelectric plants not enabled for MSD but connected to the 380/220 kV network. This set up allows us to reduce the number of variables that the optimization model must manage (other generation units are treated as price takers), accurately replicating the functioning of the Ancillary Service Market and representing in detail the production units that can potentially offer the replacement reserve capacity.
The time horizon that has been chosen for the simulations is annual with an hourly granularity (e.g. 1 h market time unit).
In particular, for the day-ahead energy market simulation (MGP), a model similar to the real one has been created: supply offers and demand bids are selected in order to maximize social welfare, respecting only the cross-zonal transmission limits computed by the TSO. GME’s public data for the year 2019 have been used as a reference to simulate the Day-Ahead Energy Market.
In order to provide technically feasible schedules as an input to the MSD, the Intra-Day Market (MI) has also been replicated in the simulation chain. To make this possible, the already-developed MGP model has been used, but it has been integrated with technical constraints of the production units (e.g., minimum up time, minimum down time, ramp rates, and minimum stable level).
Finally, in order to limit the computation burden, the Ancillary Service Market (MSD) has been simulated adopting a zonal approach: studying an annual time horizon, it has been chosen to simplify the nodal structure of this market and the potential intrazonal congestions have been neglected. Regardless, thanks to the highly granular bidding zone configuration applied in Italy, intrazonal congestions were rather limited in 2019. In this case, the actual MSD offers for 2019 have been considered in this study.
Back-Testing
Before launching the procedure to investigate the impact of the new RR auction, a back-test simulation has been performed to test the validity of the Plexos model created. Hence, to check the ability of the model to faithfully reproduce the real trend of MGP, starting from the data of the GME’s offers of 2019, all possible offer’s steps (consisting of a pair price-quantity) of each generation unit have been defined.
Figure 2 shows the PUN duration curve, which expresses the relationship between the values of the National Single Price (ordered in a decreasing way) and the percentage of the hours in which these prices exceeded or equaled a certain value over the entire period considered (year 2019).
The PUN estimated with the Plexos Simulation is perfectly aligned with the actual one. The blue line is the estimated PUN with Plexos software, while the orange dotted line shows the PUN derived from GME data. Between the 25th and 75th percentile an average value of the PUN between 60 €/MWh and 40 €/MWh can be identified for both cases (PUN Plexos and PUN GME). Therefore, the analysis has confirmed the validity of the Plexos model adopted.
Even at the zonal level, the PUN values of the two simulations are confirmed to be strongly aligned.
In particular,
Table 2 shows that the Plexos simulation slightly underestimates the price of each market area compared to energy market’s one by a value between 0.1 €/MWh and 0.4 €/MWh. An exception to this behavior is observed for the Sardinia bidding zone, whose price in the two cases considered is substantially the same. Overall, the National Single Price is underestimated by 0.2 €/MWh. This is due to the fact that the generation not explicitly modeled in Plexos is assumed to be a “price taker” (solar, wind, geothermal, thermoelectric and hydroelectric generation not enabled for MSD and connected to voltage levels below 220 kV, import) but actually, in some hours of the year it could set the price (in particular the import).
5. Test of New Methodology
Once the positive result of the back-test analysis was verified, the new methodology for RR procurement was tested according to the step procedure already described.
5.1. Forecasting Simulation of MGP
The investigated auction for Replacement Reserve is none other than a new market session placed before the day-ahead energy market. Thus, the forecasting simulation of MGP aims to reproduce market participants’ predictions of the outcomes of this market in order to define their bids for the RR auction.
In this case, we assume that market participants could not anticipate who will win the auction, but they can know the expected RR demand from TERNA. Procuring RR balancing capacity in advance would imply a reduction in the available generation capacity in the market. In addition, having set a requirement that the contracted capacity should be scheduled in the MGP in a way that the procured reserve could be delivered in real-time (without implying other actions from Terna side), it is reasonable to expect that market participants would provide RR with power plants that are not costing too much money to run (generation costs not significantly higher than the expected MGP prices). Considering these two assumptions, it is reasonable to expect an increased MGP price, and that (at least as a first attempt) market participants would anticipate MGP prices to increase system demand based on the RR requirement (shifting demand would have a similar effect to keeping out inframarginal supply quantities). Therefore, in order to carry out this Plexos simulation of MGP, the hourly zonal demand for electricity was increased by the actual RR capacity reserve allocated in each bidding zone during 2019, according to MSD’s final data in 2019.
According to the outcomes of the simulation, the months in which the allocated RR has the greatest impact on electricity demand are those of January, July and October where an increase of about 20TWh is registered, as shown in
Figure 3.
Simulation results show an increase in the average PUN value of about 8.9 €/MWh compared to the base case. In fact, it increases from a value of 52.1 €/MWh (registered in the back-test simulation) to a value of approximately 61 €/MWh. Observing the new PUN duration curve in
Figure 4, it can be seen that between the 25th and 75th percentile the average value of the PUN in the assessed scenario (with the increased demand) is between 80 €/MWh and 60 €/MWh (versus the range of 60–40 €/MWh of the base case).
In particular,
Table 3 shows that the Plexos simulation with the reserve increment leads to an increase in all zonal prices (P
z) especially for the Sicily area (it increases from a Pz of 62.8 €/MWh in the base case to a value of 80.8 €/MWh in the selected scenario). The reason can be found in the reduced market liquidity in the island (in reference to the Italian market bidding zones formally established in [
16]).
Figure 5 shows the cost increase observed in the day-ahead energy market when the reserve requirement is added to the energy demand: overall, there is an increase in the annual costs of the day-ahead energy market of approximately €2.6 billion. In fact, it goes from €15.61 billion in the base scenario to €18.24 billion in the analyzed case.
5.2. Definition of the Offers for the RR Auction
In the second step of the simulation chain, market participants’ offer strategies have been defined, assuming that their forecast of the day-ahead energy market would be the ones obtained in the previous step.
In particular, offers in the RR auction have been evaluated according to the opportunity cost of the individual production unit to operate between different markets.
The portfolio strategies already adopted by market participants in real markets remains unchanged as both the offers and the simulations are based on actual 2019 MGP and MSD data.
Thus, starting from the results of the forecasting simulation of MGP, RR auction bidding strategies have been defined as described in the following.
If the production unit is online according to the expected MGP outcomes, it has been assumed that the market participant would offer in RR auction:
The free capacity (Qfree), equal to the difference between the maximum power of the plant and the expected MGP schedule, at a price of 0 €/MW. The reason is that, for these production units, this share of capacity represents free headroom, in any case made available, free of charge, as an input of the Ancillary Service Market (MSD), so it is in the interest of the market participant to offer this free capacity (not committed in MGP) in the auction in order to receive the related marginal price.
The expected scheduled generation capacity in MGP (Qocc), that is, the difference between the power associated with the foreseen MGP schedule and the minimum stable level of the power plant (considering that the activation time of the Replacement Reserve would imply that the unit should be online), offered at a price equal to the difference between the expected MGP zonal clearing price and the Short Run Marginal Cost (SRMC) of the plant.
The approach used in the formulation of these offers allows for the guarantee of an equivalent profit between the acceptance of this capacity in the RR auction or in MGP (so the offer in the RR auction is based only on the opportunity cost to sell this capacity in the Day-Ahead Energy Market).
If, on the other hand, from the forecast simulation of MGP the production unit is expected to be offline, it has been postulated that the market participant would offer in the RR auction the entire range of available capacity (Qdown), equal to the difference between the maximum capacity and minimum stable level of the production unit, at a single price.
In this case, if the market participant is awarded with RR contracts in the RR auction, he must bear also the costs (if the SRMC is lower than the MGP zonal clearing price) necessary to keep the power plant at least at its minimum stable level (P
min), in order to ensure that the balancing capacity contracted in the auction can be activated within a proper activation time (2 h). The price at which the market participant offers this capacity is therefore equal to:
where:
- -
: price of the supply step of the generation unit on the Day-Ahead Energy Market;
- -
: Short Run Marginal Cost of the UP;
- -
: Minimum technical of the power plant;
- -
MGP zonal clearing price;
- -
range of available capacity .
In other words, the price at which the entire available capacity of the generation unit is offered consists of two components: the first component takes into account how much that unit would have earned/lost if it had been selected on MGP, while the second component takes into consideration the fact that, in reality, this unit will offer its Pmin at 0 €/MW on MGP.
In general, it has been assumed that the capacity is negotiated in the auction in blocks of 8 h, therefore the hours of the day have been divided into appropriate sets called “clusters” distinguished as follows: cluster “00-08”, “08-16” and “16-24”.
Figure 6 shows an illustrative example of the three different types of offers submitted by the market participants in auction.
In these evaluations, for the open cycle gas turbine and for hydroelectric plants a minimum power (Pmin) equal to zero has been considered. These plants, in fact, can also provide replacement reserve when they are switched off.
In order to reflect energy constraints which affect the ability of hydroelectric and pumping units to deliver the contracted capacity, a derating factor has been applied, respectively, of 0.25 for hydroelectric power pants and 0.5 for pumping units. Such values are in line with the “floor” values currently adopted in the Italian Capacity Market [
17].
5.3. Explicit Simulation of the RR Auction
Having outlined the characteristics of the offers by means of which the balancing capacity is traded, the RR auction has been explicitly simulated. An optimization mathematical model developed in the Python programming language has been used.
In general, a mathematical optimization model, with reference to the specific input instance, is able to find the best of the acceptable solutions, that is, a set of numerical values of control variables that, respecting all the constraints imposed, minimize (or maximize, depending on what is explicitly indicated by the model) the value of the objective function. Thus, to formulate the optimum problem the various entities that compose it were first defined: the objective function, the constraints and the variables.
In this study, the control variables consist of the accepted quantities of the offer steps (formed by price–quantity pairs) of all the production units. The constraints, on the other hand, are represented by a balance constraint, ensuring that the replacement tertiary reserve requirement is covered, and by cross-zonal capacity constraints, consisting of maximum and minimum transit limits between market areas. The analytic expression of the model created in the Python programming language can be placed as follows:
qi,gr is defined as the quantity offered by the i-th generation unit to the gr-th step (therefore constrained between zero and the quantity offered to the step of interest), at the corresponding bid price pi,gr (defined according to the procedure described in the previous paragraph).
The objective function is to minimize (independently in each block of hours) the cost of the selections and is thus formulated:
The national balance constraint, which the optimization problem must respect, can thus be expressed:
where
is the requirement of Replacement Reserve (RR) of the whole of Italy for the block of hours (8 h) in examination.
In order to ensure compliance with the transit limits, the following constraint is formulated for each bidding zone
z:
where:
: the quantity offered by the i-th generation unit to the gr-th step;
: import to zone z (if negative it indicates an export) on the market section s to which zone z is connected;
the Replacement Reserve requirement of the bidding zone z.
On each cross-zonal border it must also be verified that import (or export) is consistent with respect to the maximum and minimum transmission capacity limits between market areas as follows:
In order to ensure the feasibility of the optimization problem, the constraints have been formulated in soft mode, that is, introducing slack variables to which a penalization in the objective function is associated, in case of loosening of the constraint to which they are referred.
The input data to the optimization model thus formulated have been:
offers for balancing capacity procurement submitted by all operators participating in the RR auction;
Replacement Reserve (RR) requirements: in this study, we used actual data from the year 2019;
maximum and minimum transmission capacity limits between bidding zones. Since, for the time being, there is no procedure in place to reserve capacity from MGP, the transmission capacity values adopted in the RR auction should reflect the expected availability of capacity after MGP. For this reason, in this study an average value for the 8-h block of free capacity resulting from the first forecasting simulation of MGP has been considered.
The algorithm (using Gurobi solver) has been thus able to produce as output the optimal solution of the quantities accepted on each production unit for each cluster of hours considered, in compliance with all the constraints imposed.
Analyzing the results of the auction explicitly simulated, the duration curve of the quantity accepted in the auction (on a national level) shows the trend depicted in
Figure 7, with a maximum of 4790 MWh. Between the 25th and 75th percentile, a value between 3500 MWh and 2500 MWh is identified.
The reserve capacity accepted in RR auction is thus distributed among the different bidding zones (
Figure 8).
It is noted that in the South area, the largest quantity of replacement tertiary reserve is procured even if the largest demand is located in the Northern area: available transmission capacity allows for cross-zonal support.
The simulated RR auction has a total annual cost of €38 million due to the Sicily area. In fact, this is the only market area where the procured capacity for RR has a price different from 0 €/MW, that is, the marginal clearing price of the RR auction is not zero (
Figure 9). This reflects the (tight) balance conditions between available generation/import capacity and energy/reserve demand in this bidding zone, which is also reflected in actual market outcomes (Sicily’s average day-ahead price is typically the higher than all the Italian bidding zones).
The cost of the RR auction has been calculated as the hourly product between the marginal zonal price at which the auction cleared and the corresponding quantity was accepted in the examined area.
In particular, as shown in
Figure 10, the marginal clearing price of the Sicily area is equal to 0 €/MW for 70% of cases, and only for the remaining 30% assumes a nonzero value, on average equal to 40 €/MW.
5.4. MGP Bidding Strategies Based on RR Auction Results
Once the results of the RR auction have been obtained, MGP offers can be defined in order to carry out the new Plexos simulation that takes into account, this time, the capacity already contracted, and then constrained, in RR auction (without increasing the energy demand).
It is assumed that the production units which have been awarded with the RR contracts offer their Pmin at 0 €/MWh in MGP during the hours subject to allocation, in order to fulfil their obligation.
The quantities accepted in the RR auction as balancing capacity are subtracted from the highest bidding step—the highest-priced one—of each generation unit. Hence, for the units awarded in the auction, the MGP bidding steps have been defined as follow:
the first step is given by a quantity equal to the Pmin of the power plant offered at 0 €/MWh;
the second step consists of a quantity equal to the minimum between the quantity offered by the generation unit on the second step of MGP (according to the forecasting simulation of MGP) and an amount equal to the total power offered on MGP minus the quantity accepted in auction and that of the first step (Pmin). In this case, the offer price is set at 3000 €/MWh (CAP) if the capacity so formulated is zero, otherwise it is equal to the second step price of the predictive simulation of MGP. In formula it can be expressed as following:
In other words, the second offer step in unchanged if the remaining capacity is enough to cope with the RR obligation (remaining capacity being the difference between the total available capacity and the sum of the quantities offered in the first and second steps).
for the following steps, until reaching the last step of the offer, the procedure is the same: the quantity offered on the previous step is also subtracted from the quantity formulated in the second step. The offer price is subject to the same considerations as in the previous case.
These changes to the MGP offers could have two potential effects on the clearing prices:
decreasing effect, because additional capacity is offered as a “price taker” (the minimum stable level of awarded units);
increasing effect, because part of the offered capacity is withheld to cope with RR capacity obligation (also considering that, according to the bidding strategies defined in the previous chapter, typically the units awarded by RR contracts are the ones close to the expected clearing price).
5.5. MGP Simulation
A new simulation of MGP has been carried out by entering the data, relating to the MGP’s offers in the year 2019, adjusted as indicated in the previous step. In this case the RR requirement has not been considered because it has been already supplied in the auction (RR requirements have been reduced by the offers according to the procedure described in the previous paragraph).
Plexos simulations show that the introduction of the new auction to procure RR leads to an increase of 3.1 €/MWh of the PUN compared to the base case. In fact, it increases from a value of 52.1 €/MWh of the base simulation (before the coordination with the auction mechanism) to a value of about 55.2 €/MWh.
Analyzing the new PUN duration curve in
Figure 12, it is noted that between the 25th and the 75th percentile, the average PUN value, in the case with implementation of the auction mechanism, is between 65 €/MWh and 45 €/MWh (compared to the range 60–40 €/MWh of the base case).
Table 4 shows that the Plexos simulation, which takes into account the results of the auction, leads to an increase in all zonal prices (Pz) excluding the Sicily area, where there is a reduction of 10.8 €/MWh in the Pz compared with the base case. Therefore, the Sicily zone presents the greatest benefit of the introduction of the RR auction mechanism in the analysis in reference.
An assessment of the impact of the RR auction in terms of day-ahead market costs has been conducted. An increase in the annual total cost of MGP by €1.14 billion is observed when the RR auction is in place: The total MGP base case cost is around €15.61 billion, while MGP costs observed when the BC auction is introduced are around €16.75 billion.
Figure 13 shows the monthly MGP costs increase.
As pointed out in the previous paragraph, the effect of the auction is twofold: on the one hand, some quantities are brought to 0 €/MWh (as said, the generators which have been awarded with RR contracts offer their Pmin at 0 €/MWh in MGP) and this could lead to a potential price reduction. On the other hand, however, in the reformulation of MGP’s offers, the balancing capacity is removed from the higher price steps of each awarded unit, potentially increasing market prices (since the awarded units are typically the ones close to the marginal price of MGP). The final effect of these two different dynamics changes from hour to hour, depending on the specific operating conditions. Nevertheless, there is a strong prevalence of the second effect, which becomes even more preponderant in hours with high demand (when the price is multiplied by a higher demand).
5.6. MSD Simulation
In order to have a comprehensive view of the result of the mechanism under assessment, the Ancillary Service Market (ex-ante MSD) has been also simulated in Plexos. Given that on the MSD, Terna usually implements the capacity allocated in the energy markets to solve congestions and to create reserve margins, it is expected that with this approach the Italian TSO selects less offers than in the actual case. This is because the balancing capacity has already been contracted before MGP.
Also, in this case, to reliably reproduce the behavior of the Ancillary Service Market (MSD) a Plexos model similar to the real one has been created.
Thus, starting from the schedules resulting from MGP/MI simulations, the model minimizes the cost of the necessary selections (up/down) to ensure compliance with network constraints and to set up adequate reserve margins (considering the transmission capacity between market areas as well as technical constraints of power plants). The input data are actual data for the year 2019.
From the comparison between the scenarios with and without the RR auction, a total annual saving of €0.1 billion is expected. This confirms that the reserve capacity previously contracted in RR auction allows for reduction in the amount of resources selected by Terna in the MSD.
Figure 14 refers to the monthly detail of the cost increase observed between the two simulations. It goes from €1.64 billion in the base case to €1.55 billion in the simulation in which the RR auction is held.
The reason that the overall costs of MGP are much higher than the savings on MSD is found in the different quantities traded in these markets. Quantities traded every year in MGP are in the order of magnitude of 300 TWh, while in MSD 15–20 TWh are traded each year (considering “sell” quantities). Thus, even if prices in the Ancillary Service Market (where a pay-as-bid rule is applied) are generally higher than those in MGP (where marginal prices are adopted), a little change in the marginal MGP price is applied to a very large amount of energy, implying a relevant change in the overall costs.
It is precisely this scale factor that makes sure that every small variation of the volumes of energy on MGP leads to a much-elevated total cost of the system compared to what would happen on MSD.
5.7. Final Profits of Every Market Participant
As the last step of this procedure, the final profits of each generation unit modeled in Plexos was computed. This check allows us to obtain a confirmation about the formulation of the bidding strategies and therefore the convenience for market participants to join the RR auction.
The profits, for simplicity, have been verified for a single generation unit and then reported to the corresponding market participant. For confidentiality reasons, in the following discussion the market participants have been anonymized.
Firstly, overall MGP profits of each market participant has been analyzed. The profit is the sum of the incomes observed in the MGP simulation and those resulting from the RR auction itself. Compared to the base case, it is noted that most of the market participants gain an economic advantage from the introduction of the RR auction, as shown in
Figure 15.
Figure 16 refers to the respective balancing capacity contracted in RR auction by each market operator.
There is no direct correlation between the total profit in MGP and the contracted capacity in the RR auction. In fact, the market participants U7 and U12 contract, respectively, 3200 GWh and 2100 GWh in the RR auction but these quantities are not reflected in the revenues on MGP simulation.
Figure 15 shows that the operator U29 has the highest profit (about €570 million) and is also the operator who has been awarded the largest amount of capacity in auction (about 11.000 GWh). In this case the reason lies in the fact that U29 has the largest generation fleet at national level.
The profit analysis on MSD, conducted in the same way, shows instead that the market participant who has the largest reduction in his profit (approximately €120 million) compared to the base MSD is U29 (
Figure 17).
At the end of the simulation chain, the total profit of each market participant (given by the sum of the delta profit MGP and the delta profit MSD), shows that the RR auction implies advantages for most of the market participants, in particular for those who have a higher profit already in MGP (
Figure 18). This confirms that MGP has a greater impact than MSD on most of the market participants for the reasons mentioned previously. Regardless, some “losers” are identified and this could be used as a signal for correcting the bidding strategies applied by these parties: this approach is currently under investigation.
6. Conclusions
The introduction of a Replacement Reserve auction held in advance of the day-ahead energy market allows the Italian electricity market to be more coherent with the approach adopted in other EU countries, improving the harmonization of price signals arising from the day-ahead market. However, this is at the expense of the greater efficiency of Terna reserve procurement in MSD, which allows a tailored sizing and procurement of reserve capacity, which occurs closer to real-time. The analysis carried out it this study, aimed at defining the impact of the new auction on the whole sequence of markets, has shown that direct costs of the RR auction are expected to be low. In fact, in a context of high competition (e.g., no locational market power) and in absence of portfolio strategies (in addition to the ones already included in the actual market offers), the marginal clearing price of the RR auction tends to be zero in many areas of the Italian market. Despite this, indirect costs are high, in particular, an increase in the MGP costs is observed, and this is much higher than the estimated savings in MSD. This is due to the different size of these markets in terms of traded volumes. Based on such findings, activation of the reserve auction only in the cases in which the TSO expects a potential risk of simultaneous reserve scarcity across several European countries, could be suggested. It would be a matter of selecting the clusters in which the market demand of the production of renewables exceeds a certain critical threshold, thus identifying the situations in which Italy could export to neighboring EU countries.
Further work is currently ongoing in order to improve some assumptions introduced in the simulation chain and, in particular, to iterate the procedure in such a way that “losers” can react by adjusting their bids as well as adapting the first MGP forecasting step in order to produce results closer to the MGP simulation run after the RR auction.


 ,
, 