Article

Techno-Economic Feasibility of the Longwall Top Coal Caving Method Based on the FTCD Index: A Parametric Case Study in India

by
Nasina Balasubrahmanyam
1,* and
Gnananandh Budi
2
1
Directorate General of Mines Safety, GoI, CGO Towers, Hyderabad 500080, India
2
Indian Institute of Technology, Indian School of Mines, Dhanbad 828201, India
*
Author to whom correspondence should be addressed.
Energies 2021, 14(19), 6115; https://doi.org/10.3390/en14196115
Submission received: 16 August 2021 / Revised: 20 September 2021 / Accepted: 22 September 2021 / Published: 26 September 2021

Abstract

:
An extraction method for deep-seated thick seam deposits by underground mining with high resource recovery has remained a great challenge for Indian mining engineers, whereas the longwall top coal caving (LTCC) method has evolved as an effective method for various geo mining conditions in China and other counties. The percentage of top coal recovery (TCR) plays a predominant role in determining the feasibility of LTCC, which relies on the First Top Coal Caving Distance (FTCD). In this paper, the critical geotechnical parameters are identified, numerically simulated, and statistically analyzed, and the FTCD for Indian geo-mining conditions is developed and validated. A financial assessment is conducted, considering 70% top coal recovery at 85% performance level, cost of production escalated by 20% and fall in coal grade by two grades. The internal rate of return (IRR) for LTCC is 30.24% as per the sensitivity analysis where it is only 18% in single pass longwall method. This study contributes to evaluating both the technical and economic feasibility of introducing LTCC in Indian geo-mining conditions.

1. Introduction

The Bord and Pillar method with continuous miner and shuttle cars combination and single-pass longwall (SPL) mining are the two most predominant underground thick seam mining methods in India, which are limited to the extraction of coal seams up to a thickness of 4.5 m. On the other hand, the share of coal reserves in seams above 5 m thickness is 60% of Indian proved coal reserves, while the low recovery methods extract the thick coal seams, and most of the deep-seated thick seams are virgin. Longwall mining with inclined, horizontal, diagonal, and transversely inclined slicing methods in ascending/descending/both was executed in Indian coal mines [1]. The constraints due to the high variation of thickness of the coal seams, driving of gate roads for every slice, and the coal seams maintaining their stability made the methods unfeasible.
The blasting gallery (BG) method was implemented effectively from 1987 to 2020 in India to extract seams up to 11 m thickness. The extraction involves ring hole drilling and blasting 1.5 m slices. The main limitations of the method are: (i) it is unsuitable for gassy seams, (ii) seams are steeper than 1 in 5 gradients, (iii) seams are susceptible to spontaneous heating, and (iv) there is the presence of hard-to-cave overlying roof strata. Due to frequent fire and strata control problems, the method perished in operation in India. The sublevel caving mining method was experimented with at the East Katras colliery [2] to liquidate a thick (7.5 m) coal seam at 147 m depth with semi-mechanized longwall equipment. The method failed due to the inadequacy of power supports to withstand the broken roof rock strata. Indian Mining Industry’s concentrated efforts were on bulk production of coal from Open Cast Mining. On the other hand, during the past two decades, the Longwall Top Coal Caving (LTCC) method evolved as a successful method for the extraction of thick and extra-thick coal seams under different/difficult geo-mining conditions in China and subsequently in Australia, Vietnam, Turkey, and Bangladesh. More than 100 LTCC panels are worked in China, extracting more than 10 MTPA (Mtpa, Million Tons per Annum) from each panel.
The LTCC method combines the traditional longwall method with a mechanism of caving the top coal and drawing the same from the rear AFC. Gate roads are developed along the bottom section of the seam, and the power supports are equipped with an AFC on their rear side.
A basic principle of the LTCC mining method is that the coal must be strong enough to maintain the face stability, while at the same time, it must be weak enough to cave. The caveability of top coal is the sensibility and possibility for caving under the action of mining-induced front abutment stresses. Acceptable top coal caveability and recovery is the major objective of the method, and hence its evaluation is the basic requirement for planning for the adoption of the LTCC method.
Based on theoretical analyses, field investigations, physical modeling, and numerical analysis, the researchers developed several methods for assessing the top coal caveability. The researchers observed that the feasibility of LTCC application is influenced by major geo-mining conditions such as the thickness, strength, inclination, deformation properties of coal seams; strength and thickness of overlying roof rocks and geology [3]; and other parameters such as the mine life, financial health of the mine, and equipment health and life [4].
The main challenges of LTCC are preventing the coal loss in the goaf and reducing coal degradation with rock. The top coal of 1.5 m thick immediately above the power supports fractures desirably, whereas top coal in a 3.5 m thick layer above the fractured coal fractures moderately [3,5]. The top coal fracturing is basically due to the abutment stresses induced due to mining and the strength of the top coal [6,7,8]. The top coal fracturing is the result of the shear failure and tensile cracking in it. The cracking and fracturing process initiates when peak front abutment stresses are generated (2 m–10 m from the face under different geo-mining conditions) [6,7,8,9] due to the extraction process. Under the influence of these stresses, the top coal undergoes horizontal dilation and is subjected to the vertical load without proper confinement in the horizontal direction. As a result, the top coal is fractured and caves down along the rear canopy onto the rear conveyor by gravity. Researches on LTCC show that the top coal 1.5 m thick and immediately above the power supports fractures desirably, whereas top coal in a 3.5 m thick layer above the fractured coal fractures moderately [3,5]. Further, the 2–3 m of top coal above the support is fractured suitably and by frequent setting up of the support as the support advances. Humphries et al. 2006 [8] illustrated that the top coal is fractured due to the vertical front abutment pressures and loosened by the mining cycles. With the advancing of the support, the lower restraint to the top coal is removed, and as a result, the broken top coal falls directly onto the rear armored flexible conveyor. The cutting height shall be large enough to break the caved coal in bulk while flowing down.
To sum up, the parameters that influence top coal caveability can be grouped into surrounding strata, coal seam characteristics, stress conditions, etc. Coal seam characteristics include uniaxial compressive strength (UCS), top coal thickness, discontinuities, and extraction height of the coal seam (cutting and caving ratio). Surrounding rock strata characteristics include immediate roof caveability (a weak and thin immediate roof facilitates more top coal recovery [10]), main roof (a thick and large bed inhibits the vertical stresses, resulting in less recovery of top coal), and floor (a weak floor affects the stability of the powered roof support). The orientation of the longwall face [11] with respect to in situ stresses and dipping of the coal seam are studied by Dao [12].
The coal’s strength refers to its resistance to failure under stress and is normally measured in uniaxial compressive strength (UCS) and modulus of elasticity (E). The higher the coal strength, the lesser the caveability. The depth of cover decides the in situ vertical strata stress and the front abutment stresses induced due to the extraction. The failure strength of top coal is dependent on the magnitude of compressive strength. The denser the joints and cleats, the much easier the top coal would break. The thickness of the bands in the coal seam and their characteristics affect the caveability of top coal. In a highly jointed rock mass such as coal measure rock, there is an assumption that the roof rock caving is mainly controlled by discontinuities [11,13]. The soft band can become the weak bedding of the seam, which positively affects caveability. However, a hard and thick band will have a negative influence on its caveability. The immediate roof has a direct influence on the caving movement of the top coal. If the immediate roof is strong enough to keep hanging, the broken top coal will cave beyond the rear canopy in the goaf, resulting in top coal loss. An immediate roof with a certain thickness that can backfill the goaf after fall and that cave immediately with the advancement of the roof support is the most desirable condition for smooth breakage and is therefore good for top coal caving recovery.
During the initial advancement of the LTCC face from the set-up room, the full top coal caving starts after a certain distance depending upon the site-specific geotechnical parameters discussed in this paper. The distance is called the First Top Coal Caving Distance (FTCD) in this paper. The part of the initial un-caved top coal is unrecoverable and lost in goaf. Subsequently, the top coal caving is regular and recoverable. Furthermore, the part of the initial un-caved top coal is lost in goaf. Several studies were carried out on top coal first caving distance. The effect of the inclination of the seam on the caving interval was studied theoretically and observed that the failure first occurs in the middle-lower part of the length of the face and subsequently extends to the other two ends [14]. The top coal’s first caving occurs in the stress caving mechanism, as observed by numerical analysis [5].
The First Top Coal Caving Distance (FTCD) is one of the significant parameters considered for assessing the caveability of the top coal stratum and the success of LTCC. FTCD is the face retreat distance, where the top coal initiates the cave. The FTCD is high when compared to the regular caving distance of top coal after the first top coal caving occurred, because, in the uncaved top coal, the horizontal stress could still transmit, making the top coal stable [5,12]. After the first caving of top coal, the top coal is relieved from the horizontal stress, making the top coal easily caveable. Vakili and Hebbelwhite [13] conducted studies on FTCD for different mining conditions using discontinuum modeling with elastic rock material. A top coal caveability classification to determine the percentage of top coal recovery (TCR) by determining FTCD was carried out by Vakili and Hebbelwhite [13] for Australian geo-mining, presented in Table 1.
The Australian and Indian coal measure strata belong to the Permian period of stratigraphic systems and can be correlated and similar in most aspects. Hence, the concept of FTCD for Indian conditions is studied in this paper.
The data set of coal seams on UCS, in-suit stresses, the thickness of coal seam and top coal, cover depth, and discontinuities in coal seams are considered to be the most important parameters for top coal caveability [5,12]. Based on the study of the observations of the researchers of LTCC, five key geotechnical parameters that influence the success of LTCC were identified for the present study. They are the cover depth of coal seams, top coal thickness, extraction height, Central Mining Research Institute—Indian School of Mines—Rock Mass Rating (hereafter as RMR), and UCS of coal strata. The cover depth of coal seams below 300 m is almost depleted; the future of underground mines lies between 300 m and 600 m, which is considered for the study. The UCS of coal seams in India is below 50 MPa [15]. The study on discontinuities in coal seams is limited in Indian coalfields and is often misapprehended by the site constraints. However, studies on RMR for Indian coal mines are easily available for almost all of the mines, which takes care of the discontinuities aspect, and it is incorporated, making the study suitable for easy application. The RMR is an efficient system developed exclusively for Indian coal mines after thorough investigations at different Indian geo-mining conditions [16,17,18,19]. The RMR is based on the summation of five individual parameters, i.e., weather ability, UCS of rock strength, structural features, groundwater seepage, and layer thickness. Structural features include geological structures which result in roof deterioration and include major joints, slips, faults, and other sedimentary features [20]. The Shorey failure criteria [21], which are generally used to obtain the average safety factor (SF) of the rock mass of coal seams, are applied in the numerical modeling. The RMR of the majority of coal seams in India varies from 34 to 57 [19].
In India, the majority of the thick seams have considerable hardness, and they are overlain by generally massive sandstones. It is to note that in China, LTCC has proven to be successful in such geo-mining conditions [22]. To deal with harder coal, roof softening by hydraulic fracturing [23] and pre-fracture blasting strategies to form cracks in the top coal [6] are practiced. Modifications to the shield design by incorporating a vibrator system in the shield support are being tested [9,24].
The data of these parameters were used in a parametric study with numerical modeling, and an index called the ‘first top coal caving distance’ (FTCD) was developed through regression analysis. The validation was completed with one longwall mine having similar geo-mining conditions as LTCC. The financial assessment was conducted considering 70% top coal recovery at an 85% performance level; the cost of production escalated by 20% and fell in coal grade. The internal rate of return (IRR) for LTCC was 30.20%, according to the sensitivity analysis results. This paper assesses the feasibility of introducing LTCC in both the technical and economic perspectives in Indian geo-mining conditions.

2. Numerical Modeling for Evaluation of LTCC Parameters

In order to study the caving mechanism, various approaches, such as empirical and observational methods [6], numerical analyses [6,25,26,27], physical methods [7,28,29,30], and analytical methods [6,14,30,31], have been applied by researchers in top coal caving, and different caveability evaluation methods have been developed accordingly [8,9,14,24,30].
Since there is no mine operating LTCC in India, numerical modeling methods can be instrumental in simulating, predicting, and evaluating the top coal caveability [5]. Several researchers observed that basic strata mechanics and induced stress regimes of LTCC are similar using the SPL method [5,7,32]. Hence, for simplification and to focus on top coal caving, it is presumed that the geo-mining conditions of the study areas are favorable for conventional SPL mining. The finite difference method is utilized for the prediction of the top coal caving by FLAC 3D software [33]. Numerical analysis was completed by varying the different key parameters such as UCS, the thickness of immediate top coal, RMR values of coal, extraction height, and depth ranges. Due to the complex nature of 3D, FLAC 3D was run in 2D to model the actual mining conditions in two dimensions.

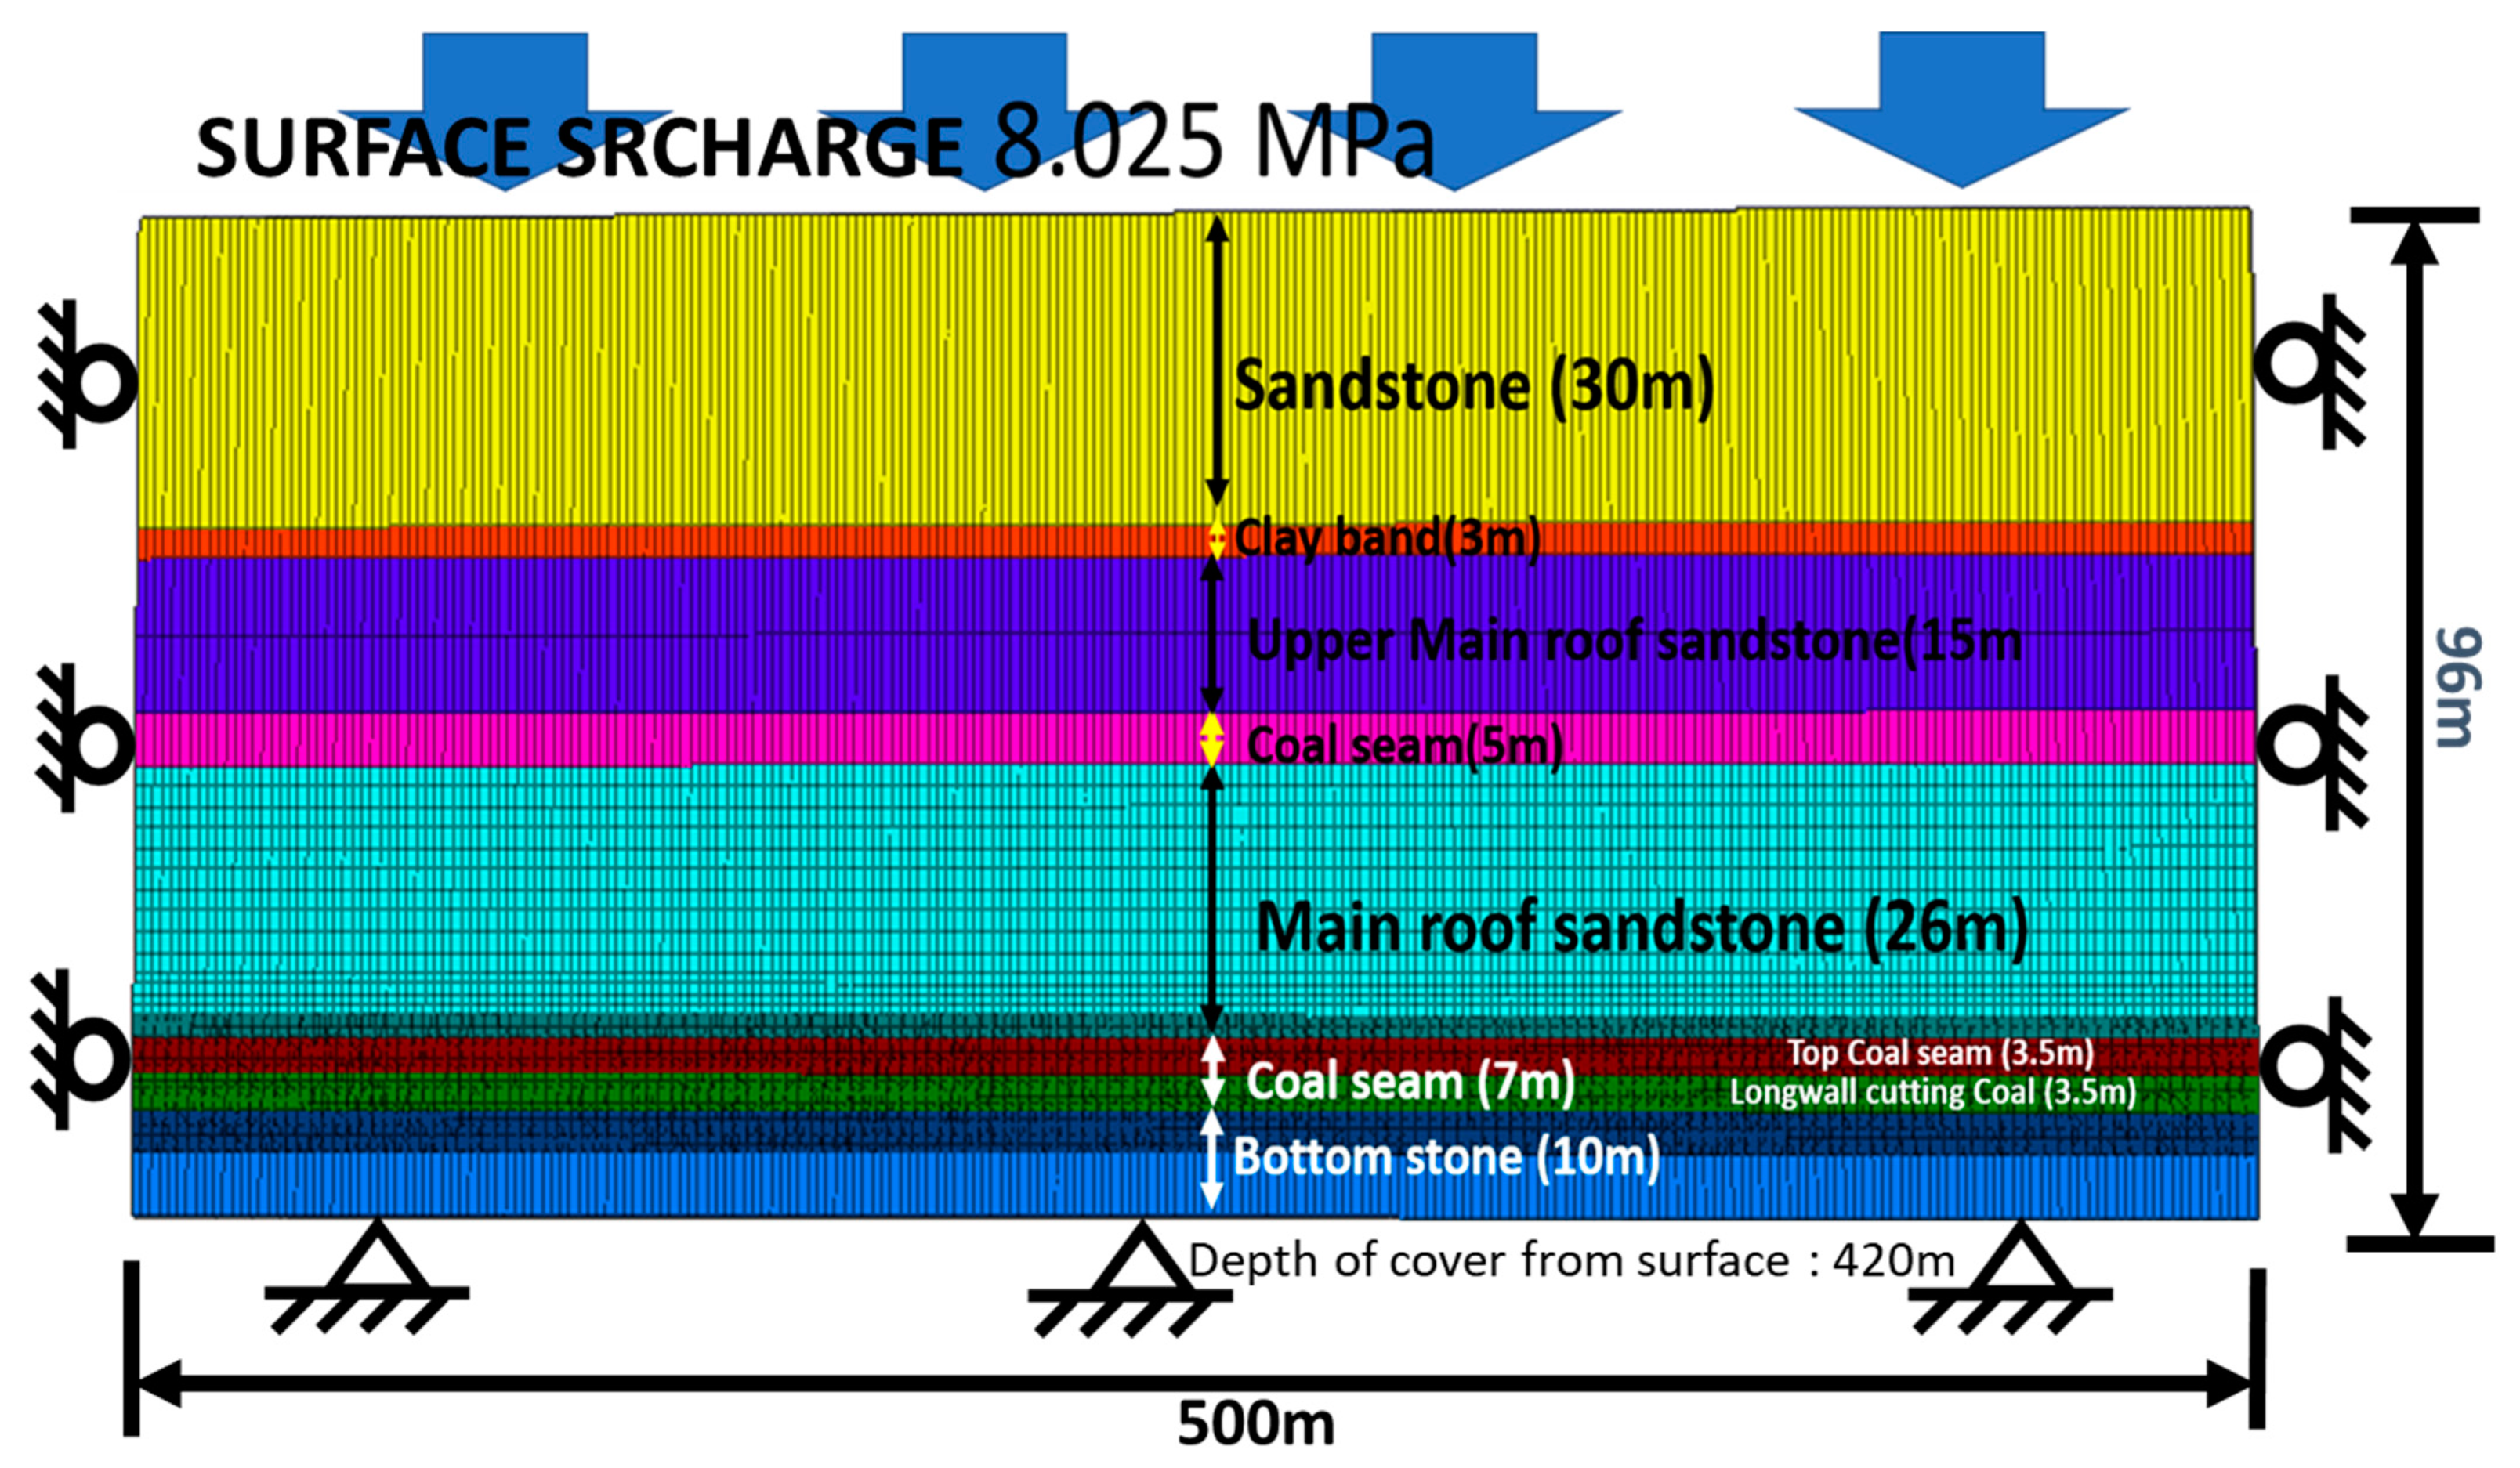
2.1. Model Development

A seam of 7 m thickness is considered. The bottom section of 3.5 m coal is extracted by the shearer, and the remaining 3.5 m thick top section of coal is to be recovered as top coal by caving from the rear AFC as soon as the supports are advanced. The distance per cut is considered as 1 m. The length of the longwall panel was 500 m (co-ordinate axis +x in the model) with overlying strata of up to 96 m (Y-axis), i.e., with different layers as presented in Figure 1. The boundary conditions are assigned in the following manner: both the side displacements of the model are fixed along with the X and Y directions. The bottom displacements are fixed along the Z-direction. The implication of the fixation of the boundary is to allow the grids in the face to slide but not to move perpendicularly to the planes. The overburden effect is simulated by applying an equivalent compensated vertical stress of 3.12 MPa in the negative z-direction to represent the in situ stress. The strata layers are assigned physico-mechanical properties (Table 2). The truncated load was applied to the model to give a stress regime according to the depth. The major horizontal stresses were applied as per the following relationships as derived by the hydro-fracturing technique conducted at depths from 77 to 522 m by M/s Mesy India [26,34] for the Godavari Valley Coal Fields (GVCF):
Sh, MPa = 2.05 + 0.0092 × (Z − 77)
SH, MPa = 3.13 + 0.0142 × (Z − 77)
where SH and Sh are the major and minor horizontal in situ stresses, respectively, and MPa and Z are the depth of cover in m. The capacity of the powered support is taken as 1152T and applied upward on the roof and floors of the extraction height.
The powered roof supports of the Adriyala Longwall Project (ALP) mine, which are 1.75 m wide and have a 4.8 m long canopy, are considered. The simulation of powered roof support was applied by calculating the vertical force component (1152 × 9.81 × COS 30° = 9787.057 KN) of the yield load (2 × 1152 tonne capacity = 11,301.12 KN). This load is uniformly applied upwards on the canopy roof at every node (9787.057 KN/33 nodes = 296.577 KN). Similarly, the load was applied downwards on the area of the floor of the base. Such upward and downward nodal force application simulates the forces exerted by the power support on the roof and floor, respectively. The distance per cut is considered as 1 m.
Meshing and discretization: coal seam meshing was carried out with a 0.25 m cubic grid. For all other strata of the model, a 1.0 m grid was taken. The power support was simulated with a setting load at 80% of the yield load (1152 T). The extraction height of 3.5 m from the stone floor was carried out, and for different progress lengths, the failure model of top coal was modeled according to Shorey failure criteria [20]. Based on SFs in the top coal, an SF of less than 1.0 is considered a failure. Each model was simulated for different distances of advances of roof support from longwall set up room till the entire thickness of top coal fails, i.e., SF <= 1.

2.2. Parametric Study and Numerical Modeling

The model was run for different ranges of uniaxial compressive strength (UCS) of coal, the thickness of immediate top coal, RMR values, extraction height, and different depth ranges, etc., and results were modeled based on numerically modeled outcomes.
In this study, there are twenty models that are categorized into five groups, namely, Scenario I, II, III, IV, and V. The details of all scenarios are presented in Table 3.
Scenario I: Modeling for different ranges of uniaxial compressive strength (UCS) of coal:
For the modeling, different UCS values of coal from 15, 20, 30, to 40 MPa were considered. A 3.5 m height of extraction and 3.5 m thick top coal were considered. The RMR value and depth were taken at 40 and 400 m, respectively. By varying the UCS of coal, the failure contours were derived by numerical modeling. The maximum FTCD was obtained when the UCS was 40 MPa. For UCSs of 15, 20, 30, and 40 MPa, the FTCD obtained was 3, 4, 5, and 6 m, respectively, as shown in Figure 2.
Scenario II: Modeling for different RMR values:
For the modeling, different RMR values, including 30, 40, 50, and 60, were considered. A 3.5 m height of extraction and 3.5 m thick top coal were considered. The uniaxial compressive strength value and depth were taken at 20 MPa and 400 m, respectively. By varying the RMR of coal, the failure contours were derived by numerical modeling. The maximum FTCD was obtained when the RMR was 60. For RMR of 30, 40, 50, and 60; the FTCD obtained was 3, 4, 5, and 6 m, respectively, as shown in Figure 3.
Scenario III: Modeling for different depth values:
For the modeling, different depth values from 300, 400, 500, to 600 m were considered. A 3.5 m height of extraction and 3.5 m thick top coal were considered. RMR values and uniaxial compressive strength were taken at 40 and 20 MPa, respectively. By varying the depth, the failure contours were derived by numerical modeling. The maximum FTCD was obtained when the depth was 300 m. For depths of 300, 400, 500, and 600 m, the FTCD obtained was 6, 4, 4, and 3 m, respectively, as shown in Figure 4.
Scenario IV: Modeling for various thicknesses of top coal values:
For the modeling, different top coal thickness values from 2.5, 3.5, 4.5, to 5.5 m were considered. An extraction height of 3.5 m was considered. RMR values, uniaxial compressive strength, and depths were taken at 40 MPa and 400 m, respectively. By varying the top coal thickness, the failure contours were derived by numerical modeling. The maximum FTCD was obtained with 5.5 m top coal thickness. For top coal thicknesses of 2.5, 3.5, 4.5, and 5.5 m, the FTCD obtained was 3, 4, 6, and 8 m, respectively, as shown in Figure 5.
Scenario V: Modeling for different extraction height values:
For the modeling, different extraction height values ranging from 3.0, 3.5, 4.0, to 4.5 m were considered. A top coal thickness of 3.5 m was considered. By varying the extraction height, the failure contours were derived by numerical modeling. The maximum FTCD was obtained when the extraction height was 4.5 m. For extraction heights of 3.0, 3.5, 4.0, and 4.5 m, the FTCD obtained was 5, 4, 4, and 4 m, respectively, as shown in Figure 6.

3. Results and Analysis of Numerical Modeling

3.1. Summary of the Parameters and Results of the 20 Cases

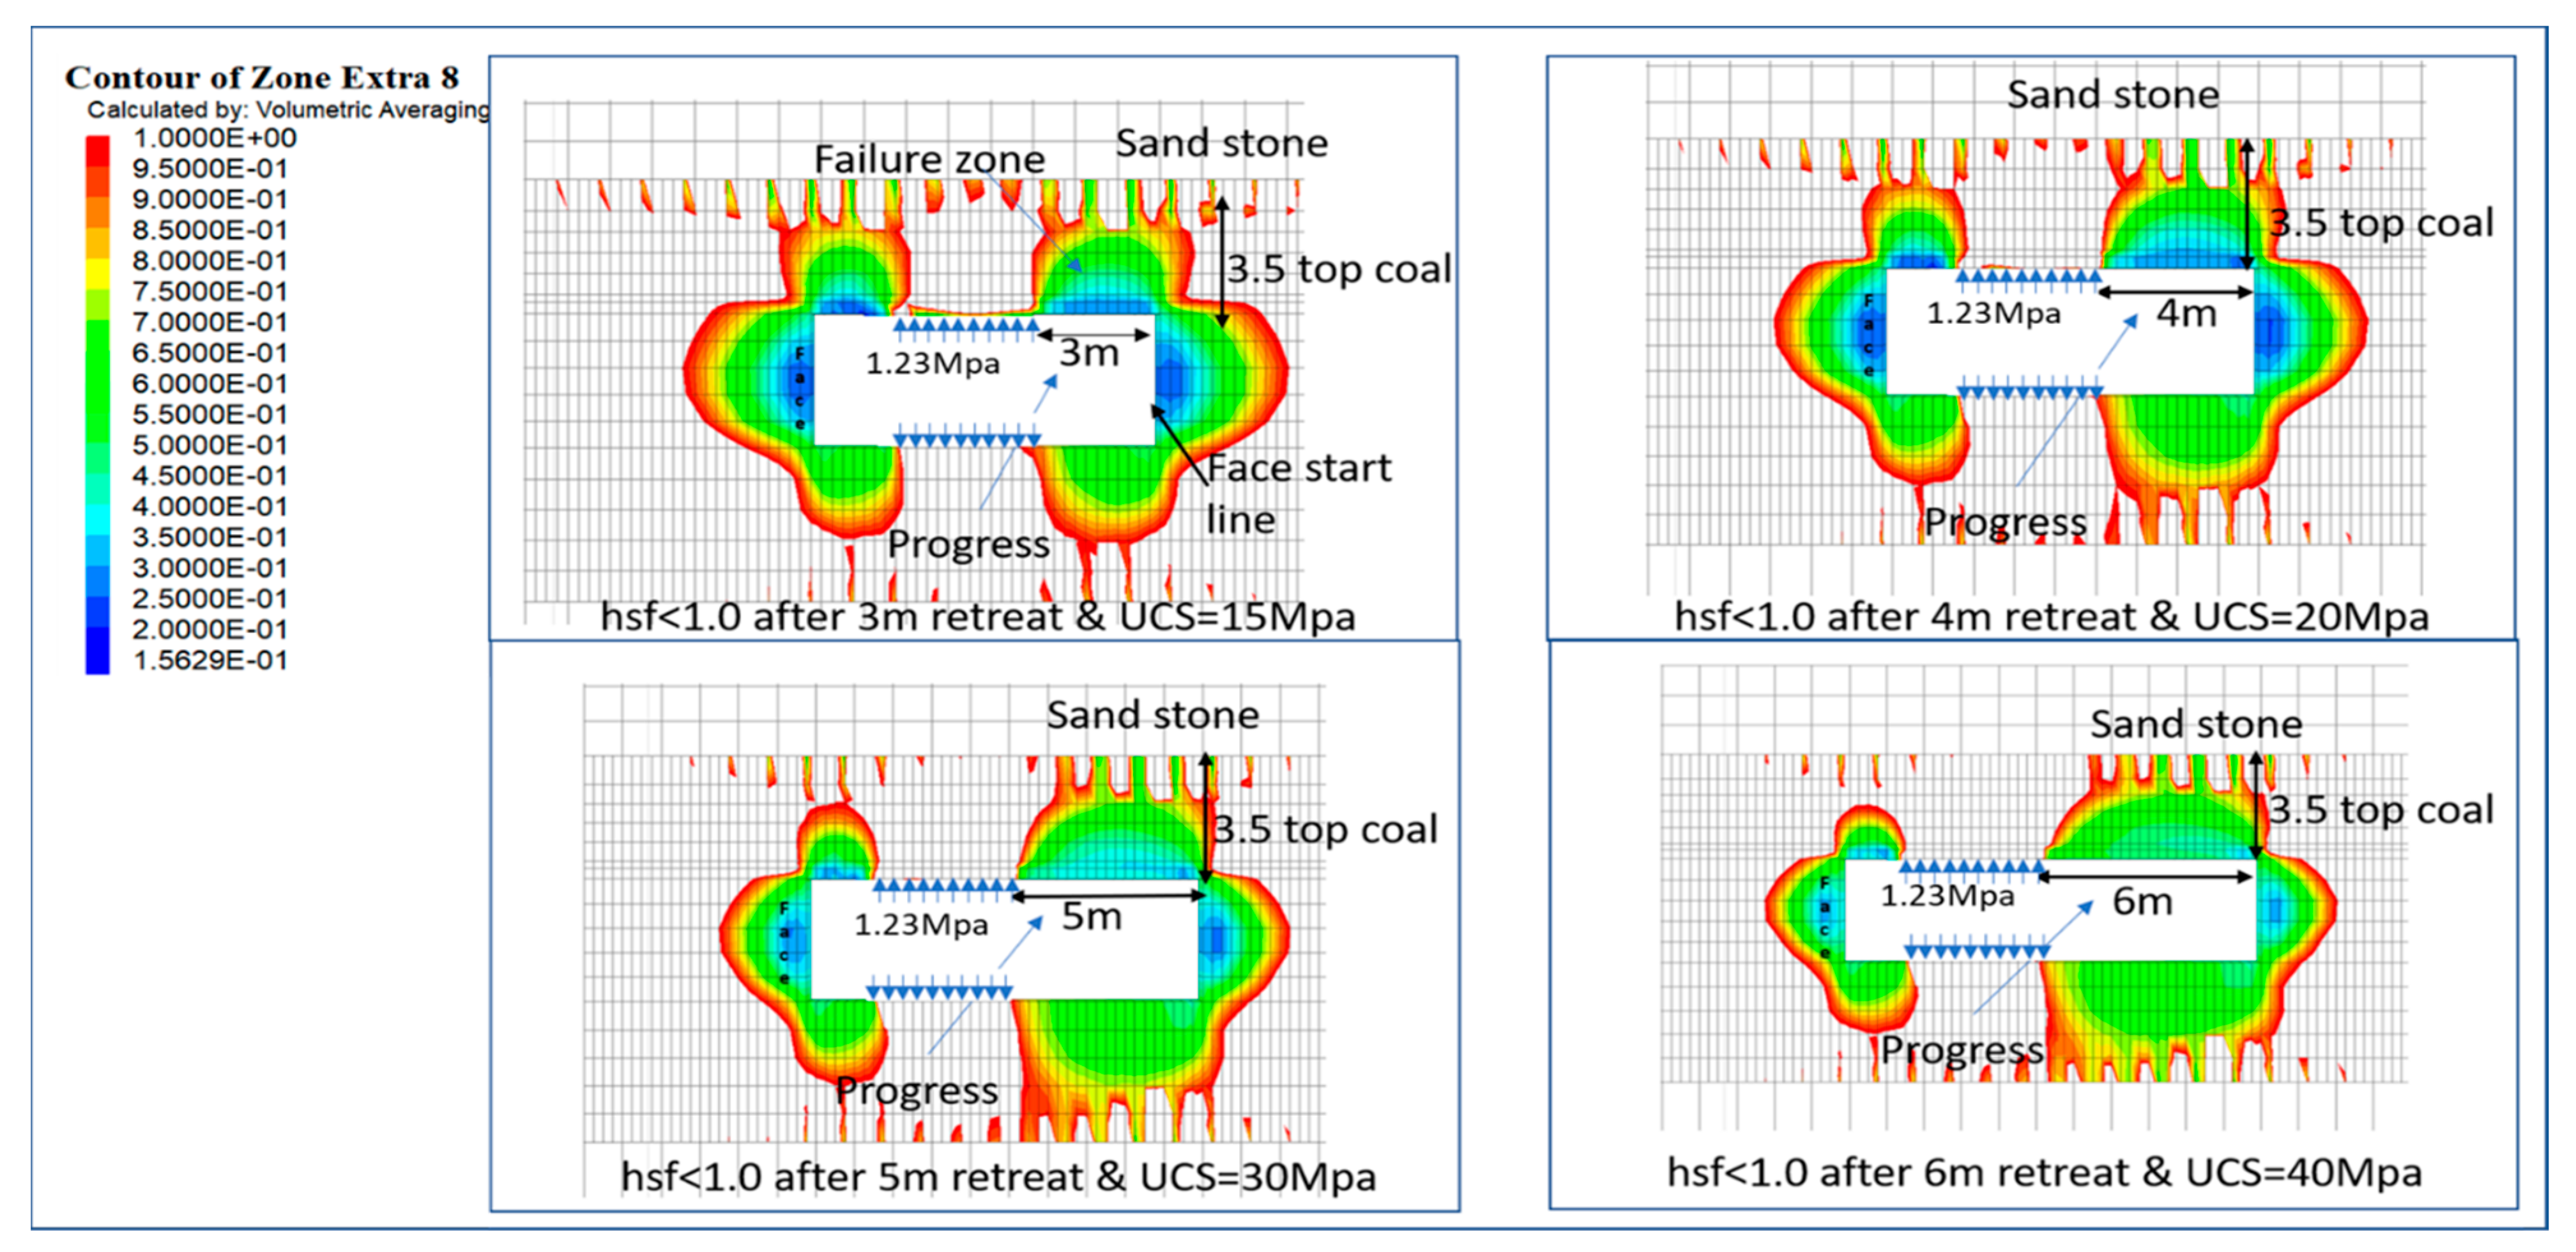
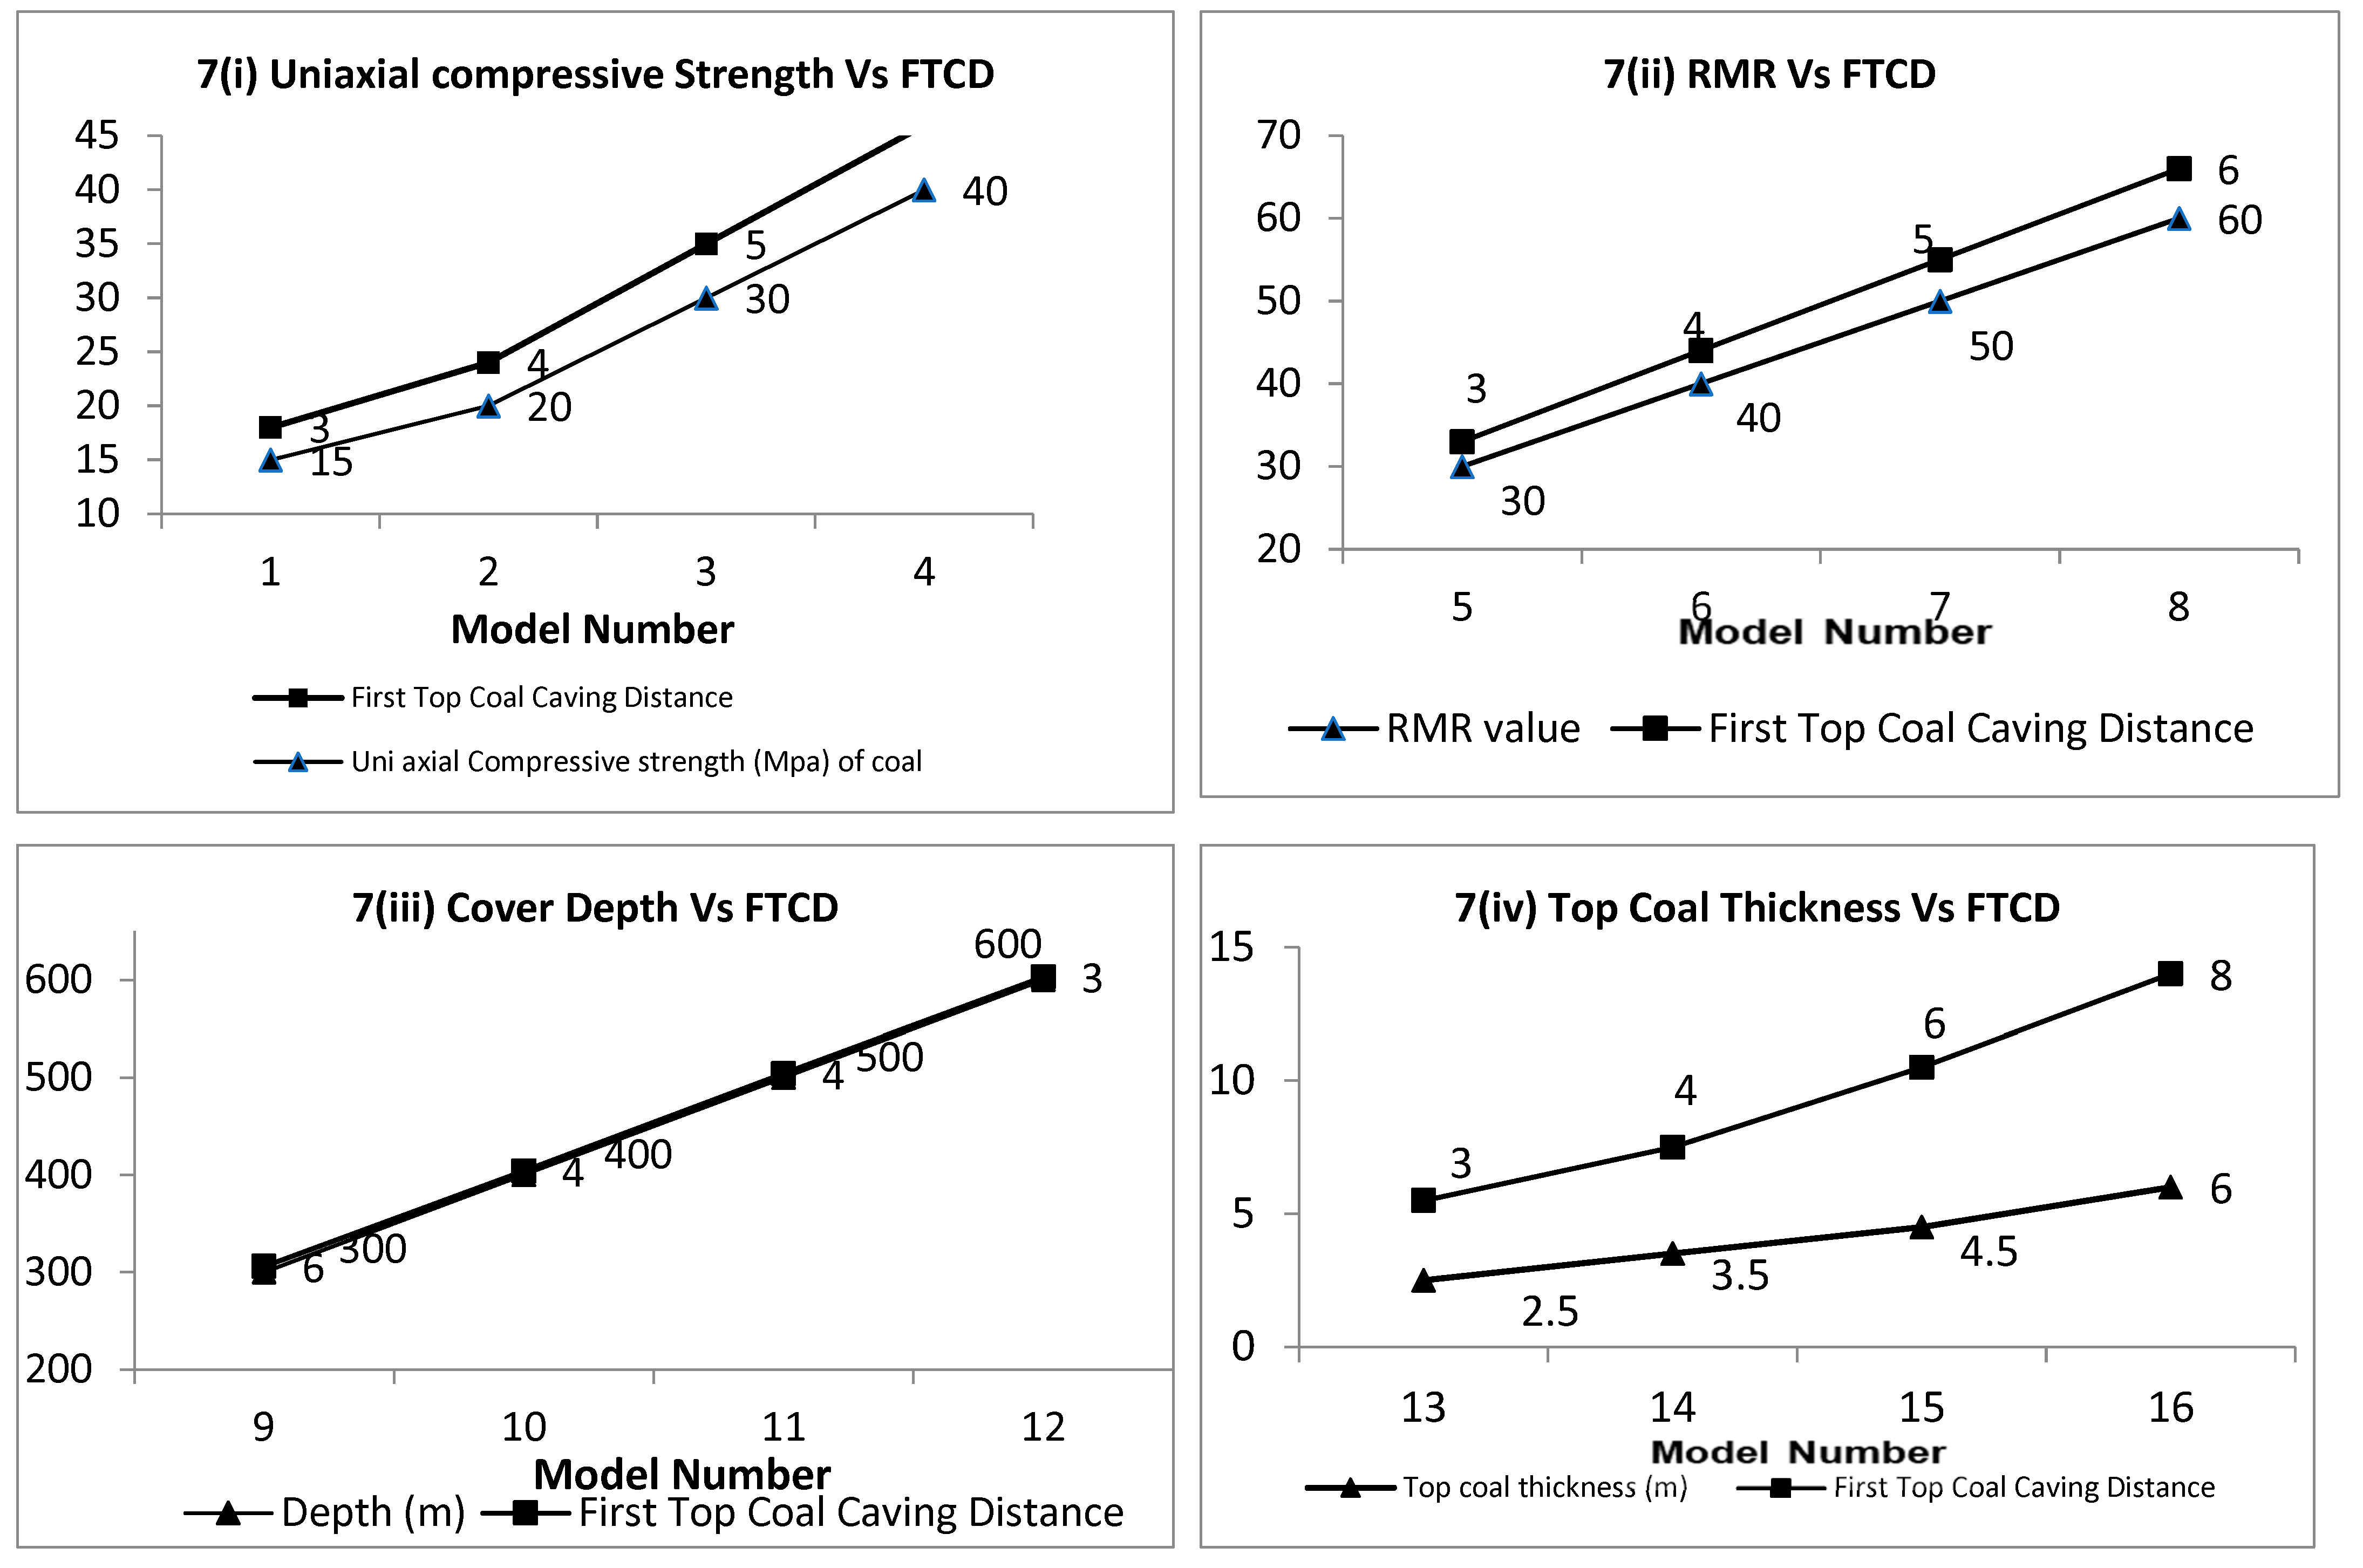
  • The strength of the top coal (UCS) has a direct relation with TFCD with a good correlation (R2 = 0.97), as shown in Figure 7(i). As the strength of coal increases, difficulty in caving increases.
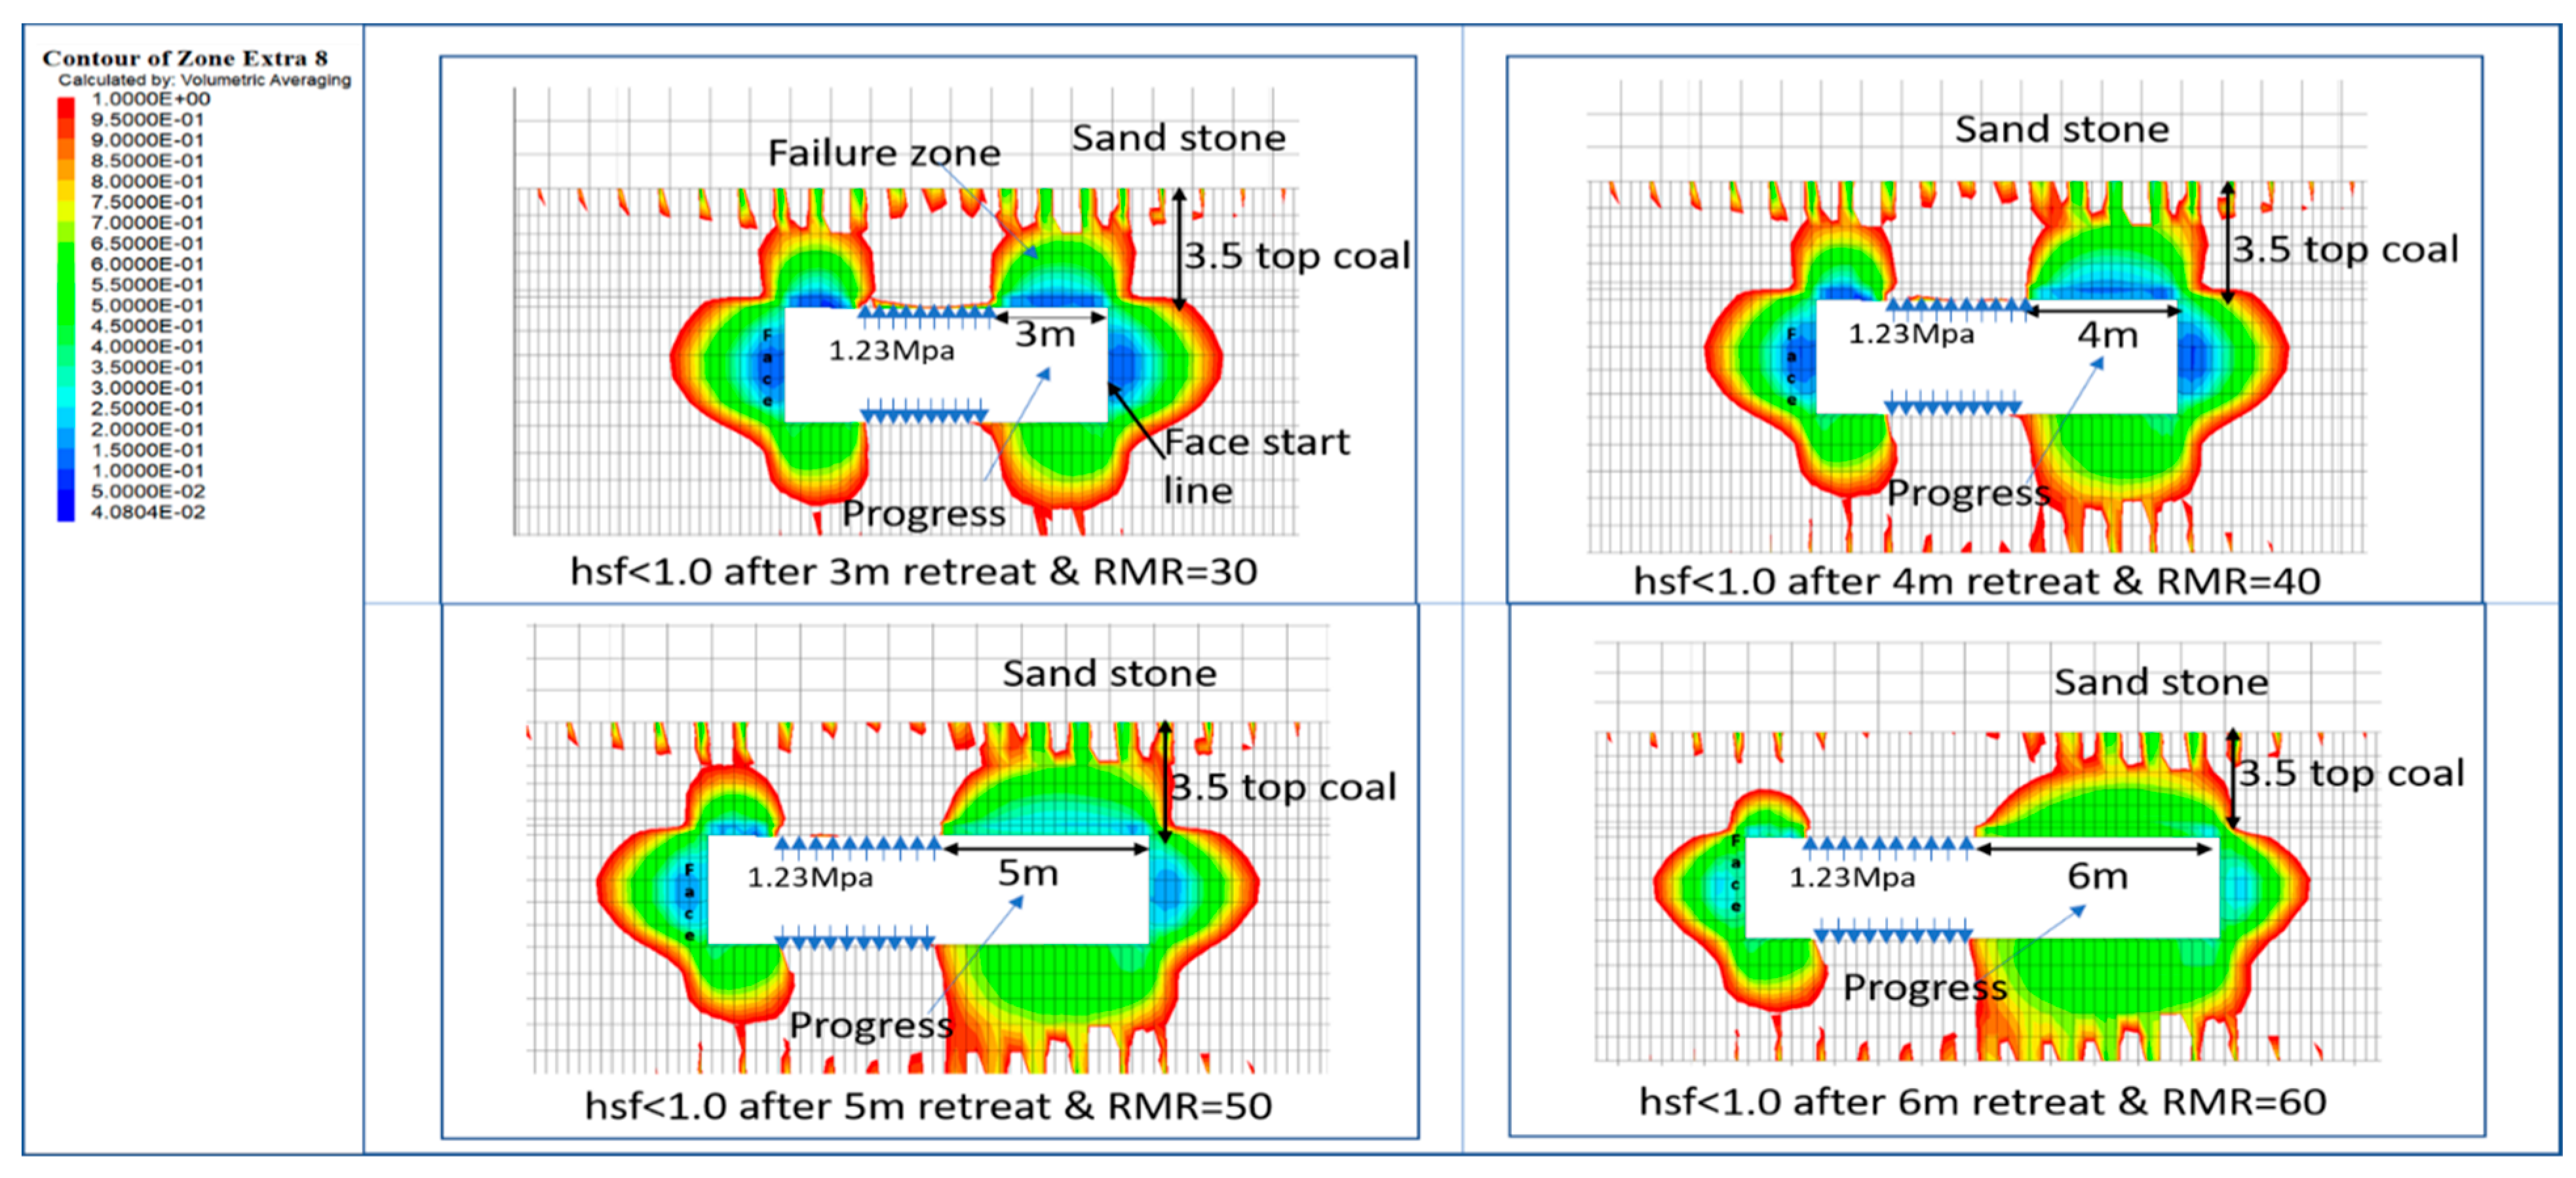
  • The CMRI-ISM RMR (a factor considered to represent the effect of discontinuities) is higher for the coal mass with a lower density of discontinuities. The TFCD has shown a direct relationship (R2 = 1.0) with the CMRI-ISM RMR, as shown in Figure 7(ii).
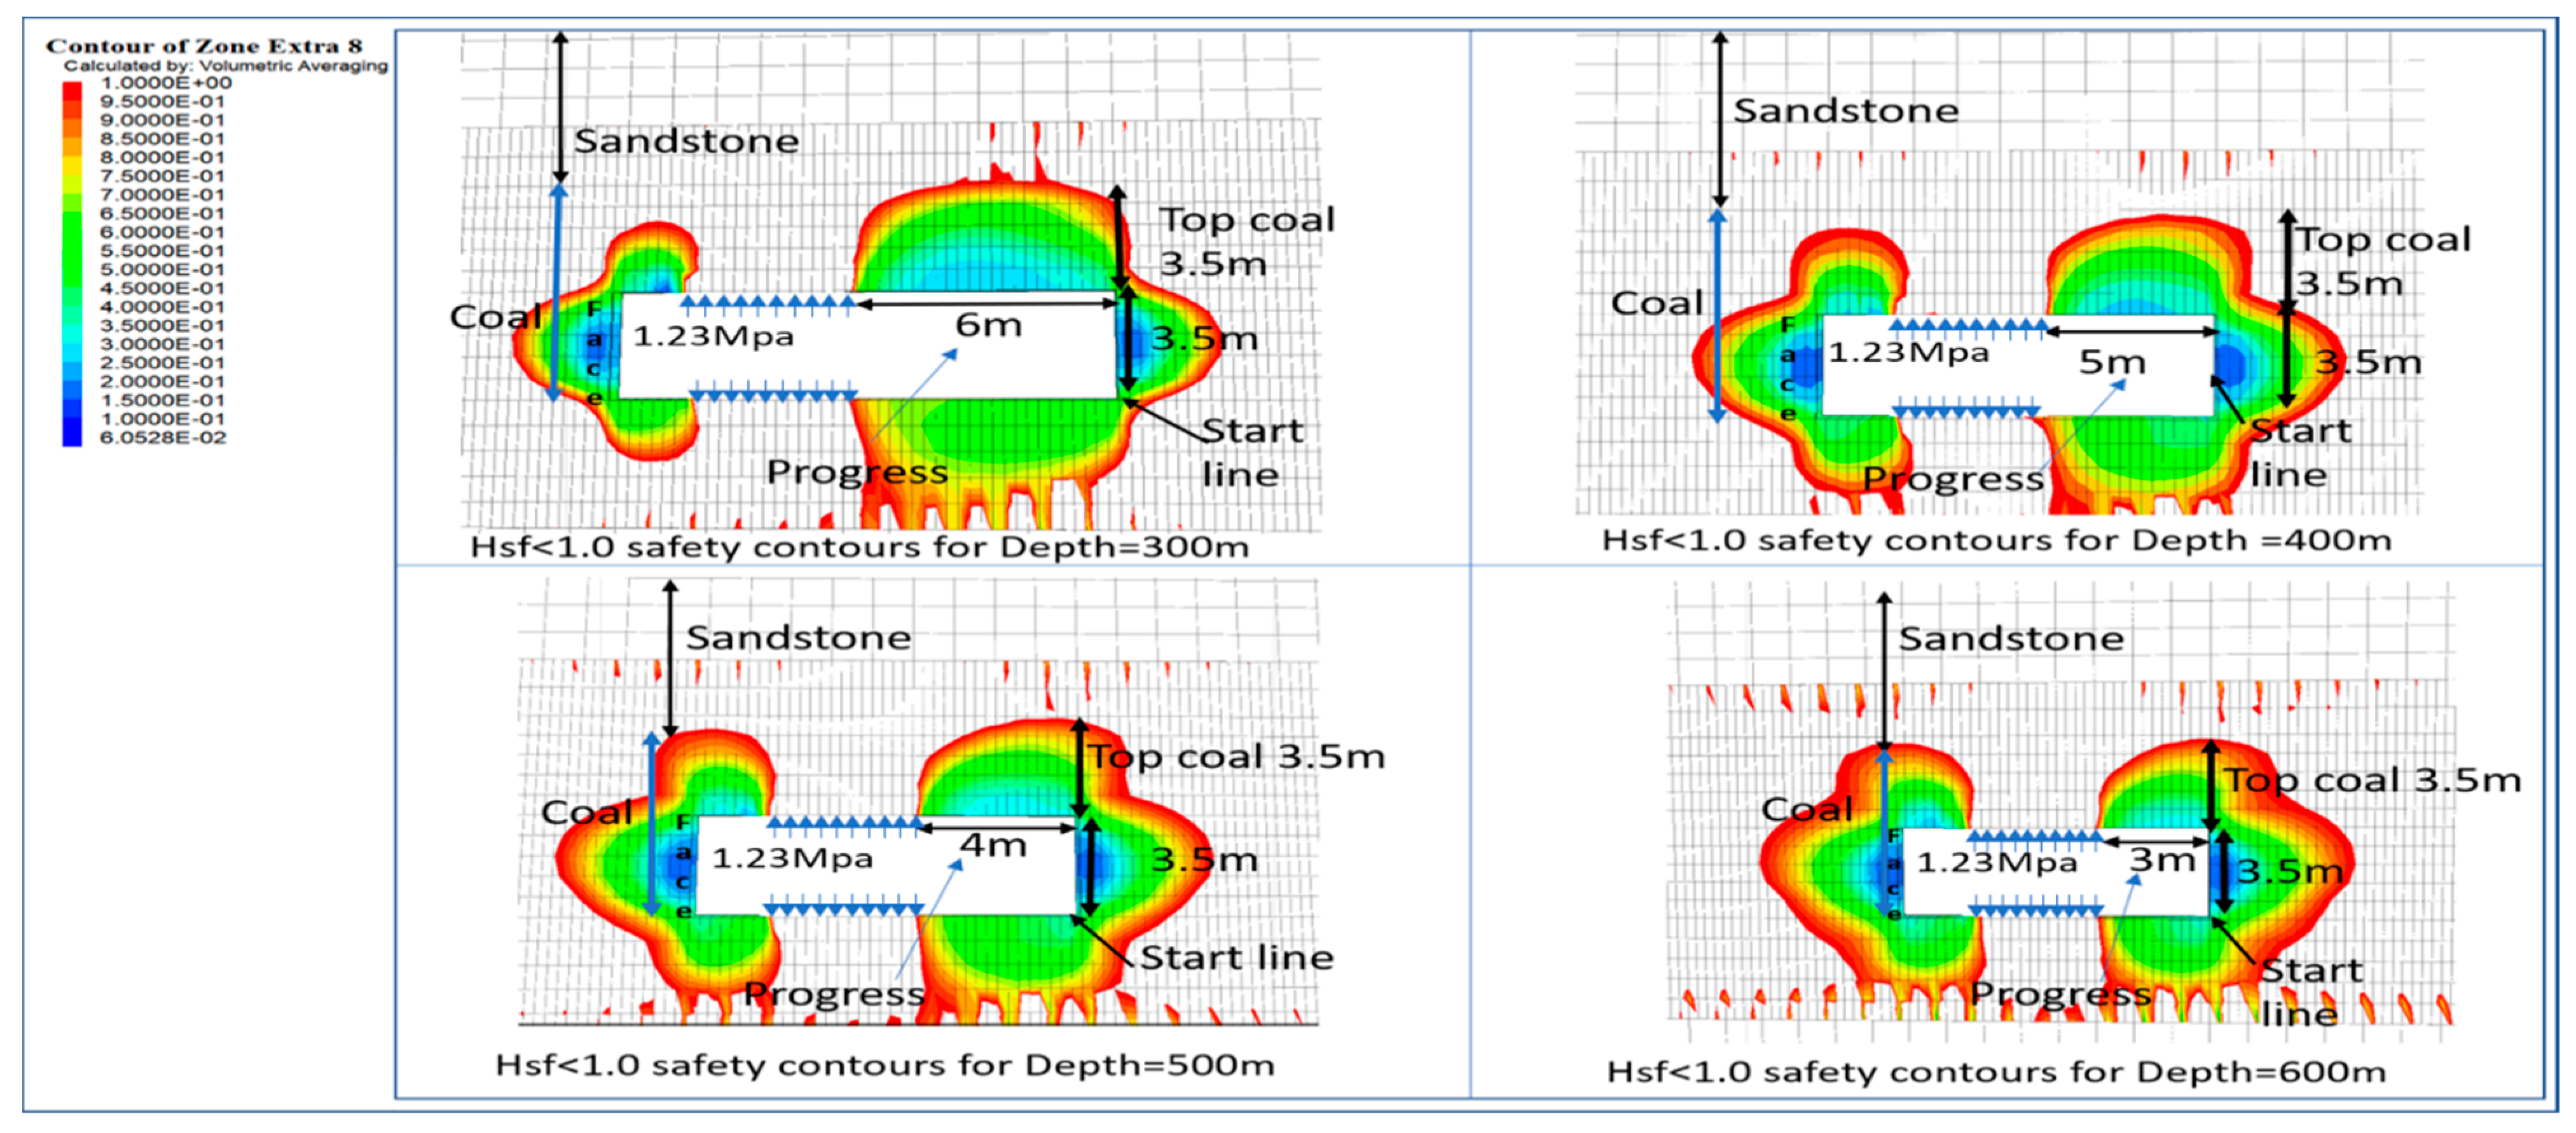
  • An increase in depth of working eases the top coal caveability. As the depth increased from 300 m to 600 m, the TFCD reduced from 6 m to 3 m, showing an inverse relationship with a good correlation of R2 = 0.852, as shown in Figure 7(iii).
  • The thickness of the top coal has a significant direct relation with the TFCD. As the top coal thickness increased from thickness varies directly (R2 = 0.988) from 2.6 m to 6 m, the TFCD also increased from 3 m to 8 m, as shown in Figure 7(iv). Thus, an increase in top coal thickness results in poorer caveability.
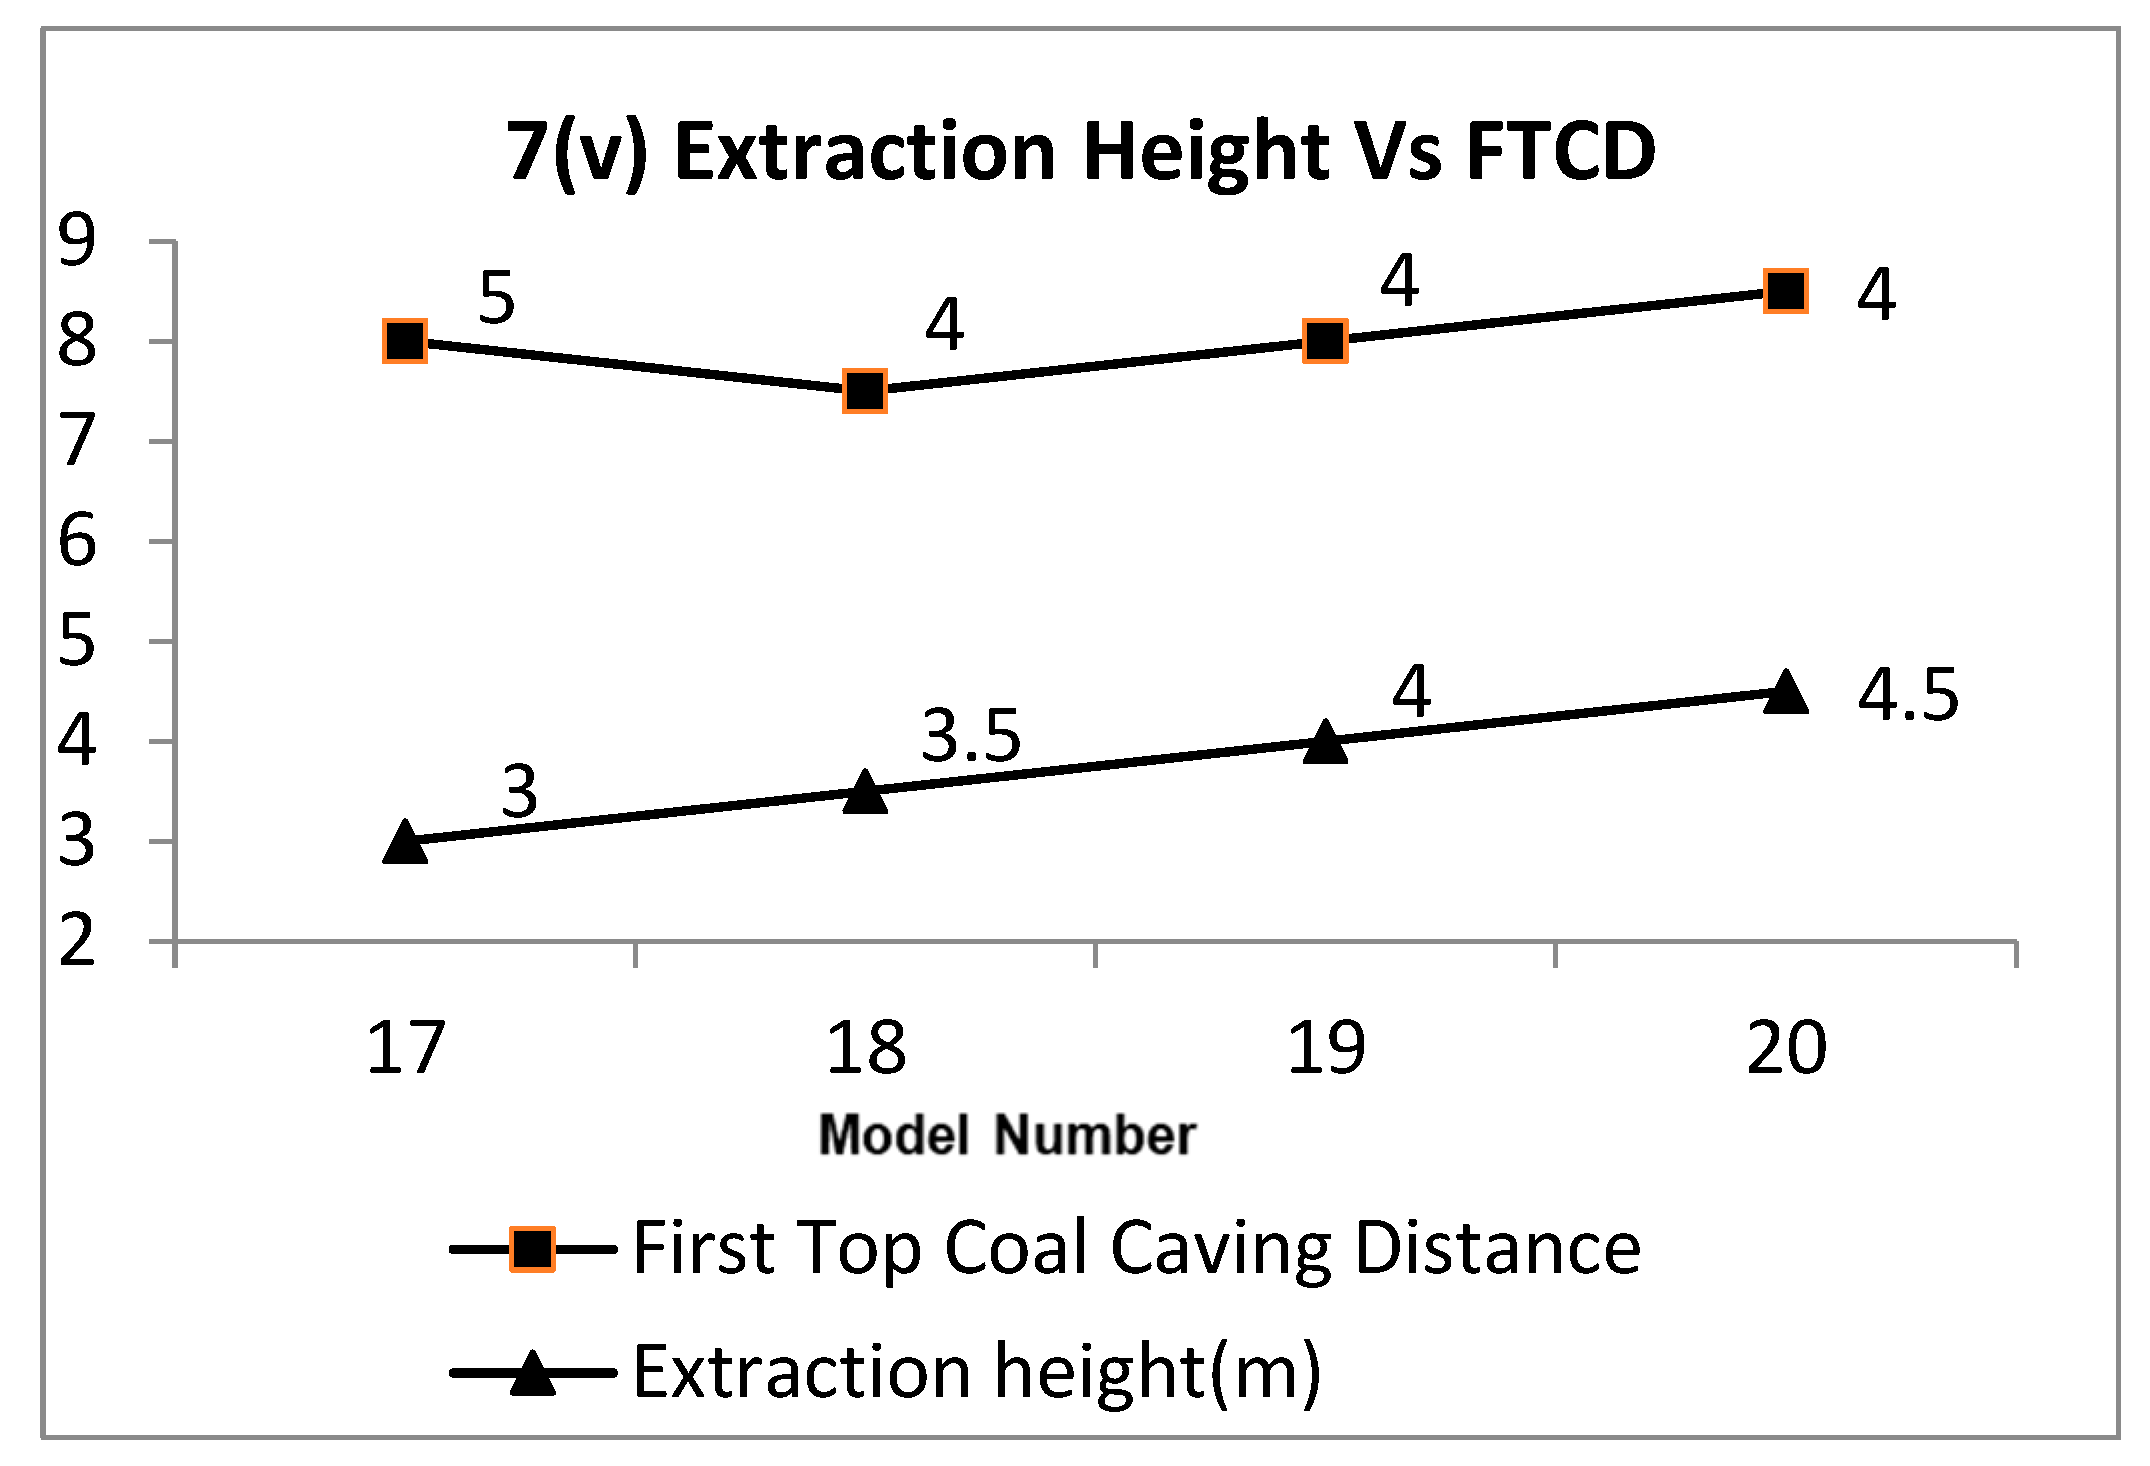
  • The effect of the cutting height on TFCD has shown that for an extraction height of 3 m, the TFCD is only 5 m, and when the cutting height is enhanced from 3.5 m, the TFCD increased to 4 m, and there is no improvement in TFCD despite the extraction height increasing from 4 m to 4.5 m, as shown in Figure 7(v). The correlation between the cutting height and TFCD is found to be only 0.6.

3.2. Regression Analysis of Numerical Modeling Results

Multiple linear regression analysis frames the parameters in one empirical equation. The association of each parameter with others can be bought out of this analysis, which can lead to accurate and precise understanding and trend forecasting. The regression statistics obtained by the analysis are presented in Table 4. The R-squared value of 0.91 shows the fitness of data in Equation (1) and that the data have a minor variance between the observed and fitted value. Satisfactory empirical correlations (R square > 0.91) were found between the five parameters and the obtained FTCD. The relationship between the variables was obtained as shown in the equation below.
The relationship between the geotechnical parameters considered for the assessment of the FTCD is:
FTCD = −1.726 − 0.5039 EH + 1.498 TC + 0.0915 RMR +0.09257 UCS − 0.007519 H
where
  • FTCD = First Top Coal Caving Distance (m);
  • EH = bottom coal extraction height (m);
  • TC = top coal thickness (m);
  • RMR = RMR of coal (0–100);
  • UCS = uniaxial compressive strength of coal (MPa);
  • H = depth of the coal seam from surface (m).

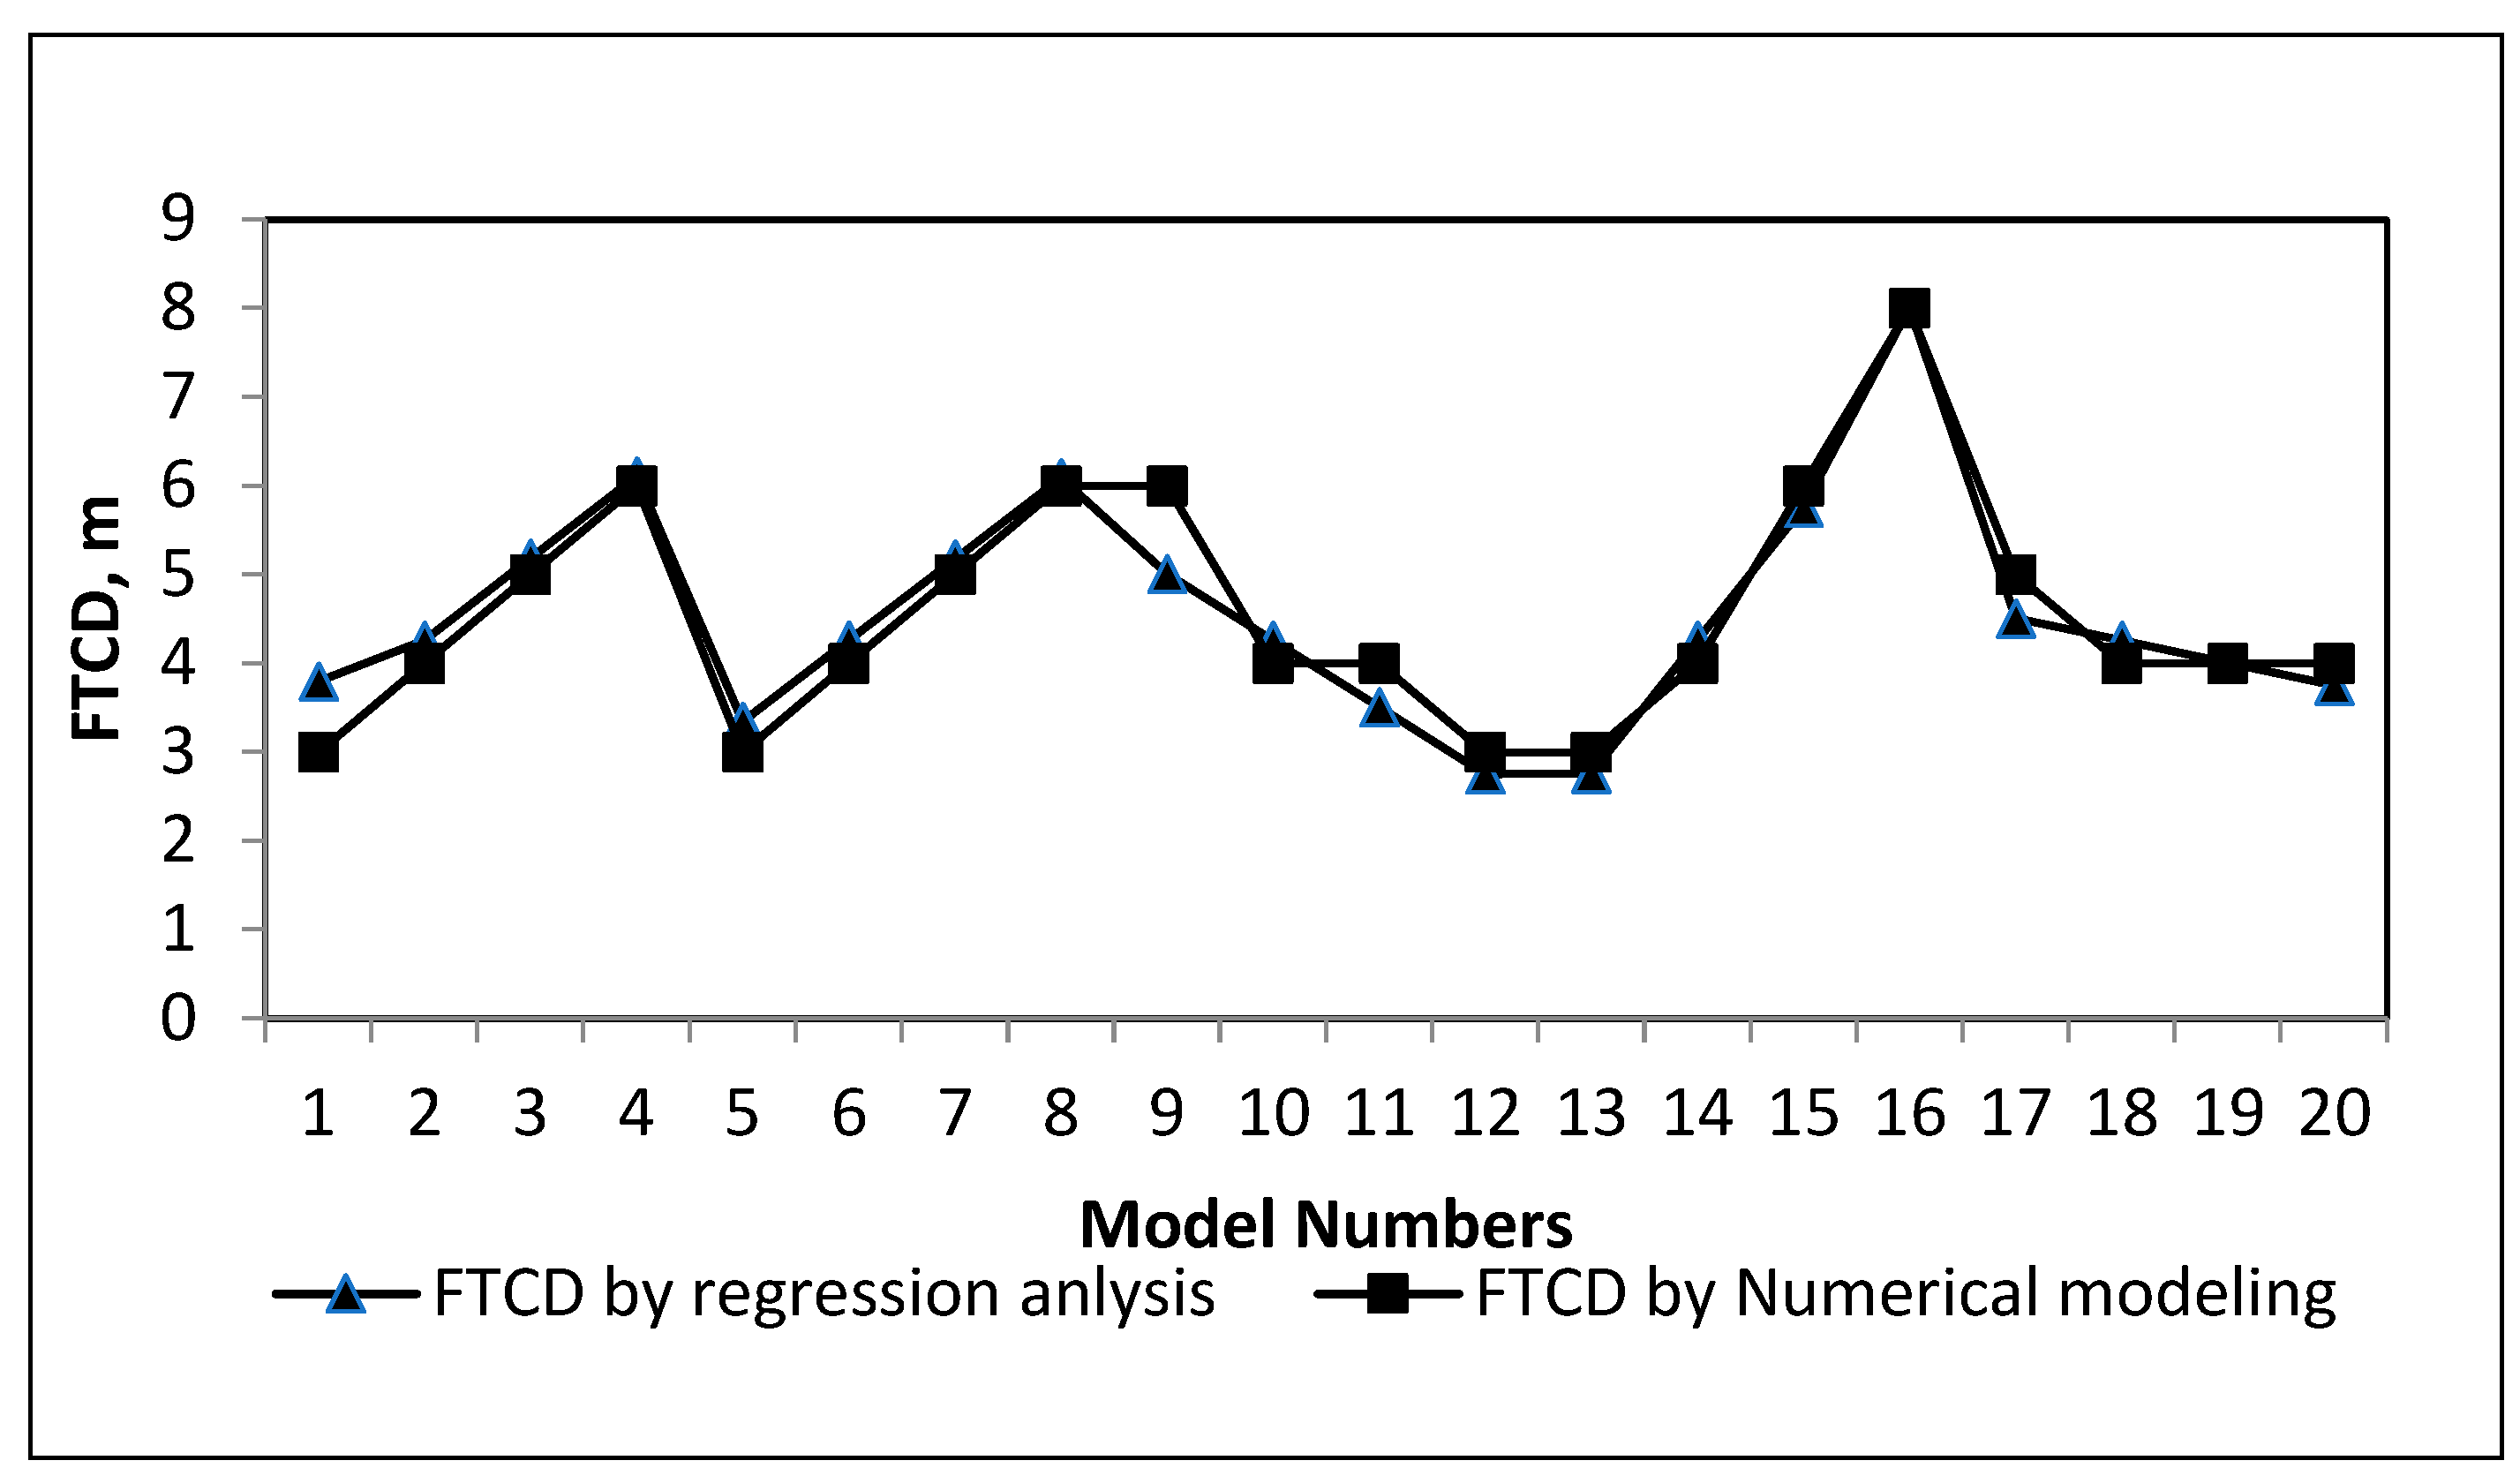
3.3. Correlation of Values by Analytical Simulation and Numerical Modeling

The values obtained by deputing in Equation-III are correlated with the values obtained from numerical modeling. A graph was plotted as shown in Figure 8, and the correlation shows 0.955. The correlation results show a strong positive relationship between the values, which increases the reliability of the FTCD index.

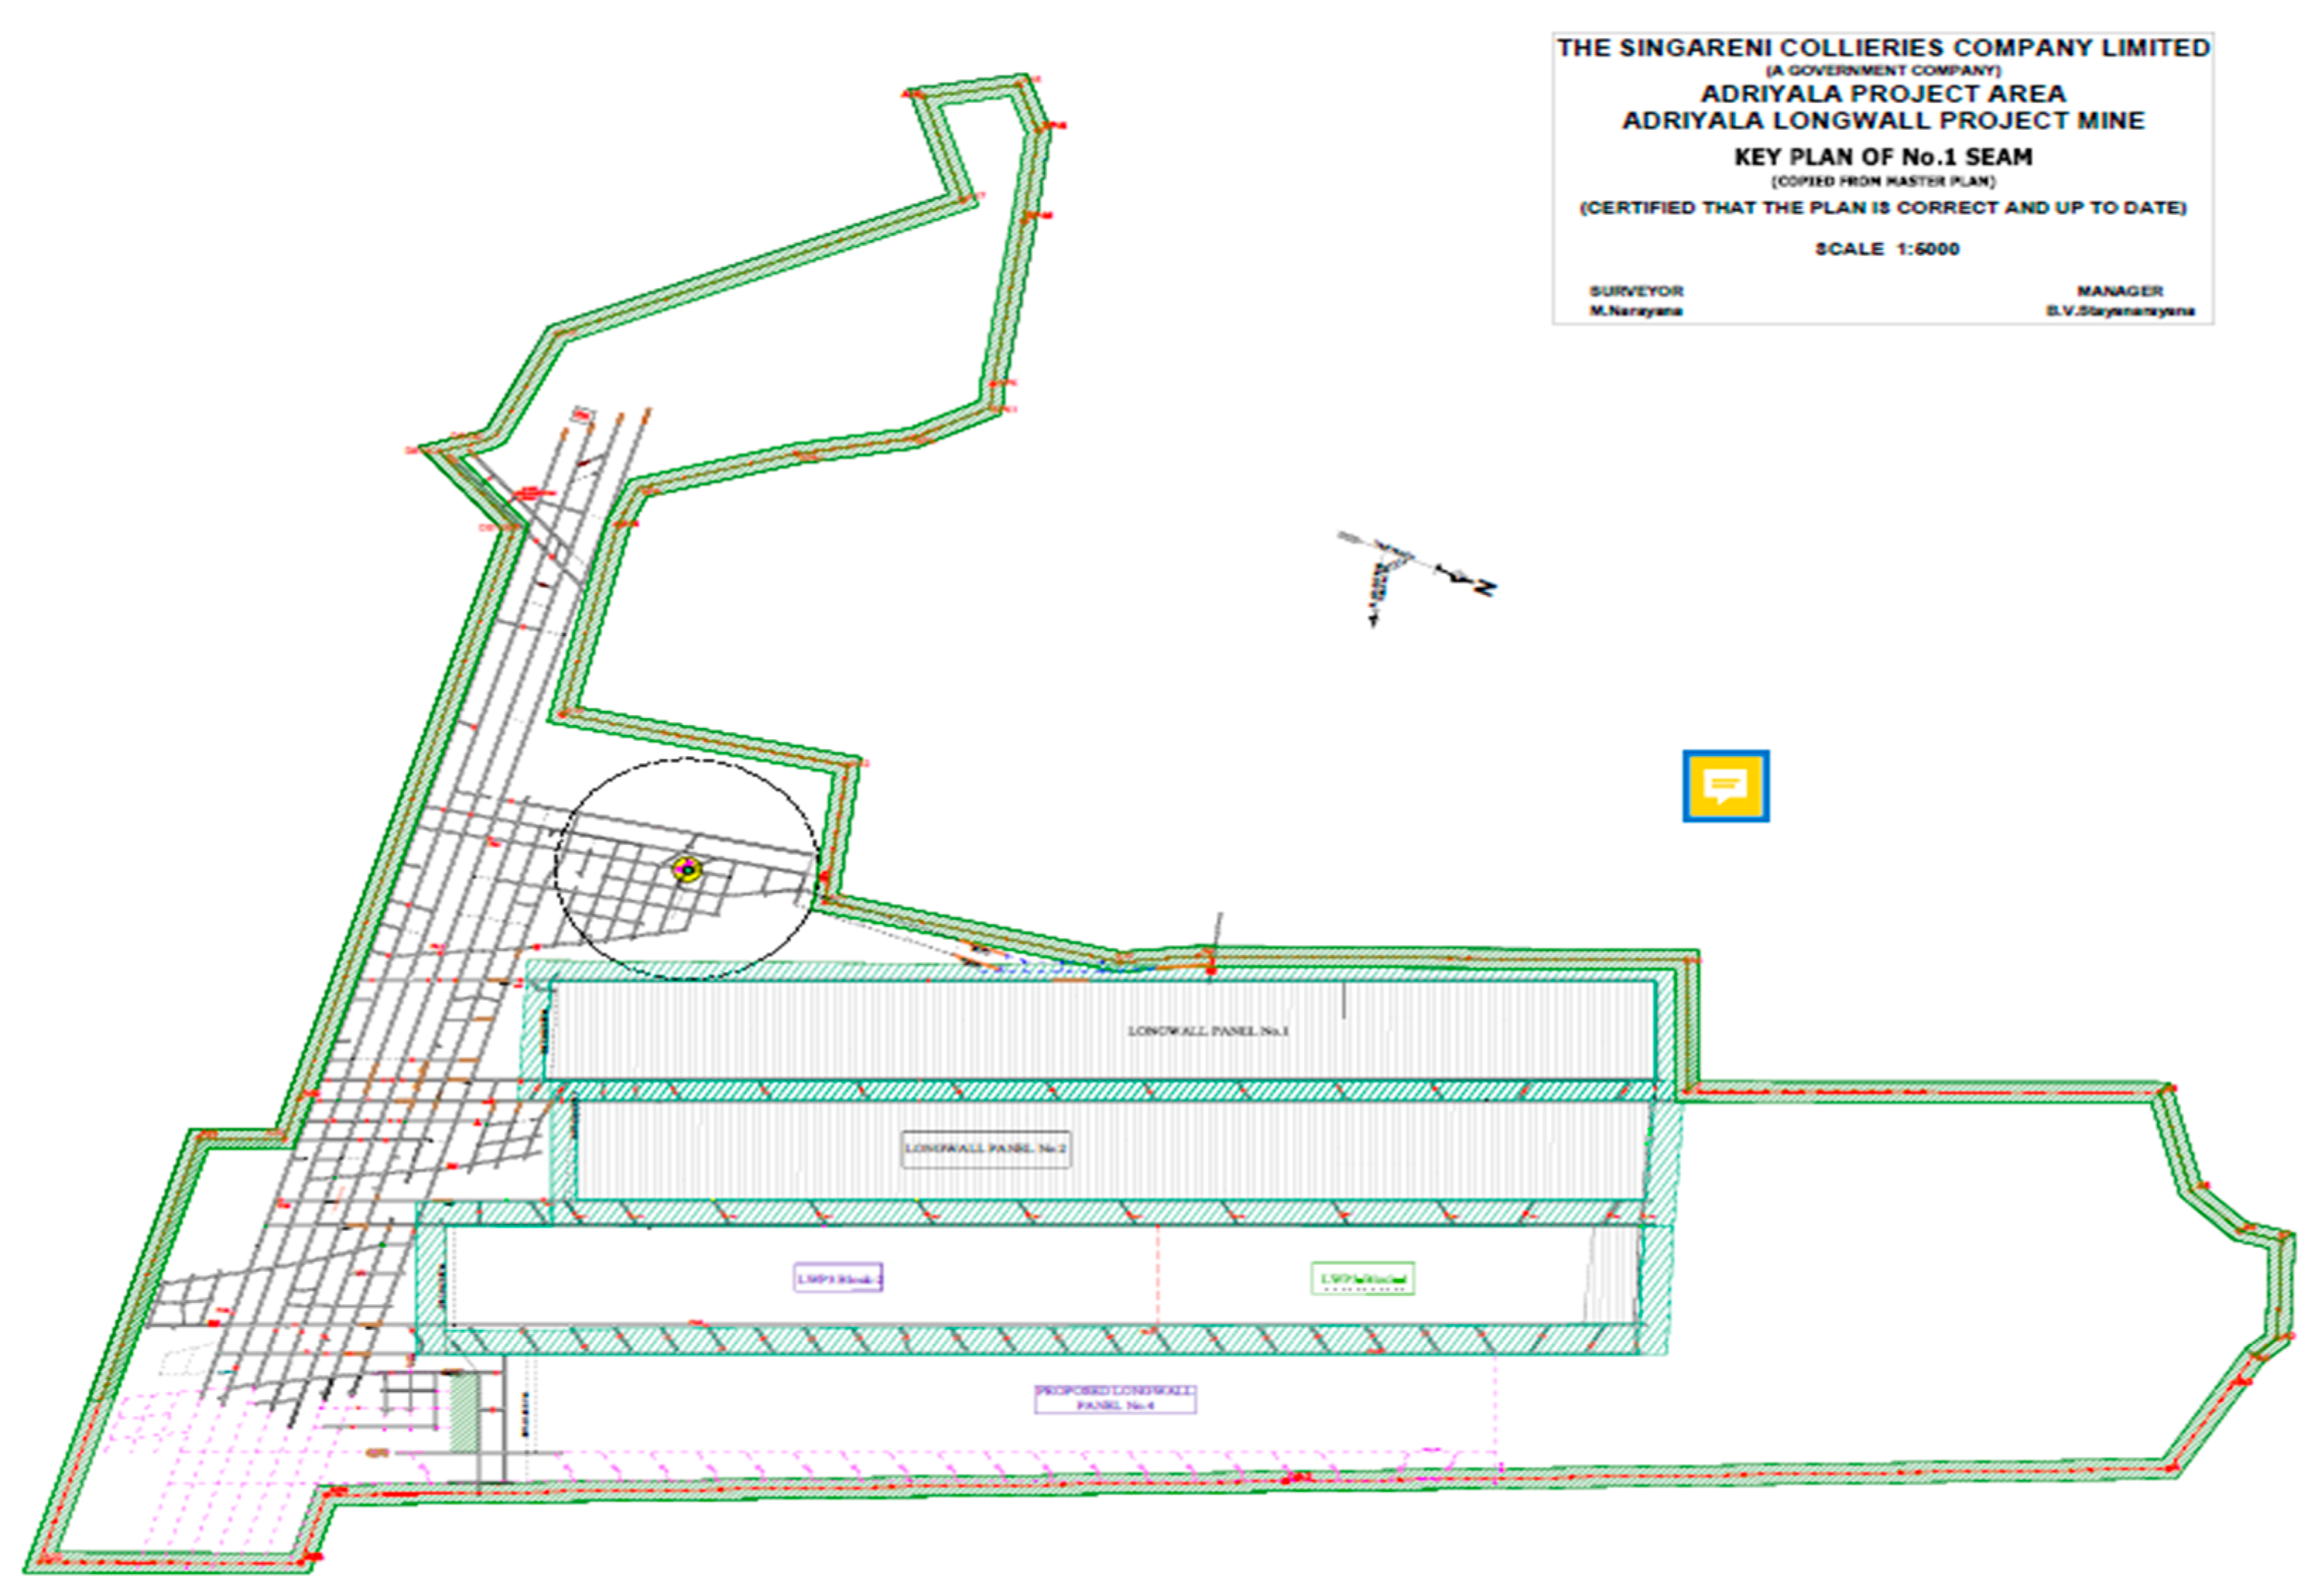
3.4. Validation from the ALP Mine

For validation of the numerical modeling and regression analysis, ALP is the only Indian longwall mine resembling the LTCC scenario, geo-technically, i.e., which has a 3.5 m section along the bottom (7 m thick seam), losing the remaining 3.5 m of top coal in the goaf. The only difference, in this case, is the lack of a rear AFC.

3.5. Geo-Mining Conditions of the Site

The ALP mine is situated in the southeastern and southern parts of the Ramagundam coal belt of GVCF with four workable coal seams. Among the four workable coal seams (namely, No. 1, 2, 3, and 4 in descending order), the No. 1 seam (panels as shown in Figure 9) is being extracted by a single-pass longwall. All other underlying seams are virgin in this mine. The No. 1 seam is about a 7 m thick non-gassy seam, dipping at 1 in 5 to 1 in 7.8 (i.e., 6–12 degrees). The degree of the gassiness of the seam is Degree I (no methane emissions were traced). Though it is not an LTCC method, all the geotechnical parameters are suitable for adapting to the LTCC method, i.e., the extraction of the bottom section of 3.5 m by SPL. Due to the deployment of conventional longwall face equipment, the caved top coal is lost in the goaf as an immediate roof due to its poor quality, as stated by mine management. The mine is planned to work at a depth range of 294–644 m. It has 78.597 MT of extractable reserves. The envisaged life of the project is 35 years at a rated production of 2.8 million Tons per Annum. The annual production from the longwall panel is 1.75 million tons from shearer cutting (1.25 million tons from top coal with about 70% recovery). The average production from the longwall panel is 10,000–12,000 tonnes per day from shearer cutting, and if LTCC is implemented, an additional 7000 tons per day is expected. The face length is 250 m, the panel length is 2200, and the panel reserves are 3.36 million tons from front shearer cutting, which can be enhanced to 6 MT by adopting LTCC. The geotechnical parameters of the No. 1 seam and its overlying roof strata are presented in Table 5.
The geo-mining conditions of ALP mine are presented in Table 6.
Substituting the values in Equation (3)
FTCD (m) = −1.726 − 0.5039 EH + 1.498 TC + 0.0915 RMR + 0.09257 UCS − 0.007519 H = 6.15 m
The mine experience shows that the entire 3.5 m top coal first caving of top coal full-thickness occurs at an advance of 6.0 m from the initial face position. The difference is only 0.1578, i.e., 2.68% variance from the prediction.
The geotechnical data from various mines were collected as presented in Table 7. The extraction height was considered to be 3.5 m for standard and stable supports. The FTCD values varied from 4.7 to 12.5 m. From the field application of ALP, up to 7 m FTCD can be considered feasible.
Based on FTCD values, the R-VI seam of Jhanjra mine, III seam of GDK 11 Incline, I seam of ALP, III seam of IK-1A, and SJ seam of MVK-II Incline are favorable for LTCC. For some other seams, such as the III seam of ALP and III seam of GDK 8 Incline, a further study is to be carried out to assess the sustainability of LTCC.

4. Economic Evaluation of LTCC—A Case Study

Equipment Selection for LTCC Adoption in the No. 1 Seam of the GVCF

Considering the geo-mining and technical parameters discussed in Table 5 and Table 6, the machinery and equipment are considered suitable for the application of LTCC for the study area. The powered support requirement for LTCC will remain the same as the stress field, and strata abutments are unchanged. This LTCC budgetary estimation is about 40,310,000 USD (295, 50, 57,573 INR). For SPL, the machinery deployed at a highly mechanized longwall mine in GVCF is considered. Table 8 presents the equipment list considered for the LTCC and SPL evaluation of IRR.
For estimating the viability of any mining project, an economic assessment will be completed. The comparison of projects an economic perspective can be assessed accurately by Internal Rate of Return (IRR) in Capital Budgeting, which is based on discounted flow return. During the comparison, the project with a higher IRR is desired [35]. IRR is an investment decision tool to assess the better economic project among the mutually exclusive and sustainable projects.
In this study, under standard geo-mining conditions, the IRR is evaluated for the single-pass longwall mining method with highly mechanized modern systems for extraction of 3.5 m thickness and standard LTCC equipment with a cutting height of 3.5 m and 3.5 m top coal in a 7 m thick coal seam. The full performance level is considered as 3.750 MTPA for the project. For both Longwall and LTCC methods, the land, prospecting, drilling, cost of building, technical services, furniture and fittings, vehicles, environment-related costs, etc., are inevitable for establishing the project. The development of gate roads in both the LTCC and longwall panel requires road headers/bolter miners for a faster rate of advance. The costs incurred by the company for the purchase of the longwall set from a German company and LTCC set (deployed in GVCF) are presented in Table 9.
Table 9 presents the estimated financial viability of the project in terms of estimated profit/loss per ton and internal rate of return between longwall and LTCC methods. The recovery of top coal is taken as 75% of 3.5 m top coal, which is considered as 100% performance of LTCC. The performance levels of both longwall and LTCC methods are compared using 85% performance levels to include unpredicted constraints such as production delays, geological abnormalities, strata conditions, spares, etc. In India, non-coking coals are classified into 17 grades [36] based on their Gross Calorific Value (GCV), measured in KCal/Kg. The highest grade is G-1 (Above 7000 Kcal/Kg), and the lowest is G-17 (2201–2500 Kcal/Kg). The declared grade of coal is G-9, with a Gross Calorific Value of 4725 Kcal/Kg. However, the grade is likely to fall either with the dilution of overlying sandstone strata or an increase in clay/dirt bands in the coal seam itself. Hence, the effect of fall of produced grade is considered at G-9 (4601–4900 Kcal/Kg), G-10(4301–4600 Kcal/Kg), and also G-11(4001–4300 Kcal/Kg) for the sensitivity analysis. The sale price of coal varies directly with the GCV of the coal. The sensitivity of project IRR to the possible increase of cost elements is presented in Table 10.
The production with the LTCC method can be improved by 33% when compared to the single-pass longwall method. With 100% performance, the production is 3.750 MTPA for LTCC and 2.817 MTPA for the single-pass longwall method.
The desired IRR is 12% for approval. The project IRR is estimated to be 30.24% at an 85% performance level even with a fall of up to two grades in coal quality and a 20% increase in total cost. Under such circumstances, the IRR of the SPL method is only 18%. Hence, the project with LTCC is financially viable.

5. Discussion and Conclusions

The top coal caving feasibility for Indian geo-mining conditions is evaluated based on the FTCD index. A parametric study is conducted for evaluating the critical factors affecting FTCD and thereby top coal caveability. The study revealed the following:
The discontinuities of top coal mass (value of the CMRI-ISM RMR) has a major direct relationship (R2 = 1) on the FTCD followed by strength of coal (UCS) (R2 = 0.978) and the top coal thickness (R2 = 0.988). When the CMRI-ISM RMR, the coal (UCS) strength, and the top coal thickness are higher, the top coal caveability is poorer. However, as the working depth (R2 = 0.85) and cutting height (R2 = 0.6) increase, the FTCD decreases, and top coal caving improves.
The simulated FTCD values are used to develop an empirical equation, FTCD (m) = −1.726 − 0.5039 EH + 1.498 TC + 0.0915 CMRI-ISM RMR + 0.09257 UCS − 0.007519 H by statistical analysis. The FTCD index helps in the preliminary assessment of LTCC feasibility. The parameters of the FTCD index calculation involve the most commonly available data of the Indian coal mines and do not require any complex geotechnical investigations.
Since there is no mine operating LTCC in India, the study results were validated with the operational parameters of the ALP mine in the GVCF, as it has a longwall panel with similar geo-mining conditions to LTCC. The FTCD index was predicted to be 6.15 m against the actual measured value of 6.0 m, which is estimated to be feasible for LTCC.
The financial assessment was conducted, considering 70% top coal recovery at 85% performance level, the cost of production escalated by 20%, and a fall in coal quality by two grades. The internal rate of return (IRR) for LTCC is 30.20% as per the sensitivity analysis. This study contributes to evaluating both the technical and economic feasibility of introducing LTCC in Indian geo-mining conditions.
The results obtained must be considered as a starting point to assess Indian conditions. However, more research/studies should be completed in the future by assessing the impact of face orientation with major horizontal stress, the direction of face retreat, and caving or drawing of powered roof supports of different Indian coalfields.

Author Contributions

N.B. and G.B. conceptualized the presented idea. N.B. developed the methodology and performed the computations. G.B. supervised, reviewed, and edited the manuscript. Writing—original draft preparations and development of the theoretical formalism, performing the numerical simulations, and the analytic calculations were completed by N.B. Both the authors have contributed the final version of the manuscript and have read and agreed to the published version of the manuscript.

Funding

This research received no external funding.

Institutional Review Board Statement

Not applicable.

Informed Consent Statement

Not applicable.

Data Availability Statement

The data utilized and the supporting data for the analysis and findings of the study are available from the corresponding author and will be provided on request.

Acknowledgments

The authors would like to express their genuine appreciation and gratitude to The Indian Institute of Technology (Indian School of Mines), Dhanbad, the Directorate General of Mines Safety, the Government of India, Managements of The Singareni Collieries Company Limited, and Eastern Coalfields Limited for their support and assistance in presenting this article. The views expressed in the article solely belong to the authors and do not represent the institutes they belong to in any form.

Conflicts of Interest

No conflict of interest is declared by the authors.

References

  1. Balasubramanyam, N.; Budi, G. A Study into the Feasibility of application of Longwall Top Coal Caving (LTCC) method in Indian Geo-Mining Conditions. In Proceedings of the International Conference on Deep Excavation, Energy Resources and Production (DEEP-)16, Kharagpur, India, 24–26 January 2017. [Google Scholar]
  2. Singh, T.N.; Kushwaha, A.; Singh, R.; Singh, R. Strata behavior during slicing of thick seam at East Katras Colliery. In Proceedings of International Symposium on Thick Seam Mining; Singh, T.N., Dhar, B.B., Eds.; Central Mining Research Station: Dhanbad, India, 1992; pp. 237–250. [Google Scholar]
  3. Hebblewhite, B.K.; Cai, Y.J. Evaluation of the application of the Longwall Top Coal Caving (LTCC) method in Australia. In Proceedings of the 13th International Conference on Coal Research, Shanghai, China, 26–29 October 2004; China National Coal Association: Beijing, China, 2004; pp. 368–374. [Google Scholar]
  4. Khanal, M.; Adhikary, D.; Balusu, R. Evaluation of Mine Scale Longwall Top Coal Caving Parameters using Continuum Analysis. Min. Sci. Technol. China 2011, 21, 787–796. [Google Scholar] [CrossRef]
  5. Le, T.D.; Mitra, R.; Oh, J.; Hebblewhite, B. A review of cavability evaluation in Longwall top coal caving. Int. J. Min. Sci. Technol. 2017, 27, 907–915. [Google Scholar] [CrossRef]
  6. Yasitli, N.E.; Unver, B. 3D numerical modeling of longwall mining with top-coal caving. Int. J. Rock Mech. Min. Sci. 2005, 42, 219–235. [Google Scholar] [CrossRef]
  7. Xie, H.; Chen, Z.; Wang, J. Three-dimensional numerical analysis of deformation and failure during top coal caving. Int. J. Rock Mech. Min. Sci. 1999, 36, 651–658. [Google Scholar] [CrossRef]
  8. Humphries, P.; Poulsen, B.; Ren, T. Longwall Top Coal Caving Application Assessment in Australia; Commonwealth Scientific and Industrial Research Organisation: Brisbane, Australia, 2006. [Google Scholar]
  9. Yao-She, X.; Yang-Sheng, Z. Technique of top coal caving with vibration. In Proceedings of the 6th International Conference on Mining Science & Technology, Seoul, Korea, 24–26 November 2009; Volume 1, pp. 219–226. [Google Scholar]
  10. Xu, B. Application of the Longwall Top Coal Caving System in Australian Thick Seam Coal Mines. Ph.D. Thesis, The University of New South Wales, Sydney, Australia, 2004. [Google Scholar]
  11. Vakili, A. Cavability Assessment in Longwall Top Coal Caving Technology. Ph.D. Thesis, The University of New South Wales, Sydney, Australia, 2009. [Google Scholar]
  12. Dao, H.Q. The Effect of Seam Dip on the Application of the Longwall Top. Coal Caving Method for Inclined Thick Seams; The University of New South Wales: Sydney, Australia, 2010. [Google Scholar]
  13. Vakili, A.; Hebblewhite, B.K. A new cavability assessment criterion for Longwall Top Coal Caving. Int. J. Rock Mech. Min. Sci. 2010, 47, 1317–1329. [Google Scholar] [CrossRef]
  14. Das, S.K. Observations and classification of roof strata behaviour over longwall coal mining panels in India. Int. J. Rock Mech. Min. Sci. 2000, 37, 585–597. [Google Scholar] [CrossRef]
  15. Venkateswarlu, V.; Ghose, A.K.; Raju, N.M. Rock-mass classification for design of roof supports—a statistical evaluation of parameters. Min. Sci. Technol. 1989, 8, 97–107. [Google Scholar] [CrossRef]
  16. Kumar, B.M.; Maiti, J.; Mandal, P.K. Numerical Modelling Based study in Bord and Pillar working—A prerequisite for support design in mines. Minetech 2007, 28, 19–28. [Google Scholar]
  17. Paul, A.; Singh, A.P.; Loui, J.; Singh, A.K.; Khandelwal, M. Validation of RMR-based support design using roof bolts by numerical modeling for underground coal mine of Monnet Ispat, Raigarh, India—a case study. Arab. J. Geosci. 2012, 5, 1435–1448. [Google Scholar] [CrossRef]
  18. Singh, A.K.; Sinha, S.K.; Paul, A. Variation of RMR for different rock types as immediate roof in Jharia Coalfield of India. Int. J. Softw. Hardw. Res. Eng. 2013, 1, 44–55. [Google Scholar]
  19. Paul, A.; Murthy, V.M.S.R.; Singh, A.K. Rock Load Estimation in development Galleries and Junctions for Underground Coal Mines: A CMRI-ISM Rock Mass Rating Approach. Hindawi Publ. Corp. J. Min. 2014, 2014, 9. [Google Scholar] [CrossRef] [Green Version]
  20. Shorey, P.R.; Biswas, A.K.; Choubey, V.D. An empirical failure criterion for rocks and jointed rock masses. Eng. Geol. 1989, 26, 141–159. [Google Scholar] [CrossRef]
  21. Shi, N.; Huang, Z. Application of Longwall Top Coal Caving in Challenging Geological Conditions. In Proceedings of the World Congress on Mechanical, Chemical, and Material Engineering (MCM 2015), Barcelona, Spain, 20–21 July 2015. [Google Scholar]
  22. Klishin, V.; Nikitenko, S.; Opruk, G. Longwall top coal caving (LTCC) mining technologies with roof softening by hydraulic fracturing method. IOP Conf. Ser. Mater. Sci. Eng. 2018, 354, 012015. [Google Scholar] [CrossRef]
  23. Simsir, F.; Özfırat, M.K. Determination of the most effective longwall equipment combination in longwall top coal caving (LTCC) method by simulation modelling. Int. J. Rock Mech. Min. Sci. 2008, 45, 1015–1023. [Google Scholar] [CrossRef]
  24. Galvin, J.M. Ground Engineering—Principles and Practices for Underground Coal Mining; Springer International Publishing: Cham, Switzerland, 2016. [Google Scholar]
  25. Khanal, M.; Adhikary, D.; Balusu, R. Prefeasibility Study—Geotechnical Studies for Introducing Longwall Top Coal Caving in Indian Mines. J. Min. Sci. 2014, 50, 719–732. [Google Scholar] [CrossRef]
  26. Xie, Y.S.; Zhao, Y.S. Numerical simulation of the top coal caving process using the discrete element method. Int. J. Rock Mech. Min. Sci. 2009, 46, 983–991. [Google Scholar] [CrossRef]
  27. Xie, G.X.; Chang, J.C.; Yang, K. Investigations into stress shell characteristics of surrounding rock in fully mechanized top-coal caving face. Int. J. Rock Mech. Min. Sci. 2009, 46, 172–181. [Google Scholar] [CrossRef]
  28. Wang, J.; Yang, S.; Li, Y.; Wei, L.; Liu, H. Caving mechanisms of loose top-coal in longwall top-coal caving mining method. Int. J. Rock Mech. Min. Sci. 2014, 71, 160–170. [Google Scholar] [CrossRef]
  29. Xin, Y.; Gou, P.; Ge, F. Analysis of stability of support and surrounding rock in mining top coal of inclined coal seam. Int. J. Min. Sci. Technol. 2014, 24, 63–68. [Google Scholar] [CrossRef]
  30. Zhou, Y.; Li, H.; Zhai, X.; Su, C. Simulated materials modeling and analysis of the overburden strata movement in top coal caving mining. In Proceedings of the 20th International Conference on Ground Control in Mining, Morgantown, WV, USA, 7–9 August 2001; pp. 50–58. [Google Scholar]
  31. Zhang, N.; Liu, C. Arch structure effect of the coal gangue flow of the fully mechanized caving in special thick coal seam and its impact on the loss of top coal. Int. J. Min. Sci. Technol. 2016, 26, 593–599. [Google Scholar] [CrossRef]
  32. Alehossein, H.; Poulsen, B.A. Stress analysis of longwall top coal caving. Int. J. Rock Mech. Min. Sci. 2010, 47, 30–41. [Google Scholar] [CrossRef]
  33. Itasca. FLAC Version 4.0 User’s Manual; Itasca Consulting Group, Inc.: Minneapolis, MN, USA, 2000. [Google Scholar]
  34. Veera Reddy, B.; Madhav, B.; Charan, P.; Benerjee, G. Geotechnical challenges and experiences of working a deep and wide Longwall face: A case study of Adriyala Longwall project, SCCL. In Proceedings of the 36th International Conference on Ground Control in Mining, Morgantown, WV, USA, 24–27 July 2017; pp. 43–51. [Google Scholar]
  35. Mirakovski, D.; Krstev, B.; Krstev, A.; Petrovski, F. Mine Project Evaluation Techniques. Available online: https://eprints.ugd.edu.mk/3735/ (accessed on 4 February 2013).
  36. Government of India. Gazette Notification No. 22021/1/2008-CRC-II, Dated 30.12.2011; Ministry of Coal: New Delhi, India. Available online: https://ccai.co.in/circular-policies/ministry-coal/06.pdf (accessed on 25 September 2021).
Figure 1. Basic constitutive model.
Energies 14 06115 g001
Figure 2. Modeling for different UCS values.
Energies 14 06115 g002
Figure 3. Modeling for different RMR values.
Energies 14 06115 g003
Figure 4. Modeling for different depth values.
Energies 14 06115 g004
Figure 5. Modeling for different top coal thickness values.
Energies 14 06115 g005
Figure 6. Modeling for different extraction height values.
Energies 14 06115 g006
Figure 7. Graphs showing influence of various parameters on FTCD: 7(i) uniaxial compressive strength vs FTCD; 7(ii) RMR vs FTCD; 7(iii) cover depth vs FTCD 7(iv) top coal thickness vs FTCD, and 7(v) extraction height vs FCTD.
Energies 14 06115 g007aEnergies 14 06115 g007b
Figure 8. The FTCD obtained by regression and numerical modeling.
Energies 14 06115 g008
Figure 9. Diagram showing plan of longwall panels of ALP mine (SCCL).
Energies 14 06115 g009
Table 1. Classification of caveability by FTCD and TCR (adapted from Vakili and Hebbelwhite [13]).
First Top Coal Caving
Distance (FTCD)
(m)
Top Coal Recovery
(%)
Remarks
Less than 7100Extremely weak roof. Unless the overlying strata are not weak, dilution issues arise.
7–1579–100Good caveability. Most desired conditions
15–2359–79Fair caveability. Requires techniques for induced caving.
23–3239–59Poor caveability. Not recommended
More than 32<39Extremely poor caveability.
Not recommended
Table 2. Physicomechanical properties assigned to the rock strata.
LocationMaterialCompressive Strength (MPa)Tensile Strength (MPa)Young’s Modulus (GPa)RMRPoisson’s Ratio
Bottom StoneSandstone191.95.0600.25
Coal seamCoal202.02.0400.25
Main RoofSandstone13.51.255.0600.25
Coal seamCoal212.12.0460.25
Upper main roofSandstone252.56.0600.25
Clay bandClay212.14.0460.25
Sandstone roofSandstone252.55.0600.25
Table 3. Summary of scenarios of numerical modeling with FLAC 3D.
ScenarioModel NumberExtraction Height (m)Top Coal Thickness (m)RMR ValueUniaxial Compressive Strength (MPa) of Coal Depth (m)First Top Coal Caving Distance Obtained from Numerical Modeling (FTCD) (m)
I
(by varying UCS of coal)
13.53.540154003
23.53.540204004
33.53.540304005
43.53.540404006
II
(by varying RMR of coal)
53.53.530204003
63.53.540204004
73.53.550204005
83.53.560204006
III
(by varying depth of coal seam)
93.53.540203006
103.53.540204004
113.53.540205004
123.53.540206003
IV
(by varying top coal thickness)
133.52.540204003
143.53.540204004
153.54.540204006
163.55.540204008
V
(by varying extraction height)
1733.540204005
183.53.540204004
1943.540204004
204.53.540204004
Table 4. Regression statistics.
ParameterValue
Multiple R0.955481231
R-squared0.912944384
Adjusted R-squared0.881853092
Standard error0.452649546
Observations20
Table 5. The geotechnical parameters of No. 1 seam and its overlying roof strata of the ALP Mine.
Bed No. Ht. Above Coal Seam, m Bed Thickness, m Density, gm/cc CS, ksc TS, ksc Modulus of Elasticity, E, ksc Caveability Index (CI) RMR
From To
No. 1 Seam −3.50 0.00 3.5 −1 281 −1 −1 0 43
Caving Layer 1 0.00 6.63 6.63 2033 193 15 −1 1194 45
Caving Layer 2 6.63 24.33 17.7 2061 181 24 −1 6919 61
Caving Layer 3 24.33 54.46 30.13 2091 192 25 −1 3860 48
Caving Layer 4 54.46 55.95 1.49 2034 215 28 −1 1632 49
Table 6. Geo-mining conditions of ALP mine.
Bottom coal extraction height (EH)3.5 m
Top coal thickness (TC)3.5 m
RMR40
Uni axial compressive strength of coal (UCS)44.6 Mpa
Depth of coal seam from surface (H)450 m
Table 7. FTCD of various coal mines in India.
Sl. No.Seam Name, AreaMineCompany NameSeam Thickness (m)Extraction Height (m)Top Coal Thickness (m)RMR ValueUni Axial Compressive Strength (Mpa) of CoalDepth (m)First Top Coal Caving Distance (FTCD), (m)
1R-VI, RaniganjJhanjra ECL5.53.5258.6151505.1
2III Seam, SrirampurIK1ASCCL6.542.544131683.9
3SJ Seam, MandamarriMVK-IISCCL6335328.51407.6
4III Seam, Ramagundam-II AreaGDK8 INCLINESCCL104.55.56221.418010.5
5I Seam, Adriyala Projects AreaALPSCCL73.53.54044.64506.15
6III Seam, Adriyala Projects AreaALPSCCL104.55.55731.86007.8
7III Seam, Ramagundam-I AreaGDK 11 INCLINESCCL63.52.54913.72703.9
8King Seam, KothagudemPVK 5 INCLINESCCL84.53.55211.32505.1
Table 8. Main top coal caving longwall equipment list.
S. No.LTCCSPL
Name of EquipmentQuantityName of EquipmentQuantity
1ZF12000/25/38 four-legged face shield support138Two-legged DTDA version face shields139
2ZFG12000/28/42 four-legged end shield support8Two-legged DTDA version face end shields6
3MG650/1630-WD shearer1BUCYRUS DBT EL 3000 shearer1
4SGZ1000/(2 * 855) front AFC L = 256 m13 × 855 KW, 3.3 KV three-phase AFC1
5SGZ1000/(2 * 855) rear AFC L = 256 m1
6SZZ1200/525 BSL L = 451400 KW, 3.3 KV, three-phase1
7ZY1100 self-moving device for stage loader1Self-moving device for stage loader1
8ZY2700 boot end for belt conveyor 1Boot end1
9PCM525 crusher1400 KW, 3.3 KV, three-phase crusher1
10Emulsion pump station (three pumps, two tanks)1Power pack (three high-pressure pumps, three cooling pumps, two booster pumps) including filter station and emulsion tank1
11Spraying pump station (three pumps, two tanks)1
12DSJ120/180/3 × 315 belt conveyor L = 2200 m1Gate belt conveyor—3.0 km1
13Load center (including control system and cable)1Load center (including control system and cable)1
Table 9. Capital costs by SCCL for longwall in 2013 and LTCC (offered to SCCL by a Chinese company).
Sl. No.ItemLTCC Viability October 2020
Performance Level
At 100%At 85%
IProduction capacity (MTPA)3.7503.188
IICost of production
1Wages341.08372.81
2Power97.64100.97
3Stores303.02311.53
4Mine closure3.313.90
5Post-project EMP2.602.93
6General administration32.8638.66
7Interest
(a) Loan capital0.000.00
(b) Working capital24.5526.12
8Depreciation197.34221.85
Total cost of production1007.401083.78
IIIAverage sales price3391.213391.21
IVProfit/loss2383.812307.44
VFinancial IRR68.47%58.53%
Table 10. Financial IRR of top coal caving at 100% and 85% performance level.
S. No.SensitivityFinancial IRR
Performance Level 100%85%
IBase Case68.47%58.53%
IIIncrease in Capital Cost
10% increase over base67.40%57.53%
15% increase over base66.87%57.04%
20% increase over base66.35%56.56%
IIIIncrease in Operating Cost
10% increase over base65.66%55.86%
15% increase over base64.26%54.53%
20% increase over base62.87%53.21%
IVIncrease in Capital and Operating Costs
10% increase over base64.62%54.90%
15% increase over base62.74%53.12%
20% increase over base60.89%51.38%
VFall in Grade
Base Case (54% G-9, 46% G-7)68.47%58.53%
Total grade falls to G-9 67.81%57.61%
Total grade falls to G-1063.80%53.95%
Total grade falls to G-1148.88%40.34%
VIIncrease in Total Cost and fall in Grade to G-11
10% increase in total cost and Coal Grade G-1144.89%34.20%
15% increase in total cost and Coal Grade G-1142.93%32.21%
20% increase in total cost and Coal Grade G-1141.00%30.24%
Publisher’s Note: MDPI stays neutral with regard to jurisdictional claims in published maps and institutional affiliations.

