Article

Development and Validation of Mass Reduction Prediction Model and Analysis of Fuel Properties for Agro-Byproduct Torrefaction

1
Department of Interdisciplinary Program in Smart Agriculture, Kangwon National University, Hyoja 2 Dong 192-1, Chuncheon-si 24341, Korea
2
Green Materials & Processes R&D Group, Korea Institute of Industrial Technology, 55, Jongga-ro, Jung-gu, Ulsan 44413, Korea
3
Department of Forest Products, Division of Wood Chemistry, National Institute of Forest Science, 57, Hoegi-ro, Dongdaemun-gu, Seoul 02455, Korea
*
Author to whom correspondence should be addressed.
Energies 2021, 14(19), 6125; https://doi.org/10.3390/en14196125
Submission received: 26 July 2021 / Revised: 13 September 2021 / Accepted: 22 September 2021 / Published: 26 September 2021
(This article belongs to the Topic Actions for Bioenergy and Biofuels: A Sustainable Shift)

Abstract

:
Global warming is accelerating due to the increase in greenhouse gas emissions. Accordingly, research on the use of biomass as energy sources, is being actively conducted worldwide to reduce CO2 emissions. Although the production of agro-byproducts is vast, their utilization for energy production has not been fully investigated. This study suggests an optimal torrefaction process condition for agro-byproducts, such as grape branch and perilla, that have moisture content but low calorific values. To determine whether these agro-byproducts can be used for energy sources as substituents of fossil fuels, a mass reduction model was established and validated via experimental results. Thermogravimetric analysis was conducted for different heating rates, and the activation energy and frequency factor were derived through the analysis. The model was developed by changes in rate constants, moisture content, ash content, and lignocellulose content in biomass. To ascertain the optimal torrefaction conditions, fuel characteristic analysis and changes in energy yield of torrefied grape branch and perilla were investigated. The optimal torrefaction conditions for grape branch and perilla were 200 °C for 40 min and 230 °C for 30 min, respectively. The comparison result of the experiment and simulation at the optimum conditions of mass reduction were 1.42%p and 1.51%p, and 15 °C/min and 7.5 °C/min at heating rate, respectively.

1. Introduction

Owing to the global increase in energy demands and the phasing-out of nuclear energy, the Republic of Korea has established plans for increasing their portion of renewable energy to 20% by 2030 [1,2]. Hence, alternative facilities and energy sources that can generate electricity have increased as replacements of nuclear power plants. Thermal power plants are one such facility. In terms of energy source, interest in biomass as a carbon-neutral fuel source that emits only 1/12th the CO2 compared to fossil fuels has increased [2]. Research on reducing carbon emissions and generating profits by using biomass and waste as energy sources is actively underway. There are several studies that suggest conversion technologies from sugarcane waste into biooil and biogas [3]. In order to use biowaste or byproducts as energy sources, a model to predict productivity of byproduct was developed [4,5] and the economic sustainability of renewable energy potential from agriculture, forestry, and other biomass was evaluated [6]. Rice straw and chaff are the most widely investigated biomass sources (Figure 1), having been used as compost, animal feed for livestock, and other purposes. However, other biomass sources, such as perilla and pepper stem, have a relatively smaller number of uses. In addition, these sources have disadvantages such as low calorific value, high moisture content, and difficulty of storage [7,8]. Torrefaction, a thermochemical conversion process, is a thermal pretreatment of biomass with a temperature range of 200–300 °C under lean or anoxic conditions within 1 h [9,10,11,12,13]. After torrefaction, fixed carbon in biomass increases, along with its calorific value. This property can be advantageous for storage and transportation of the torrefied product owing to improvement in its waster resistance [8,9]. However, as the torrefied sample can show different physical, chemical, and fuel properties depending on the process time and temperature, determining the optimal conditions to maximize energy efficiency is time consuming and costly.
To determine the optimum conditions, several studies have explained the biomass torrefaction prediction model by employing various process conditions and thermochemical and physical changes during torrefaction [2,14,15,16,17,18,19,20,21,22,23]. However, studies pertaining to the utilization of unused agro-biomass as a replacement energy source for fossil fuels are lacking. Accordingly, this study proposes a mass reduction model based on moisture content, ash content, and temperature duration. This process has been developed and validated for utilizing grape branch and perilla as energy sources. However, mass reduction using the torrefaction process is associated with energy loss, therefore, there were accuracy limits regarding the optimal torrefaction process based on mass yield only. Energy yield, a parameter for relating mass yield and fuel properties, was calculated by elemental analysis and fuel characteristic analysis, such as calorific value. An optimal torrefaction process was suggested, and the model accuracy was evaluated.

2. Materials and Methods

2.1. Sample

Each 20 kg of grape branch and perilla, naturally dried, was collected in Chuncheon, Gangwon Province. The collected samples are pulverized in powder form, and the change in fuel characteristics and the possibility of use as fuel are confirmed through the torrefaction process. Their bulk density and calorific value were measured, and proximate and elemental analyses were conducted on wet basis.

2.2. Experimental Method

A sample less than 2.36 mm size and 3 g in weight was placed into a prototype capsule (metal: carbon steel (AISI 304,   28 × 85 H × 2 T ) ) (Figure 2). To prevent rapid reaction with external air, the capsule was sealed and put into an electrical furnace. The change in mass reduction rate was measured after 3 process repetitions (including measuring heating value, mass yield, and energy yield). Experiment was conducted interval of 10, 20, and 40 min after reaching 200, 230, and 270 °C, respectively [24], followed by cooling for 30 min at room temperature; since ignition occurs when a sample with a high temperature above the ignition point reaction with oxygen, cooling is required.

2.3. Analysis Method

2.3.1. Bulk Density Analysis

The bulk density was measured as follows: particles smaller than 2.36 mm were poured from a height of approximately 200–300 mm from a 5-L container. The full container is dropped three times vertically from a height of approximately 150 mm from a flat, hard surface. The particles remaining on the container are removed with a flat object and then weighed. This process was repeated twice. The bulk density, in kg/m3, was calculated using the following Equation (1), and the resulting value was rounded off to the first digit.
BD = M p M c V  
where BD is the bulk density (kg/m3); Mp is the weight of container with particles (kg); Mc is the weight of empty container (kg); and v is the volume of empty container (m3).

2.3.2. Thermal Analysis

Woody biomass mainly comprises cellulose, hemicellulose, and lignin. Water evaporation occurs at 100 °C. Degradation, discoloration, and carbonization occur in the order of hemicellulose, cellulose, and lignin. This occurs in the temperature range of 150–350, 275–350, and 250–500 °C, respectively [6]. Condensed and non-condensed gases are generated at 110–300 °C due to evaporated volatile matter [9,25]. To determine mass changes caused by degradation, evaporation, and gasification in terms of temperature changes, thermogravimetric analysis was conducted using a thermogravimetric analyzer (DSA Q2000/SDT Q600, TA Instruments, New Castle, DE, USA). The temperature was increased at different heating rates (7.5, 15, and 22.5 °C/min).

2.3.3. Fuel Property Analysis

Torrefied biomass was dried for 3 h in oven dryer at 105 °C, and its calorific value was measured using a calorimeter (6400, Parr, Moline, IL, USA). Measurements were conducted 3 times. According to ISO 18122:2015, an element analyzer (EA-3000, Eurovector, Cuzio, Pavia, Italy) was used to determine the changes in elemental composition and plotted using a Van Krevelen diagram [26,27]. There exists a direct relationship between mass yield, energy yield, and fuel properties. Mass, energy yield, and energy density were calculated using Equations (2)–(4) on wet basis.
Y M = M torr M BO , I × 100  
where YM is the mass yield (%); Mtorr is the biomass mass after torrefaction (g); MBO,I is the initial biomass mass on wet basis (g).
EY = Y M × HHV torr HHV raw
where EY is the energy yield (%); HHVtorr is the torrefied biomass higher heating value [MJ/kg]; and HHVraw is the raw biomass higher heating value on wet basis [MJ/kg].
ED = EY Y M
where ED is the energy density (-); YM is mass yield (%); and EY is energy yield (%).

3. Simulation Analysis

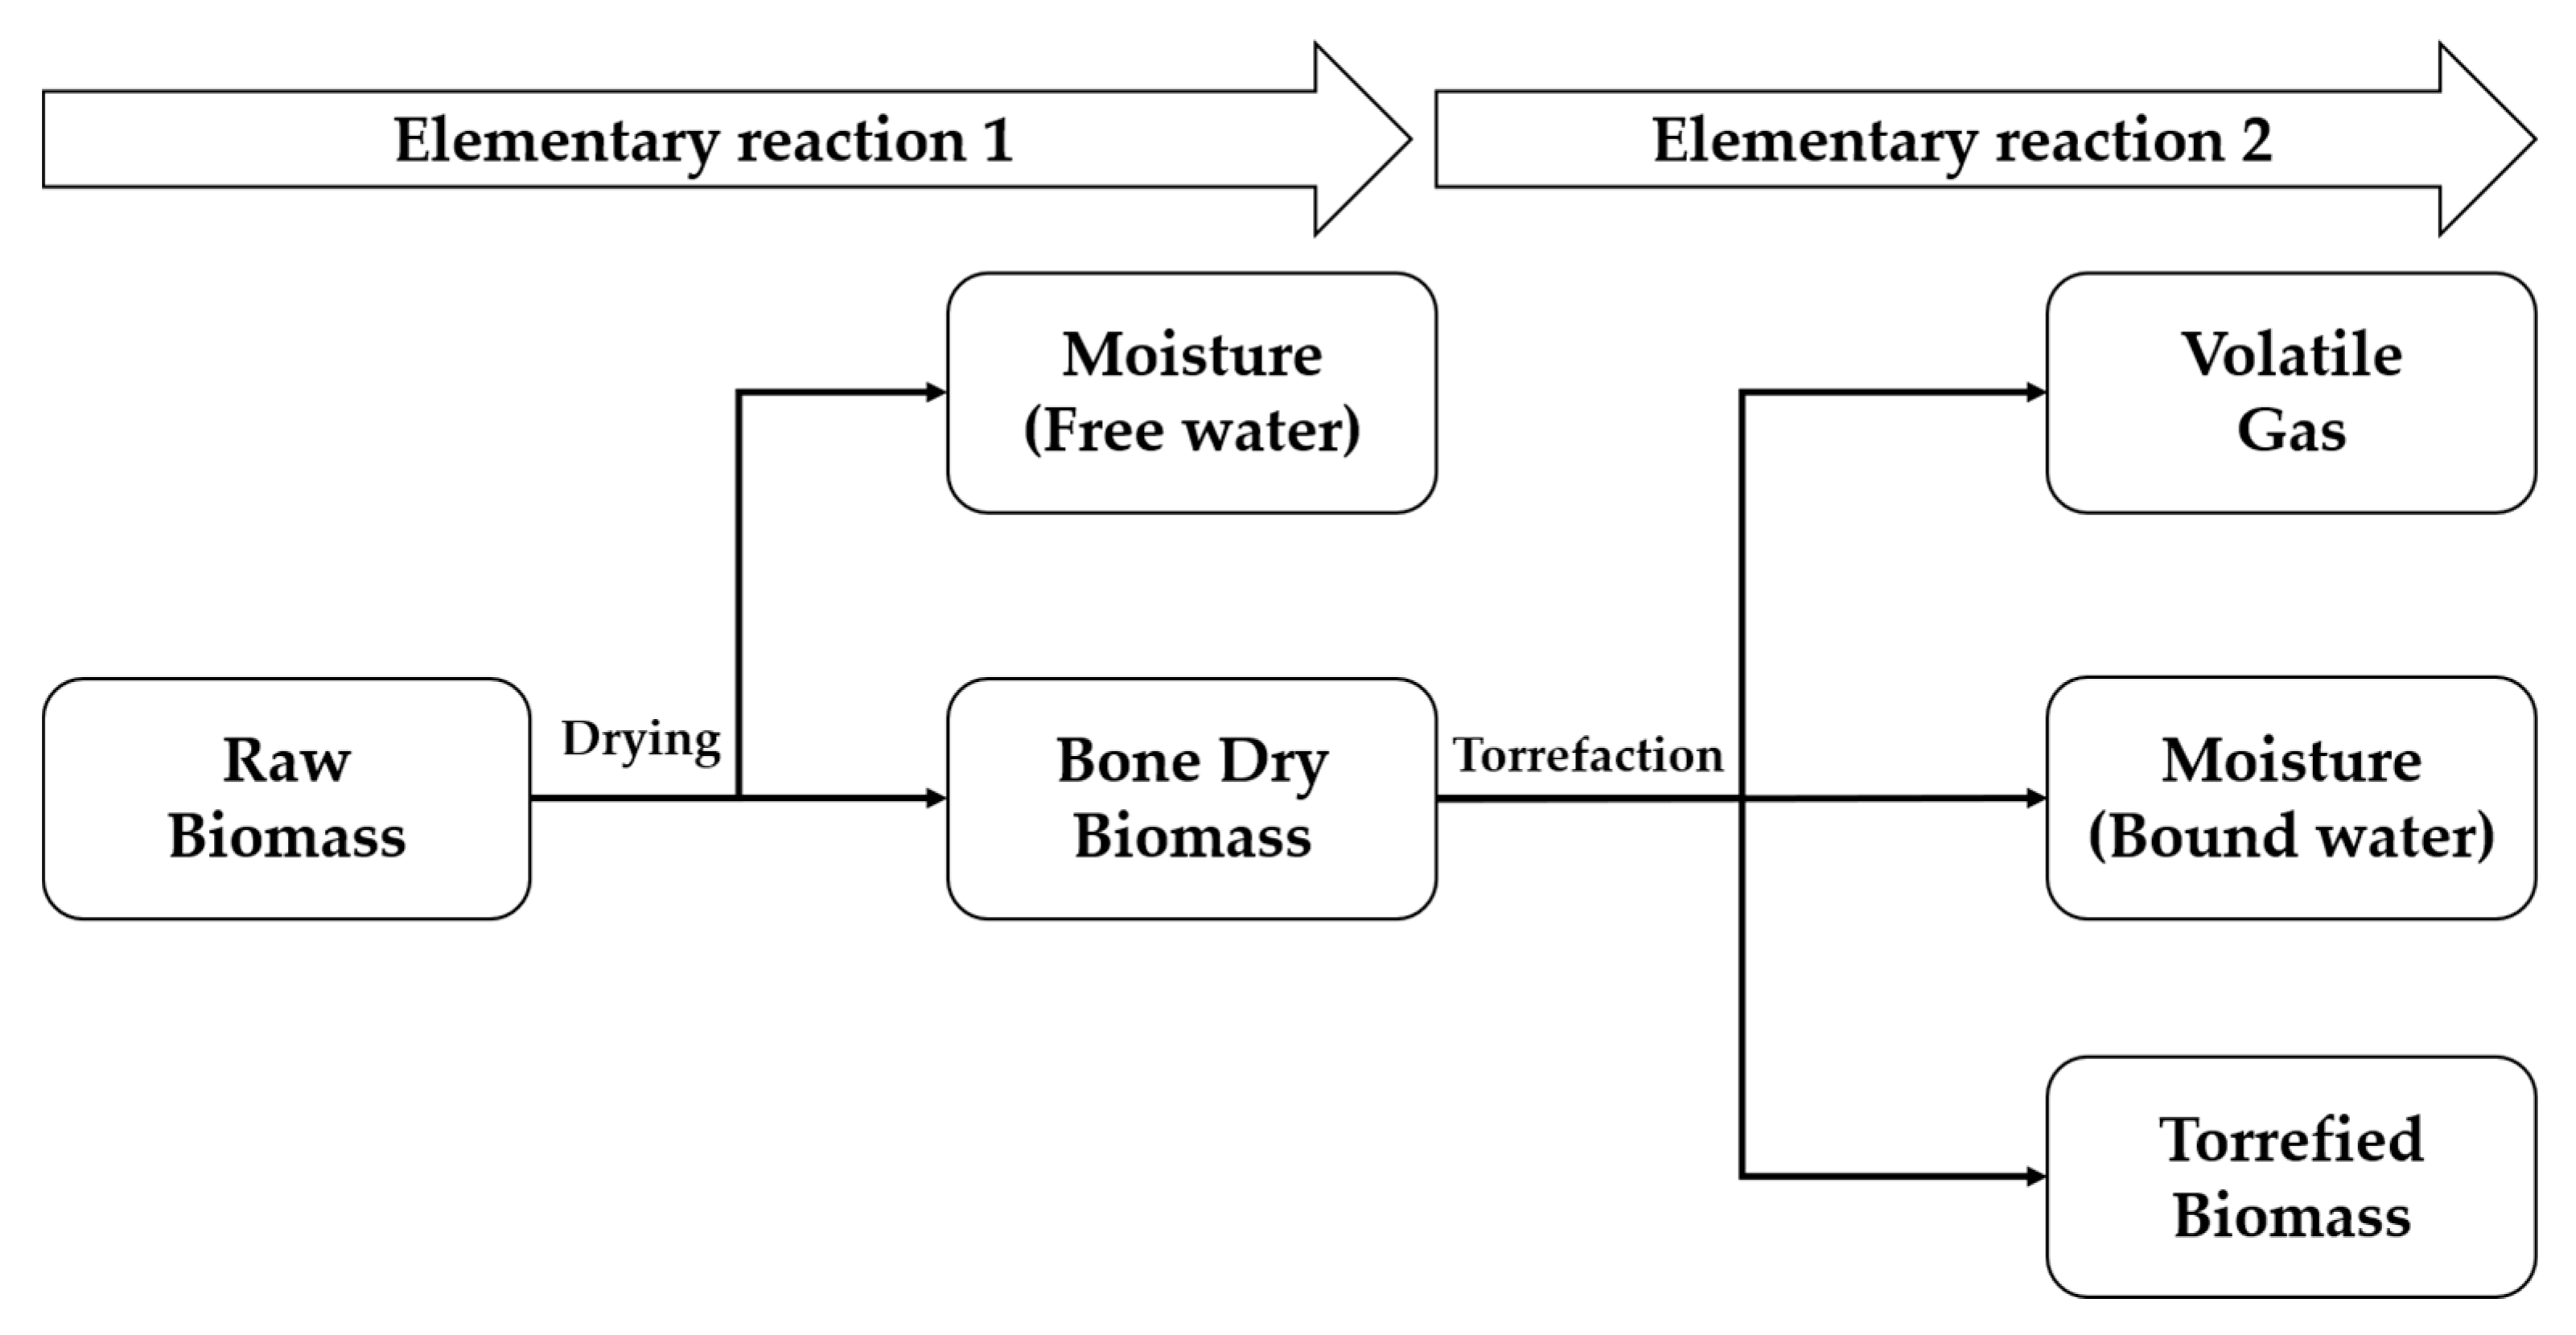
3.1. 1-D Mass Reduction Prediction Model

In this study, the finite element method (FEM) was used to predict the mass reduction due to temperature change of biomass during the torrefaction. In order to use the finite element method, the steel layer and the biomass layer were divided, and the biomass layer was further divided into a total of 25 nodes (Figure 3). Tm−1, Tm, and Tm+1 are arbitrarily positions divided according to FEM.
To calculate temperature changes according to thermal diffusivity ( α ) of the mass reduction prediction simulation model, absolute temperature (T), thermal diffusivity using specific heat (Cp) and heat conduction coefficient (K) were used following Equations (5)–(8) [28,29,30,31,32].
( K Steel = 15   [ W / m · K ] ,   C p , Steel = 477 [ J / g · K ] ) K Grape = 0.13 + 0.0003 × ( T 273.15 )   [ W / m · K ]  
C p , Grape = ( 9.12 × 10 2 + 4.4 × 10 3 × T ) × 1000   [ J / g · K ]
K Perilla = 0.00249 + 0.0000145 × B . d perilla + 0.000184 × ( T 273.15 )   [ W / m · K ]
C p ,   Perilla = ( 9.12 × 10 2 + 4.4 × 10 3 × T ) × 1000   [ J / g · K ]
α = K ρ × C p   [ m 2 / s ]
where the B.dperilla is the bulk density, Equation (10) represents the rate of change of the energy contents of the nodes; the first and second terms on the right-hand side are the rat of heat conduction on the right and left surfaces, respectively. Equation (11) was represented using Equations (9) and (10) [2].
ρ A xC p dT m dt = kA T m + 1 T m x + kA T m 1 T m x   [ W ]
dT m = α x 2 × ( T m 1 2 × T m + T m + 1 ) × dt   [ k ]

3.2. Thermal Change Analysis of Biomass

During torrefaction, absolute temperature (T) changes may occur differently based on the density of biomass, moisture content, thermal permeability, and thermal property. The absolute temperature (T) changes were calculated and used in Equation (12) to derive the rate constant. To calculate the degree of reaction through thermal changes, the rate constant was used. Rate constant (k) was derived following Arrhenius’ empirical equation (Equation (12)) [33,34,35,36,37].
k ( T ) = A × exp E a R × T   [ 1 / s ]
After taking natural logs of both sides of Equation (13):
ln ( k ) = ( E a R ) × ( 1 T ) + lnA   [ 1 / s ]  
In this study, frequency factor (A) and activation energy (Ea) were derived by thermogravimetric analysis (TGA). The frequency factor means the number of frequency of intermolecular collisions (1/s). The activation energy refers to the minimum energy required for a chemical reaction to proceed (kJ/mol). R is ideal gas constant (J/mol · k). As shown in Equation (13), rate constant (k) can change the frequency factor (A), activation energy (Ea), and also absolute temperature (T).

3.3. Mass Reduction Model

For predicting mass reduction during torrefaction, thermal conversion of biomass was studied via two pseudoelementary reactions (Figure 4). Elementary reaction 1 comprises moisture evaporation of biomass by drying and elementary reaction 2 involves thermal changes to the lignocellulosic components and volatile matter [2,37,38,39,40,41,42,43,44]. Mass reduction was calculated by considering the moisture content of raw sample (grape branch, perilla) (W), lignocellulosic (including volatile and fixed carbon) components (L), and separately (Table 1). Total mass reduction was calculated as the summation of measured quantities of these components (Equation (16)). Change in mass with time was multiplied by lignocellulosic components and rate constant. Decrease in lignocellulosic components and moisture content was derived from Equations (14) and (15), and kt and kd were rate constants of lignocellulose and water, respectively. Mass after torrefaction was derived by subtracting the sum of decrease in total mass (that is, the mass of lignocellulose, moisture content) from the initial mass (Equation (16)). Here, t is time(s); total massinitial is the entire biomass composition components before the torrefaction process; massfinal is the biomass composition component, having removed the water and lignocellulosic components after torrefaction process.
L . = dL dt = k t × L  
W . = dw dt = k d × W
Mass final = Total   mass initial W . L .

4. Results

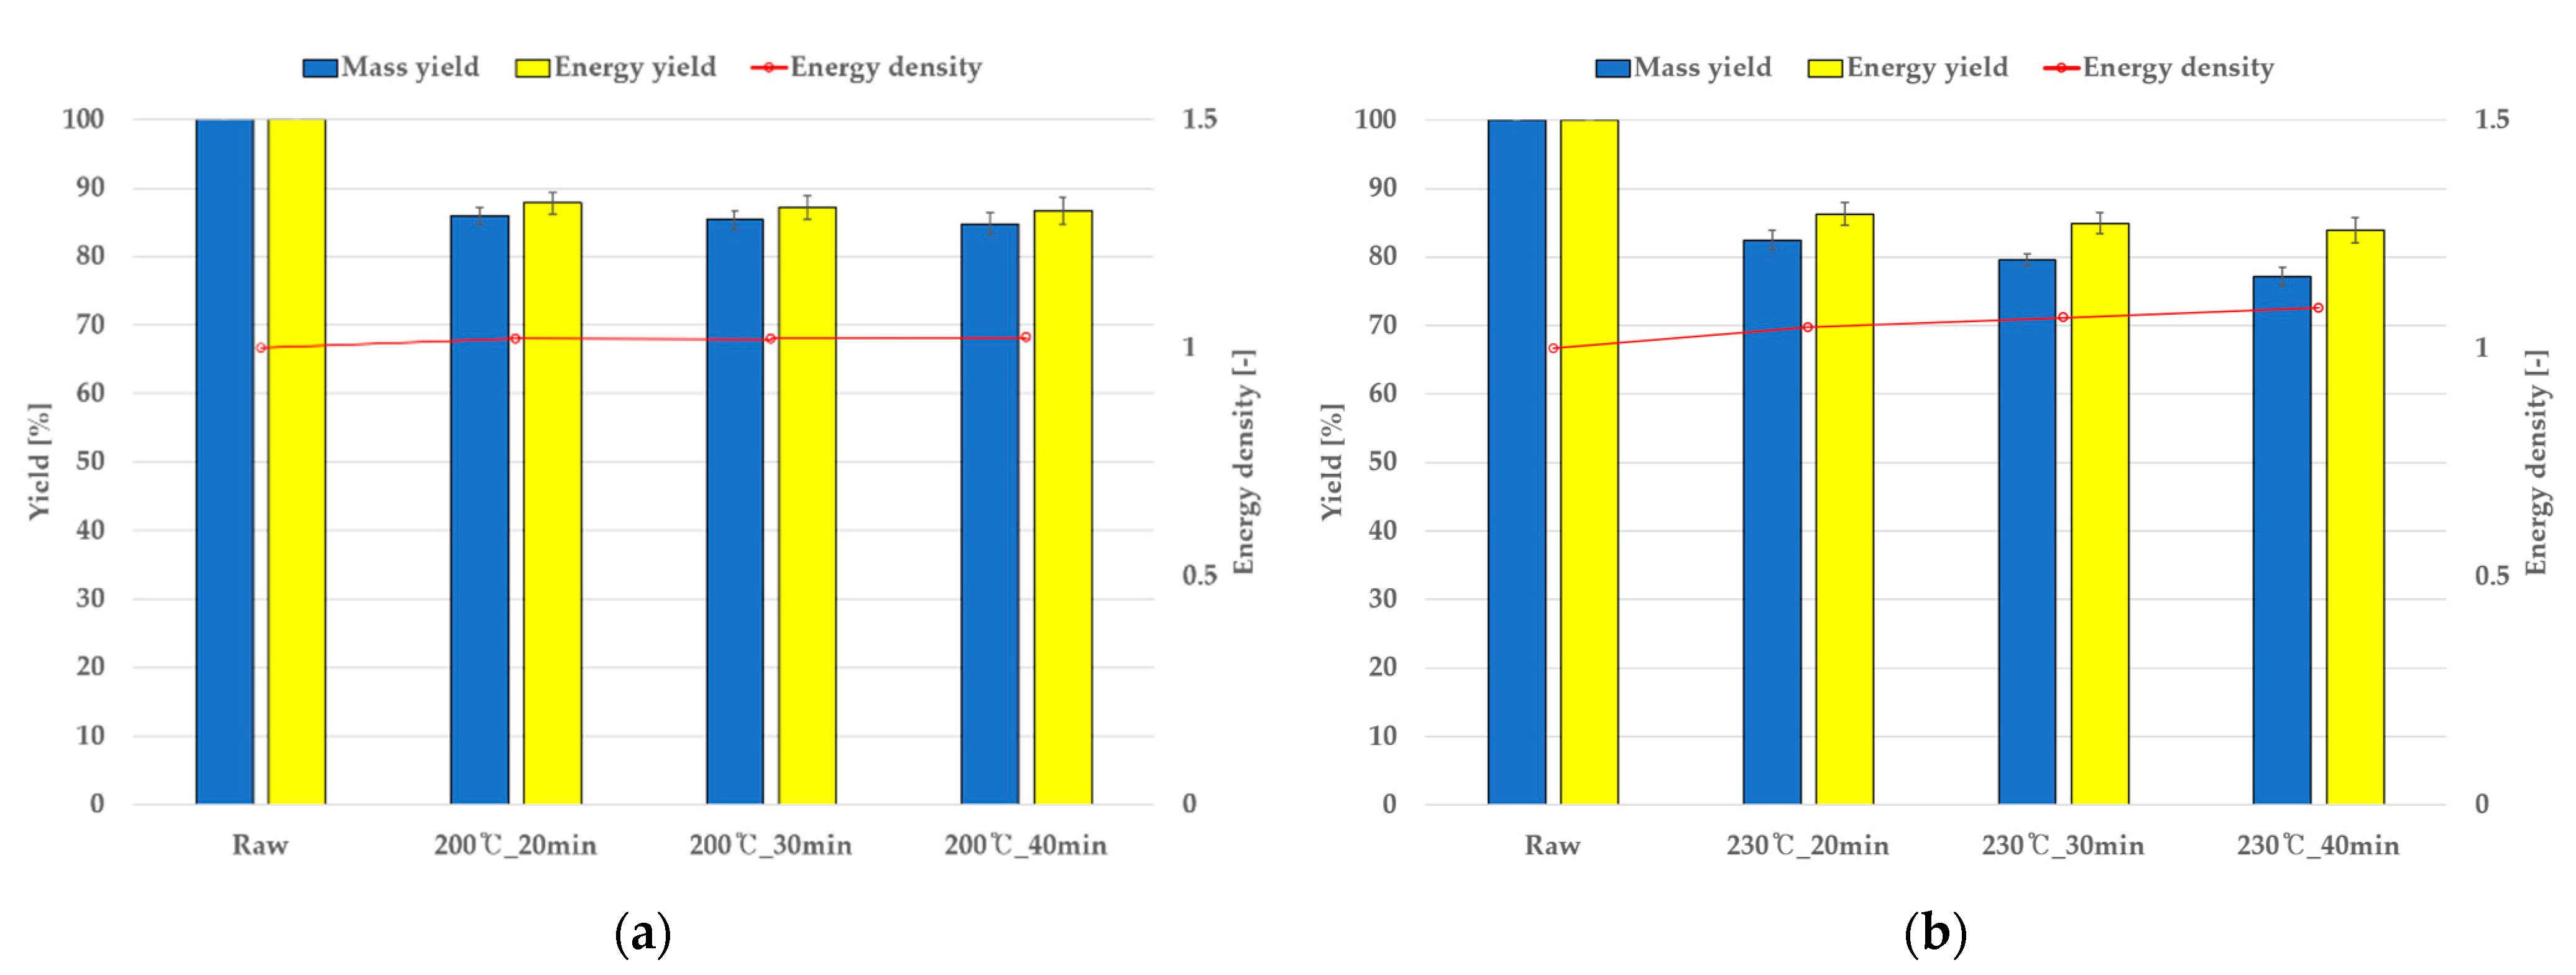
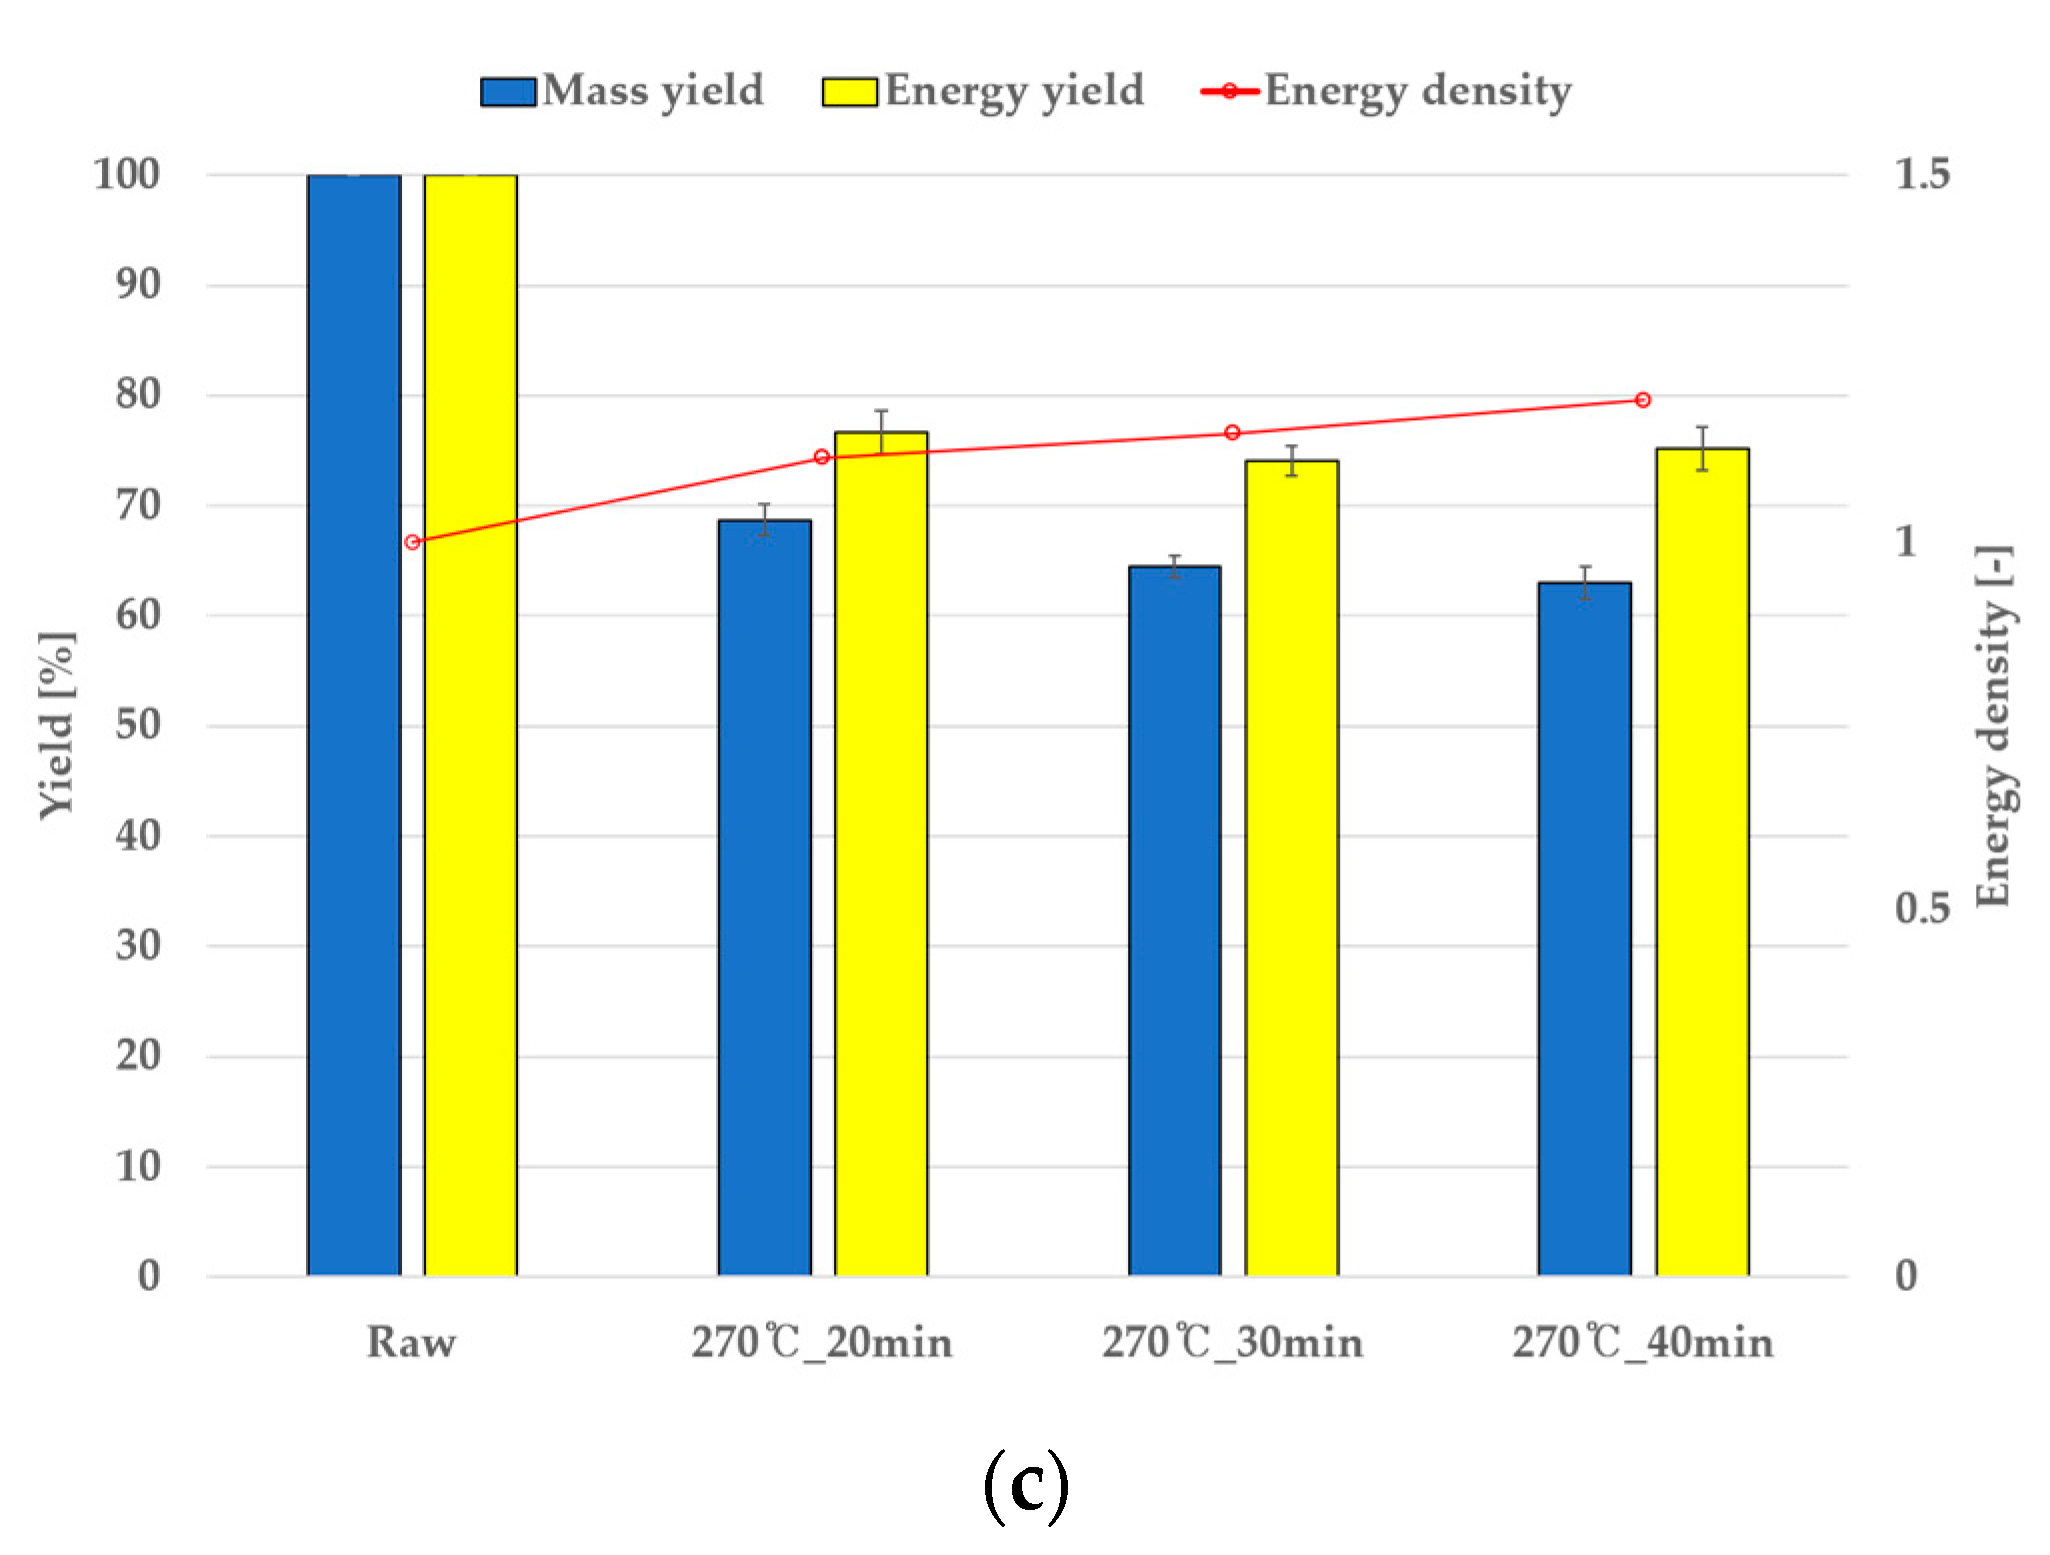
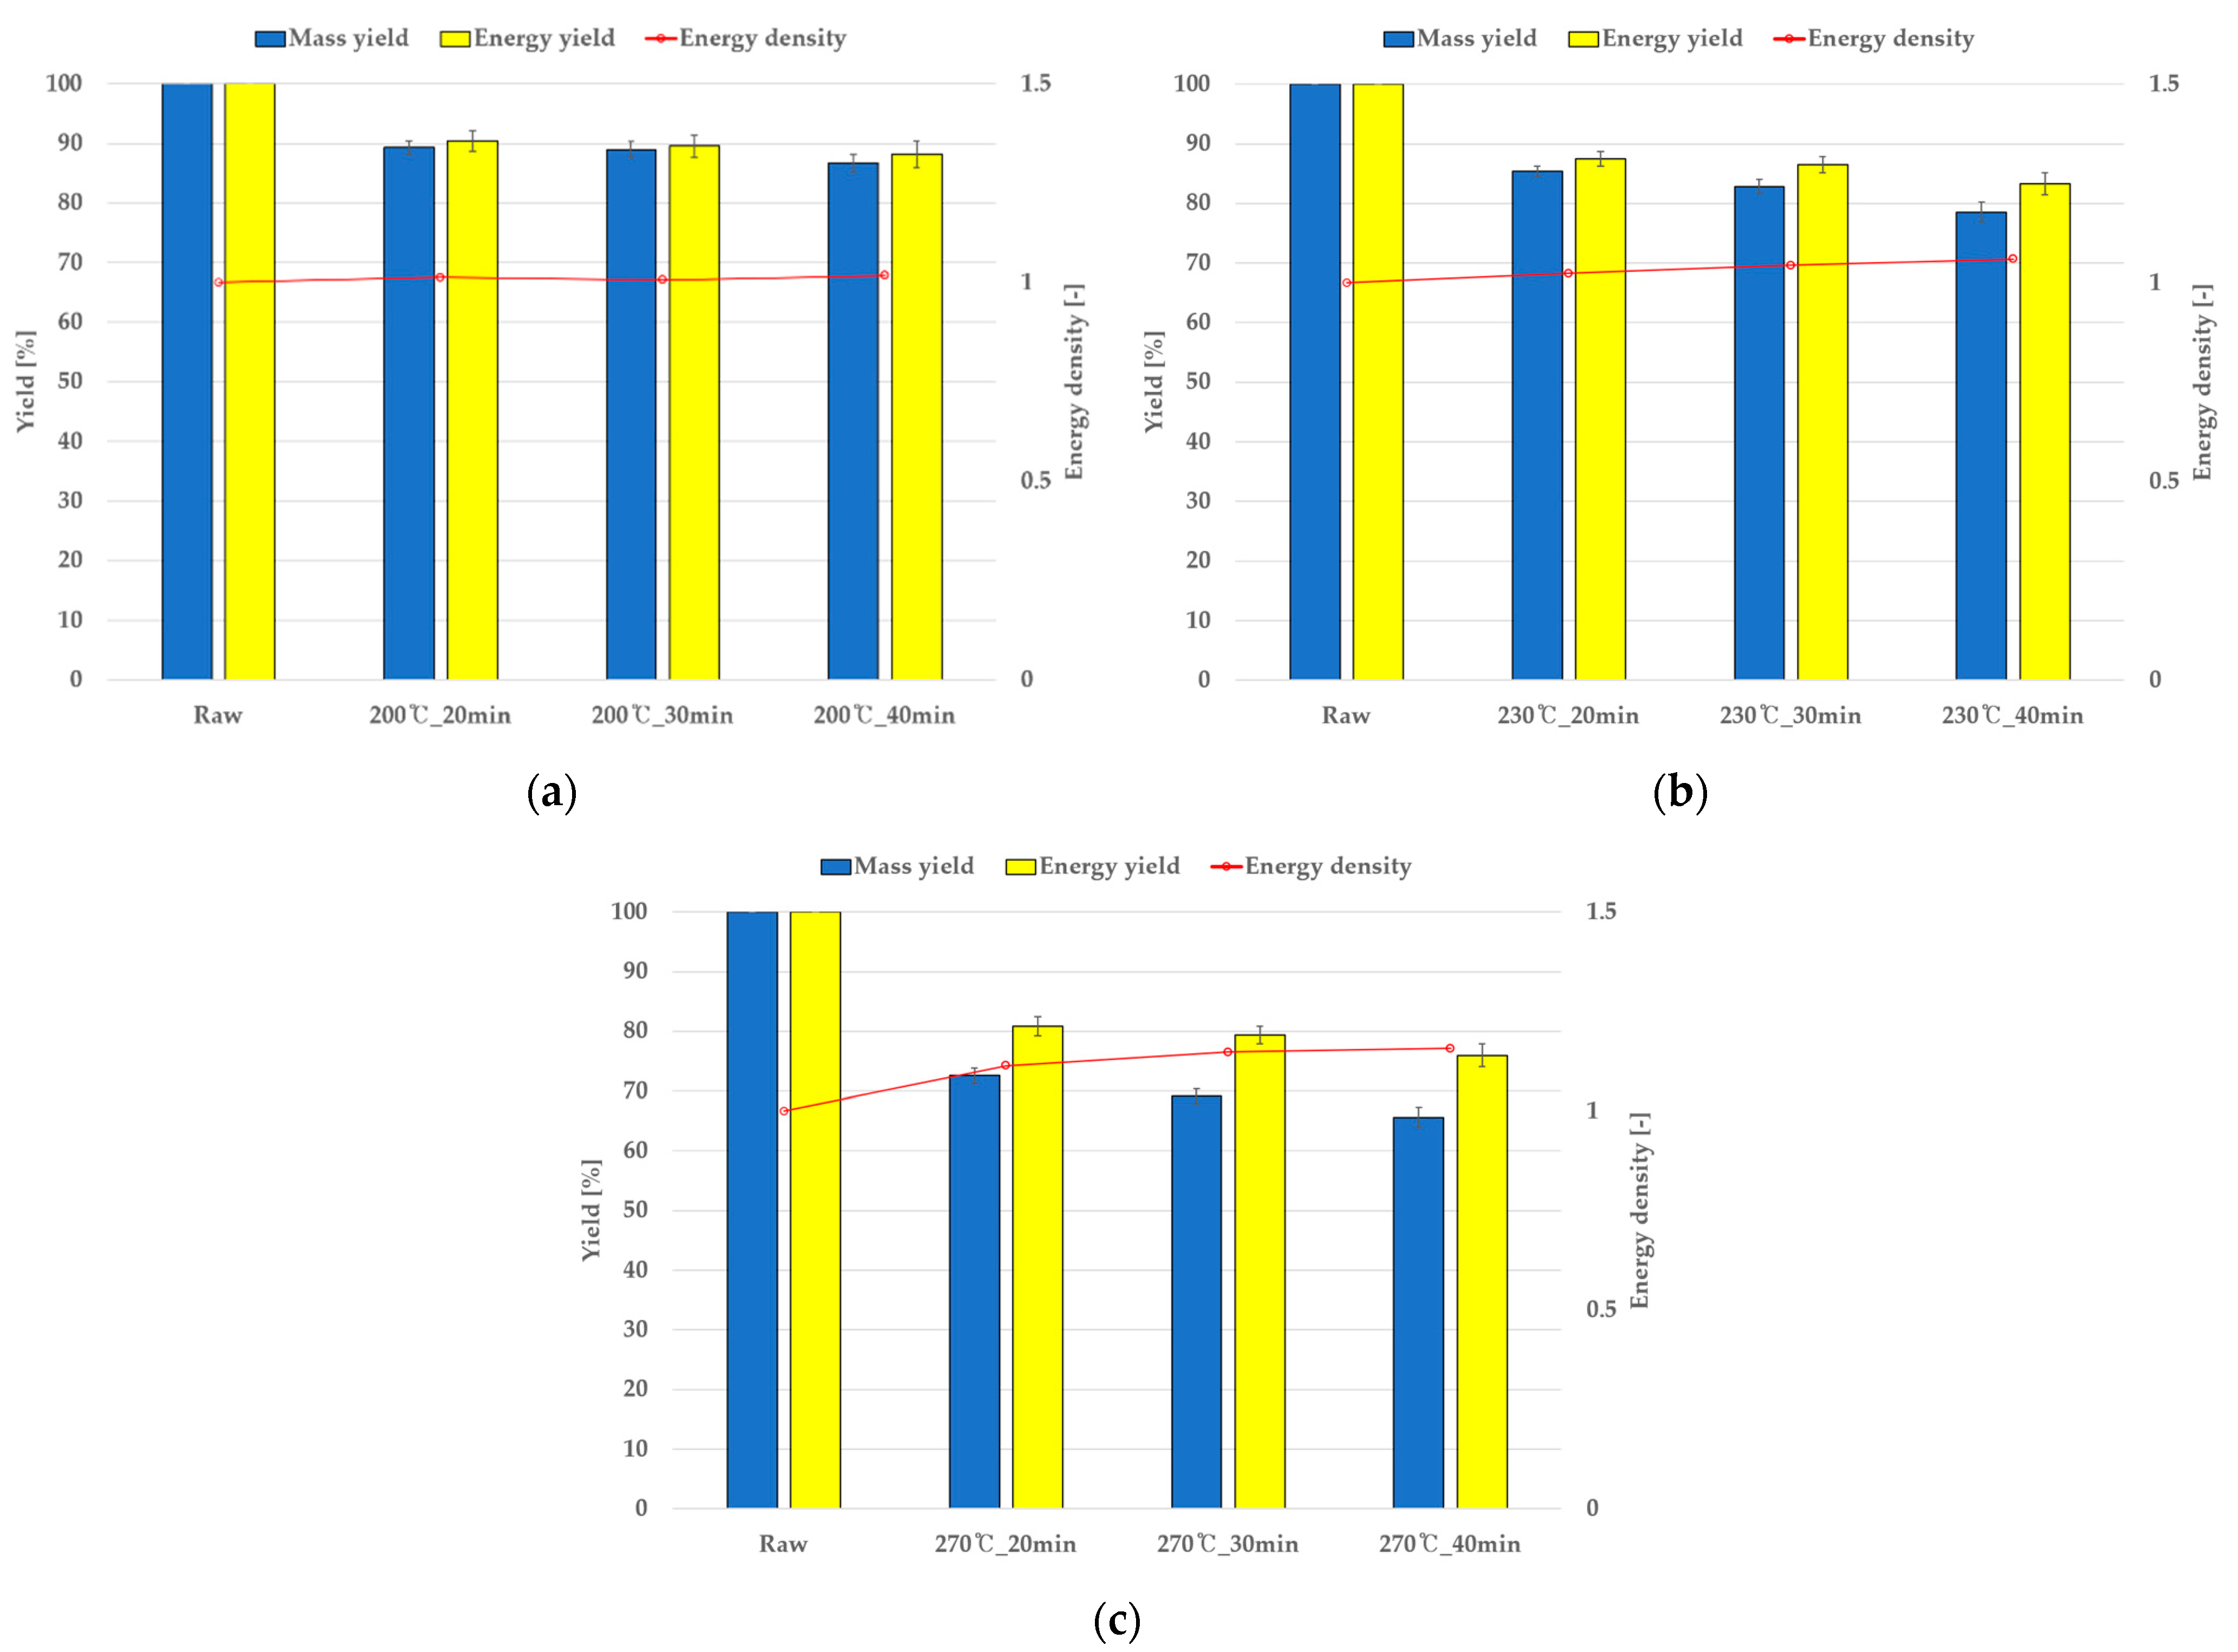
4.1. Fuel Properties

Figure 5 shows the Van Krevelen diagram of the elemental analysis result of torrefied grape branch and perilla. With an increase in process temperature and time, the composition ratio of carbon was increased, while that of oxygen and hydrogen was decreased. For the raw and torrefied grape branch comparison result, the composition ratio of carbon increased by approximately 2–25%p, but the ratio of oxygen and hydrogen were decreased by 22–40%p and 5–10%p, respectively. Comparing the raw and torrefied perilla, the composition ratio of carbon was increased by 14–60%p, but the ratio of oxygen and hydrogen decreased by 19–44%p and 2–15%p, respectively. Calorific values are summarized in Table 2. The calorific value of grape branch was 19.46–22.77 MJ/kg, and for perilla, it was 19.06–21.77 MJ/kg. There was a 2–19%p and 1.3–15%p increase compared with the raw sample of grape branch and perilla, respectively. The energy yield was derived using Equation (3) and summarized in Table 3. The energy yield of grape branch and perilla are 74.1–87.8% and 76–90.5%, respectively. Energy yield was also decreased with an increase in process time and temperature.
Figure 6 and Figure 7 depict mass yield, energy yield, and energy density following torrefaction for each material. The higher the process temperature and longer time, the larger the mass reduction. In the case of grape branch, the initial moisture content and volatile content were higher than those of perilla; hence, mass reduction was larger than perilla according to the process condition. Energy yield was decreased even though heating values were increased with longer time and higher temperature, due to the larger mass loss according to Equation (3). The energy density increased with higher process temperature and longer process times. Thus, considering mass yield, energy yield (Figure 6 and Figure 7) and calorific value, the optimal conditions of grape branch and perilla were 200 °C for 40 min and 230 °C for 30 min, respectively.

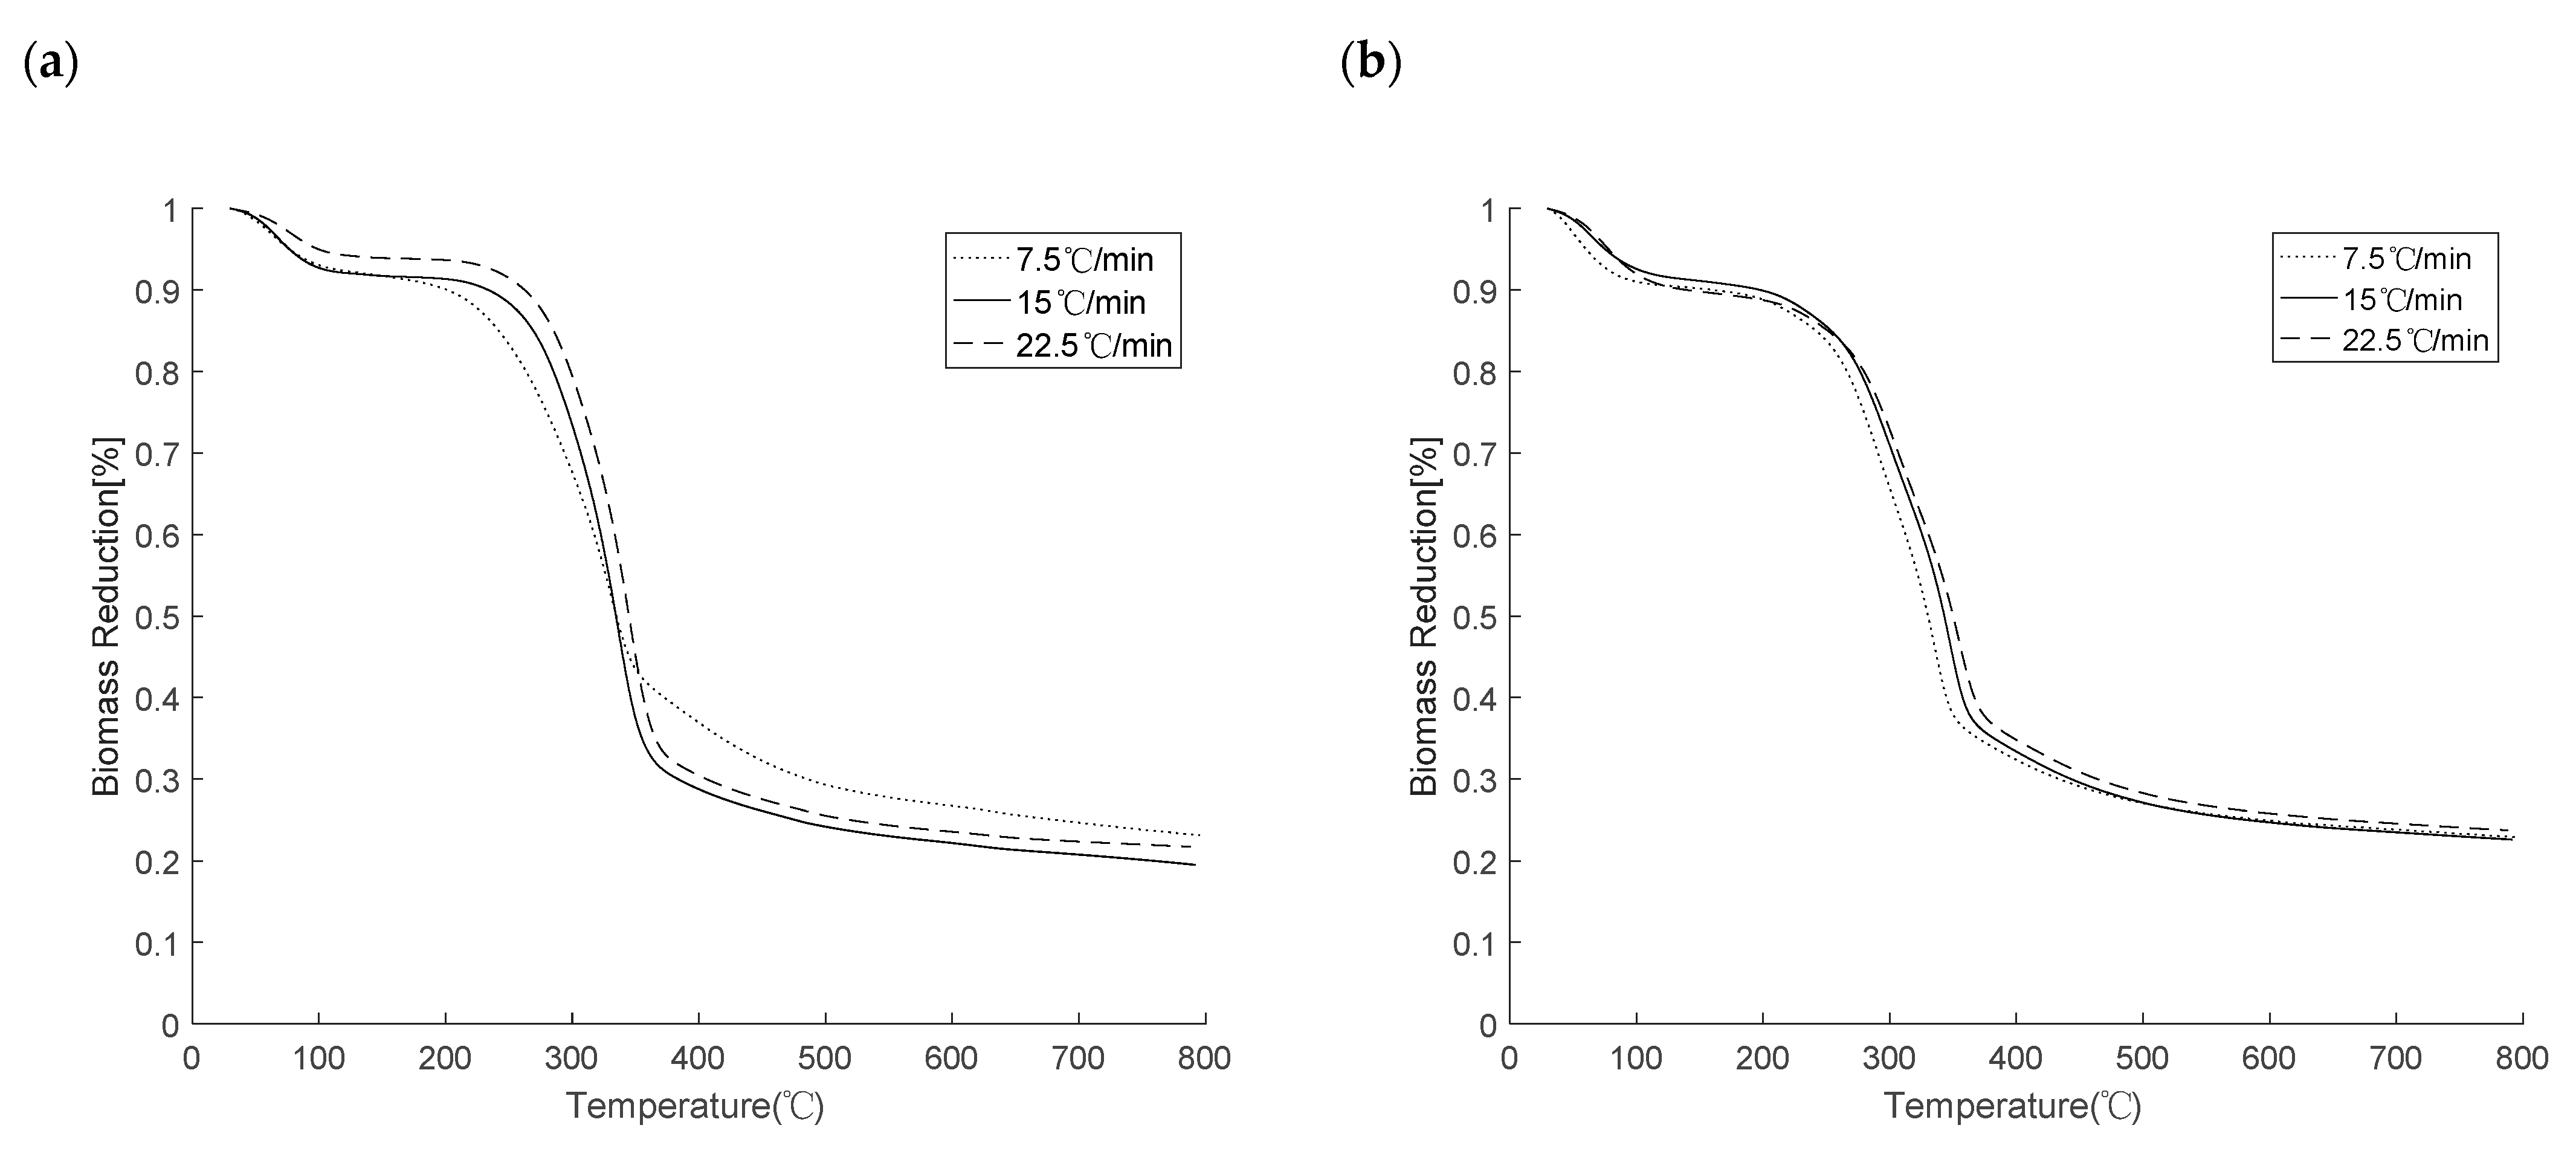
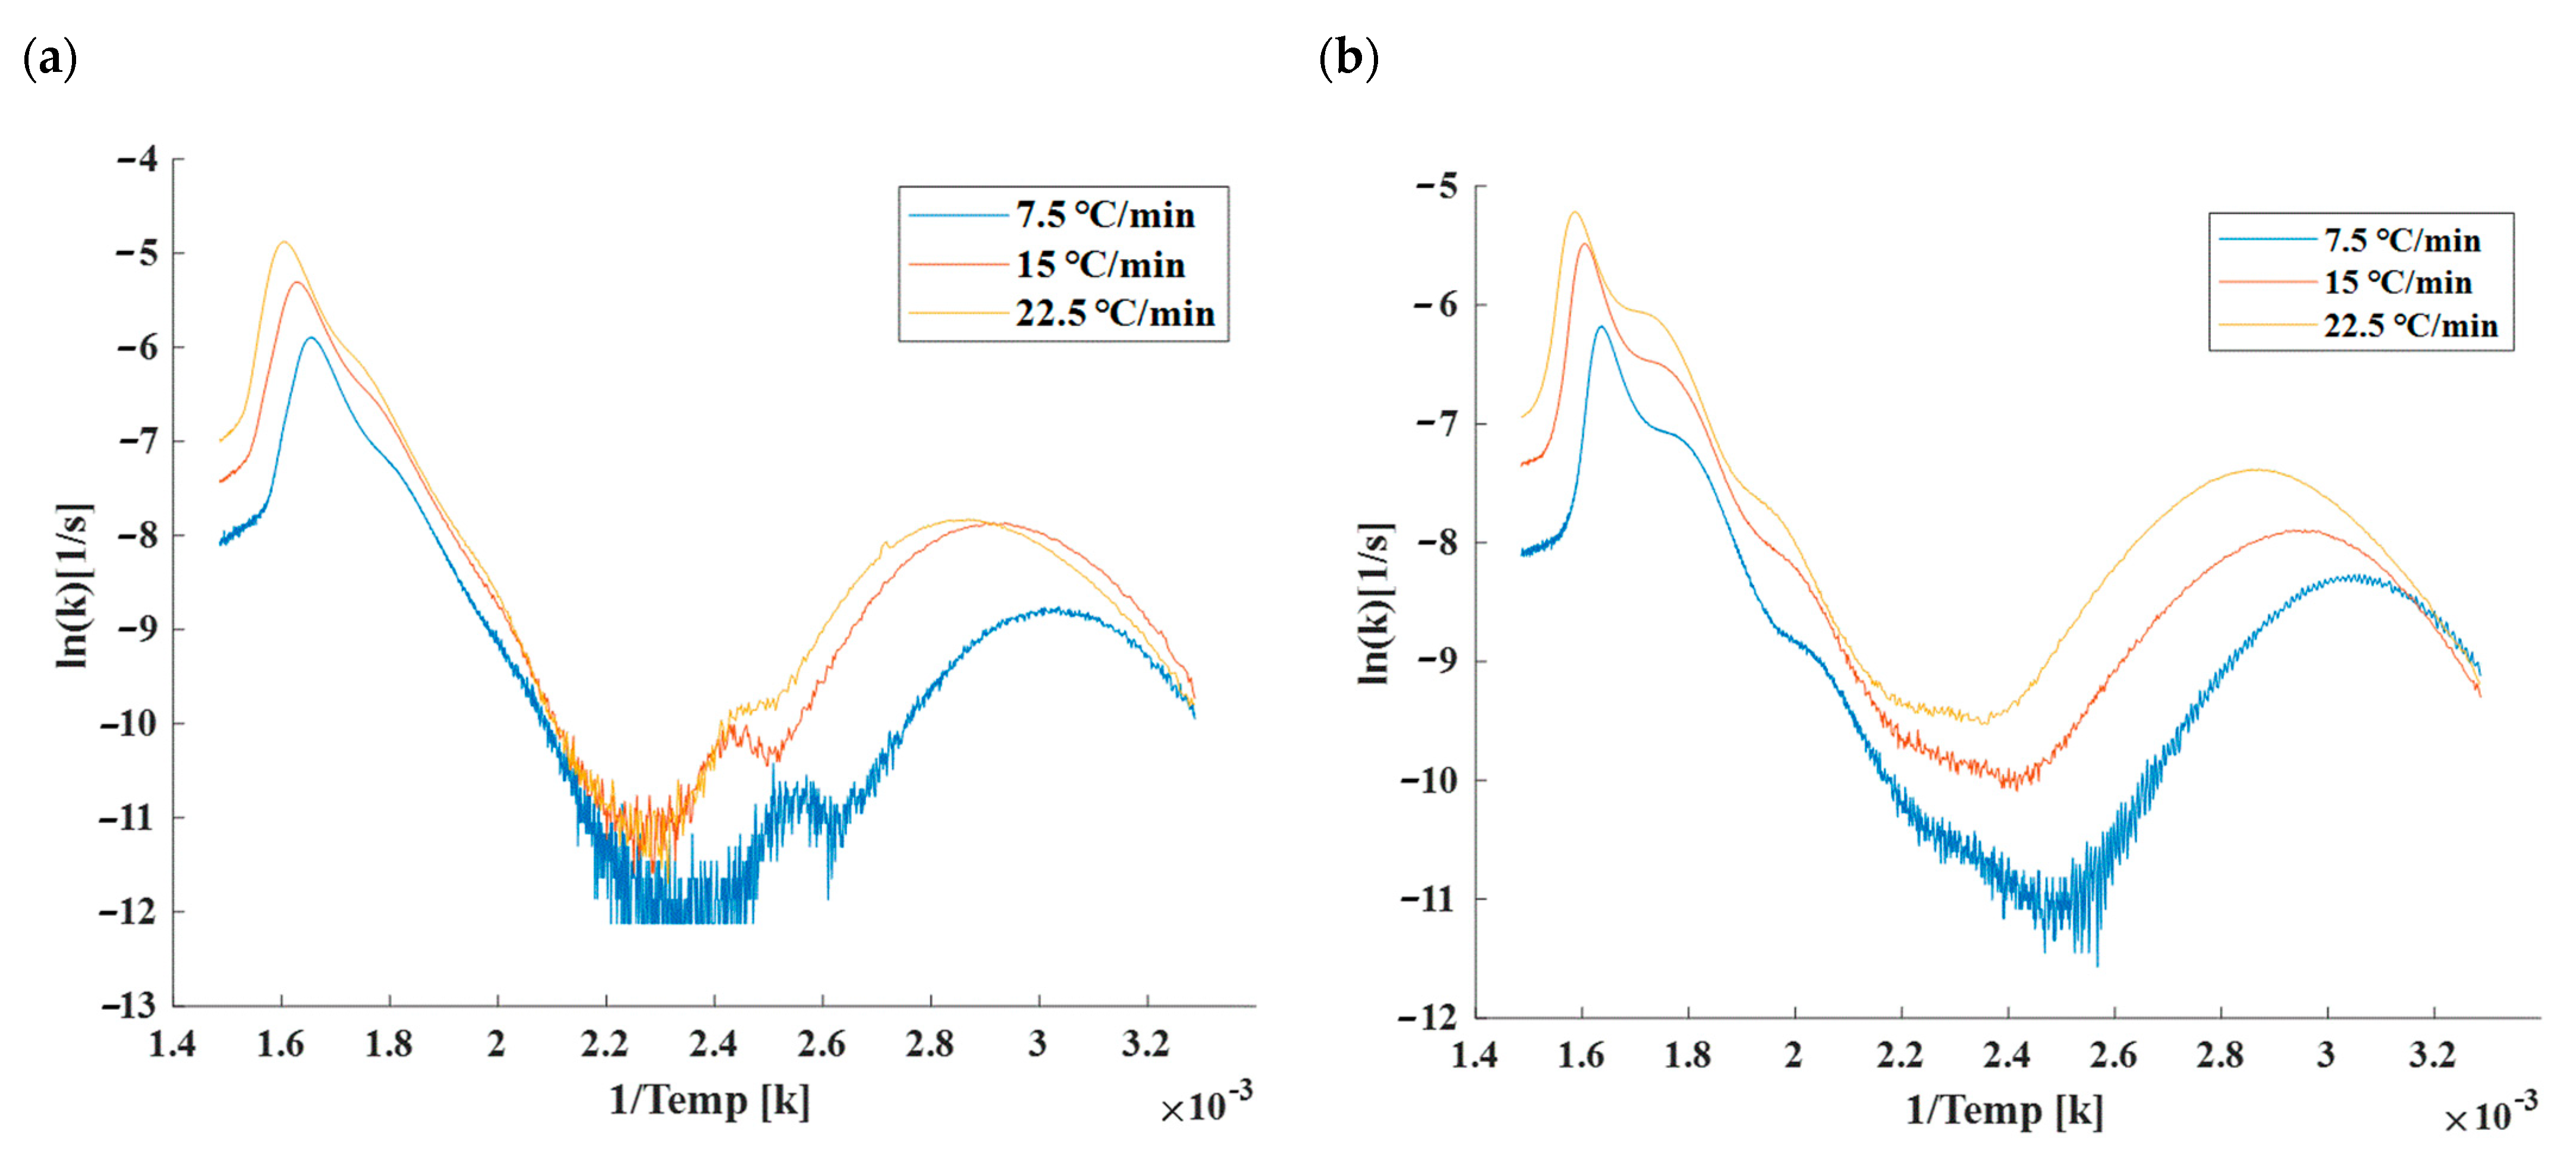
4.2. Thermogravimetric Analysis (TGA)

Table 4 shows TGA results. The peak temperature varies depending on the heating rate, and the mass reduction occurs at the peak temperature. The burnout temperature is defined as the temperature where the rate of mass loss falls below 1%/min [2,45,46]. Results of thermogravimetric analysis for grape branch and perilla are shown in Figure 8. The figures show different mass reductions at all heating rates below 350 °C. Biomass was exposed to more heat at the low heating rate since the attainment of the target temperature required more time. Consequently, more mass loss was observed. Figure 9 shows the Arrhenius plot of torrefaction process temperature based on TGA results. The observed scattering in the TGA graph might have been attributed to the fine movement of the scale in the analyzer during TGA analysis. In addition, since the sample was not in a uniform shape, the weight might have been affected by the movement of the center of the sample according to the temperature change. Rate constants differed owing to the differences in the heating rate at a constant temperature. To derive activation energy and frequency factor, temperature range was divided into the water-evaporating and the composition degradation parts, as shown in Figure 10. Table 5 and Table 6 list the activation energy, coefficient of determination (r2), and frequency factor based on the temperature range for grape branch and perilla, respectively. Based on the TGA results, the 0–200 °C temperature range is where initial mass reduction occurs. Here, water-evaporation for the grape branch occurred within 130 °C, while water evaporation of perilla occurred below 140 °C, absorbing heat for the phase change between 140–200 °C with less mass reduction. Table 5 and Table 6 show that the activation energy and frequency factor of the samples increased in the first temperature range, which was divided into the temperature range, in which the coefficient of determination of activation energy and frequency factor was 0.9 or higher. This showed significant water reduction but changed to negative values under the second temperature range, in which the reaction rate decreased after water evaporation. The reason for the negative activation energy might have been attributed to the exothermic reaction of the constituents of the biomass appears more prominent than the endothermic reaction. Thereafter, the activation energy and frequency factor increased under the third temperature range, during which the reaction rate increased.

4.3. Torrefaction Mass Reduction and Comparison with Simulations

The simulation was derived through the summation of each node through Equation (11), and experimental results were compared, and the values for the grape branch and perilla are presented in Table 7 and Table 8, respectively. Under experimental conditions and different temperatures, mass reduction of grape branch and perilla ranged from 13.98% to 37.03% and from 10.69% to 34.36%, respectively. Meanwhile, simulated mass reductions ranged, from between 4.07% and 69.37% and from 5.93 to the maximum of 69.87%, respectively. Comparing the mass reduction values between the simulation and the experiment, the highest accuracy for the grape branch was obtained at the heating rate of 15 °C/min and a process temperature of 200 °C. For perilla, the heating rate was 7.5 °C/min, and the process temperature was 200 °C. Under these conditions, the root mean square error (RMSE) for the grape branch and perilla was 0.0356 and 0.0285, respectively. When Equation (16) was derived from Equations (14) and (15), in the case of grapes, the simulation result of 200 °C through 15 °C/min of heating rate showed higher accuracy than other heating rates. In addition, the error with the mass reduction amount of the 200 °C for 40 min process, which is the optimal process condition derived through the experiment, was 1.42%p. A large amount of heat transfer was required since the bulk density of grape branch was higher than that of perilla. In the case of perilla, the optimal condition through the experiment was derived at 230 °C for 30 min, with an error of approximately 1.5%p (at heating rate 7.5 °C/min) when compared with the simulation. Perilla has low bulk density and relatively lower moisture content than grape branch. Therefore, the mass loss was sufficiently reduced even with a low heat-transfer rate at a low heating rate. These results were judged to fall within the mass yield error range for each optimal condition (Figure 6a and Figure 7a). This also confirmed that an error occurred as a result of the simulation mass reduction derivation. An error occurred since the mass reduction was derived using the frequency factor and activation energy derived from the temperature range along the trend line (Figure 10), deriving the frequency factor and activation energy by dividing the temperature range in detail and then applying it to the simulation to reduce the error. In addition, through the developed model, it is possible to reduce the amount of waste by converting unused agricultural byproducts into an energy source.

5. Conclusions

In this study, to investigate the possibility of using agro-byproducts, specifically grape branch and perilla, as energy sources, a torrefaction process was used. Based on the experimental results, mass reduction of grape branch and perilla was 13.98–37.03% and 10.69–34.36%, respectively. Results of fuel properties analysis showed that range of the calorific value of grape branch and perilla was 19.46–22.77 and 10.69–21.77 MJ/kg, respectively. Although calorific value increased, energy yield decreased due to higher mass loss. Considering mass yield, energy yield and calorific value, the optimal condition of grape branch and perilla was 200 °C for 40 min and 230 °C for 30 min, respectively. Based on TGA, a mass reduction model during torrefaction was established and validated with experimental data. Fuel properties were observed using proximate analysis, elemental analysis, and measuring calorific value. Based on different heating rates, the rate constant was derived and applied to the mass reduction model, and experimental and simulation results were compared. RMSE of grape branch was 0.0356 under a heating rate of 15 °C/min at 200 °C and RMSE of perilla was 0.0285 under a heating rate 7.5 °C/min at 200 °C. Mass reduction differences between the simulation and experiment with grape branch under the heating rate 15 °C/min to 200 °C in 40 min and perilla at 7.5 °C/min to 230 °C in 30 min were 1.42%p and 1.51%p, respectively. The frequency factor and activation energy derived from the TGA results for each heating rate had an effect on the mass reduction due to the temperature change of grape and perilla. Studies using TGA at various heating rates and applying specific heat and thermal conductivity coefficient equations through various references to improve the accuracy of the simulation model are warranted in the future. Further research could be performed on not only forestry byproducts but also industrial wastes into fuel.

Author Contributions

Conception and design of study: S.-J.K., S.-Y.P. and D.-H.K.; acquisition of data: S.-J.K., S.-Y.P., L.-H.C. and C.-G.L.; analysis and/or interpretation of data: S.-J.K., S.-Y.P., L.-H.C., Y.-M.J. and K.-C.O.; drafting the manuscript: S.-J.K., S.-Y.P., K.-C.O., M.-J.K. and I.-S.J.; revising the manuscript critically for important intellectual content: S.-J.K., S.-Y.P., K.-C.O., Y.-M.J., L.-H.C., C.-G.L. and D.-H.K.; approval of the version of the manuscript to be published: S.-J.K., K.-C.O., S.-Y.P., Y.-M.J., L.-H.C., C.-G.L., M.-J.K., I.-S.J. and D.-H.K. All authors have read and agreed to the published version of the manuscript.

Funding

This work was supported by the National Research Foundation of Korea [grant number NRF-2016R1D1A3B04935457].

Institutional Review Board Statement

Not applicable.

Informed Consent Statement

Not applicable.

Data Availability Statement

Not applicable.

Conflicts of Interest

The authors declare no conflict of interest.

References

  1. Lee, J.P.; Park, S.C. Estimation of geographical and technical potential for biomass resources. New Renew. Energy 2016, 12, 53–58. [Google Scholar] [CrossRef]
  2. Oh, K.C.; Park, S.Y.; Kim, S.J.; Choi, Y.S.; Lee, C.G.; Cho, L.H.; Kim, D.H. Development and validation of mass reduction model to optimize torrefaction for agricultural byproduct biomass. Renew. Energy 2019, 139, 988–999. [Google Scholar] [CrossRef]
  3. Hamawand, I.; da Silva, W.; Seneweera, S.; Bundschuh, J. Value Proposition of Different Methods for Utilisation of Sugarcane Wastes. Energies 2021, 14, 5483. [Google Scholar] [CrossRef]
  4. D’Adamo, I.; Falcone, P.M.; Huisingh, D.; Morone, P. A circular economy model based on biomethane: What are the opportunities for the municipality of Rome and beyond? Renew. Energy 2021, 163, 1660–1672. [Google Scholar] [CrossRef]
  5. D’Adamo, I.; Falcone, P.M.; Morone, P. A New Socio-economic Indicator to Measure the Performance of Bioeconomy Sectors in Europe. Ecol. Econ. 2020, 176, 1–12. [Google Scholar] [CrossRef]
  6. De Toro, A.; Gunnarsson, C.; Jonsson, N.; Sundberg, M. Effects of Variable Weather Conditions on Baled Proportion of Varied Amounts of Harvestable Cereal Straw, Based on Simulations. Sustainability 2021, 13, 9449. [Google Scholar] [CrossRef]
  7. Holmgren, P.; Wagner, D.R.; Strandberg, A.; Molinder, R.; Wiinikka, H.; Umeki, K.; Broström, M. Size, shape, and density changes of biomass particles during rapid devolatilization. Fuel 2017, 206, 342–351. [Google Scholar] [CrossRef]
  8. Nonaka, H. Change of chemical composition during wood pelletization: Whole wood pellet as a raw material for biorefinery. J. Jpn. Inst. Energy 2014, 93, 1005–1009. [Google Scholar] [CrossRef] [Green Version]
  9. Basu, P. Biomass Gasification, Pyrolysis and Torrefaction: Practical Design and Theory; Academic Press: Cambridge, MA, USA, 2018. [Google Scholar]
  10. Granados, D.A.; Chejne, F.; Basu, P. A two dimensional model for torrefaction of large biomass particles. J. Anal. Appl. Pyrol. 2016, 120, 1–14. [Google Scholar] [CrossRef]
  11. Park, S.W.; Yang, J.K.; Baek, K.R. Fuel ratio and combustion characteristics of torrefied biomass. J. Korea Soc. Waste Manag. 2013, 30, 376–382. [Google Scholar] [CrossRef]
  12. Chansaem, P. Modeling and Optimal Design of Biomass Torrefaction Process. Ph.D. Thesis, The Graduate School of Seoul National University, Seoul, Korea, 2014. Available online: http://hdl.handle.net/10371/119714 (accessed on 30 August 2014).
  13. Tumuluru, J.S.; Sokhansanj, S.; Hess, J.R.; Wright, C.T.; Boardman, R.D. A review on biomass torrefaction process and product properties for energy applications. Ind. Biotechnol. 2011, 7, 384–401. [Google Scholar] [CrossRef] [Green Version]
  14. Pentananunt, R.; Rahman, A.M.; Bhattacharya, S.C. Upgrading of biomass by means of torrefaction. Energy 1990, 15, 1175–1179. [Google Scholar] [CrossRef]
  15. Li, J.; Brzdekiewicz, A.; Yang, W.; Blasiak, W. Co-firing based on biomass torrefaction in a pulverized coal boiler with aim of 100% fuel switching. Appl. Energy 2012, 99, 344–354. [Google Scholar] [CrossRef]
  16. Fisher, E.M.; Dupont, C.; Darvell, L.I.; Commandré, J.M.; Saddawi, A.; Jones, J.M.; Grateau, M.; Nocquet, T.; Salvador, S. Combustion and gasification characteristics of chars from raw and torrefied biomass. Bioresour. Technol. 2012, 119, 157–165. [Google Scholar] [CrossRef] [PubMed] [Green Version]
  17. Broström, M.; Nordin, A.; Pommer, L.; Branca, C.; Di Blasi, C. Influence of torrefaction on the devolatilization and oxidation kinetics of wood. J. Anal. Appl. Pyrol. 2012, 96, 100–109. [Google Scholar] [CrossRef]
  18. Berrueco, C.; Recari, J.; Güell, B.M.; Del Alamo, G. Pressurized gasification of torrefied woody biomass in a lab scale fluidized bed. Energy 2014, 70, 68–78. [Google Scholar] [CrossRef]
  19. Deng, J.; Wang, G.J.; Kuang, J.H.; Zhang, Y.L.; Luo, Y.H. Pretreatment of agricultural residues for co-gasification via torrefaction. J. Anal. Appl. Pyrol. 2009, 86, 331–337. [Google Scholar] [CrossRef]
  20. Pittman, C.U., Jr.; Mohan, D.; Eseyin, A.; Li, Q.; Ingram, L.; Hassan, E.B.; Mitchell, B.; Guo, H.; Steele, P.H. Characterization of bio-oils produced from fast pyrolysis of corn stalks in an auger reactor. Energy Fuels 2012, 26, 3816–3825. [Google Scholar] [CrossRef]
  21. Zheng, A.; Zhao, Z.; Chang, S.; Huang, Z.; Wang, X.; He, F.; Li, H. Effect of torrefaction on structure and fast pyrolysis behavior of corncobs. Bioresour. Technol. 2013, 128, 370–377. [Google Scholar] [CrossRef] [PubMed]
  22. Granados, D.A.; Velásquez, H.I.; Chejne, F. Energetic and exergetic evaluation of residual biomass in a torrefaction process. Energy 2014, 74, 181–189. [Google Scholar] [CrossRef]
  23. Bates, R.B.; Ghoniem, A.F. Biomass torrefaction: Modeling of volatile and solid product evolution kinetics. Bioresour. Technol. 2012, 124, 46–49. [Google Scholar] [CrossRef]
  24. Bates, R.B.; Ghoniem, A.F. Modeling kinetics-transport interactions during biomass torrefaction: The effects of temperature, particle size, and moisture content. Fuel 2014, 137, 216–229. [Google Scholar] [CrossRef]
  25. Sullivan, A.L.; Ball, R. Thermal decomposition and combustion chemistry of cellulosic biomass. Atmos. Environ. 2012, 47, 133–141. [Google Scholar] [CrossRef]
  26. Van der Stelt, M.J.C.; Gerhauser, H.; Kiel, J.H.A.; Ptasinski, K.J. Biomass upgrading by torrefaction for the production of biofuels: A review. Biomass Bioenergy 2011, 35, 3748–3762. [Google Scholar] [CrossRef]
  27. Sarvaramini, A.; Assima, G.P.; Larachi, F. Dry torrefaction of biomass–Torrefied products and torrefaction kinetics using the distributed activation energy model. Chem. Eng. J. 2013, 229, 498–507. [Google Scholar] [CrossRef]
  28. Hankalin, V.; Ahonen, T.; Raiko, R. On thermal properties of a pyrolysing wood particle. Finn.-Swed. Flame Days 2009, 16, 1–16. [Google Scholar]
  29. Grønli, M.G. A Theoretical and Experimental Study of the Thermal Degradation of Biomass. 1996. Available online: https://www.osti.gov/etdeweb/servlets/purl/642467 (accessed on 10 August 2021).
  30. Koch, P. Specific heat of ovendry spruce pine wood and bark. Wood Sci. 1968, 1, 203–214. [Google Scholar]
  31. Gupta, M.; Yang, J.; Roy, C. Specific heat and thermal conductivity of softwood bark and softwood char particles. Fuel 2003, 82, 919–927. [Google Scholar] [CrossRef]
  32. Spearpoint, M.J.; Quintiere, J.G. Predicting the burning of wood using an integral model. Combust. Flame 2000, 123, 308–325. [Google Scholar] [CrossRef]
  33. Park, S.W.; Jang, C.H.; Baek, K.R.; Yang, J.K. Torrefaction and low-temperature carbonization of woody biomass: Evaluation of fuel characteristics of the products. Energy 2012, 45, 676–685. [Google Scholar] [CrossRef]
  34. Kök, M.V.; Pamir, M.R. Comparative pyrolysis and combustion kinetics of oil shales. J. Anal. Appl. Pyrol. 2000, 55, 185–194. [Google Scholar] [CrossRef]
  35. Martín-Lara, M.A.; Blázquez, G.; Zamora, M.C.; Calero, M. Kinetic modelling of torrefaction of olive tree pruning. Appl. Therm. Eng. 2017, 113, 1410–1418. [Google Scholar] [CrossRef]
  36. Kang, S.H.; Ryu, J.H.; Park, S.N.; Byun, Y.S.; Seo, S.J.; Yun, Y.S.; Lee, J.W.; Kim, Y.J.; Kim, J.H.; Park, S.R. Kinetic studies of pyrolysis and Char-CO2 gasification on low rank coals. Korean Chem Eng. Res. 2011, 49, 114–119. [Google Scholar] [CrossRef]
  37. Tzou, D.Y. On the wave theory in heat conduction. J. Heat Trans. 1994, 116, 526–535. [Google Scholar]
  38. Prins, M.J.; Ptasinski, K.J.; Janssen, F.J. Torrefaction of wood: Part 1. Weight loss kinetics. J. Anal. Appl. Pyrol. 2006, 77, 28–34. [Google Scholar] [CrossRef]
  39. Prins, M.J.; Ptasinski, K.J.; Janssen, F.J. Torrefaction of wood: Part 2. Analysis of products. J. Anal. Appl. Pyrol. 2006, 77, 35–40. [Google Scholar] [CrossRef]
  40. Bach, Q.V.; Chen, W.H.; Chu, Y.S.; Skreiberg, Ø. Predictions of biochar yield and elemental composition during torrefaction of forest residues. Bioresour. Technol. 2016, 215, 239–246. [Google Scholar] [CrossRef]
  41. Ozisik, M.N. Heat Transfer: A Basic Approach; McGraw-Hill: New York, NY, USA, 1985. [Google Scholar]
  42. Kreith, F.; Black, W.Z. Basic Heat Transfer; Harper & Row: New York, NY, USA, 1980. [Google Scholar]
  43. Kaviany, M. Principles of Heat Transfer in Porous Media; Springer Science & Business Media: Berlin/Heidelberg, Germany, 2012. [Google Scholar]
  44. Grieco, E.; Baldi, G. Analysis and modelling of wood pyrolysis. Chem. Eng. Sci. 2011, 66, 650–660. [Google Scholar] [CrossRef]
  45. El-Sayed, S.A.; Mostafa, M.E. Pyrolysis characteristics and kinetic parameters determination of biomass fuel powders by differential thermal gravimetric analysis (TGA/DTG). Energy Convers. Manag. 2014, 85, 1–8. [Google Scholar] [CrossRef]
  46. Lu, J.J.; Chen, W.H. Investigation on the ignition and burnout temperatures of bamboo and sugarcane bagasse by thermogravimetric analysis. Appl. Energy 2015, 160, 49–57. [Google Scholar] [CrossRef]
Figure 1. Estimation of geographical and technical potential of biomass resources [1].
Energies 14 06125 g001
Figure 2. Prototype capsule.
Energies 14 06125 g002
Figure 3. Finite element analysis to predict each node temperature in prototype capsule.
Energies 14 06125 g003
Figure 4. Thermochemical conversion of biomass [2].
Energies 14 06125 g004
Figure 5. Van Krevelen diagram of torrefied grape and perilla.
Energies 14 06125 g005
Figure 6. Grape mass and energy yields and energy density according to torrefaction process time and temperature. (a) At 200 °C, (b) at 230 °C, and (c) at 270 °C.
Energies 14 06125 g006aEnergies 14 06125 g006b
Figure 7. Perilla mass and energy yields and energy density according to torrefaction process time and temperature. (a) At 200 °C, (b) at 230 °C, and (c) at 270 °C.
Energies 14 06125 g007
Figure 8. Biomass reduction curves for grape branch (a) and perilla (b) at various heating rates.
Energies 14 06125 g008
Figure 9. Arrhenius plot of TGA data measured at different heating rates of grape branch (a) and perilla (b).
Energies 14 06125 g009
Figure 10. Regression lines of characteristic temperature for grape branch (a) and perilla (b) at a heating rate of 7.5 °C/min.
Energies 14 06125 g010
Table 1. Raw sample properties of Grape and Perilla.
Bulk Density
(kg/m3)
Higher Heating Value
(MJ/kg)
Proximate Analysis (%)Element Analysis (%)
MoistureAshVolatileFixed CarbonCHNO
Grape29019.111.43.55769.0544.416.070.9740.2
Perilla15018.97.775.8371.215.2141.195.681.1531.49
Table 2. Heating value of torrefied grape and perilla.
Grape (MJ/kg)Perilla (MJ/kg)
200 °C230 °C270 °C200 °C230 °C270 °C
20 min19.4619.5621.2719.0619.2720.95
30 min19.4620.3621.9019.1019.6521.59
40 min19.5120.7522.7719.1419.9521.77
Table 3. Energy yield of torrefied grape and perilla.
Grape (%) Perilla (%)
200 °C230 °C270 °C200 °C230 °C270 °C
20 min87.886.376.590.587.580.8
30 min87.285.074.189.586.579.3
40 min86.784.075.188.283.376.0
Table 4. Thermogravimetric analysis results.
MaterialHeating Rate
(°C/min)
Experiment Time (min)Peak Temperature (°C)Burnout Temperature
(°C)
Purge Gas
(mL/min)
Particle Size
(mm)
Perilla7.5102.9337.0370.0N2 (100)<0.154
1552.2350.4390.0
22.534.7357.0432.0
Grape7.5102.9331.5363.3
1552.2341.0380.5
22.534.7349.5402.5
Table 5. Frequency factor and activation energy of grape branch from TGA results.
7.5 °C/minTemperature range (°C)30–5565–130130–350
A (L/s)1.99 × 1022.14 × 10−115.72 × 10³
Ea (L/Jmol)3.8 × 104−4.39 × 1047.38 × 104
r20.9440.9180.972
15 °C/minTemperature range (°C)30–7070–140140–350
A (L/s)412.081.88 × 10−113.01 × 10⁴
Ea (L/Jmol)3.8892 × 104−4.89 × 1047.95 × 104
r20.9240.9550.993
22.5 °C/minTemperature range (°C)30–7575–165165–350
A (L/s)1.16 × 1032.19 × 10−111.57 × 10³
Ea (L/Jmol)4.22 × 104−4.96 × 1046.55 × 104
r20.9560.9440.903
Table 6. Frequency factor and activation energy of perilla from TGA results.
7.5 °C/minTemperature range (°C)30–5555–120130–350
A (L/s)8.1561.07 × 10−112.30 × 10
Ea (L/Jmol)2.801 × 104−4.746 × 1044.89 × 104
r20.9340.9500.973
15 °C/minTemperature range (°C)30–6060–140140–350
A (L/s)9.63 × 1022.15 × 10−94.83 × 10²
Ea (L/Jmol)4.060 × 104−3.457 × 1045.00 × 104
r20.9750.9500.978
22.5 °C/minTemperature range (°C)30–7575–150150–350
A (L/s)2.958 × 1021.020 × 10−98.790 × 10
Ea (L/Jmol)3.714 × 103−3.952 × 1045.17 × 104
r20.9670.9720.978
Table 7. Grape mass reduction comparison.
Temp.
(°C)
Time
(min)
ExperimentSimulation Simulation Simulation
7.5 °C/min 15 °C/min 22.5 °C/min
Mass Reduction (%)Mass Reduction (%)r2RMSEMass Reduction (%)r2RMSEMass Reduction (%)r2RMSE
2002013.984.070.9960.08478.300.9960.03568.440.9960.0604
3014.576.2512.6112.93
4015.268.3516.6817.17
2302017.5211.300.9970.041119.260.9930.092920.480.9950.1109
3020.4116.9628.3430.25
4022.8422.7036.7339.06
2702031.2828.00.9640.095639.480.9760.205743.120.9810.2408
3035.4841.5054.9859.01
4037.0352.1065.7069.37
Table 8. Perilla mass reduction comparison.
Temp.
(°C)
Time
(min)
ExperimentSimulation Simulation Simulation
7.5 °C/min 15 °C/min 22.5 °C/min
Mass Reduction (%)Mass Reduction (%)r2RMSEMass Reduction (%)r2RMSEMass Reduction (%)r2RMSE
2002010.695.930.8580.02857.600.8540.03689.860.8510.0964
3011.079.9513.0816.95
4013.3114.0218.5123.87
2302014.6110.800.9790.037914.460.9750.091018.950.9690.1604
3017.1618.6725.032.27
4021.4626.5935.1444.36
2702027.4320.120.9850.086627.290.9770.167035.420.9630.2578
3030.4834.6445.5256.36
4034.3646.7859.0769.87
Publisher’s Note: MDPI stays neutral with regard to jurisdictional claims in published maps and institutional affiliations.

