Article

Evaluation of Reservoir Quality and Forecasted Production Variability along a Multi-Fractured Horizontal Well. Part 1: Reservoir Characterization

1
Department of Geosciences, University of Calgary, Calgary, AB T2N 1N4, Canada
2
Geological Survey of Brazil, São Paulo 01304-010, Brazil
3
Department of Chemical and Petroleum Engineering, University of Calgary, Calgary, AB T2N 1N4, Canada
*
Author to whom correspondence should be addressed.
Energies 2021, 14(19), 6154; https://doi.org/10.3390/en14196154
Submission received: 21 August 2021 / Revised: 15 September 2021 / Accepted: 16 September 2021 / Published: 27 September 2021
(This article belongs to the Special Issue Characterization of Unconventional Petroleum Reservoirs)

Abstract

:
Completion design for horizontal wells is typically performed using a geometric approach where the fracturing stages are evenly distributed along the lateral length of the well. However, this approach ignores the intrinsic vertical and horizontal heterogeneity of unconventional reservoirs, resulting in uneven production from hydraulic fracturing stages. An alternative approach is to selectively complete intervals with similar and superior reservoir quality (RQ) and completion quality (CQ), potentially leading to improved development efficiency. In the current study, along-well reservoir characterization is performed using data from a horizontal well completed in the Montney Formation in western Canada. Log-derived petrophysical and geomechanical properties, and laboratory analyses performed on drill cuttings, are integrated for the purpose of evaluating RQ and CQ variability along the well. For RQ, cutoffs were applied to the porosity (>4%), permeability (>0.0018 mD), and water saturation (<20%), whereas, for CQ, cutoffs were applied to rock strength (<160 Mpa), Young’s Modulus (60–65 GPa), and Poisson’s ratio (<0.26). Based on the observed heterogeneity in reservoir properties, the lateral length of the well can be subdivided into nine segments. Superior RQ and CQ intervals were found to be associated with predominantly (massive) porous siltstone facies; these intervals are regarded as the primary targets for stimulation. In contrast, relatively inferior RQ and CQ intervals were found to be associated with either dolomite-cemented facies or laminated siltstones. The methods developed and used in this study could be beneficial to Montney operators who aim to better predict and target sweet spots along horizontal wells; the approach could also be used in other unconventional plays.

1. Introduction

The current approach for the economic development of ultra-low permeability (“unconventional”) reservoirs is through the application of long horizontal wells completed in multiple hydraulic fracturing stages (multi-fractured horizontal wells, MFHWs). The purpose of hydraulic fracturing is to enhance well production by maximizing the surface area between the high conductivity fracture and the low-permeability reservoir. MFHWs are, therefore, often designed to maximize the number of hydraulic fractures created. Typically, in MFHWs, fracturing stages are uniformly or geometrically distributed along the lateral length of the well. However, several studies utilizing production logs have shown that not all fracturing stages contribute equally to production and that a minority of perforation clusters contribute to most of the production (e.g., [1,2,3,4]). Those studies attributed variability in perforation cluster production to the heterogeneity in reservoir properties along the horizontal well. Therefore, one strategy for improving development efficiency is to only target those intervals along the well that contribute most to production; in order to achieve this, reservoir quality along the lateral section of the well must be quantified, and the location and design of stages customized to account for reservoir changes along the wellbore.
In the last decade, considerable attention has been focused on non-geometric or engineered-completion designs, and numerous case studies (not from the Montney) have been published with promising results. In a pioneering study, Cipolla et al. [5] developed algorithms to optimize perforation design wherein fracturing stages are placed in intervals with both good reservoir quality (RQ) and completion quality (CQ). In the same study, Cipolla et al. [5] analyzed production logs from approximately 100 horizontal wells in six North American shale basins and observed that the top 40% of stages contribute to 60% of the total production. Walker et al. [6] subdivided the lateral length of wells into segments that reflect lithological variations, with the main goal of placing frac stages in rocks with similar minimum in-situ stress. Those authors compared the productivity of engineered versus non-engineered wells from the same pad and concluded that the wells with fully-engineered completion designs exhibited an average increase in production of almost 100% relative to those with non-engineered designs. Ajisafe et al. [7] calculated reservoir quality (RQ) and completion quality (CQ) from well logs to design engineered completions, resulting in a relatively uniform contribution to production from perforation clusters when compared to geometric completion designs. To overcome the absence of logs in horizontal wells, Logan [8] proposed a workflow that leverages drilling data to engineer completion designs; the variability in rock strength—interpreted from drilling data—was found to be closely related to the productivity of the wells.
Very few studies have used drill cuttings analysis to assist with engineering completion designs. Buller et al. [9] integrated results from drill cuttings analyses, including X-ray fluorescence (XRF), scanning electron microscopy (SEM), and programmed pyrolysis with a through-casing pulsed neutron log (PNL), to optimize the completion design by placing stages in similar-rock intervals. They observed significant differences in proppant placement and treating pressures between stages, proving that rocks with varying properties were being treated. More recently, Stolyarrov et al. [10] integrated drill cuttings analysis with mud logs and drilling data to characterize the reservoir along the lateral and to optimize fracturing treatment design. Those authors compared the production from geometrically-stimulated wells against wells with an engineered optimization plan; they observed a 46% increase in performance associated with the engineered-completion wells relative to the geometrically-completed wells. Additionally, fracturing for the engineered completions was performed 70% faster, notably eliminating screen-outs that affected operations in one of the geometrically-designed wells.
Although several studies have investigated engineered-completion designs, such studies have yet to be extended to unconventional reservoirs in Canada (e.g., Montney Formation). Further, recent advances in drill cuttings analysis for petrophysical, geomechanical, and geochemical properties (e.g., [11,12,13]), and drilling data analysis for rock mechanical properties (e.g., [14,15]), could result in better along-well characterization for use in engineered-completion designs. Importantly, very few drill cuttings-based studies have been conducted in the Montney Formation, particularly from horizontal wells (e.g., [11,16]). Therefore, the main objective of this two-part study is to develop and demonstrate a new engineered-completions approach applied to a well drilled in a low-permeability reservoir in western Canada. The novelty of Part 1 of this study (current paper) is associated with the integration of reservoir properties derived from well logs, drilling data, and drill cuttings to target sweet spots for hydraulic fracture stimulation. The integrated data in the form of reservoir and completion quality logs are then used to populate a semi-analytical model to forecast the performance of individual stages (Part 2 of this study [17]).
In this study, along-well petrophysical (porosity, permeability, and water saturation) and geomechanical properties (rock strength, Young’s Modulus, and Poisson’s ratio) are calculated using wireline logs and calibrated to core data. Additionally, a drilling-derived Mechanical Specific Energy (MSE) log is incorporated into the along-well characterization. An important aspect of the current study is the demonstration of recent advances in drill cuttings analysis as a powerful tool to further explain the variations in reservoir properties calculated from well logs. Laboratory analyses conducted on the drill cuttings include X-ray diffraction (XRD) mineralogy, XRF elemental composition, grain density, specific surface area, and permeability (to gas). Finally, a rock type classification is presented using SEM images of drill cuttings mounted in thin sections.
Data from a horizontal well completed in a low-permeability reservoir within the Montney Formation are used in this study. The Lower Triassic Montney Formation constitutes one of the most prolific petroleum reservoirs in the Western Canada Sedimentary Basin (WCSB), encompassing both oil and gas unconventional resources. This formation covers an extensive area, stretching from Alberta to northern British Columbia. The Montney contains an estimated 449 Tcf of gas in place, 14,521 million barrels of NGL, and 1125 million barrels of oil [18]. The thickness of this unit (up to 350 m) makes it possible to develop multiple vertical horizons with horizontal wells. Since 2008, more than 4000 MFHWs have been drilled and completed in the Montney. For a general overview of the geologic setting and characteristics of the Montney Formation in the study area, we refer the reader to a few key papers [19,20].

2. Materials and Methods

The dataset used for this study includes wireline logs, drilling-derived properties, and drill cutting samples collected along the lateral section of a horizontal well targeting the Middle Member of the Montney Formation. The lateral section of the subject well was directionally drilled from 3111 m to the total depth of 5635 m using a toe-up configuration (Figure 1).
An oil-based mud was used to drill to the intermediate casing point, while a water-based mud was used to drill out the lateral section. Three polycrystalline diamond compact (PDC) drill bits were used to drill the lateral section of the study well. In total, 50 hydraulic fracturing stages were completed using the plug-and-perf technique with slickwater and 40/70 mesh size proppant.
The available drill cuttings comprise 50 samples collected in Isojars® at a frequency of 50 m (Figure 1). Open-hole well logs include gamma ray, resistivity, bulk density, and sonic. As a reference for comparison with laboratory results from the drill cuttings, laboratory analyses from a nearby vertical core are incorporated into this study, including grain density, porosity, permeability, water saturation, and XRD (Table 1). The reference core was retrieved from a vertical well drilled from the same pad, and it covers the entire Montney Formation (Figure 2). To identify the approximate interval intersected by the horizontal well, the gamma ray and bulk density logs from the vertical and horizontal wells were correlated, aided by geosteering plots.

2.1. Wireline- and Drilling-Derived Rock Properties

2.1.1. Petrophysical Properties

Porosity ( ϕ ) was calculated from the bulk density log, using the following equation [21]:
ϕ = ρ m a ρ b /   ρ m a ρ f
where ρ m a is the average grain density measured for the drill cutting samples (2.71 g/cm3), ρ b is the formation bulk density in g/cm3, and ρ f is the density of the fluids occupying the porosity, which is assumed to be 1.0 g/cm3.
Permeability and water saturation were calculated using Equations (2)–(4), which were developed based on empirical relationships derived from core and log data exclusively from the Montney Formation [22].
k a b s = 0.00027 × ϕ 2.71913
where k a b s is the absolute permeability (mD), and ϕ is porosity (%)
BVW = 6.7627 × Rt 0.507
where BVW is bulk volume water (%), and Rt is deep resistivity (Ω·m)
S w = 100 × BVW / ϕ
where S w is water saturation (%), BVW is bulk volume water (%), and ϕ is porosity (%).

2.1.2. Geomechanical Properties

The dynamic elastic constants, Poison’s ratio ( PR ) and Young’s Modulus ( YM ), were determined using the bulk density log ( ρ b ), and shear ( DTS ) and compressional ( DTC ) sonic logs (μs/ft), and the following equations [23]
PR = 1 / 2 × DTS / DTC 2 1 / DTS / DTC 2 1  
YM = 2 × ρ b × 1 + PR / DTC 2
The unconfined compressive strength ( UCS ) was calculated using the compressional ( DTC ) sonic log through the McNally [24] correlation, where UCS is in MPa and DTC is in μs/ft
UCS = 1200   e 0.0361 × DTC
The McNally equation is calibrated against several hundred core samples for which the lithology is mostly laminated siltstones and sandstones [24]. Considering that the overall lithology of the Montney Formation is siltstone, the McNally equation is, therefore, considered appropriate for this study.
Additionally, the mechanical specific energy (MSE) log was calculated using high resolution (10 s) drilling data, following Equation (8) [15]:
MSE = WOB Area bit + 120 × π ×   RPM bit × T bit Area bit × ROP + HSE
where WOB is weight on bit in lb, Area bit is the cross-sectional area of the bit in in2, RPM bit is the rotary speed of bit, T bit is the torque available at the bit in lbf-ft, ROP is the rate of penetration in ft/h, and HSE is the hydraulic specific energy in psi. The WOB and T bit are corrected for energy loss (i.e., friction and vibration) as well as for additional energy from the downhole mud motor. The RPM bit is corrected for the mud motor. The methodology and results for the calculated MSE are outlined by [15].
After calculating the petrophysical and geomechanical properties using well logs, the continuous curves were smoothed by applying a Gaussian smoothing filter over a sliding window of five meters. Then, the log-calculated properties were averaged for the approximate length of each frac stage for use in Part 2 of this study [17].

2.2. Laboratory Characterization of Drill Cuttings

In preparation for analysis, the drill cutting samples were washed three times with deionized water using an agitator (vortex) for one minute each time to remove excess of drilling mud and mud fines. Subsequently, the samples were oven-dried for 48 h at 60 °C to obtain a constant weight (±1 mg), after which they were sieved through 20, 35, and 60 US mesh sizes. The laboratory analyses were performed on the 35–60 mesh fraction (0.25–0.5 mm) as it contained the greatest amount of material (>30 g). Post-sieving, the 35–60 mesh samples were examined under the stereo microscope to: (1) corroborate the effectiveness of the cleaning procedure (e.g., cleanliness of cuttings surfaces); (2) manually remove mud contaminants such as wood fiber, metal shavings, and polymer beads; and (3) describe the nature and relative abundance of rock components (e.g., texture, lithology, etc.).
XRD bulk mineralogy analyses were performed on ten samples using a Rigaku Ultima IV diffractometer. XRD patterns were collected at a range of 2-theta angles from 3° to 70°. XRD patterns were processed and analyzed using the PDXL software [25] and a powder diffraction international database ICDD PDF-4. The elemental composition of 24 samples was analyzed using an Olympus INNOV-X DELTA Premium handheld XRF analyzer. Each sample was analyzed using two beams: one beam at 10 kV to detect major elements and the other beam at 40 kV to detect trace elements.
Standard thin sections for 14 drill cutting samples were analyzed using an FEI Quanta FEG 250 environmental field emission scanning electron microscope (E-FESEM). The microscope is fitted with secondary and backscattered electron (BSE) detectors and energy-dispersive X-ray spectroscopy (EDX) detectors. The entire thin section was imaged through the automated collection of consecutive tiles (500 nm per pixel) using the Maps® software from FEI. From the SEM images, the individual rock chips were manually classified into five rock types based on visual characteristics such as grain size, pyrite content, and porosity. Rock types consist of: (1) organic-rich mudstone; (2) heterolithic dolomitic siltstone; (3) dolomite-cemented siltstone; (4) porous dolomitic siltstone, and (5) chips with evidence of drill bit metamorphism. Further details of the image processing and classification can be found in Becerra et al. [26].
The drill cuttings grain density was measured using a Micromeritics AccuPyc II 1340 Helium gas pycnometer. About 10 g of drill cuttings sample were tested. The experiment was repeated three times for each sample and then averaged. Low-pressure gas adsorption measurements with nitrogen (N2) were conducted using a Micromeritics 3-Flex analyzer. Two to three grams of cuttings samples were analyzed with N2 to investigate pores in the range of 2 to 200 nm. Samples were first degassed in a temperature-controlled vacuum at 60 °C overnight to remove any residual fluids in the sample. In addition, the samples underwent an in-situ degassing (1.3 kPa) procedure for 2 h at 60 °C to maintain equilibrium in the system. The N2 isotherms were collected at 77 K (−196 °C). Using the N2 adsorption data, the surface area was interpreted with the multi-point BET (Brunauer–Emmett–Teller) model [27]. Crushed-rock permeability was measured using a Core Laboratories SMP-200 shale matrix permeameter. The sample holder was filled with 25–30 g of sample. Following procedures by Core Laboratories [28], helium at an initial pressure of 200 psig was expanded into the sample cell. Pressure–time data were recorded for 2000 s following the release of gas into the sample cell, after which permeability values were obtained through curve-fitting using the pressure-decay software provided with the SMP-200 device. Five replicate runs were performed on each sample to ensure repeatability.

3. Results

3.1. Log- and Drilling-Derived Rock Properties

Petrophysical (porosity, permeability, and water saturation) and geomechanical properties (UCS, YM, and PR) calculated using open-hole well logs are plotted in Figure 3. Referring to geomechanical properties across the entire lateral length, the UCS ranges from 147 to 180 MPa, the YM ranges from 57 to 71 GPa, and the PR ranges from 0.22 to 0.28 (Figure 3). Overall, these log-calculated geomechanical properties align with previous laboratory and log-based studies for the Montney Formation in the study area [29].
As for petrophysical properties along the lateral, porosity ranges from 1.5 to 7.5%, water saturation ranges from 8 to 21%, and permeability ranges between 0.00025 and 0.011 mD (Figure 3). These log-calculated values are consistent with core-measured porosity, water saturation, and permeability values from the vertical reference well (Table 1). Additionally, these values appear consistent with publicly available laboratory analyses for the Montney within the study area [30]. The mechanical specific energy (MSE) values range from 600 to 2300 MPa and are in good agreement with the log-derived UCS curve (Figure 3). Theoretically, this relationship is anticipated as the energy required to break up a given rock volume is determined by its compressive strength [31]. However, sometimes MSE can differ from UCS because of variable drilling bit efficiencies along the well [32].
In an attempt to investigate the lateral heterogeneity of the Montney Formation in the studied horizontal well, the lateral section is subdivided into nine segments such that each segment contains rocks of similar petrophysical and geomechanical properties, also known as “similar-rocks.” Detailed descriptions and interpretations of each segment are presented in the Discussion section of this paper after integrating with laboratory results from the drill cuttings.

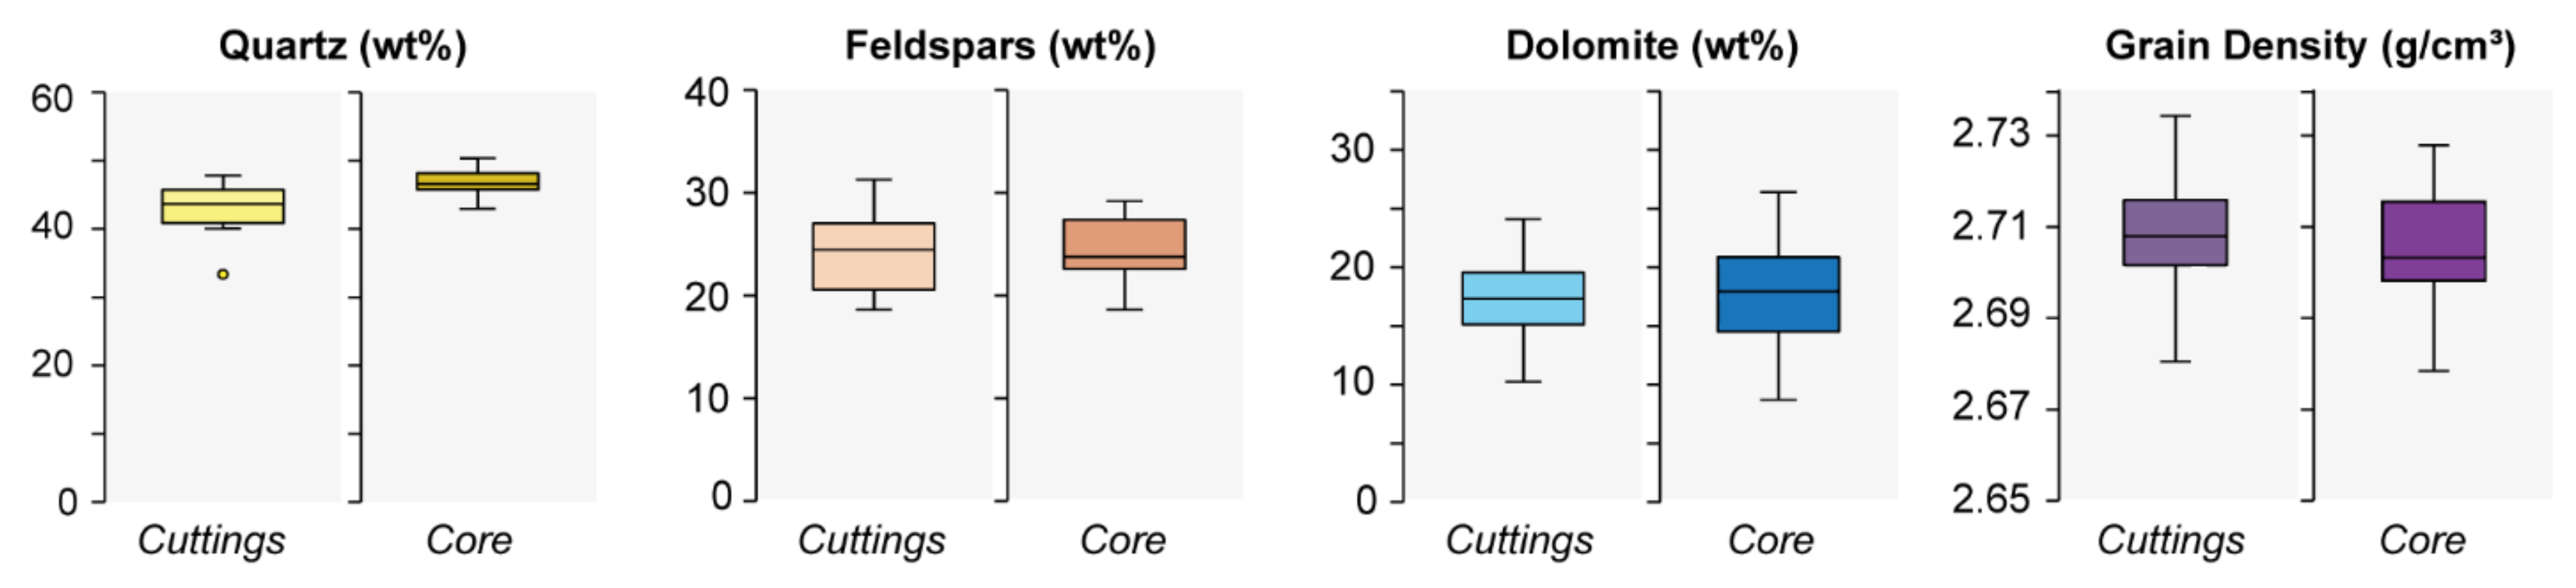
3.2. Reservoir Characteristics from Drill Cuttings

After the sample preparation step, only 24 out of the 50 drill cutting samples were suitable for laboratory analyses (Figure 1). Despite meticulously removing most contaminants (e.g., wood fiber, metal shavings, and polymer beads) using tweezers and a stereo microscope, the presence of contaminants in some instances exceeded the amount of rock chips, therefore leading to disposal of several samples (Figure 1). Remarkably, there is a particular depth interval (4550–5150 m) where 13 contiguous samples were full of polymer beads and therefore could not be used for any laboratory analysis (Figure 1).
XRD analyses performed on the drill cutting samples suggest that the rocks are composed of quartz (33–48%), feldspars (19–31%), dolomite (13–26%), illite/mica (8–24%), and pyrite (1.1–3.7%) (Figure 4). Subordinate minerals include apatite, zircon, and chlorite, which can be observed in the SEM-EDX images but only in trace amounts (<1%) (Figure 5). Overall, the mineral composition estimated from the cuttings samples is consistent with XRD data from the vertical reference well (Figure 6; Table 1). In addition to mineralogy, the elemental composition (XRF) was measured on a more extensive set of 24 samples (Figure 4). Three elemental proxies were selected based on good positive correlations of XRD versus XRF data for ten cutting samples (Figure 7). Calcium plus magnesium (Ca+Mg) can be used as a proxy for dolomite, the silicon to aluminum ratio (Si/Al) for quartz, and iron plus sulfur (Fe+S) for pyrite content (Figure 7).
To describe the lithology and rock fabric of the drill cuttings, 14 thin sections were analyzed. The entire thin section was imaged under the SEM, and approximately 1000 rock chips in each thin section were classified into five categories: organic-rich mudstone, heterolithic siltstone, porous siltstone, well-cemented siltstone, and chips with evidence of drill-bit metamorphism (DBM) (Figure 8). It is worth mentioning that the rock fabric characteristics of the four rock types identified in the drill cuttings indeed resemble the rock fabric of typical Montney facies observed in the reference core (Figure 5). Organic-rich mudstones are easily recognized by the clay-rich matrix and abundant pyrite content that appears as bright colors in the SEM images (Figure 5 and Figure 8). The heterolithic siltstones are recognized by fine-grained laminations, which in the SEM are highlighted by abundant pyrite (Figure 5 and Figure 8); some visual interparticle porosity can be observed in the silty fraction of the heterolithic siltstone chips. The porous siltstones are recognized by visible interparticle porosity (Figure 5 and Figure 8), whereas the well-cemented chips have minimal visible porosity (Figure 5 and Figure 8). Based on SEM-EDX images, dolomite constitutes the main cementing mineral in the rocks (Figure 5). The fifth category comprises chips with evidence of DBM, which have a sheared aspect (Figure 8). Similar to the current study, DBM chips have been documented in literature as a typical rock alteration produced by PDC bits [33]. The unaltered lithology of the DBM chips was identified as mainly organic-rich mudstone (Figure 9). The normalized proportion of rock types for the 14 thin sections is presented in Figure 4. Over the entire lateral length, the abundance of organic-rich mudstone chips ranges between 4 and 22%; the heterolithic siltstone chips range from 4 to 22%; the porous siltstones range from 6 to 51%, the well-cemented chips range from 8 to 49%. The abundance of DBM chips ranges from 17% to 97% (Figure 4).
Three main petrophysical properties measured on the drill cutting samples are reported: grain density, BET surface area, and crushed-rock permeability (Figure 4). The grain density values range from 2.68 to 2.73 g/cm3 with an average value of 2.71 g/cm3 (Figure 4). These values are consistent with grain density values measured on core samples from the vertical reference well (Table 1; Figure 6). The BET surface area ranges from 1.5 to 5.1 m2/g (Figure 4). These values are consistent with previous LPA (N2) analyses conducted on samples from the same Montney field [11]. The crushed-rock gas (He) permeability values measured on ten samples range from 8.0 × 10⁻⁷ to 3.4 × 10⁻⁵ mD. These values are at least two orders of magnitude lower than core plug-measured permeability values from the reference core (Table 1). Previous studies similarly reported lower crushed-rock permeability values compared to core plug-measured permeability (e.g., [34,35,36]).

4. Discussion

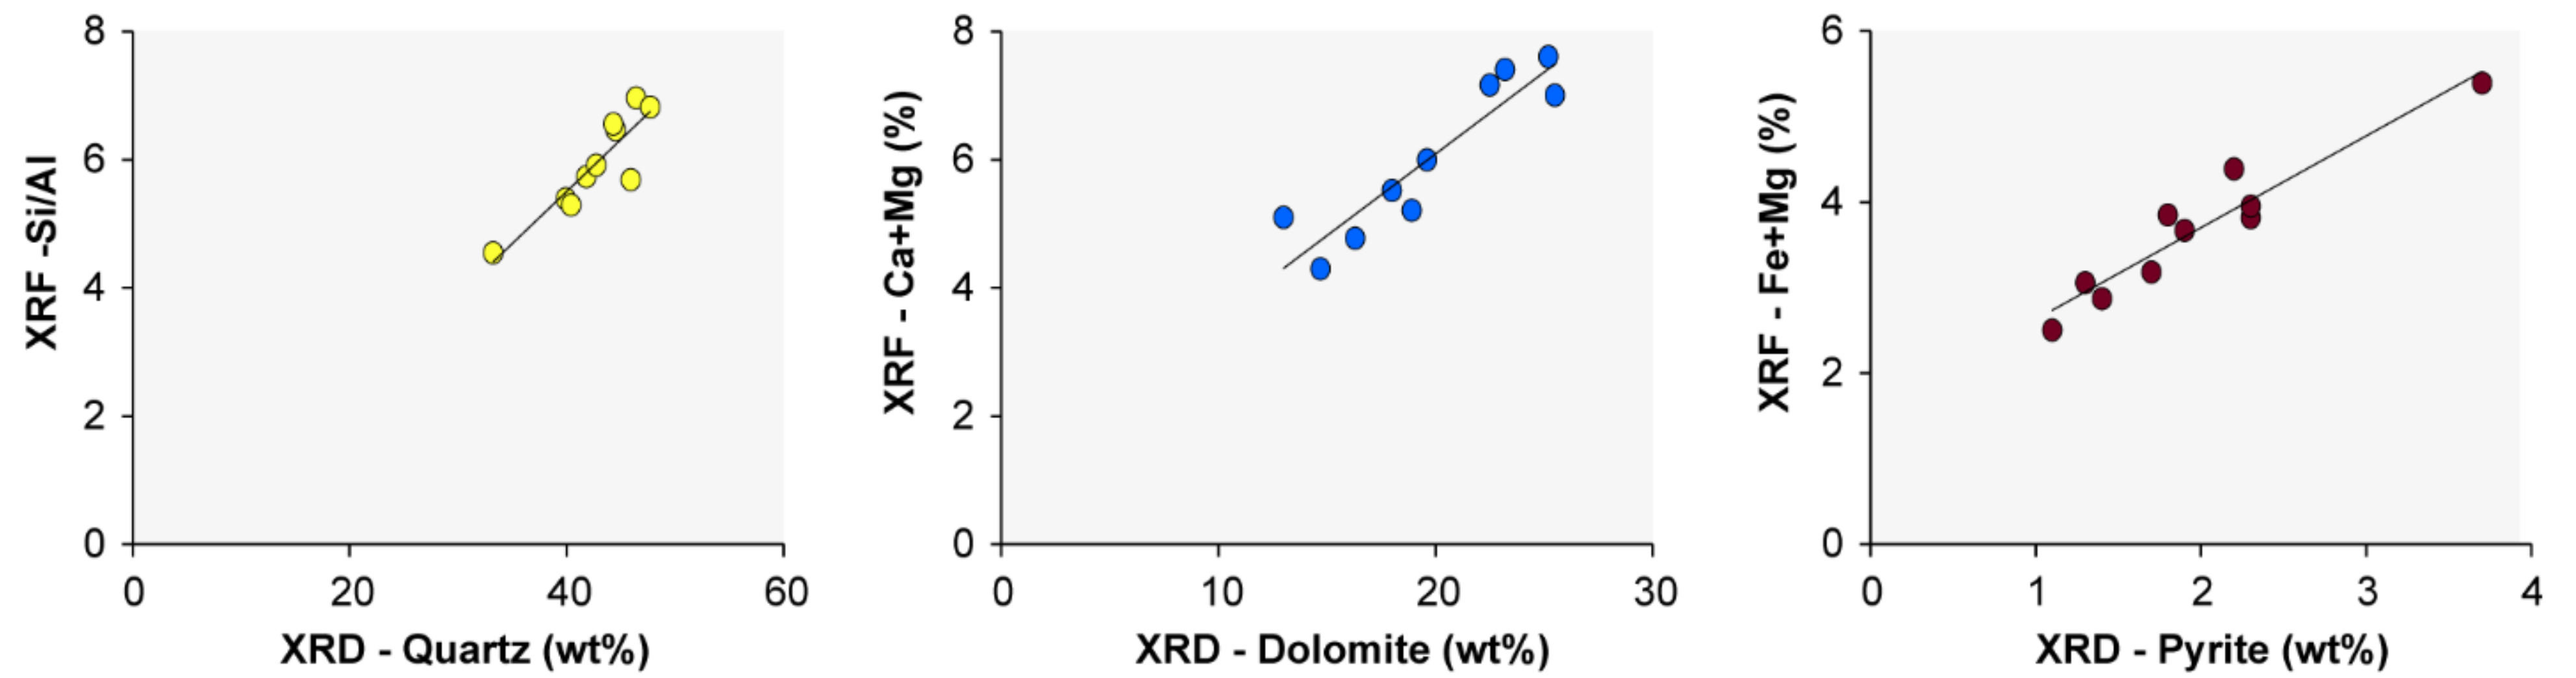
4.1. Well Log and Drill Cuttings Analysis Integration

In unconventional reservoirs, heterogeneity of reservoir properties is present at all scales, from the micrometer to kilometer-scale, and is also highly variable in different directions (laterally and vertically) [37]. Depending on the measurement or investigation techniques, some key reservoir changes (e.g., mineralogy, porosity, permeability) may be oversimplified or neglected due to the lack of integration of multi-scale datasets. For example, horizontal wells frequently have lateral lengths between two to four kilometers long, thereby sampling significant reservoir heterogeneity from heel to toe. However, such lateral heterogeneity is commonly oversimplified for stimulation designs by assuming that the well has apparently crossed only one rock layer within the target zone. While well logs generally serve the role of keeping the drill bit on target, most lateral heterogeneity does not become fully resolved. Therefore, in an attempt to explain the nature of the variability in the rock properties along the well, laboratory analyses performed on the drill cuttings are integrated with well log responses to improve the characterization. The lateral section of the well is subdivided into nine segments such that each segment contains rocks of similar petrophysical and geomechanical properties, also known as “similar-rocks” (Table 2, Figure 10).
Based on the log-calculated reservoir properties, Segments 1 and 5 have very similar petrophysical and geomechanical properties (Figure 10, Table 2). Both segments are characterized by very low porosity (<3.5%) and permeability (<0.0007 mD) values, and relatively high UCS (163 MPa), MSE (1600 MPa), YM (63 GPa), and PR (0.26) values. However, these two segments show contrasting responses for the drill cutting analyses, particularly from the lithological classification based on SEM images (Figure 11A,C). While Segment 1 is dominated by cemented rock chips, Segment 5 is dominated by DBM chips (Figure 10). As previously mentioned, the unaltered lithology of the DBM chips was identified as fine-grained lithologies enriched in pyrite (Figure 9), which can be in the form of individual thin beds or as thin laminae as seen in the reference core (Figure 2A). The impact of these lithological differences is also reflected in the specific surface area values, which are very low in Segment 1, resulting from the dolomite cementation, while surface areas are very high in Segment 5 due to the abundance of fine-grained lithologies. Hence, it is hypothesized that the poor reservoir quality of these two segments has two different origins. In the case of Segment 1, poor reservoir quality is the result of high dolomite cementation, whereas, in Segment 5, it is the result of low porosity laminations within the heterolithic beds (Figure 2A). This negative effect of the dolomite cementation and fine-grained laminations in petrophysical properties of the Montney has been previously reported (e.g., [30,38]).
Segments 2, 4, and 8 share similar petrophysical and geomechanical properties derived from logs (Figure 10, Table 2). These segments present the highest and most continuous distributions of porosity (>4%) and permeability (>0.0025 mD) along the well length. The geomechanical properties (UCS, YM, and PR) for these three segments have relatively intermediate values compared to their neighboring segments (Table 2, Figure 10), and the MSE log reflects more variability, with low to moderate values (Table 2, Figure 10). In the drill cuttings, the rock typing based on SEM images suggests more than 40% of rock chips corresponding to porous siltstones in these three segments. It is worth mentioning that even though the rock typing was conducted for only one sample in each of these segments and that the samples are 1.5 km apart, their results are very similar and agree with the high porosity from log calculations (Figure 10 and Figure 11B,D). It is important to highlight that among the rock chips classified as “porous siltstones,” a broad spectrum of porosity can be seen upon visual inspection of the SEM images (Figure 12). Apparently, subtle variations in grain size, degree of cementation, and pore throat size are key factors controlling the porosity, and possibly the permeability, of the Montney rocks targeted in this well (Figure 12). Although the rock classification was merely based on visual observations, the contrast evidenced in the porosity (2D) encourages further and more quantitative research on estimating petrophysical properties using SEM images from drill cutting samples. Relevant examples of such approaches are in [39,40,41].
Segment 3 stands out because it has the lowest YM values (~61 Gpa) and the highest PR values (~0.27) along the entire well (Table 2, Figure 10). However, referring to the petrophysical properties, Segment 3 can be described as highly heterogeneous as it contains two extremes of rocks with very low and very high porosity and permeability values. The porosity ranges from 1.0 to 7.4%, while the permeability ranges from 0.0002 to 0.0062 mD (Table 2, Figure 10). Validating this observation, the SEM-based rock classification on drill cuttings also shows a very heterogeneous Segment 3 (Figure 10). First, the sample at 3500 m exhibits a high abundance of organic-rich mudstones and DBM chips which correlates with very high pyrite contents (Fe+S proxy) and a high surface area in this sample (Figure 10). Contrarily, the sample at 3650 m is dominated by good-porosity siltstone chips, which have high quartz content, low pyrite content, and low surface area (Figure 10). In summary, Segment 3 is interpreted as containing interbedding of good-porosity siltstones with low-porosity organic-rich mudstones (as in Figure 2D), which together cause the low YM and high PR values from log calculations. This interbedding becomes more pronounced in the petrophysical logs compared to the geomechanical logs due to the difference in the resolutions of the density versus the sonic log (20 and 60 cm, respectively).
Segments 6 and 7 are characterized by highly variable permeabilities (0.0001–0.0065 mD) and low porosity values, overall less than 4% (Table 2, Figure 10). In terms of geomechanical properties, Segments 6 and 7 present some of the highest and most continuous UCS, YM, and MSE values over the entire well (Table 2). In comparison, the PR values are highly variable in these two segments, with intermediate to high values for both segments (0.2–0.30). Referring to the drill cuttings, very high dolomite and quartz contents are present in the samples, which, combined with the low porosity of the rocks in this interval, could explain the overall high rock strength and stiffness (i.e., UCS and YM) of these segments. Furthermore, the SEM-based rock classification of one sample in Segment 6 suggests a very heterogeneous distribution of multiple rock types as compared to other segments where a single rock type dominates the sample (e.g., samples in Segment 1). All the drill cutting samples collected in Segment 7 were found to be excessively contaminated with polymer beads; consequently, no laboratory analyses are available for this segment.
Segment 9 exhibits continuous distributions of intermediate porosities (~4%) and permeabilities (0.0014 mD) (Table 2, Figure 10). Likewise, the geomechanical properties YM (64 Gpa), PR (0.24), MSE (1171 MPa), and UCS (156 MPa) are of intermediate values (Figure 10). Consistent with Segment 5, the drill cutting samples in Segment 9 are dominated by DBM chips, where in fact, 97 percent of the rocks contained in the sample at 5450 m show evidence of DBM. The relatively high pyrite content (Fe+S proxy) supports the high proportion of fine-grained lithologies in this segment, which can be in the form of individual thin beds or as thin laminae (Figure 2 and Figure 5A,C). These fine-grained lithologies are more prone to develop DBM compared to coarser-grained lithologies such as siltstones [42].
To summarize, the heterogeneity observed along the subject Montney horizontal well results from the wellbore traversing multiple layers, each with different lithologies and rock properties. This heterogeneity in rock properties is expected, as observed from the strong variation of lithologies occurring in the vertical core reference well (Figure 2). This heterogeneity in the Montney arises from sedimentological and diagenetic factors that result in highly variable reservoir characteristics [22,43,44].
The identification and characterization of “similar-rocks” intervals along horizontal wells allows for optimization of the completion design, for which the ultimate goal is to initiate and propagate highly conductive fractures and maximize the contacted area between the fractures and the reservoir [45]. Previous studies conducted in different unconventional reservoirs have reported that when the clusters are placed in “similar-rocks” intervals, consistent behavior while stimulating (e.g., breakdown pressures) and even during production is observed for the entire stage [46,47]. Moreover, several investigations, using horizontal well production logs, have demonstrated that, for wells where the stages are geometrically spaced, only about two-thirds of all perforation clusters contributed to production, which means that one-third of the perforation clusters were not stimulated by the fracturing treatment [2,3,5,48]. In recent years, various studies have been undertaken to understand this phenomenon. For example, in [1,4,49,50], the authors documented that strong heterogeneity in reservoir properties along the horizontal well could potentially affect the hydraulic fracture initiation, propagation, and overall productivity of the wells. Therefore, the number of perforation clusters required to stimulate a well can be reduced when the perforation clusters are placed in intervals with the most favorable rock properties (i.e., RQ and CQ), ultimately reducing the completion costs without compromising the total well production.

4.2. Evaluation of Reservoir Quality and Completion Quality

For the development of hydraulically fractured horizontal wells, two key properties to evaluate are reservoir quality (RQ) and completion quality (CQ). RQ is associated with the combination of rock properties affecting hydrocarbon storage and producibility, including porosity, permeability, mineral matter and organic matter contents, and fluid saturations [45,51]. The CQ is associated with the combination of rock properties controlling hydraulic fracture treatment effectiveness; the CQ mainly depends on the elastic properties (YM and PR) and rock strength (UCS), which are primarily influenced by mineralogy and rock fabric [45,51].
To evaluate the reservoir quality and completion quality for the subject Montney horizontal well, a set of cutoff-based values were determined following examples from previous studies (e.g., [5]). These cutoff values are defined by considering the overall variations of petrophysical and geomechanical properties along the lateral (Figure 10). For RQ, cutoffs were applied to the porosity (>4%), permeability (>0.0018 mD), and water saturation (<20%), whereas, for CQ, the cutoffs were applied to rock strength (<160 Mpa), Young’s Modulus (60–65 GPa), and Poisson’s ratio (<0.26). It is worth noting that the cutoff values defined in this section are meant to highlight the most favorable intervals, which does not necessarily imply that the non-flagged intervals are considered “non-pay” as in the traditional role of cutoff values [52].
The results of the RQ and CQ flags are presented in Figure 10. The highlighted colored intervals (i.e., flags) indicate that all cutoff conditions were met, and therefore such intervals present the most favorable rocks in terms of either RQ or CQ. Using these cutoffs, the most continuous distributions of best RQ rocks are found to occur in Segments 2, 4, and 8 (Figure 10). Then, some scattered intervals with good RQ can be seen in Segments 3, 6, 7, and 9. Lastly, the most inferior RQ is found in Segments 1 and 5 (Figure 10). As for the CQ, Segments 2, 4, 8, and 9 contain the most continuous distributions of good CQ (Figure 10). The rest of the segments in the well display very few to no flags of good CQ (Figure 10). Interestingly, there is an overall good agreement between the RQ and CQ flags. For example, Segments 2, 4, and 8 are flagged as having both good RQ and CQ, which could be related to the relatively low heterogeneity observed within these segments based on the drill cutting analyses (Figure 10).
Recent studies have highlighted the importance of incorporating rock anisotropy into the log-based RQ and CQ evaluation. Shahiri et al. [53] investigated the main petrophysical and geomechanical factors affecting the fracturing potential of unconventional plays and emphasized the incorporation of formation anisotropy (degree of lamination) as one of the critical factors to take into account to maximize conductive reservoir volume. Similarly, based on hydraulic fracture simulations, Laronga et al. [54] reported that multiple successive thin laminations of highly contrasting mechanical properties could jog and arrest fracture growth. They suggested using a lamination flag as an input to the hydraulic fracture simulation.
In this study, it is demonstrated that it is possible to tie lithological observations from drill cuttings to well cores using SEM images of thin sections. Therefore, the quantification of rock types or lithologies in drill cutting samples could potentially be used to evaluate the level of heterogeneity along the lateral well length. For example, the samples at 3650 and 5200 m are evidently dominated by porous siltstones, resembling predominantly massive intervals as illustrated in Figure 2D, whereas the high abundance of DBM chips in the samples at 4050 and 5300 m are linked to more laminated heterolithic intervals such as those shown in Figure 2A.

4.3. Challenges and Additional Considerations

4.3.1. Well Logs

An important observation from the reservoir characterization using well logs in this study is the lack of clear correspondence between the gamma ray log and the log-calculated petrophysical or geomechanical properties (Figure 3). In some other fine-grained formations, such as the Duvernay and the Marcellus, the gamma ray log is strongly representative of petrophysical and geomechanical properties, mainly due to their organic matter and clay contents [55,56]. However, in the Montney Formation, the gamma ray response is heavily influenced by the presence of K-feldspar and mica rather than organic matter and clays [57]. This highlights the necessity of incorporating multiple well logs in the analysis, which is problematic because the gamma ray log is frequently the only log acquired in horizontal wells. Certainly, in the absence of well logs, drill cutting analyses are a robust dataset that can help to supplement the along-well reservoir characterization.
The present study uses dynamic elastic properties calculated from well logs; however, static elastic parameters most faithfully represent the actual rock properties [58]. Therefore, the dynamic elastic properties should be converted to static when progressing to a geological or geomechanical modeling step. The conversion of dynamic to static elastic properties is typically performed through empirical equations calibrated using elastic properties measured on core samples (e.g., [59,60]). More recently, the use of machine learning techniques to estimate static elastic properties has been investigated (e.g., [61]).
The drilling-derived mechanical specific energy (MSE) log is in good agreement with the log-calculated rock strength (UCS) (Figure 3), therefore supporting the use of drilling parameters as an indirect indication of CQ. However, rock intervals that are easy to drill are not necessarily the best intervals to target for optimum production (RQ) [62]. Alternatively, previous authors have successfully assessed RQ by computing porosity and permeability using routinely acquired drilling data [14,63,64].

4.3.2. Drill Cuttings

Polycrystalline Diamond Compact (PDC) drill bits are currently the most common to drill horizontal wells because they are fast and cost-effective. However, the produced drill cuttings, especially from fine-grained reservoirs, are often very fine compared to traditional roller cone bits [11]. The resulting fine particle size can be problematic for certain laboratory analyses that require specific particle sizes. For instance, the recommended particle size for crushed permeability measurements is 20–35 US Mesh, but due to the small amount of rock material in that mesh size, the 35–60 US Mesh had to be used in this study. Additionally, most permeability models assume a uniform radius of crushed samples, and drill cuttings usually have a non-uniform radius, which could lead to erroneous permeability values [36,65]. Also, in the case of helium pycnometry analyses, the smaller rock chips can lower the grain density [66].
In addition to producing fine particles, PDC bits tend to alter rock textures producing bit-generated textures such as drill bit metamorphism (DBM) [67]. The DBM process involves the reduction of particle size by shearing, followed by welding of the particles into a matrix superficially resembling a glass [68]. The bit-generated textures are highly impacted by the lithology, hardness, and rock strength of the section being drilled [33,69]. In the present work, closer inspection of the DBM chips indicated that most of these chips result preferentially from fine-grained lithologies, including organic-rich mudstone and heterolithic facies (Figure 9). The effect of drill cuttings with DBM on different laboratory analyses has not been studied in depth before. In this study, using SEM-EDX images, the DBM chips are observed to be texturally altered, but the structure and composition of framework minerals are preserved (Figure 9). Previous authors have documented that the same observation for SEM and bulk mineralogical analyses (e.g., XRD) [68]. On the other hand, due to the fact that the DBM chips are thin and flake-like particles, their abundant presence in the drill cutting samples could affect the petrophysical measurements such as permeability and grain density. For example, the grain density of the sample at 5450 m is the smallest in the entire well (2.66 g/cm3), potentially due to the abundance of DBM chips in this sample (97%, Figure 4).
The observed relationship between the XRF proxies and some minerals estimated from XRD, including dolomite (Ca+Mg), quartz (Si/Al), and pyrite (Fe+S), readily validates the reliability of XRF measurements as indicative of rock mineralogy (Figure 7). This is key for the drill cuttings evaluation of horizontal wells, as the XRF can be rapidly measured—while drilling or in the lab—and with an associated low cost. Although the drill cutting samples for this study were collected every 50 m, if samples are collected at higher frequencies (3–5 m), the XRF could serve as a good starting point to identify “similar-rocks” along the well to refine completion designs in an efficient manner.
The rock type classification based on SEM images provides good information regarding the rock fabric (e.g., 2D porosity, cementation, lamination); therefore, it is ultimately a good indicator of the petrophysical properties of the rock chips within a sample (Section 4.1). However, the manual identification and classification of rock chips in a thin section can be a very tedious procedure. Becerra et al. [26] propose an automated workflow to classify drill cuttings based on SEM images of thin sections using supervised machine learning algorithms. Considering that the acquisition of SEM images of drill cuttings while drilling has become more popular in the last decade [70], the implementation of similar workflows seems reasonable. The evaluation and quantification of lithological and rock fabric variations while drilling could be of great importance to optimize the stimulation stage, particularly in formations where the mineralogy is not strongly indicative of reservoir quality, as in the Montney.
Very few drill cuttings-based studies have been conducted in the Montney Formation, particularly from horizontal wells [11,16]. In this study, the potential of this dataset to produce reliable reservoir data that can be tied to core-measured reservoir properties, including rock composition, petrophysical properties, and even rock types, has been demonstrated. As more data are collected from drill cuttings, better calibrations can be established with well-log responses to eventually minimize the requirement of well logs in horizontal wells. The availability of drill cuttings over the entirety of the wellbore makes them a valuable dataset for reservoir characterization.

5. Conclusions

In this study, it is demonstrated that key reservoir properties of the Montney Formation significantly change at the meter-scale along the lateral length of horizontal wells. The integration of log-derived rock properties and drill cuttings analyses resulted in the following findings:
  • Petrophysical and geomechanical properties calculated from well logs served to identify and group “similar-rock” intervals along the well. Based on the observed heterogeneity in reservoir properties, the lateral length of the well was subdivided into nine segments, which displayed variable RQ and CQ.
  • For the identification of “sweet spots” for stimulation, a set of RQ and CQ cutoff-based values were determined by considering the overall variations of petrophysical and geomechanical properties along the lateral (2524 m). Superior RQ and CQ intervals were found to be associated with predominantly massive-porous siltstone facies; these intervals are regarded as the primary targets for stimulation. In contrast, relatively inferior RQ and CQ intervals were found to be associated with either dolomite-cemented facies or laminated siltstones.
  • The potential of drill cuttings to produce reliable reservoir data that can be tied to core-measured rock properties, including rock composition, petrophysical properties, and even rock types, has been demonstrated.
  • Contrary to other unconventional plays, in the Montney, the gamma ray log is not representative of the log-calculated petrophysical or geomechanical properties. This fact underscores the need to combine multiple well logs or integrate additional datasets, such as drill cuttings and drilling-derived properties, to improve the along-well characterization.
  • The evaluation and quantification of lithological and rock fabric variations on drill cutting samples—while drilling—could be of great importance to the optimization of hydraulic fracture stimulation treatments, particularly in formations where the mineralogy is not strongly indicative of RQ as in the Montney.
  • Drill cuttings are naturally an imperfect dataset; the impact of several factors (e.g., particle size, DBM, etc.) on the different laboratory analyses should be recognized and accounted for.

Author Contributions

Conceptualization, C.R.C. and D.B.; methodology, D.B., C.R.C., A.G. and R.P.d.L.; software, D.B. and R.P.d.L.; validation, F.T. and Z.Z.; formal analysis, D.B.; investigation, D.B.; resources, A.T. and R.S.; data curation, A.T. and R.S.; writing—original draft preparation, D.B., and C.R.C.; writing—review and editing, D.B., C.R.C., R.P.d.L., A.G., A.T., F.T., Z.Z. and R.S.; visualization, D.B.; supervision, C.R.C. and A.G.; project administration, C.R.C.; funding acquisition, C.R.C. All authors have read and agreed to the published version of the manuscript.

Funding

This research was funded by NSERC Collaborative Research and Development Grant, grant number CRDPJ 500014-2016.

Acknowledgments

The authors wish to thank the four anonymous reviewers whose constructive comments helped improve this manuscript. Chris Clarkson would like to acknowledge Ovintiv and Shell for support of his chair position in Unconventional Gas and Light Oil research at the University of Calgary, Department of Geoscience. The authors wish to acknowledge Chris Debuhr for assisting with SEM imaging and EDX analyses. We also thank the sponsors of the Tight Oil Consortium, hosted at the University of Calgary, for their support. The laboratory assistance provided by summer students Gaurav Sharma and Michael Chang is greatly appreciated. We thank Schlumberger for the license donation for Techlog E&P software.

Conflicts of Interest

The authors declare no conflict of interest.

References

  1. Baihly, J.D.; Malpani, R.; Edwards, C.; Han, S.Y.; Kok, J.C.L.; Tollefsen, E.M.; Wheeler, C.W. Unlocking the shale mystery: How lateral measurements and well placement impact completions and resultant production. In Proceedings of the SPE Tight Gas Completions Conference, San Antonio, TX, USA, 2–3 November 2010. [Google Scholar]
  2. Miller, C.; Waters, G.; Rylander, E. Evaluation of production log data from horizontal wells drilled in organic shales. In Proceedings of the SPE Americas Unconventional Gas Conference, The Woodlands, TX, USA, 14–16 June 2011. [Google Scholar]
  3. Chorn, L.; Stegent, N.; Yarus, J. Optimizing lateral lengths in horizontal wells for a heterogeneous shale play. In Proceedings of the SPE European Unconventional Resources Conference and Exhibition, Vienna, Austria, 25–27 February 2014. [Google Scholar]
  4. Salahshoor, S.; Maity, D.; Ciezobka, J. Stage-level data integration to evaluate the fracturing behavior of horizontal wells at the hydraulic fracturing test site (HFTS): An insight into the production performance. In Proceedings of the SPE Unconventional Resources Technology Conference, Austin, TX, USA, 20–22 July 2020. [Google Scholar]
  5. Cipolla, C.; Weng, X.; Onda, H.; Nadaraja, T.; Ganguly, U.; Malpani, R. New algorithms and integrated workflow for tight gas and shale completions. In Proceedings of the SPE Annual Technical Conference and Exhibition, Denver, CO, USA, 30 October–2 November 2011. [Google Scholar]
  6. Walker, K.; Wutherich, K.; Terry, J.; Shreves, J.; Caplan, J. Improving production in the Marcellus Shale using an engineered completion design: A case study. In Proceedings of the SPE Annual Technical Conference and Exhibition, San Antonio, TX, USA, 8–10 October 2012. [Google Scholar]
  7. Ajisafe, F.; Pope, T.; Azike, O.; Reischman, R.; Herman, D.; Burkhardt, C.; Helmreich, A.; Phelps, M. Engineered completion workflow increases reservoir contact and production in the Wolfcamp Shale, West Texas. In Proceedings of the SPE Annual Technical Conference and Exhibition, Amsterdam, The Netherlands, 27–29 October 2014. [Google Scholar]
  8. Logan, W.D. Engineered shale completions based on common drilling data. In Proceedings of the SPE Annual Technical Conference and Exhibition, Houston, TX, USA, 28–30 September 2015. [Google Scholar]
  9. Buller, D.; Scheibe, C.; Stringer, C.; Carpenter, G. A new mineralogy cuttings analysis workflow for optimized horizontal fracture-stage placement in organic shale reservoirs. In Proceedings of the SPE Annual Technical Conference and Exhibition, Amsterdam, The Netherlands, 27–29 October 2014. [Google Scholar]
  10. Stolyarov, S.; Gadzhimirzaev, D.; Sadykhov, S.; Ackley, B.; Lipp, C. Lateral wellbore rock characterization and hydraulic fracture optimization utilizing drilling cuttings and mud log in Cleveland Sand, a case study. In Proceedings of the SPE Oklahoma City Oil and Gas Symposium, Oklahoma City, OK, USA, 27–31 March 2017. [Google Scholar]
  11. Ghanizadeh, A.; Rashidi, B.; Clarkson, C.R.; Sidhu, N.; Hobbs, J.J.; Yang, Z.; Song, C.; Hazell, S.; Bustin, R.M. Characterization of reservoir qualityin tight rocks using drill cuttings: Examples from the Montney Formation Alberta, Canada. In Proceedings of the SPE Canada Unconventional Resources Conference, Calgary, AB, Canada, 13–14 March 2018. [Google Scholar]
  12. Shi, X.; Jiang, S.; Wang, Z.; Xiao, D.; Sun, X. The application of drill cuttings to evaluate the fracability in unconventional shale gas resources. In Proceedings of the SPE Asia Pacific Oil and Gas Conference and Exhibition, Bali, Indonesia, 29–31 October 2019. [Google Scholar]
  13. Esatyana, E.; Sakhaee-Pour, A.; Sadooni, F.N.; Al-Saad Al-Kuwari, H. Nanoindentation of shale cuttings and its application to core measurements. Petrophys.—SPWLA J. Form. Eval. Reserv. Descr. 2020, 61, 404–416. [Google Scholar] [CrossRef]
  14. Tahmeen, M.; Hareland, G.; Hayes, J.P. A convenient technology to calculate geomechanical properties from drilling data. In Proceedings of the ASME 39th International Conference on Ocean, Offshore and Arctic Engineering; American Society of Mechanical Engineers, Virtual, Online, 3–7 August 2020. [Google Scholar]
  15. Trivedi, A.S.; Clarkson, C.R.; Shor, R.J. Accounting for hydraulics and vibration in MSE calculations to estimate formation properties. In Proceedings of the IADC/SPE International Drilling Conference and Exhibition, Galveston, TX, USA, 3–5 March 2020. [Google Scholar]
  16. Akihisa, K.; Knapp, L.J.; Sekine, K.; Akai, T.; Uchida, S.; Wood, J.M.; Ardakani, O.H.; Sanei, H. Integrating mud gas and cuttings analyses to understand local CGR variation in the Montney tight gas reservoir. Int. J. Coal Geol. 2018, 197, 42–52. [Google Scholar] [CrossRef]
  17. Clarkson, C.R.; Zhang, Z.; Tabasinejad, F.; Becerra, D.; Ghanizadeh, A. Evaluation of reservoir quality and forecasted production variability along a multi-fractured horizontal well. Part 2: Selected stage forecasting. Energies 2021, 14, 6007. [Google Scholar] [CrossRef]
  18. National Energy Board; British Columbia Oil & Gas Commission; Alberta Energy Regulator; British Columbia Ministry of Natural Gas Development The Ultimate Potential for Unconventional Petroleum from the Montney Formation of British Columbia and Alberta. Energy Brief. Note 2013, 1–23.
  19. Kuppe, F.; Haysom, S.; Nevokshonoff, G. Liquids rich unconventional Montney: The geology and the forecast. In Proceedings of the SPE Canadian Unconventional Resources Conference, Calgary, AB, Canada, 30 October–1 November 2012. [Google Scholar]
  20. Davies, G.R.; Watson, N.; Moslow, T.F.; Maceachern, J.A. Regional subdivisions, sequences, correlations and facies relationships of the lower triassic Montney Formation, west-central Alberta to northeastern British Columbia, Canada—With emphasis on role of paleostructure. Bull. Can. Pet. Geol. 2018, 66, 23–92. [Google Scholar]
  21. Davis, D.H. Estimating porosity of sedimentary rocks from bulk density. J. Geol. 1954, 62, 102–107. [Google Scholar] [CrossRef]
  22. Wood, J.M. Water distribution in the Montney Tight Gas Play of the Western Canadian Sedimentary Basin: Significance for resource evaluation. SPE Reserv. Eval. Eng. 2013, 16, 290–302. [Google Scholar] [CrossRef]
  23. Kowalski, J. Formation strength parameters from well logs. In Proceedings of the SPWLA 16th Annual Logging Symposium, New Orleans, LA, USA, 4–7 June 1975. [Google Scholar]
  24. McNally, G.H. Estimation of coal measures rock strength using sonic and neutron logs. Geoexploration 1987, 24, 381–395. [Google Scholar] [CrossRef]
  25. Rigaku. Integrated X-ray powder diffraction software PDXL. Rigaku J. 2010, 26, 23–27. [Google Scholar]
  26. Becerra, D.; Pires De Lima, R.; Galvis-Portilla, H.; Clarkson, C.R. Generating a labeled dataset to train machine learning algorithms for lithological classification of drill cuttings. 2021; In Preparation. [Google Scholar]
  27. Brunauer, S.; Emmett, P.H.; Teller, E. Adsorption of gases in multimolecular layers. J. Am. Chem. Soc. 1938, 60, 309–319. [Google Scholar] [CrossRef]
  28. Core Lab. Shale Matrix Permeameter (SMP), operations manual. 2013, 1–22.
  29. Vishkai, M.; Wang, J.; Wong, R.C.K.; Clarkson, C.R.; Gates, I.D. Modeling geomechanical properties in the Montney Formation, Alberta, Canada. Int. J. Rock Mech. Min. Sci. 2017, 96, 94–105. [Google Scholar] [CrossRef]
  30. Ghanizadeh, A.; Clarkson, C.R.; Vahedian, A.; Ardakani, O.H.; Wood, J.M.; Sanei, H. Laboratory-based characterization of pore network and matrix permeability in the Montney Formation: Insights from methodology comparisons. Bull. Can. Pet. Geol. 2018, 66, 472–498. [Google Scholar]
  31. Teale, R. The concept of specific energy in rock drilling. Int. J. Rock Mech. Min. Sci. 1965, 2, 57–73. [Google Scholar] [CrossRef]
  32. Dupriest, F.E.; Koederitz, W.L. Maximizing drill rates with real-time surveillance of mechanical specific energy. In Proceedings of the SPE/IADC Drilling Conference, Amsterdam, The Netherlands, 23–25 February 2005. [Google Scholar]
  33. Zeuch, D.H.; Finger, J.T. Rock breakage mechanisms with a PDC cutter. In Proceedings of the SPE Annual Technical Conference and Exhibition, Las Vegas, NV, USA, 22–25 September 1985. [Google Scholar]
  34. Ghanizadeh, A.; Clarkson, C.R.; Aquino, S.; Ardakani, O.H.; Sanei, H. Petrophysical and geomechanical characteristics of Canadian tight oil and liquid rich gas reservoirs: II. Geomechanical property estimation. Fuel 2015, 153, 682–691. [Google Scholar] [CrossRef]
  35. Heller, R.; Vermylen, J.; Zoback, M. Experimental investigation of matrix permeability of gas shales. Am. Assoc. Pet. Geol. Bull. 2014, 98, 975–995. [Google Scholar] [CrossRef]
  36. Peng, S.; Loucks, B. Permeability measurements in mudrocks using gas-expansion methods on plug and crushed-rock samples. Mar. Pet. Geol. 2016, 73, 299–310. [Google Scholar] [CrossRef] [Green Version]
  37. Clarkson, C.R.; Haghshenas, B.; Ghanizadeh, A.; Qanbari, F.; Williams-Kovacs, J.D.; Riazi, N.; Debuhr, C.; Deglint, H.J. Nanopores to megafractures: Current challenges and methods for shale gas reservoir and hydraulic fracture characterization. J. Nat. Gas Sci. Eng. 2016, 31, 612–657. [Google Scholar] [CrossRef]
  38. Vaisblat, N.; Harris, N.B.; Ayranci, K.; Power, M.; DeBhur, C.; Bish, D.L.; Chalaturnyk, R.; Krause, F.; Crombez, V.; Euzen, T.; et al. Compositional and diagenetic evolution of a siltstone, with implications for reservoir quality; an example from the Lower Triassic Montney Formation in western Canada. Mar. Pet. Geol. 2021, 129, 105066. [Google Scholar] [CrossRef]
  39. Vocke, C.P.; Deglint, H.J.; Clarkson, C.R.; Debuhr, C.; Ghanizadeh, A.; Hazell, S.; Bustin, M. Estimation of petrophysical properties of tight rocks from drill cuttings using image analysis: An integrated laboratory-based approach. In Proceedings of the SPE Unconventional Resources Conference, Calgary, AB, Canada, 13–14 March 2018. [Google Scholar]
  40. Landry, C.J.; Hart, B.S.; Prodanović, M. Comparison of wireline log and SEM image-based measurements of porosity in overburden shales. In Proceedings of the SPE Unconventional Resources Technology Conference, Austin, TX, USA, 20–22 July 2020. [Google Scholar]
  41. Buckman, J.; Aboussou, A.; Esegbue, O.; Wagner, T.; Gambacorta, G. Fine-scale heterogeneity of pyrite and organics within mudrocks: Scanning electron microscopy and image analysis at the large scale. Minerals 2020, 10, 354. [Google Scholar] [CrossRef]
  42. Kennedy, L.A.; Spray, J.G. Frictional melting of sedimentary rock during high-speed diamond drilling: An analytical SEM and TEM investigation. Tectonophysics 1992, 204, 323–337. [Google Scholar] [CrossRef]
  43. Davies, G.R.; Moslow, T.F.; Sherwin, M.D. The Lower Triassic Montney Formation, west-central Alberta. Bull. Can. Pet. Geol. 1997, 45, 474–505. [Google Scholar] [CrossRef]
  44. Wüst, R.A.J.; Nassichuk, B.R.; Bustin, R.M. Porosity characterization of various organic-rich shales from the western Canadian sedimentary basin, Alberta and British Columbia, Canada. AAPG Mem. 2013, 81–100. [Google Scholar] [CrossRef]
  45. Cipolla, C.; Lewis, R.; Maxwell, S.; Mack, M. Appraising unconventional resource plays: Separating reservoir quality from completion effectiveness. In Proceedings of the International Petroleum Technology Conference, Bangkok, Thailand, 7–9 February 2012. [Google Scholar]
  46. Mullen, J.; Lowry, J.C.; Nwabuoku, K.C. Lessons learned developing the Eagle Ford Shale. In Proceedings of the SPE Tight Gas Completions Conference, San Antonio, TX, USA, 2–3 November 2010. [Google Scholar]
  47. Anifowoshe, O.; Yates, M.; Xu, L.; Dickenson, P.; Akin, J.; Carney, B.J.; Hewitt, J.; Costello, I.; Arnold, Z. Improving wellbore stimulation coverage in the Marcellus: Integrating lateral measurements with enhanced engineered completion design and fiber optic evaluation. In Proceedings of the SPE Eastern Regional Meeting, Canton, OH, USA, 13–15 September 2016. [Google Scholar]
  48. Slocombe, R.; Acock, A.; Chadwick, C.; Wigger, E.; Viswanathan, A.; Fisher, K.; Reischman, R. Eagle Ford completion optimization strategies using horizontal logging data. In Proceedings of the SPE Unconventional Resources Technology Conference, New Orleans, LA, USA, 30 September–2 October 2013. [Google Scholar]
  49. El Sgher, M.; Aminian, K.; Ameri, S. Contribution of hydraulic fracture stage on the gas recovery from the Marcellus Shale. In Proceedings of the SPE Eastern Regional Meeting, Pittsburgh, PA, USA, 7–11 October 2018. [Google Scholar]
  50. Wutherich, K.D.; Walker, K.J. Designing completions in horizontal shale gas wells - Perforation strategies. In Proceedings of the SPE Americas Unconventional Resources, Pittsburgh, PA, USA, 5–7 June 2012. [Google Scholar]
  51. Glaser, K.S.; Miller, C.K.; Johnson, G.M.; Toelle, B.; Kleinberg, R.L.; Miller, P.; Pennington, W.D. Seeking the sweet spot: Reservoir and completion quality in organic shales. Oilf. Rev. 2013, 25, 16–29. [Google Scholar]
  52. Worthington, P.F.; Cosentino, L. The application of cutoffs in integrated reservoir studies. SPE Reserv. Eval. Eng. 2008, 11, 968–975. [Google Scholar] [CrossRef]
  53. Shahri, M.P.; Chok, H.; Safari, R.; Huang, J.; Amorocho, C.; Mejia, C.; Mutlu, U. Automated hydraulic fracturing stage design based on integrated fracture potential. In Proceedings of the SPE Unconventional Resources Technology Conference, San Antonio, TX, USA, 20–22 July 2015. [Google Scholar]
  54. Laronga, R.; Mosse, L.; Velez, E.; Haddad, E.; Gonzalez-Iglesias, J. Improving unconventional reservoir performance with geoscience-based development strategies. World Oil 2021, 242, 2–5. [Google Scholar]
  55. Venieri, M.; Weir, R.; McKean, S.H.; Pedersen, P.K.; Eaton, D.W. Determining elastic properties of organic-rich shales from core, wireline logs and 3-D seismic: A comparative study from the Duvernay play, Alberta, Canada. J. Nat. Gas Sci. Eng. 2020, 84, 103637. [Google Scholar] [CrossRef]
  56. Lili, X.; Yates, M.; Anifowoshe, O.; Uschner-Arroyo, N.; Yang, Y.; MacPhail, K. Comparing strategies for optimizing horizontal shale completions by projecting pilot well measurements across laterals. In Proceedings of the SPE Eastern Regional Meeting, Morgantown, WV, USA, 13–15 October 2015. [Google Scholar]
  57. Krause, F.F.; Wiesman, A.C.; Williscroft, K.R.; Solano, N.; Morris, N.J.; Meyer, R.; Marr, R. InSight CWLS Magazine; Canadian Well Logging Society: Calgary, AB, Canada, 2012; pp. 1–4. [Google Scholar]
  58. Mavko, G.; Mukerji, T.; Dvorkin, J. The Rock Physics Handbook; Cambridge University Press: Cambridge, UK, 2009; ISBN 9780511626753. [Google Scholar]
  59. Eissa, E.A.; Kazi, A. Relation between static and dynamic Young’s moduli of rocks. Int. J. Rock Mech. Min. Sci. 1988, 25, 479–482. [Google Scholar] [CrossRef]
  60. Najibi, A.R.; Ghafoori, M.; Lashkaripour, G.R.; Asef, M.R. Empirical relations between strength and static and dynamic elastic properties of Asmari and Sarvak limestones, two main oil reservoirs in Iran. J. Pet. Sci. Eng. 2015, 126, 78–82. [Google Scholar] [CrossRef]
  61. Elkatatny, S.; Tariq, Z.; Mahmoud, M.; Abdulraheem, A.; Mohamed, I. An integrated approach for estimating static Young’s modulus using artificial intelligence tools. Neural Comput. Appl. 2019, 31, 4123–4135. [Google Scholar] [CrossRef]
  62. Barree, R.D.; Conway, M.W.; Miskimins, J.L. Use of conventional well logs in selective completion designs for unconventional reservoirs. In Proceedings of the SPE Western North American and Rocky Mountain Joint Meeting, Denver, CO, USA, 16–18 April 2014. [Google Scholar]
  63. Atashnezhad, A.; Cedola, A.E.; Hareland, G. An empirical model to estimate a critical stimulation design parameter using drilling data. In Proceedings of the SPE Western Regional Meeting, Bakersfield, CA, USA, 23 April 2017. [Google Scholar]
  64. Cedola, A.E.; Atashnezhad, A.; Hareland, G. Evaluating multiple methods to determine porosity from drilling data. In Proceedings of the SPE Oklahoma City Oil and Gas Symposium, Oklahoma City, OK, USA, 27–31 March 2017. [Google Scholar]
  65. Cui, X.; Bustin, A.M.M.M.M.; Bustin, R.M. Measurements of gas permeability and diffusivity of tight reservoir rocks: Different approaches and their applications. Geofluids 2009, 9, 208–223. [Google Scholar] [CrossRef]
  66. Achang, M.; Pashin, J.C.; Cui, X. The influence of particle size, microfractures, and pressure decay on measuring the permeability of crushed shale samples. Int. J. Coal Geol. 2017, 183, 174–187. [Google Scholar] [CrossRef]
  67. Glowka, D. The thermal response of rock to friction in the drag cutting process. J. Struct. Geol. 1989, 11. [Google Scholar] [CrossRef]
  68. Taylor, J.C.M. Bit-metamorphism, illustrated by lithological data from german north sea wells. Geol. Mijnb. 1982, 62, 211–219. [Google Scholar] [CrossRef]
  69. Wenger, L.M.; Pottorf, R.J.; MacLeod, G.; Otten, G.; Dreyfus, S.; Justwan, H.; Wood, E.S. Drill-bit metamorphism: Recognition and impact on show evaluation. In Proceedings of the SPE Annual Technical Conference and Exhibition, New Orleans, LA, USA, 4–7 October 2009. [Google Scholar]
  70. Ashton, T.; Ly, C.V.; Graham, S.; Oliver, G. Portable technology puts real-time automated mineralogy on the well site. In Proceedings of the SPE Unconventional Resources Conference and Exhibition-Asia Pacific, Brisbane, Australia, 11–13 November 2013. [Google Scholar]
Figure 1. Well trajectory displaying the distribution of drill cutting samples collected along the horizontal well. Green dots represent the samples suitable for laboratory analyses, while the red dots represent samples where mud contaminants were found in amounts exceeding the amount of rock. Stereo images (AC) are examples of drill cuttings at the locations identified in the well trajectory. Yellow arrows in (AC) indicate polymer beads (mud additives). Blue and orange arrows in (AC) represent siltstone and organic-rich mudstone facies, respectively.
Energies 14 06154 g001
Figure 2. Gamma ray log from the Montney vertical reference well used in this study to constrain the log-based calculations and laboratory results from the horizontal subject well. The shaded rectangle in the panel on the left represents the estimated interval crossed by the horizontal well. The core pictures (A,D), thin section images (B,E), and SEM images (C,F) represent examples of the rocks encountered by the horizontal well. Lithostratigraphic framework from Davies et al. [20].
Energies 14 06154 g002
Figure 3. Petrophysical, geomechanical, and drilling derived properties calculated for the subject Montney well. The colored dots on the well trajectory track represent the location of the drill cutting samples.
Energies 14 06154 g003
Figure 4. Results from the laboratory analyses conducted on drill cutting samples. Iron plus sulfur (Fe+S) can be used as a proxy for pyrite, the silicon to aluminum ratio (Si/Al) for quartz, and calcium plus magnesium (Ca+Mg) for dolomite. XRD mineralogy and XRF analyses were performed on the exact same sample. The grain density was measured using a helium pycnometer. The surface area was estimated from low-pressure gas (N2) adsorption experiments using the BET method. The crushed-rock permeability was measured using an SMP-200 instrument.
Energies 14 06154 g004
Figure 5. SEM-BS-EDX images comparing four identifiable rock types in the drill cuttings (B,D,F,H) and their associated core-facies (A,C,E,G). Core samples shown in this figure were collected from the targeted Montney Interval. (A,B) Organic-rich mudstone. (C,D) Heterolithic siltstone. (E,F) Porous siltstone. (G,H) Well-cemented siltstone. The diameter of the shown core is 8 cm (left panel).
Energies 14 06154 g005
Figure 6. Box plots comparing the results from mineralogical and grain density analyses conducted on drill cutting samples from the horizontal well versus core plug samples from the vertical reference well. The data for the reference core are presented in Table 1.
Energies 14 06154 g006
Figure 7. Cross plots between selected minerals (XRD) and elemental proxies (XRF) for ten drill cutting samples. Calcium plus magnesium (Ca+Mg) can be used as a proxy for dolomite, the silicon to aluminum ratio (Si/Al) for quartz, and iron plus sulfur (Fe+S) for pyrite contents. The XRD mineralogy and XRF analyses were performed on the exact same pulverized sample.
Energies 14 06154 g007
Figure 8. SEM-BS images showing examples of the five rock types classified based on textural characteristics. The lower right picture displays a portion of a thin section imaged through SEM. Each thin section contained approximately 1000 rock chips.
Energies 14 06154 g008
Figure 9. Examples of drill cutting chips exhibiting drill bit metamorphism (DBM) (yellow arrows) seen under the stereo (A), petrographic (B), and electron (C,D) microscopes. (D) SEM-BS-EDX photomicrograph showing the unaltered minerals of a DBM rock chip; the provided example represents an organic-rich mudstone.
Energies 14 06154 g009
Figure 10. Summary plot showing the integration of log-derived reservoir properties, mechanical specific energy (MSE) log, and the laboratory analyses conducted on the drill cuttings. The nine segments were subdivided based on the lateral variations on the log-calculated petrophysical and geomechanical properties.
Energies 14 06154 g010
Figure 11. Colored images displaying the rock type classification conducted on SEM images from thin sections. The four examples (AD) represent the lithological variations over Segments 1 (A), 4 (B), 5 (C), and 8 (D). The drill cutting chips are colored by rock type (see legend). The shown porosity corresponds to log-calculated porosity.
Energies 14 06154 g011
Figure 12. SEM-BS images of rock chips classified as porous siltstones. Note the contrast between the visual porosity (dark spots) among the four rock chips.
Energies 14 06154 g012
Table 1. Core-measured reservoir properties from the reference Montney vertical well. The data correspond to core plugs collected on an equivalent interval to the landed horizontal well (shaded area in Figure 2).
SampleGrain Density (g/cm3)Porosity (%)Permeability (mD)Water Saturation (%)Quartz (wt%)Feldspars (wt%)Dolomite (wt%)Pyrite (wt%)Clays (wt%)
12.68--8.545.424.022.80.87.0
22.737.040.01789.647.218.529.31.13.9
32.692.070.00057.945.829.210.62.312.0
42.733.810.001513.142.122.326.11.48.2
52.701.860.00039.146.324.517.71.210.3
62.70--11.449.623.218.21.57.4
72.704.090.00187.245.428.314.32.49.7
82.714.980.002910.546.123.422.71.26.7
Min2.681.860.00037.242.118.510.60.83.9
Max2.737.040.017813.149.629.229.32.412.0
Average2.713.980.00419.746.024.220.21.58.2
Table 2. Summary of the log-calculated petrophysical and geomechanical properties for the nine segments identified along the well. The numbers in brackets are the range (min-max), and the number below the bracket is the average value for the segment.
Well SegmentGamma Ray (API)Porosity (%)Permeability
(mD)
Water Saturation (%)Young’s Modulus (GPa)Poisson’s RatioUCS (MPa)
1(88–130) 115(0.9–4.5) 2.6(0.00012–0.00165) 0.00036(10–30) 21(62.4–68.9) 66.3(0.24–0.28) 0.26(155–174) 164
2(81–125) 102(3.0–7.2) 5.3(0.00061–0.00568) 0.00248(7–17) 9(61.6–66.2) 64.0(0.23–0.27) 0.25(152–165) 158
3(85–145) 114(1.0–7.4) 3.6(0.00018–0.00617) 0.00086(6–26) 15(56.3–68.0) 61.3(0.25–0.29) 0.27(151–173) 157
4(77–148) 106(3.5–7.8) 5.4(0.00097–0.00715) 0.00262(7–15) 10(60.3–67.7) 64.0(0.21–0.27) 0.24(147–166) 155
5(83–128) 106(0.9–6.8) 3.3(0.00013–0.00491) 0.00067(9–30) 18(63.1–70.1) 66.3(0.20–0.28) 0.25(150–172) 163
6(80–119) 105(0.4–7.5) 3.9(0.00012–0.00648) 0.00112(7–30) 14(64.2–72.1) 68.2(0.22–0.30) 0.25(156–178) 169
7(81–128) 111(0.4–6.6) 4.2(0.00027–0.00464) 0.00136(8–25) 14(63.4–71.4) 66.8(0.23–0.28) 0.25(158–180) 166
8(88–133) 113(2.4–9.0) 6.3(0.00042–0.01054) 0.00496(7–24) 11(59.7–66.7) 64.2(0.23–0.27) 0.25(148–170) 158
9(94–146) 113(2.7–6.1) 4.3(0.00039–0.00361) 0.00142(11–24) 18(60.3–68.2) 64.0(0.22–0.27) 0.24(150–163) 156
Publisher’s Note: MDPI stays neutral with regard to jurisdictional claims in published maps and institutional affiliations.

