Abstract
Air pollution, which causes over seven million deaths per year, is the most significant and specifically related to health impacts. Nearly 90% of the urban population worldwide is exposed to pollution not meeting the World Health Organization guidelines for air quality. Many atmospheric carbon oxides, nitrogen oxides, and particulate matter emitting sources, such as inefficient energy and polluting transportation, directly impact health. Natural gas maritime transport from various parts of the world (carbon supplied to consuming areas) has become more critical. Natural gas liquefaction offers a cleaner and more efficient transportation option and also increases its storage capacity. It is expected that natural gas will reduce the human health impact compared with other traditional fuels consumed. This research establishes a life cycle assessment model of air emission and social human health impact related to LNG maritime transport to investigate the impact of each type of fuel used for the numerous maritime carriers. In order to build a model for air emissions and social human health impact assessments based on hypotheses on various unknown criteria, a calculation model is used. The results revealed Conventional-2 fuel type has the lowest human health impact for annual mode calculations, followed by Conventional-1, Q-Max, and finally Q-Flex. The analysis method for the per year demonstrated discrepancies in the relative human health impact due to the variation of the annual LNG demand by each destination and not only per the trip needs. The results show the importance of using a relatively cleaner fuel type such as Conventional-2 in reducing the health impact of LNG maritime transportation. Moreover, it shows differences in the air emissions as well as the human health impact based on the destination’s location and annual LNG demand.
1. Introduction
The development of industrial technology has allowed people to exchange products without barriers; seaborne trading has lead significantly to this trend. The growth in the number of goods shipped by carriers has contributed to a rise in fossil fuel utilization. About 10.7 billion tons of goods were exchanged by water in 2017, which constitutes an immense volume of energy use, thus increasing pollution. In this regard, the International Maritime Organization (IMO) has established a sequence of rigorous pollution control guidelines. In fact, Append VI Reg. MARPOL. 14 proposes a radical decrease in the sulfur content of maritime fuels starting in January 2020, where the sulfur substance of such fossil fuel is limited to 0.5% in non-emission control areas [1]. Since standard marine petroleum fuels cannot comply with these requirements, marine engineers and ship owners are turning their focus to alternative energy sources. Actually, liquefied natural gas (LNG) is known as a truly convincing alternative of maritime fuels that is capable of coping with the future air emission requirements for reducing carbon oxides (COx), hydrocarbons, particulate matter (PM), nitrogen oxides (NOx) and sulfur oxides (SOx). Consequently, LNG-fueled ships have been steadily integrated into the maritime trade, reaching more than 100 ships worldwide [2].
The principal exhaust emissions from ships significantly affect air quality and climate change, which are fundamentally international problems. The Paris Agreement acknowledges this as an imminent challenge and lays out the stabilization target of controlling the global temperature rise to less than 2 °C. Although greenhouse gas (GHG) emissions have grown exponentially, deep cuts are needed to accomplish this objective, where the shipping sector has gained traction in recent years. In 1997, the Kyoto Protocol handed down the IMO action to mitigate the carbon footprint from worldwide shipping. In 2011, the IMO adopted amendments to MARPOL ANNEX VI, the atmospheric pollution section of its environmental principle, by implementing the Energy Efficiency Design Index (EEDI) and the Ship Energy Efficiency Management Plan (SEEMP). However, these steps do not entirely resolve air pollution happening from the unquestionable expansion of shipping trade, which also necessitates a step-by-step reform in the industry. The IMO has established a plan to minimize the carbon footprint to identify the policy of the sector and its part in promoting the Paris Agreement. It also aims to evaluate the possibilities for reducing GHG emissions, including renewable fuels [3].
Many atmospheric carbon dioxide emitting sources, such as inefficient energy and polluting transportation, directly impact health. This observation forms an additional motivation to mitigate climate change. Air pollution, which causes over seven million deaths per year, is the most significant and specifically related to health impacts. Nearly 90% of the urban population worldwide was vulnerable to pollution not meeting the World Health Organization (WHO) standards for ambient air quality [4]. Therefore, a comprehensive approach to address all risks is required for the close connection between climate change and polluting activities, in addition to the inclusion of health benefits in climate change and national health plans and strategies [5].
Following the implementation of the Legislation on the Prevention of Air Pollution from Ships (Annex VI), several renewable maritime energy sources have been identified as encouraging possibilities for mitigating atmospheric contamination from carriers. In the meantime, the usage of alternative or renewable energy resources that can replace conventional fossil fuels, particularly heavy fuel oil (HFO), has been identified as a favorable approach to achieve environmentally friendly transport. In addition, growing people’s attitudes, commitment to environmental conservation, and enhancing air quality are essential to increase awareness towards sustainability.
LNG has demonstrated slightly improved efficiency than HFO in the environmental impacts of the life cycle, and LNG emits 92% fewer emissions than HFO [6]. This demonstration has created a substantial shift in the need for natural gas globally. Developments push companies to spend extensively on supply chains to accomplish effective global delivery of LNG. Demand for natural gas increased after numerous critiques of carbon emissions from coal-based power plants. The new natural gas consumers represent a two-thirds rise in the annual amount of natural gas usage [7]. The LNG trade and consumption have increased dramatically for the last 40 years. Accordingly, the economic status of the LNG has changed over time. The need for cleaner energy sources has contributed positively to the use and distribution of LNG manufacturing and economic growth worldwide [8].
The delivery of natural gas depends solely on pipelines and transmission networks between the supply and demand markets. Engineers currently work on advanced liquefaction and regasification technologies to tailor to an environmentally sustainable working climate [9]. The disparity in regional sector restrictions and constraints should not significantly impact the global market for natural gas. The efficiency of the supplier to distribute LNG packages at the appropriate period determines the amount of profit. Every year, the successful revolution in refining and distribution services increases the number of countries that consume natural gas [10]. Natural gas, unlike other fossil fuels, has its primary level of energy consumption projected to grow. According to recent global statistics, Qatar is the world’s greatest exporter of LNG, with an extensive market in countries like Japan, South Korea, and the United Kingdom [11].
Natural gas has appeared as the highly favored energy source nowadays. It anticipated good cost-effectiveness, superior success, and intrinsic environmental benignity. For overseas importing countries, transporting liquefied gas has several advantages over pipeline transport. LNG is cleaner than oil and coal and provides a chance to diversify electricity supplies. Therefore, the use of LNG in the gas market has gained considerable global attention. Natural gas transportation from multiple parts of the world (carbon supplied to consuming areas) has become more critical. Natural gas liquefaction offers a cleaner and more efficient transportation option and likewise raises its storage capacity. The liquefaction activity involves cooling the gas employing numerous cryogenic techniques and depressurizing to atmospheric conditions [12].
The social human health impact associated with air emissions from LNG maritime transport is explained by three hypotheses. The anticipated hypotheses explain the relationship of human health impact and the fuel consumption due to traveling distance, type of fuel, and type of carrier used for the LNG supply chain. It is expected that the use of natural gas as a fuel could reduce the human health impact with regards to the three hypotheses.
This research focuses on establishing a life cycle assessment (LCA) model for air emission and LNG maritime transport’s social human health impact. It explores creating a comprehensive social human health impact statistical structure by assessing the amount of air emissions. The urgency of building the proposed model is driven by the significant economic value, environmental implications, and clear LNG movement by maritime shipping for the current and future outlook. In order to build a model for air emissions and human health impact assessments based on hypotheses on diverse unknown criteria, a calculation model is used. This study provides a novel and realistic model to estimate the social human health impact of maritime natural gas transport. Excel is used to build up a CO2-eq, NOx-eq, and PM2.5-eq estimation model based on ReCiPe 2016 defined correlations. The proposed model covers the gap in the literature for the conversion of midpoint air emissions of maritime LNG transportation to endpoint human health impacts. Besides, this paper introduces a human health impact model for LNG transportation that considers the varieties of fossil fuel utilized by every single transportation ship. Hence, the ultimate intentions of the study are outlined as follows:
- Establishing a methodology of air-related pollutants footprint and social human health impacts LCA of maritime transport. The case of LNG trade is considered.
- Developing a model for the quantification of midpoint air emissions (CO2-eq, NOx-eq, and PM2.5-eq) by LNG shipping vessels.
- Proposing the method of converting the midpoint air emissions to human health endpoint impacts for various hydrocarbon commodity-shipping disciplines.
The remainder of the paper is arranged in sections. Section 2 reflects the LNG maritime shipment literature analysis and the significance of air emissions and human health impacts on LCA. Section 3 highlights the procedures employed and techniques taken into account in the study. The methods of calculating the air emissions by the various vessels and fuel types and converting them using different employed factors to midpoint emissions and endpoint human health impacts are analyzed. Section 4 explains the findings of the study in terms of midpoint emissions and endpoint human health impacts. Finally, the conclusion and recommendations of the study are summarized in Section 5. This section also provides details on the limitations and future work in connection with this study.
2. Literature Review
One of the critical present-day challenges facing the global community is the need to meet the rising energy demand while at the same time achieving very substantial reductions in GHG emissions associated with energy output, transmission, and use. In addition, the energy sector is transforming through electricity, transport, industrial convergence, and inter-sectoral integration. Jang et al. [13] investigated the LNG contribution to the reduction of environmental releases, specifically in maritime transport. Parametric trend LCA was used for the study. More than 7000 ships for several uses have been covered under different scenarios. It was observed that LNG shows better performance than other fuels in the case of using low-speed with high-pressure dual-fuel engines. However, further study and optimization work is required for different engines to provide more assurance in utilizing the LNG as fuel.
Moreover, more research was carried out by Al-Breiki and Bicer [14] to establish a comparative LCA of numerous energy carriers. These energy carriers include LNG and other such natural or renewable fuels. The LCA contained the manufacturing, storing, and transporting of these fuels until the final use by customers. The results show that LNG still signifies a more promising and environmentally friendly option than other fuels such as methanol and dimethyl ether, considering the overall fuel life cycle. Song et al. [15] concentrated on LNG and diesel emissions from heavy-duty boats, as well as China’s energy consumption. They discovered that around 8.0% of GHG has the potential to be reduced if LNG is used instead of diesel.
Natural gas is difficult to distribute and store because of its physical properties. Natural gas is most commonly delivered to customers by pipeline grids or LNG carriers. LNG stands for natural gas in the liquidized phase that has been condensed and cooled to a temperature less than −160 °C [16]. LNG is a mixture of descending quantities of methane, ethane, and propane. According to researchers, liquefaction decreases the volume of gas by about 600 times, making production and warehousing processes easier [17]. Lindstad and Rialland [18] researched the GHG releases for well-to-wake (WTW) LCA that are related to LNG and some other conventional energy sources for shipping purposes. The findings and recommendations stated compliance adaptation requirements to reduce the carbon footprint. Donev [19] describes LNG transportation as “any attempt to ship or transfer natural gas in its liquidized phase”. Natural gas transportation is limited to just two options. It is delivered as LNG by piping channel or by maritime carriers. When it comes to delivering the gas fuel to far customers, deep-sea ships transporting LNG are more cost-effective than a network of offshore pipes. LNG shipping has a unique requirement in the global economy compared to pipeline gas due to reasons such as energy security, operating maintenance, political constraints, etc. [20]. Methane, which makes up 90% of the overall composition of natural gas, is the essential component. Natural gas leaks have detrimental consequences for ecological processes and human health from a socio-environmental perspective, and methane is one of the global warming pollutants that require prevention from releases to the environment [21].
The LNG industry attracts a large number of researchers who study its long-term viability. As an example, Barnett [22] researched the environmental effects of LNG manufacturing, shipping, and regasification processes. Tamura et al. [23] concentrated on carbon footprint and further contaminants released through LNG processing and transmission. Kameyama et al. [24] are dedicated to the production of LCA computer models for carriers. They looked at the Life-cycle Inventory (LCI) and the LCI basis for various operations and shipbuilding facilities. Using LCI, they created a list and tools to help in carrier analysis. LCI includes a comprehensive study assessment of the par. The supply chains for LNG production and distribution are complex, necessitating using a systemic environmental analysis method.
LCA is a method for evaluating several life cycle stages’ ecological effects and properties, including material acquisition, use, and disposal [25]. ISO 14040:2006 describes the principles and framework for LCA, including the key stages: aim and scope definitions, assessment of LCI, and comprehension of the life cycle’s effects [26]. This methodology is extensively used in practice and addresses diverse ecological issues, including air emission substances. In 2015, Shi et al. [27] performed another survey, concentrating on the environmental impact of a newly produced diesel-powered engine. The researchers also calculated the environmental effect of the replicated LNG engine over its entire life cycle as part of the LCA. Korre et al. [28], in their research, applied LCA to examine the practices involved in gas delivery and the production of renewable energy resources. Their results indicate that they took into account the method for storing and extracting carbon dioxide gas.
Lindstad et al. [29] investigated the conditions of having the LNG as potential fuel that is considered with a lower carbon footprint in maritime transport. It was found that employing suitable engine technologies is an important phase in the design and implementation stages. It plays a major role in maximizing GHG reductions. Furthermore, the recent regulations in the pollution prevention journey increased the innovation in engine technologies. Biswas et al. [30] looked at the carbon emissions associated with LNG output and distribution in Western Australia. They focused on LNG distribution to markets in Australia, such as China, in this research. GHG emissions are much lower during LNG distribution than during other phases, including exploration and separation. Jaramillo et al. [31] studied the estimate of GHG, sulfur, and nitrogen oxide emissions from electricity generation and their life cycle, focusing on releases from naturally occurring gas, LNG, and additional energy options. The researchers compared the LCA of air emissions from various energy sources to assess the advantages and disadvantages of using fuel to generate electricity in contrast to domestically produced natural gas.
Carbon footprints during transportation have negative impacts on the quality of the environment. Customized planning, scheduling, and route maps of LNG deliveries are some of the innovations with the potential of reducing the carbon footprint, mainly by lowering the traveling distance or the delay time [32]. Furthermore, long-term contracts for LNG supply and deliveries are among the most viable ways to significantly impact the reduction of relative carbon emissions [33]. The other notable move to consider is a transition to low-sulfur marine, which aims to achieve the objective of the Paris Agreement about minimizing average warming to levels below 2 °C. By applying significantly innovative solutions, stakeholders can meet the global target to make shipping the minimum contributor to environmental pollution. These strategies include the introduction of energy-efficient systems, customizing ship designs through invention and innovation, creating conducive ship operational services, as well as the utilization of carbon-neutral maritime fuels to minimize greenhouse gas emissions [6]. It’s crucial to keep in mind that Marine Gas Oil (MGO), LNG, and HFO are the maritime energy sources we rely on now and even in the future. However, ship owners should agree to switch to lower impact fuels while enhancing sustainability in the maritime industries [9].
Furthermore, Shively and Ferrare [34] indicate that large vessels are not always suitable since they require a port with deep water of about 40 feet as well as a vast area to provide the ships with turning space. These provisions are not available in many ports. Therefore, this reason makes small vessels sometimes preferable since they appear to be more flexible, and many ports in the world can accommodate these types of vessels [9]. Even the tiny vessels have a significant effect on global climate change, mainly because they emit GHG. Harrould-Kolieb [35] indicated that 90% of global trade relies on these marine vessels that fleet through international waters, making them a significant determinant of global climate change. This condition drew the attention of international agencies that have since set up rules and regulations for shipping operations to control the effect of shipping emissions on the environment.
The measures aim at involving shipping in a way that does not cause accidents affecting shipping safety and security in LNG delivery. The United Nations aims to ensure high standards in the manufacture of vessels and safe and secure ships’ operations. In addition, this agency works to reduce or stop the unacceptable impacts on human well-being and the climate. All local and international LNG vessels must meet the conditions of standards set by this agency to control the expected environmental and human health impacts [36].
Researchers have also compared fuel alternatives in other transport mechanisms. For example, Cooper et al. [37] has studied the LCA of UK truck fuel alternatives, including electric trucks, dimethyl ether, biodiesel, diesel, and natural gas. The LCA evaluated the impacts of the different fuel alternatives on resource depletion, human health, air quality, land-use change, and climate change. The results indicated that natural gas could reduce the impacts from the UK freight sector on climate change up to 33% lower per km and engine production per kWh is down by 12%. Natural gas registered lower emissions for all metrics than diesel (11–66%) with respect to other impacts. However, particulate matter, methane, and CO emissions surpass air quality limit standards defined for UK vehicles. Electric and bio-diesel vehicles indicated better results in global warming. However, they considered them lowest in terms of metals depletion, human toxicity, air quality, and land use indicators.
To perform the LCA studies and have a better understanding of human health impacts that are related to air emission from several sources, ReCiPe 2016 provides a harmonized implementation of cause-effect routes by calculating the midpoint and endpoint characterization factors (CFs) [38]. As a result, the ReCiPe CFs can be used for the global scale human health impact estimation. Other than human health, ReCiPe 2016 offers the possibility to perform LCA with CFs for water use, acidification, freshwater eutrophication, fine particulate matter formation, and ozone formation [39].
To this end, this research builds an LCA model for the air emissions and social human health impact of LNG maritime transport. It establishes a detailed mathematical framework for quantifying the midpoint air emissions and convert them into endpoint social human health impact based on uncertain assumptions of LNG shipping vessels and fuel types. The model takes into account the tonne of LNG shipped as the functional unit.
3. Methodology
This section focuses on the research structure. It starts with data obtained from public domains and earlier research by Aseel et al. [40]. Then, total fuel consumption from the exporting terminal to the receiving terminals and the return trips were calculated. This part of the research is essential as the emission factors are applied to measure the overall amount of gases released by different vessels during a single roundtrip. Finally, CFs are used to convert the mid-point environmental emissions into endpoint human health impacts representing the daily loss of life (DALY). Figure 1 demonstrates the step-by-step research method.
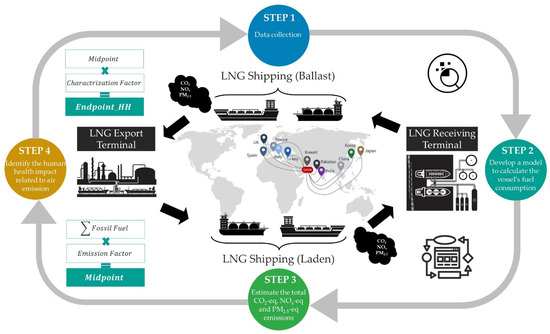
Figure 1.
The main four steps of the research methodology.
The first step starts with data collection, including these items: the annual LNG demand for Qatar’s main customers, carrier’s design details and capacities, traveling distances and ports details, laden and ballast traveling details and their relevant fuel consumption during each operation process, and the ballast water loading and unloading details. This research selected four specific types of ships by considering actual ship transits from departure port to 11 destinations. The model reflects the nature of the carriers and their suitable fuel type. Mixing of such ships to a destination was not deemed for the per roundtrip and per year emissions. The second step contains developing a modeling tool to measure the carrier’s fuel consumed for multiple situations involving 11 different destinations worldwide. In the third step, the average CO2-eq, NOx-eq, and PM2.5-eq pollutants are then calculated utilizing the total fuel consumed and the relevant emission factors. The fourth step presents CFs from ReCiPe 2016 to convert the environmental emissions to endpoint human health impact. CO2-eq, NOx-eq, and PM2.5-eq represent the critical pollutants related to human health impact as per ReCiPe 2016 that are expected to occur during maritime LNG transportation. The rest of the emissions defined in ReCiPe 2016 can be neglected, as they don’t have a critical contribution towards human health impact in maritime LNG transport.
3.1. Estimation of Air Emissions
3.1.1. Data Gathering and Assumptions
As shown in Figure 2, the proposed tool for air pollution footprint accounting was used for LNG trade between 11 different destinations of Qatar’s LNG key customers. Qatar was chosen because of its high LNG production rate and ability to export LNG to other countries through maritime transport. Furthermore, Qatar Petroleum (QP) declared the North Field Expansion (NFE) mission in November 2019, which will raise Qatar’s LNG output capability to slightly more than 100 million tons per annum (MTPA) as the first expansion phase. The second phase is to increase 126 MTPA, known as the North Field South (NFS) mission, reflecting around a 63% increase compared with the current capacity [41]. Asian countries represented by China, Korea, India, and Japan are the highest beneficiary of Qatar’s LNG export at 17, 14, 12, and 11%, respectively [42].
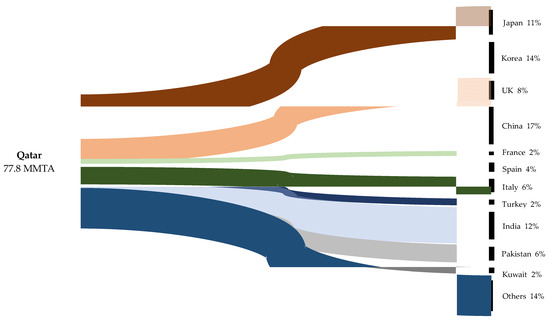
Figure 2.
Qatar LNG’s current production and the demand of the main 11 destinations.
Several air emissions accounting methods determine the actual fuel consumption systems available today for LNG carrier operators. In this research, gathering the required data and specifying the assumptions are the first steps in calculating the emissions value for each vessel as follows:
- The maritime path distance between Ras Laffan Port (Qatar) and other destinations is found from [43].
- Emission evaluation for different fuel types is also available per vessel type; those are HFO and LNG.
- The traditional vessels have two modes of operation. The first mode operates on a dual-mode system. The dual system is able to operate using HFO and LNG. Besides, the ship uses the boiled gases from the storage as fuel and other forms of fuel oil.
Cargo Boil-off Gas (BOG) is an unavoidable phenomenon resulting in more vessel’s internal pressure. The second mode is when the vessel is solely powered by LNG, with natural and enforced BOG depending on the carrier’s requirements.
Each LNG fleet’s capacity used in the research is displayed in Table 1:

Table 1.
Q-Flex, Q-Max, and Conventional carriers’ loading capacity.
3.1.2. Total Fuel Used for Q-Flex and Q-Max Carriers
Since LNG is not currently applicable for this type of vessel as a fuel, Q-Flex, and Q-Max just utilize HFO fossil fuel forms. Equation (1) below gives the total LNG loading capacity estimate [44], A:
where xi denotes total LNG loaded and B denotes gross calorific value. For each type of vessel, this formula is used to determine the A. Unit conversion is required to have consistency and correct calculation. The computations in this research are established on a set of assumptions. The first is the count of days while loading the ship (y1) is considered as one day. Second, the steam process time (y2) is estimated using the following Equation (2):
Third, at anchorage duration (y3) is assumed as 1.5 days average. Fourth, the overall canal period and passing time (y4) is the total waiting, and the passage periods during each roundtrip are estimated to be around 1.8 days as average. Fifth and finally, the discharge duration (y5) is assumed two days as average.
Several parameters have been assumed and considered to measure the quantity of fuel consumed for each point of the voyage days, as shown in Equations (3) and (4):
RL represents the reliquification level, and FCR is the rate of fuel consumed during the steaming phase. The sum of days at each point is multiplied by the corresponding consumed quantity. Equation (5) below determined the total fuel consumed, Q, for the roundtrip scenario:
where I denotes the laden path and j denotes the ballast path. Z1 denotes fuel consumed during vessel loading, z2 denotes fuel consumed due to the steaming operation, z3 denotes fuel consumed during the anchorage stage, z4 denotes fuel consumption during the canal passing, and z5 denotes fuel consumed during the discharging phase.
3.1.3. Total Fuel Used for Conventional-1 and Conventional-2 Carriers
The similar computations from the prior section will be replicated for the vessel styles Conventional-1 and Conventional-2, with the addition of the gas boiled-off estimates, BO, that occurs in these kinds of carriers. Conventional-1 could use both HFO and LNG as fuel. However, Conventional-2 can use LNG as a fuel option only. Equations (6)–(8) are used to calculate it.
CC stands for conventional loading capability, BOR stands for boil-off rate, and NOB stands for the total net outbound bunker.
Turning towards the conventional carrier that can only use LNG for bunkering; here both natural boil-off and forced boil-off are considered. Equations (9) and (10) are used to measure the quantity:
Using Equation (11), the total LNG boil-off, BOTotal, will be needed to measure the emissions. LNG density is multiplied by the summation of both BONatural and BOForced.
For every ship type, the air emissions calculation methodology is assessed in the model following Figure 3. Emission factors for global warming emissions equivalent (CO2, CH4, and N2O), photochemical ozone formation equivalent (NOx and NMVOC), and fine particulate matter formation equivalent (NH3, NOx, SO2, and PM2.5) are considered.
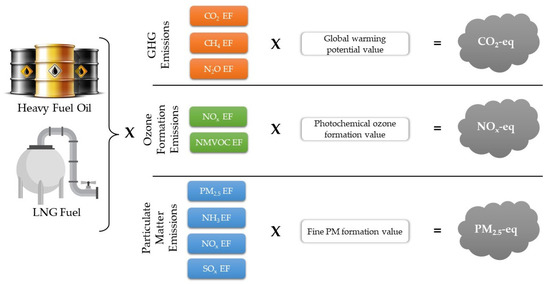
Figure 3.
The calculation methodology for CO2-eq, NOx-eq, and PM2.5-eq.
3.1.4. Emission Factors
The amount of fuel and air emissions vary based on the fuel’s nature and content. According to Cooper and Gustafsson [45], researchers determined emission factors for a category of pollutants released from various carriers. Table 2 illustrate the carrier type, engine type, and fuel type used by Cooper and Gustafsson to establish the emissions factors:
Table 2.
Carrier type, engine type, and fuel type.
The emissions generated from the shipping division are determined by the amount and composition of a specific component in the fuel, such as sulfur, nitrogen, etc., during the combustion procedure through transportation of LNG products. Accordingly, precise emissions calculations must be made by considering the sum of fuel burned and the latest emission factors to estimate the midpoint and endpoint impacts. Equation (12) present the calculation way considered:
where AEF is the air emission footprint determined, EF is the emission factor of the air pollutant, and FF is the fossil fuel consumed trip-wise. The fuel’s compositions and their emissions factors assumed constants according to the published research by Cooper and Gustafsson [45].
3.1.5. Annual Air Emissions Footprint
The annual air emissions footprint is calculated based on each destination’s annual LNG demand. First, the yearly LNG product is shipped to be converted into volume units per Equation (13).
Second, the annual volume is divided into each carrier safe loading volume to estimate the annual number of roundtrips. See Equation (13):
Third and finally, Equation (15) explains the annual air emission footprint estimation by multiplying the yearly number of roundtrips by the total air emissions per roundtrip.
3.2. Mid-Point to End-Point
To measure the effects, midpoint and endpoint LCA approaches look at different stages in the cause-effect chain. The endpoint analysis examines the environmental effects down the road as the final impact. On the other hand, a midpoint approach considers the impact earlier in the cause-and-effect chain before the endpoint is extended. The effect on human wellness, ecology quality, and resources reduction are typically seen as endpoint outcomes.
In this study, the calculated air emissions footprints of LNG trade between 11 different destinations of Qatar’s LNG main customers have been used to estimate the emission equivalence of CO2, NOx, and PM2.5 global potential in human health. The conversion of global warming CO2-eq, ozone formation NOx-eq, and particulate matter PM2.5-eq to endpoint human health equivalence is achieved following Equation (16), where the midpoint hierarchic is calculated first. The hierarchic scenario uses a 100-year time horizon to estimate the impacts using the ReCiPe database. Then the Human Health impact is calculated based on the CFs. The ReCiPe 2016 model is utilized in this study to measure the human health equivalence. The ReCiPe model can estimate the midpoint and endpoint values meaning to detect the impact on human health and provide the decision-maker more detailed knowledge in the intervention to minimize human health effects [38].
where is the human health impact, are the CO2-eq, PM2.5-eq, and NOx-eq values of the emitted substances and is the characterization factor, as defined in Table 3. The conversion of global warming potential (CO2-eq), fine particulate matter formation (PM2.5-eq), and photochemical ozone formation (NOx-eq) to human health equivalence are achieved following Equation (13), where the CO2-eq, PM2.5-eq, and NOx-eq are calculated first for emitted substances. Then the Human Health impact is determined based on constant factors developed by ReCiPe 2016. These factors are named as characterization factors and defined in Table 3. The calculation is done based on the annual cumulative emissions estimated following the Aseel et al. [40] approach while accounting for the yearly demand and delivery by LNG fleets, distance, type of vessel, vessel engine design and performance, and finally on the fuel type.
Table 3.
Midpoint to endpoint human health CFs.
From the above table, it is clear that the Hierarchic CF for the PM2.5-eq is more than the rest by a factor of 1000 difference which indicates a more serious impact when particulate matter exists in the atmosphere and can cause much more serious human health problems.
4. Results and Discussion
Following the defined methodology, the entire quantity of CO2-eq, NOx-eq, and PM2.5-eq for each carrier type is calculated using Excel. The equivalent footprint values vary from one vessel/fuel to another. The results are discussed on two scales; the midpoint and endpoint values and the overall human health impact.
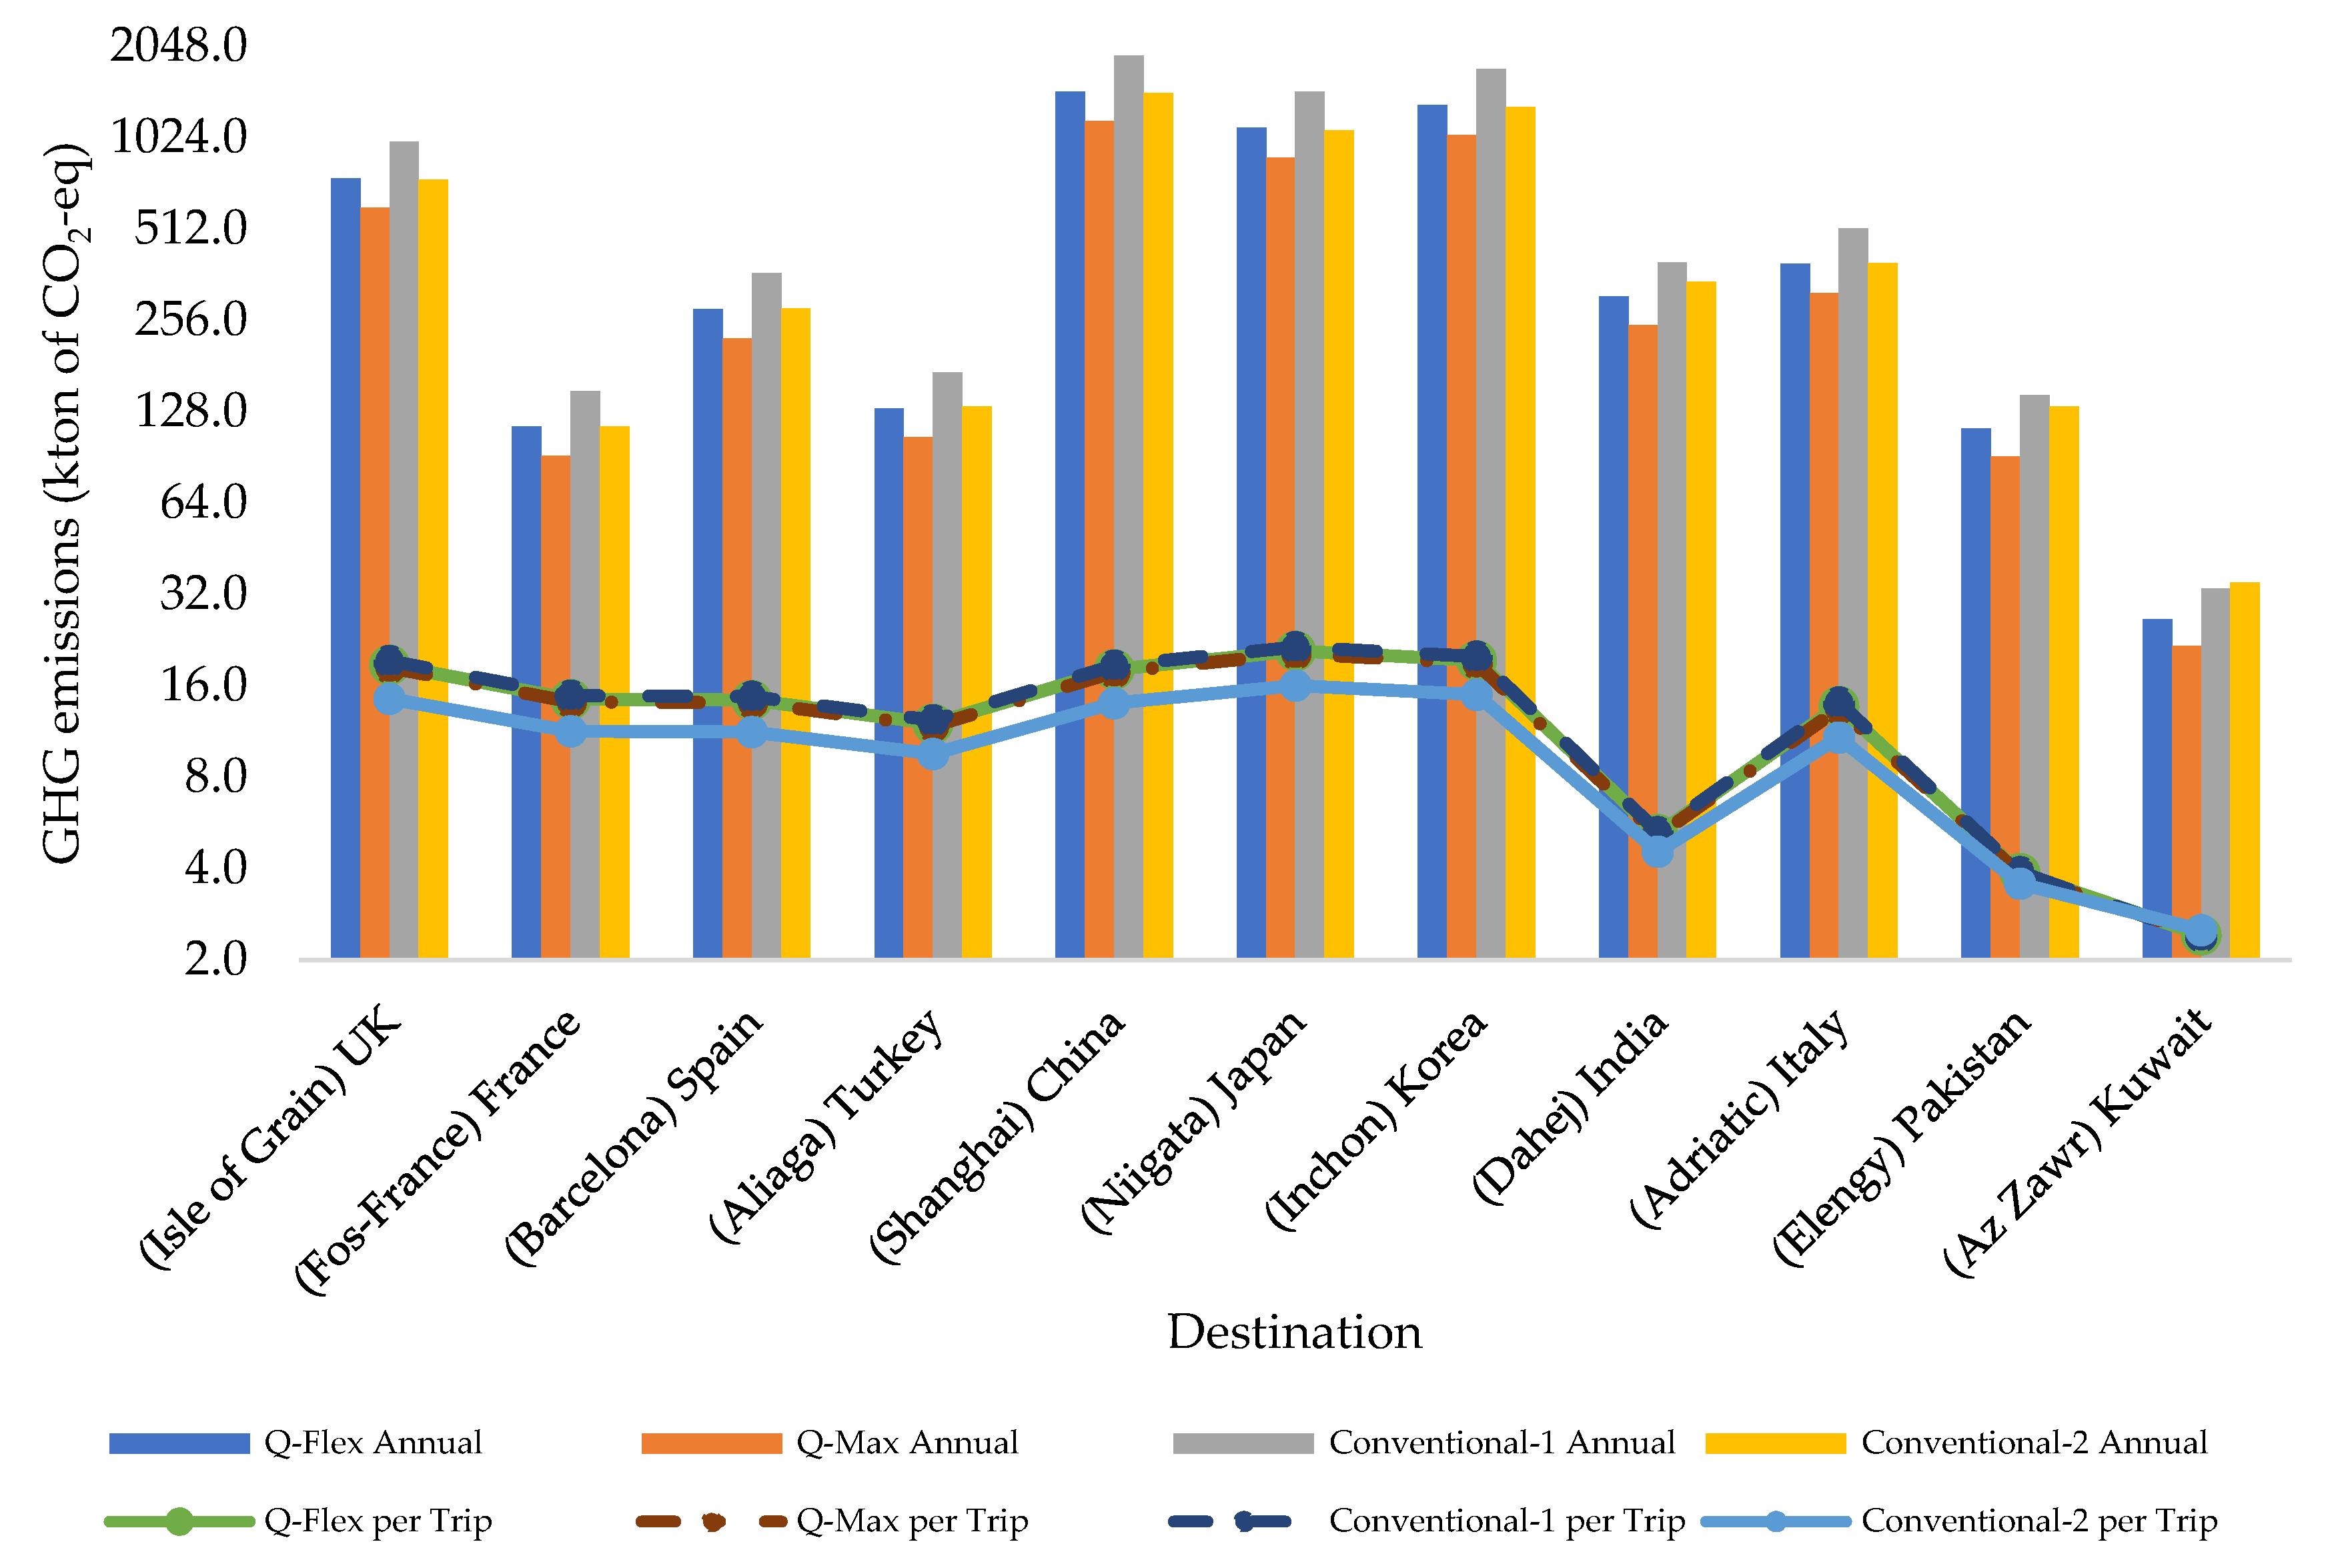
4.1. GHG Emissions
The results of the GHG emissions correlated with the type of fuel used and the supply destination are summarized in Figure 4 for both the annual and per roundtrip emissions. Kuwait has demonstrated the lowest CO2-eq emissions for both the yearly and per roundtrip values given the short destination from the origin (Qatar). Whereas Japan has been shown the highest per roundtrip CO2-eq emissions, China has indicated the highest annual CO2-eq emissions. Conventional-2 showed the lowest per roundtrip CO2-eq emissions in terms of fuel type, followed by Q-Max, Q-Flex, and finally Conventional-1. However, the annual CO2-eq emissions demonstrated different results, with Q-Max having the lowest CO2-eq yearly emissions followed by Q-Flex, Conventional-2, and Conventional-1. These results indicated the general trend with some exceptions for the case of Kuwait. Hence, the results can be proposed to use Q-Max or Q-Flex fuel types for short distances trips. Whereas, for long distances, it is better to use Q-Max or Conventional-2.

Figure 4.
CO2-eq emission results for the roundtrip and annual.
Moreover, the annual results are strongly influenced by the number of trips per year. As a future alternative, using larger fleet capacities for Conventional-1 and Conventional-2 fuel types have the potential to reduce the required number of roundtrips and the associated CO2 emissions when comparing with the existing Q-Flex and Q-Max carriers. For the old carriers, further technical solutions with cost-benefit analysis could be taken to enhance the existing fleet to meet the environmental limits by IMO and promote the overall emission reduction.
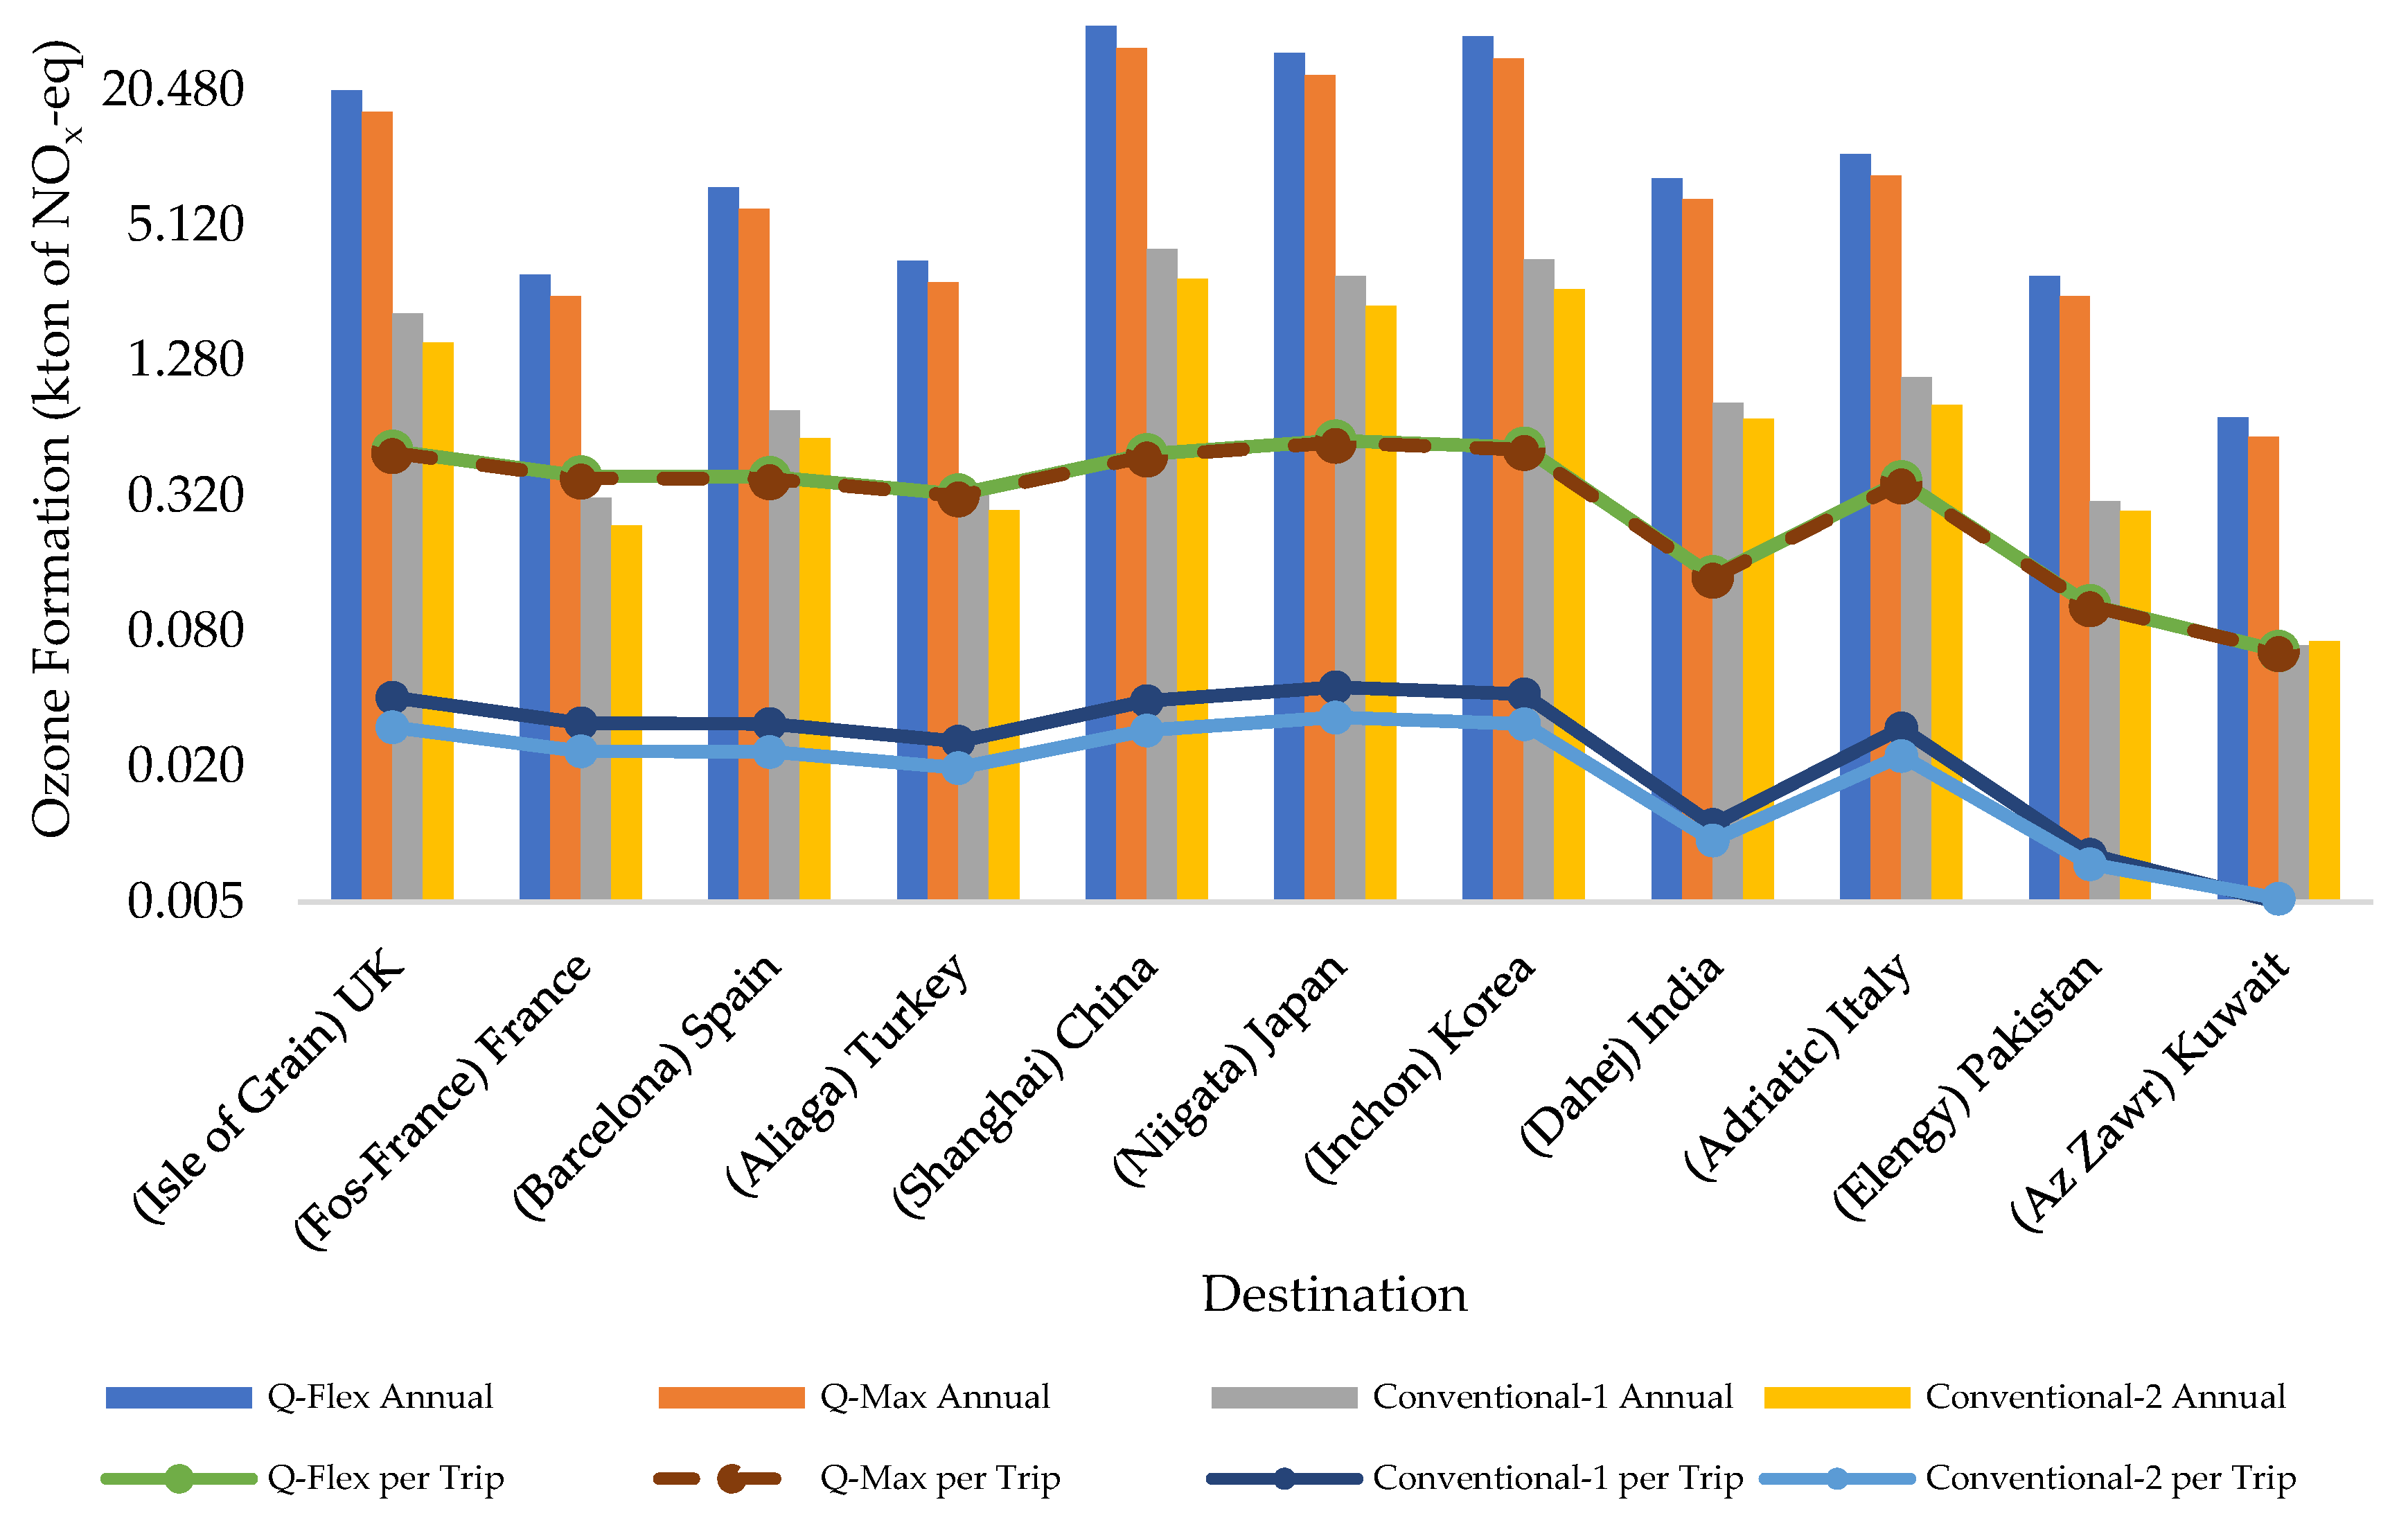
4.2. Ozone Formation Emissions
Similarly, the ozone formation emissions results have revealed differences based on the type of fuel used and the supply destination, as summarized in Figure 5. Kuwait has demonstrated the lowest NOx-eq emissions for both the annual and per roundtrip values given the short destination from the origin (Qatar). On the other hand, Japan has demonstrated the highest per roundtrip NOx-eq emissions, and China has indicated the highest annual NOx-eq emissions. Conventional-2 indicated the lowest per roundtrip NOx-eq emissions in terms of fuel type, followed by Conventional-1, Q-Max, and finally Q-Flex. However, the annual NOx-eq emissions which are influenced by the number of trips yearly, demonstrated different results, with Conventional-2 having the lowest NOx-eq yearly emissions followed by Conventional-1, Q-Max, and Q-Flex. These results indicated the general trend with some exceptions for the case of Kuwait as it has the shortest traveling distance. Hence, it can be advised to use Conventional-1 fuel types for short-distance trips from the findings. Whereas, for long distances, it is better to use Conventional-2.
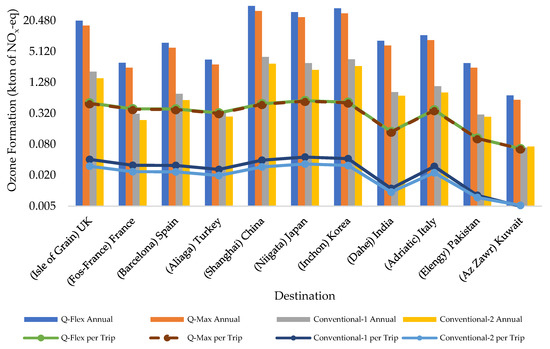
Figure 5.
NOx-eq emission results for the roundtrip and annual.
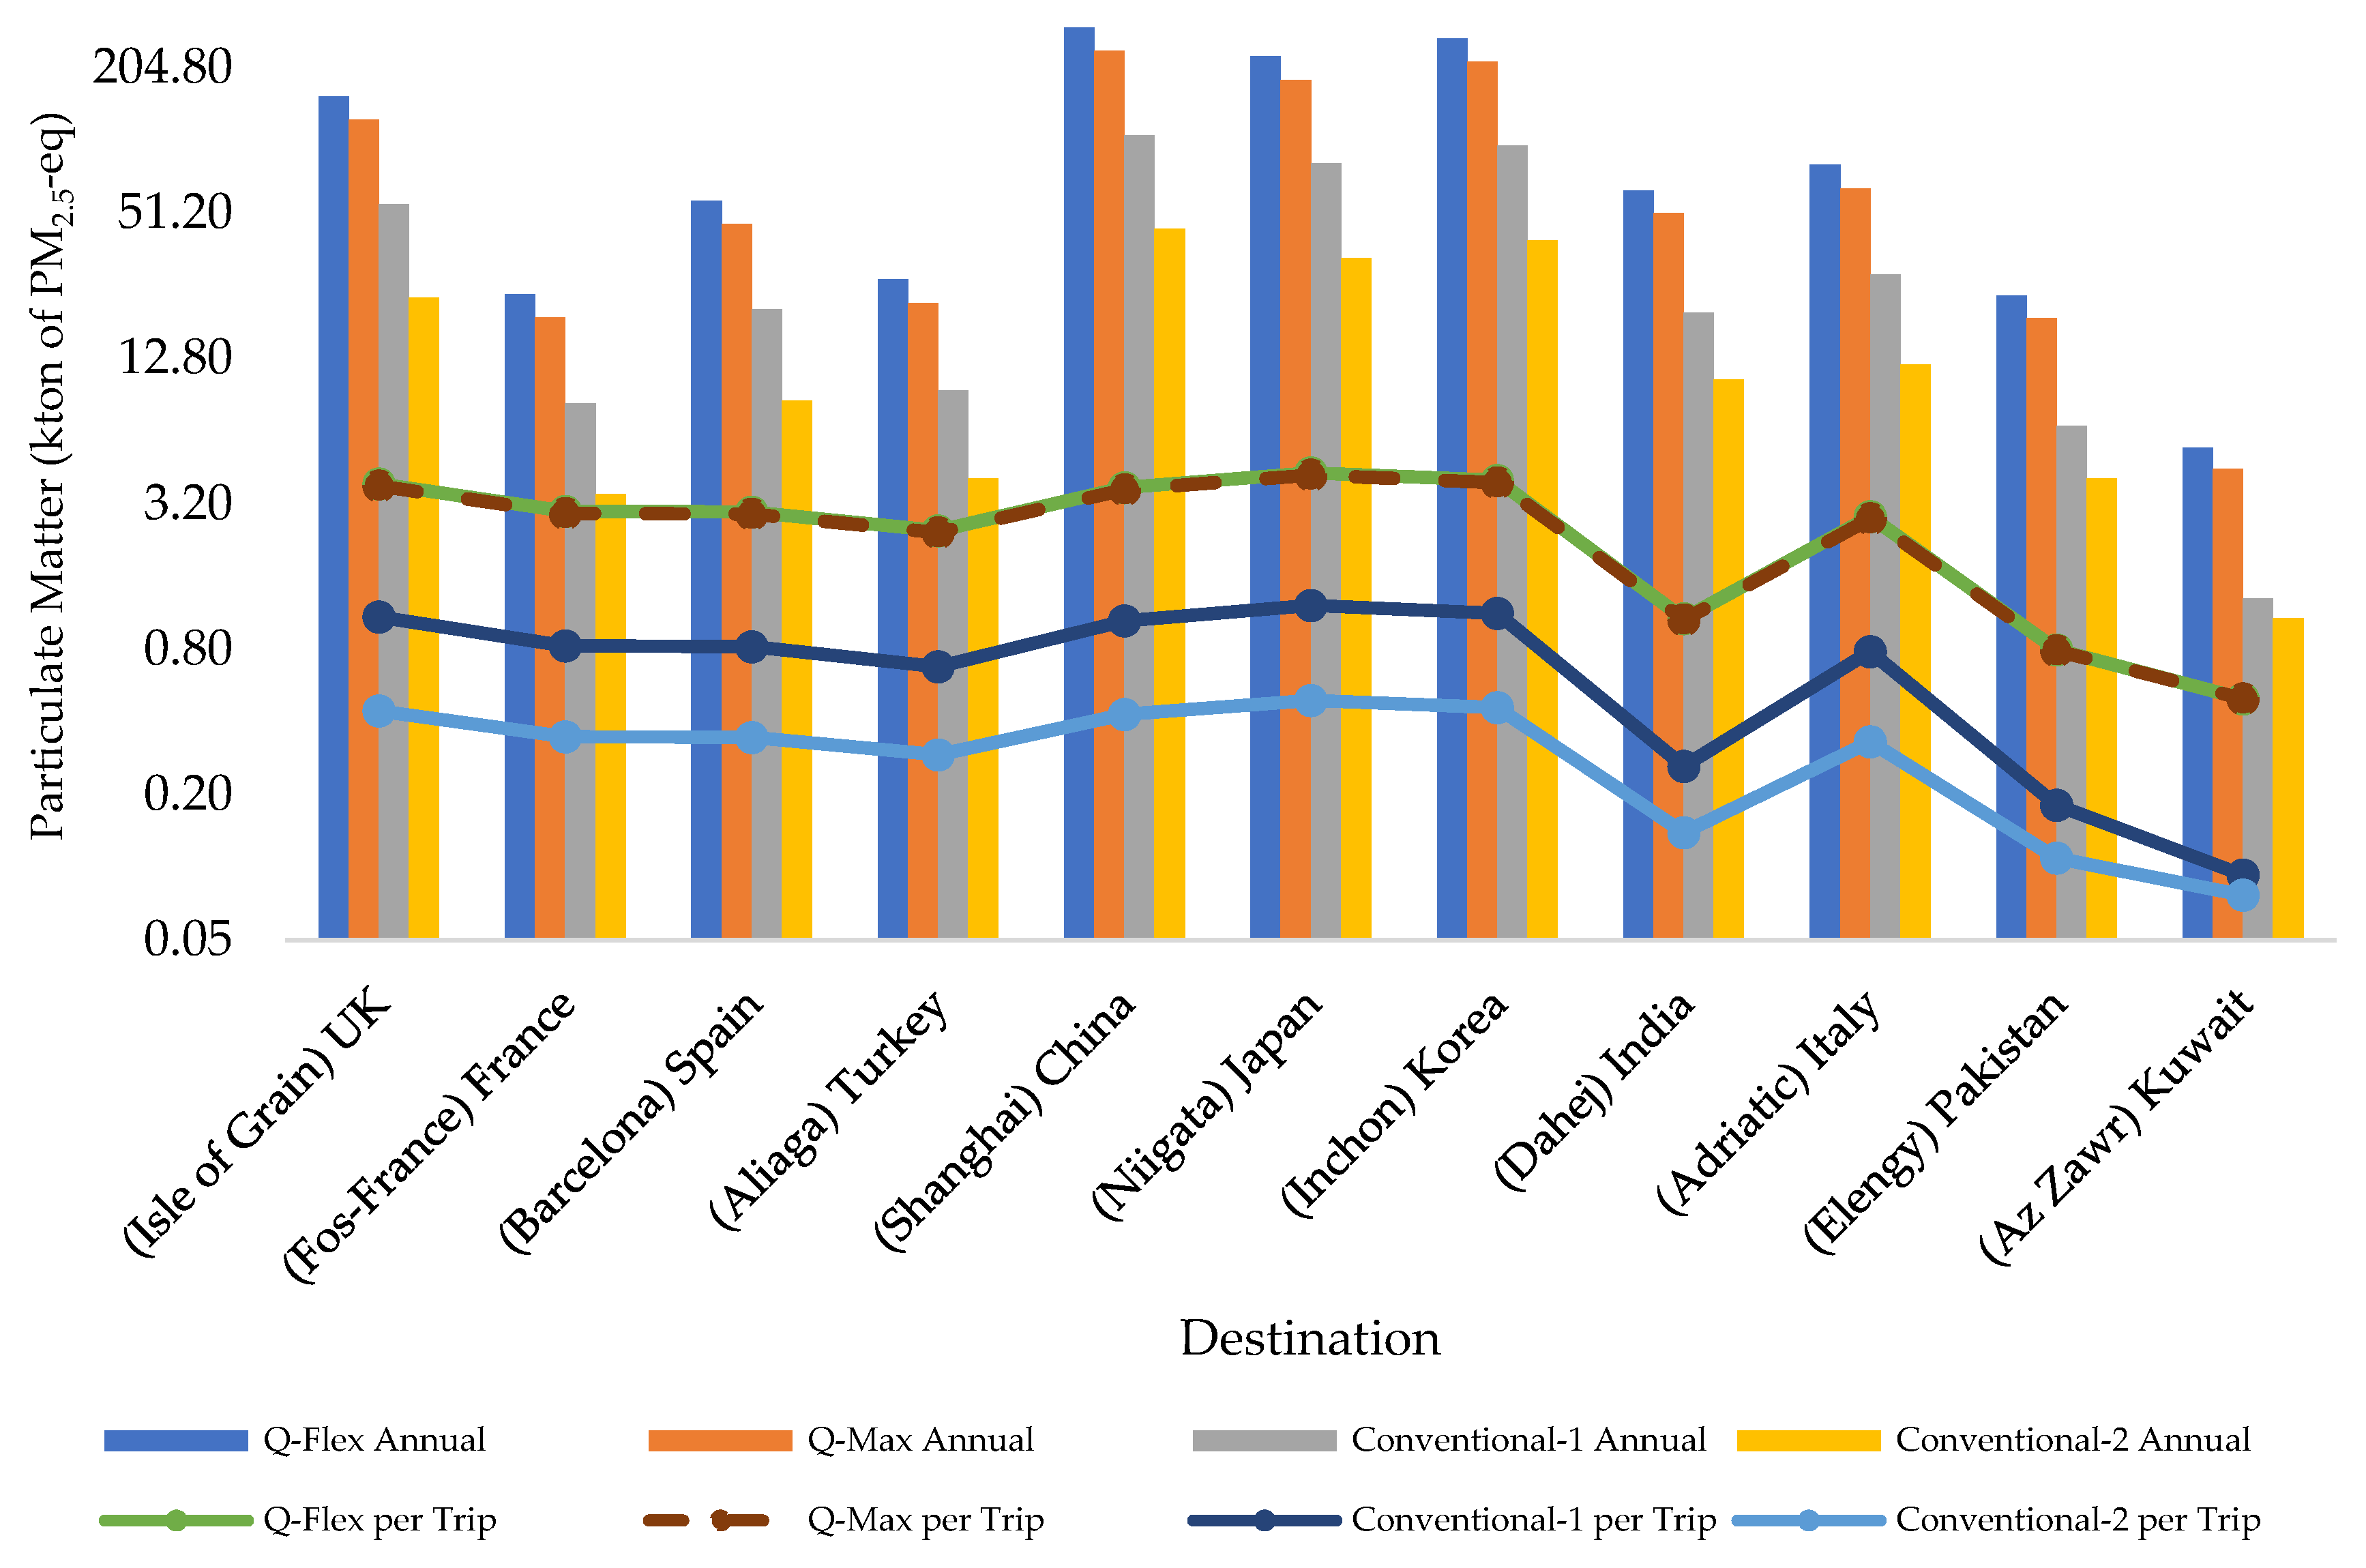
4.3. Particulate Matter Emissions
The third type of emissions results, particulate matter, as illustrated in Figure 6, have revealed more distinguishable observations as per the type of fuels used and the supply destination. Kuwait has demonstrated the lowest PM2.5-eq emissions for both the annual and per roundtrip values given the short destination from the origin (Qatar). On the other hand, Japan has demonstrated the highest per roundtrip PM2.5-eq emissions, and China has indicated the highest annual PM2.5-eq emissions. Conventional-2 indicated the lowest per roundtrip PM2.5-eq emissions in terms of fuel type, followed by Conventional-1, Q-Max, and finally Q-Flex. However, the annual PM2.5-eq emissions demonstrated different results, with Conventional-2 having the lowest PM2.5-eq yearly emissions followed by Conventional-1, Q-Max, and Q-Flex. These results indicated the general trend for all the destinations, and the distance plays a significant factor in the variation of emissions. Hence, from the results, it can be suggested to use Conventional-2 fuel types for short and long distances associated with lower PM2.5-eq emissions.
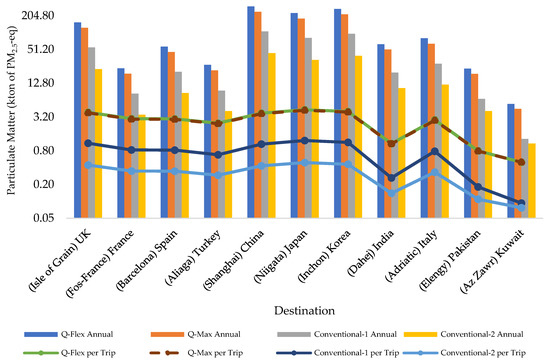
Figure 6.
PM2.5-eq emission results for the roundtrip and annual.
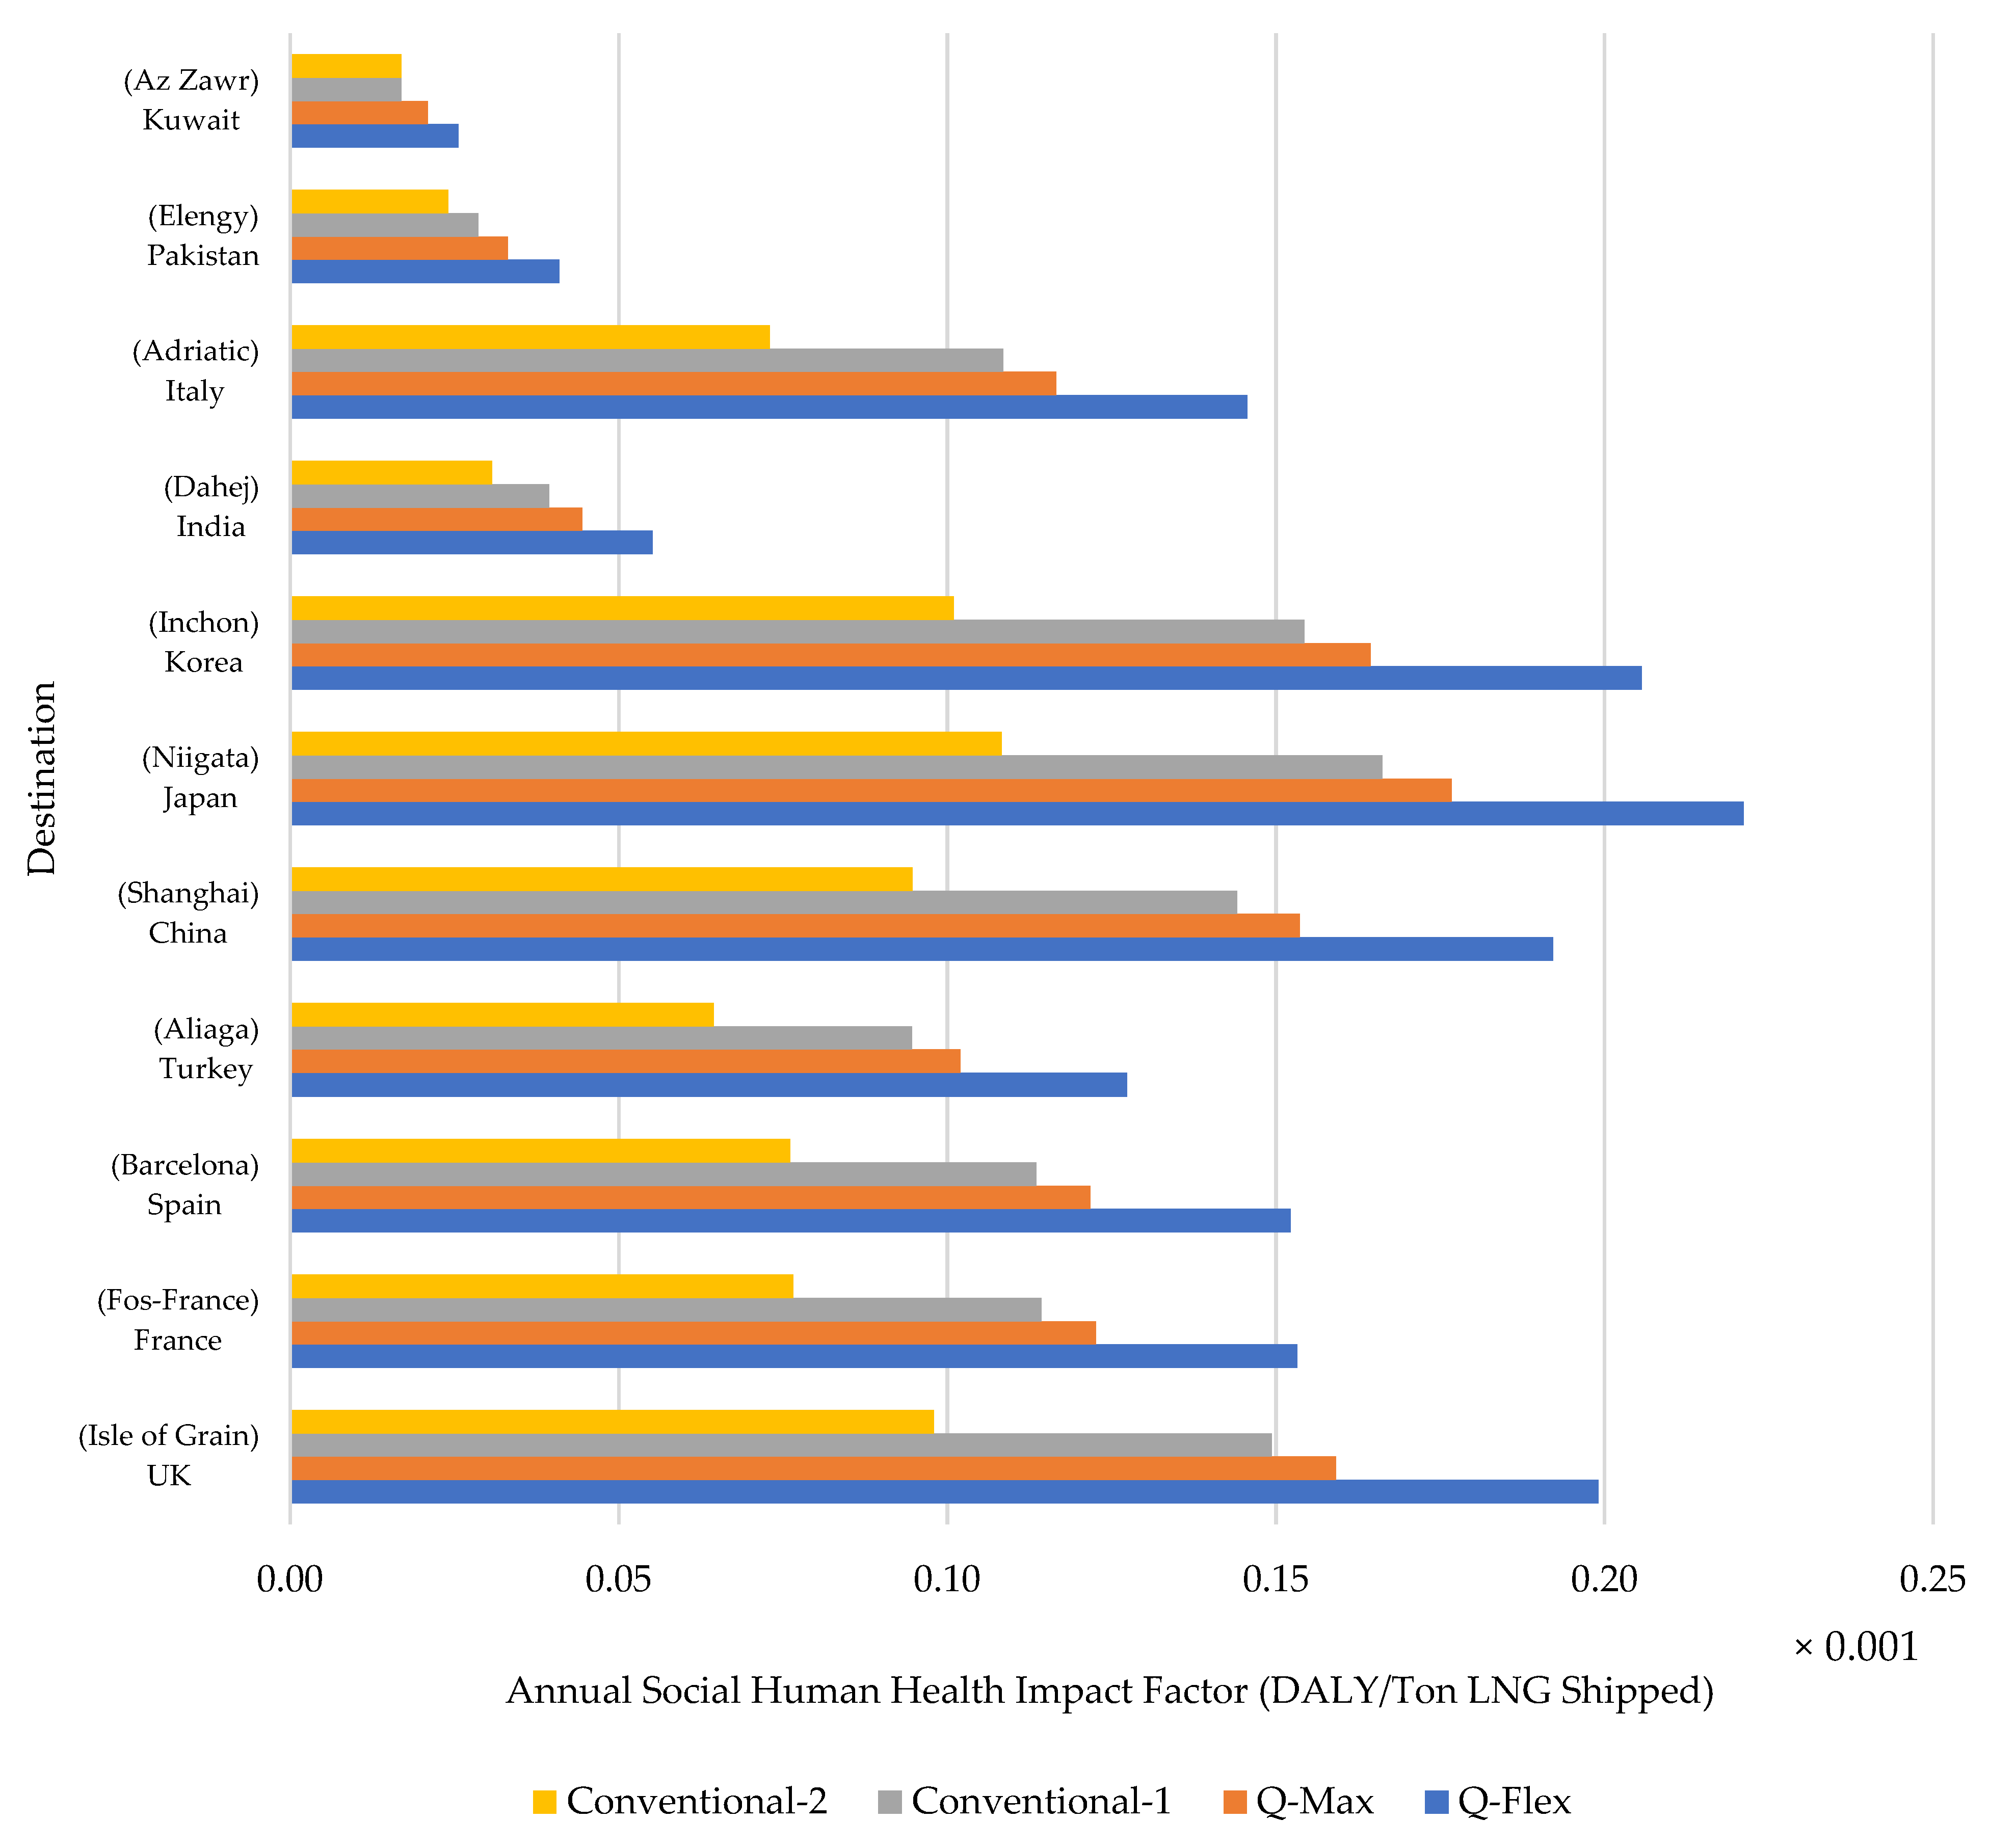
4.4. Overall Social Human Health Impact
The midpoint and endpoint emissions results have been converted to the human health impact potential associated with the type of fuels used and the supply destination, as illustrated in Figure 7. Figure 7 represents the annual social human health impact per the unit of LNG shipped by each type of carrier. The figure provides the calculated factor that can be used to measure the daily effects on human health related to LNG shipping through the sea. The factors consider the distance and number of trips annually and the annual demand per location. Moreover, these factors can help the researchers to estimate the annual social human health impact from the air emissions that are related to LNG shipping to these 11 destinations and provide guidance on the carrier type that can be utilized for shipping to each destination and transportation planning to satisfy customer needs and reduce the possible air emissions and perhaps the social human health impact.
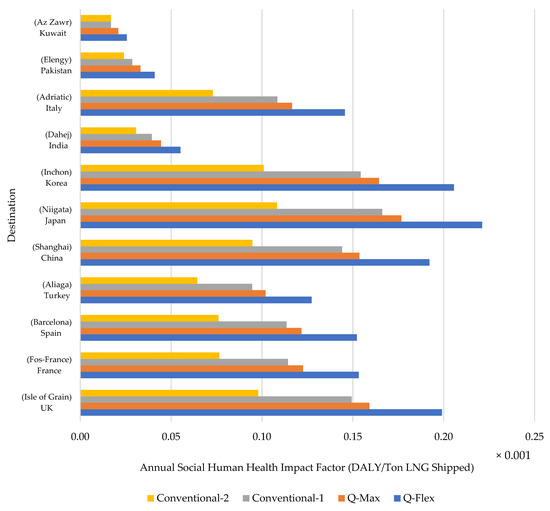
Figure 7.
Overall social human health impact factors while accounting for annual emissions.
The results indicate Kuwait as the lowest destination associated with human health impact for annual calculation mode given the short destination from the origin (Qatar). Japan has demonstrated the highest yearly human health impact. In terms of fuel type, Conventional-2 indicated the lowest human health impact for the annual mode of calculations, followed by Conventional-1, Q-Max, and finally Q-Flex. The analysis method for the yearly mode demonstrated discrepancies in the relative human health impact due to the variation of the annual LNG demand by each destination and not only per the trip needs. The results show the importance of using a relatively cleaner fuel type like Conventional-2 in reducing the health impact of LNG maritime transportation.
This research faced several limitations that are directly proportional to the final estimated results for the air emissions quantification and human health daily losses of life. Emission factors published by Cooper and Gustafsson [45] in 2004 may require a reassessment to verify the applicability for the current time and technology development. Moreover, there is a slight uncertainty associated with the assumed numbers of LNG loading and unloading time, carrier’s steam process time, canal waiting time, and other related parameters affecting the final air emission and human health impact estimation. This uncertainty is non-avoided due to the facts of dynamic changes in the shipping process, such as the delivery and traveling process, canal passing, and waiting time.
It is understandable that there is a significant need for LNG in most countries to maintain the development, energy needs, and human needs worldwide. However, this need is expected to continue due to the absolute requirement of clean energy sources. Therefore, it is more feasible to explore the engineering controls such as electrical carriers, engine overhauling, and LNG pipeline transport for closer countries with a long-term agreement. Moreover, the administrative controls such as improving the shipping route planning, synergies in LNG pipeline networks, etc., to reduce the overall emissions and human health impact are essential to be discussed, planned, and executed by management.
As the model used in this research was established based on actual ship transits from departure port to 11 destinations, it is recommended for future researchers to use these research results for further comparison and validation. It would be worth validating this research with other locations in the region and worldwide, investigating the impact of atmospheric pollution and human health while using a mix of carrier types, and studying the most impactful ports and cities due to the LNG loading and unloading activities.
4.5. Social Human Health Implications
The results mentioned above demonstrate the necessity to maximize the use of conventional-2 fuel types by the LNG industry in order to provide more outstanding human health management. Air emissions monitoring should be carried out with high precision measurement instruments to ensure that the best solutions are implemented to minimize the human health impacts to a possible extent and certified by an authorized certification body. In order to ensure enforcement and continuity with the reporting of air emissions, governments and lawmakers shall implement and oversee the mechanism of verification.
It is important to address to the decision-makers that emissions control is a journey and maintaining only the emission within limits is not the final solution. IMO have the ability to demand that the retrofitting of Q-Flex and Q-Max engines to a dual option is a possible option to continue using the existing fleet but in accordance with environmental protection standards. The retrofitting of engines has many constraints based on the carrier’s time, model, technical limitations, etc. Therefore, IMO can take up further investigation and implications. Moreover, as the conventional type found a perfect option to reduce the emissions and accordingly the human health impact, bigger size conventional carriers deserved a management focus to minimize the emissions as much as possible. Besides, the following outlines some relevant policies to reduce LNG carriers’ human health impacts:
- The LNG carriers’ roadmap optimization in light of policy barriers: the governments must align with IMO criteria and optimize the LNG carriers’ roadmaps. The alignment with the regulations is expected to increase shipload, mitigate fuel use, reduce cargo losses and reduce the environmental and human health impacts as the distance is optimized between the exporting and importing facilities.
- Investigate the model and usefulness of slow steaming of LNG ships, which can provide multiple advantages, including increased fuel savings, 20 to 40% air emissions reduction [46], increased reliability, and performance. However, further research is required on the engines’ technologies and effectiveness.
The United Nations Guiding Principles on Business and Human Rights (UNGP) is established to oversee and ensure people’s protection. UNGP looks into the impact on human well-being and insists on implementing control measures to protect human health and rights. Due to the global energy demand, International Energy Agency (IEA) and governments should support the approach towards human rights more due to the current and predicted increase in the industrial revolution and its associated impacts on human health. Furthermore, human rights such as the right to a pollution-free environment should be taken into account in policymaking and national strategies. As illustrated earlier in this paper, the PM2.5-eq impact is over 1000 times greater than the CO2-eq and NOx-eq impact on humans and perhaps prioritizes human life over other factors such as simple slight warming. There is a long history of ignoring humans who live in port neighborhoods and the effects on their lives through disease and pollution of the air are studied widely, and more research is performed in the US and China as per the SCOPUS database.
Towards such monitoring and controls, energy policies shall also be developed to enhance global human health and abate the significant contributors to health degradation in a sustainable manner.
5. Conclusions
Natural gas transportation from various parts of the world (carbon supplied to consuming areas) has become more critical. Natural gas liquefaction offers a cleaner and more efficient transportation option and also increases its storage capacity. Many atmospheric carbon oxides, nitrogen oxides, and particulate matter emitting sources, such as inefficient energy and polluting transportation, directly impact health. This observation forms an additional motivation to mitigate climate change. This research focused on establishing an air emission and social human health impact LCA model of LNG maritime transport. It explores creating a comprehensive social human health impact statistical structure accompanied by assessing the number of air emissions. In order to build a model for air emissions and social human health impact assessments based on hypotheses on diverse unknown criteria, a calculation model was used. Conventional-2 fuel type indicated the lowest human health impact for the annual calculation mode, followed by Conventional-1, Q-Max, and finally Q-Flex. From the results, it can be concluded the importance of using a relatively cleaner fuel type like Conventional-2 in reducing the health impact of LNG maritime transportation. This conclusion would potentially aid decision-makers in planning future investments in maritime transport with fewer environmental and health impacts. For example, using a more extensive fleet’s capacities as a future alternative for Conventional-1 and Conventional-2 fuel types have the potential to reduce the required numbers of roundtrips and the associated CO2 emissions, specifically with engine enhancement similar to Q-Max and Q-Flex.
According to the research findings and results, the three hypotheses are valid for the quantity of fuel consumed in the travel, fuel type, and carrier type directly proportional to the human health impact. In this case, policy and decision-makers can establish policies and procedures to control the harmful environmental emissions that are significantly causing the human health impact.
The limitations addressed in this research are mainly related to the uncertainty of emission factors used from the literature published in 2004 and the assumption of LNG maritime transport time for each shipping stage. Therefore, it is recommended to study furtherly both areas to reduce the associated uncertainty and have more accurate results.
As future work, this study can be expanded with the support of the sustainability assessment process to include further aspects, such as the economic and social effects of LNG shipping and more fuel and carrier types. More attempts can also be made to review and evaluate economic and socio-environmental influences that contribute to more sustainable practices of decision-making related to LNG transportation. Policymakers have to develop and implement international socio-environmental strategies towards the minimum human health impact for the energy sectors. In addition, the life cycle sustainability assessment (LCSA) can be extended to the whole associated supply chains of LNG, starting from the exploration and liquefaction of natural and up to the transportation and regasification of LNG and taking into account uncertainty analysis. Furthermore, complete social LCA is proposed to study further the social sector’s responsible care impacted by LNG maritime transport, social acceptance, and compensation plan to develop the community’s supporting facilities and projects.
Author Contributions
Conceptualization, S.A. and M.K.; formal analysis, S.A. and H.A.-Y.; funding acquisition, S.A. and M.K.; investigation, S.A., H.A.-Y. and M.K.; methodology, S.A., H.A.-Y. and M.K.; research administration, S.A.; resources, S.A.; tools, S.A. and H.A.-Y.; supervision, M.K.; validation, S.A. and H.A.-Y.; visualization, S.A. and H.A.-Y.; writing—original draft, S.A. and H.A.-Y.; writing—review and editing, M.K. and N.C.O. All authors have read and agreed to the published version of the manuscript.
Funding
This research was funded and supported by the Qatar University Student Grant (QUST-1-CENG-2021-14). The findings achieved herein are solely the responsibility of the authors.
Data Availability Statement
Not applicable.
Acknowledgments
The authors would like to acknowledge the Qatar University Student Grant Office for the support provided to complete and publish this research paper.
Conflicts of Interest
The authors declare no conflict of interest.
References
- EGCSA. MARPOL Annex VI—Regulation 14—Sulphur Oxides (SOx) & Particulate Matter. Available online: https://www.egcsa.com/regulatory/marpol-annex-vi-regulation-14/ (accessed on 25 May 2021).
- Hwang, S.; Jeong, B.; Jung, K.; Kim, M.; Zhou, P. Life Cycle Assessment of LNG Fueled Vessel in Domestic Services. J. Mar. Sci. Eng. 2019, 7, 359. [Google Scholar] [CrossRef] [Green Version]
- Gilbert, P.; Walsh, C.; Traut, M.; Kesieme, U.; Pazouki, K.; Murphy, A. Assessment of full life-cycle air emissions of alternative shipping fuels. J. Clean. Prod. 2018, 172, 855–866. [Google Scholar] [CrossRef]
- World Health Organization. 2018 WHO Health and Climate Change Survey Report: Tracking Global Progress; World Health Organization: Geneva, Switzerland, 2019. [Google Scholar]
- World Health Organization. Climate and Health Country Progules—2015: A Global Overview; World Health Organization: Geneva, Switzerland, 2019. [Google Scholar]
- Ren, J.; Liang, H. Measuring the sustainability of marine fuels: A fuzzy group multi-criteria decision making approach. Transp. Res. Part. D Transport. Environ. 2017, 54, 12–29. [Google Scholar] [CrossRef]
- US Energy. Annual Energy Review 2009; US Energy Information Administration: Washington, DC, USA, 2010; pp. 19–53.
- Aydin, M. Natural gas consumption and economic growth nexus for top 10 natural Gas–Consuming countries: A granger causality analysis in the frequency domain. Energy 2018, 165, 179–186. [Google Scholar] [CrossRef]
- Burel, F.; Taccani, R.; Zuliani, N. Improving sustainability of maritime transport through utilization of Liquefied Natural Gas (LNG) for propulsion. Energy 2013, 57, 412–420. [Google Scholar] [CrossRef]
- Msakni, M.K.; Haouari, M. Short-term planning of liquefied natural gas deliveries. Transp. Res. Part. C Emerg. Technol. 2018, 90, 393–410. [Google Scholar] [CrossRef]
- Medlock, K.B.; Jaffe, A.M.; O’Sullivan, M. The global gas market, LNG exports and the shifting US geopolitical presence. Energy Strategy Rev. 2014, 5, 14–25. [Google Scholar] [CrossRef]
- Kumar, S.; Kwon, H.-T.; Choi, K.-H.; Lim, W.; Cho, J.H.; Tak, K.; Moon, I. LNG: An eco-friendly cryogenic fuel for sustainable development. Appl. Energy 2011, 88, 4264–4273. [Google Scholar] [CrossRef]
- Jang, H.; Jeong, B.; Zhou, P.; Ha, S.; Nam, D. Demystifying the lifecycle environmental benefits and harms of LNG as marine fuel. Appl. Energy 2021, 292, 116869. [Google Scholar] [CrossRef]
- Al-Breiki, M.; Bicer, Y. Comparative life cycle assessment of sustainable energy carriers including production, storage, overseas transport and utilization. J. Clean. Prod. 2021, 279, 123481. [Google Scholar] [CrossRef]
- Song, H.; Ou, X.; Yuan, J.; Yu, M.; Wang, C. Energy consumption and greenhouse gas emissions of diesel/LNG heavy-duty vehicle fleets in China based on a bottom-up model analysis. Energy 2017, 140, 966–978. [Google Scholar] [CrossRef]
- Al-Haidous, S.; Msakni, M.K.; Haouari, M. Optimal planning of liquefied natural gas deliveries. Transp. Res. Part. C Emerg. Technol. 2016, 69, 79–90. [Google Scholar] [CrossRef]
- Vanem, E.; Antao, P.; Østvik, I.; de Comas, F.D.C. Analysing the risk of LNG carrier operations. Reliab. Eng. Syst. Saf. 2008, 93, 1328–1344. [Google Scholar] [CrossRef]
- Lindstad, E.; Rialland, A. LNG and Cruise Ships, an Easy Way to Fulfil Regulations—Versus the Need for Reducing GHG Emissions. Sustainability 2020, 12, 2080. [Google Scholar] [CrossRef] [Green Version]
- Cook-Clarke, W.; Jenden, J.; Lloyd, E.; Wong, K.; Donev, J. Transportation of Liquefied Natural Gas. Available online: https://energyeducation.ca/encyclopedia/Transportation_of_liquefied_natural_gas (accessed on 11 August 2020).
- Strantzali, E.; Aravossis, K.; Livanos, G.A.; Nikoloudis, C. A decision support approach for evaluating liquefied natural gas supply options: Implementation on Greek case study. J. Clean. Prod. 2019, 222, 414–423. [Google Scholar] [CrossRef]
- Sharafian, A.; Blomerus, P.; Mérida, W. Liquefied natural gas tanker truck-to-tank transfer for on-road transportation. Appl. Therm. Eng. 2019, 162, 114313. [Google Scholar] [CrossRef]
- Barnett, P.J. Life Cycle Assessment (LCA) of Liquefied Natural Gas (LNG) and Its Environmental Impact as a Low Carbon Energy Source; University of Southern Queensland: Toowoomba, Australia, 2010. [Google Scholar]
- Tamura, I.; Tanaka, T.; Kagajo, T.; Kuwabara, S.; Yoshioka, T.; Nagata, T.; Kurahashi, K.; Ishitani, H. Life cycle CO2 analysis of LNG and city gas. Appl. Energy 2001, 68, 301–319. [Google Scholar] [CrossRef]
- Kameyama, M.; Hiraoka, K.; Sakurai, A.; Naruse, T.; Tauchi, H. Development of LCA software for ships and LCI analysis based on actual shipbuilding and operation. In Proceedings of the 6th International Conference on Ecobalance, Tsukuba, Japan, 25–27 October 2004. [Google Scholar]
- Onat, N.C.; Kucukvar, M. Carbon footprint of construction industry: A global review and supply chain analysis. Renew. Sustain. Energy Rev. 2020, 124, 109783. [Google Scholar] [CrossRef]
- Onat, N.; Kucukvar, M.; Aboushaqrah, N.; Jabbar, R. How sustainable is electric mobility? A comprehensive sustainability assessment approach for the case of Qatar. Appl. Energy 2019, 250, 461–477. [Google Scholar] [CrossRef]
- Shi, J.; Li, T.; Liu, Z.; Zhang, H.; Peng, S.; Jiang, Q.; Yin, J. Life cycle environmental impact evaluation of newly manufactured diesel engine and remanufactured LNG engine. Procedia Cirp 2015, 29, 402–407. [Google Scholar] [CrossRef]
- Korre, A.; Nie, Z.; Durucan, S. Life Cycle Assessment of the natural gas supply chain and power generation options with CO2 capture and storage: Assessment of Qatar natural gas production, LNG transport and power generation in the UK. Sustain. Technol. Syst. Policies 2012, 2012. [Google Scholar] [CrossRef]
- Lindstad, E.; Eskeland, G.S.; Rialland, A.; Valland, A. Decarbonizing Maritime Transport: The Importance of Engine Technology and Regulations for LNG to Serve as a Transition Fuel. Sustainability 2020, 12, 8793. [Google Scholar] [CrossRef]
- Biswas, W.K.; Engelbrecht, D.; Rosano, M. Carbon footprint assessment of Western Australian LNG production and export to the Chinese market. Int. J. Prod. Lifecycle Manag. 2013, 6, 339–356. [Google Scholar] [CrossRef]
- Jaramillo, P.; Griffin, W.M.; Matthews, H.S. Comparative life-cycle air emissions of coal, domestic natural gas, LNG, and SNG for electricity generation. Environ. Sci. Technol. 2007, 41, 6290–6296. [Google Scholar] [CrossRef]
- Halvorsen-Weare, E.E.; Fagerholt, K. Routing and scheduling in a liquefied natural gas shipping problem with inventory and berth constraints. Ann. Oper. Res. 2013, 203, 167–186. [Google Scholar] [CrossRef] [Green Version]
- Cho, J.; Lim, G.J.; Kim, S.J.; Biobaku, T. Liquefied natural gas inventory routing problem under uncertain weather conditions. Int. J. Prod. Econ. 2018, 204, 18–29. [Google Scholar] [CrossRef]
- Shively, B.; Ferrare, J. Understanding Today’s Global LNG Business; Enerdynamics: Laporte, CO, USA, 2005. [Google Scholar]
- Harrould-Kolieb, E. Shipping Impacts on Climate: A Source with Solutions; Oceana: Washington, DC, USA, 2008. [Google Scholar]
- Arteconi, A.; Brandoni, C.; Evangelista, D.; Polonara, F. Life-cycle greenhouse gas analysis of LNG as a heavy vehicle fuel in Europe. Appl. Energy 2010, 87, 2005–2013. [Google Scholar] [CrossRef]
- Cooper, J.; Hawkes, A.; Balcombe, P. Life cycle environmental impacts of natural gas drivetrains used in UK road freighting and impacts to UK emission targets. Sci. Total Environ. 2019, 674, 482–493. [Google Scholar] [CrossRef] [PubMed]
- Huijbregts, M.A.J.; Steinmann, Z.J.N.; Elshout, P.M.F.; Stam, G.; Verones, F.; Vieira, M.; Zijp, M.; Hollander, A.; van Zelm, R. ReCiPe2016: A harmonised life cycle impact assessment method at midpoint and endpoint level. Int. J. Life Cycle Assess. 2017, 22, 138–147. [Google Scholar] [CrossRef]
- Dekker, E.; Zijp, M.C.; van de Kamp, M.E.; Temme, E.H.M.; van Zelm, R. A taste of the new ReCiPe for life cycle assessment: Consequences of the updated impact assessment method on food product LCAs. Int. J. Life Cycle Assess. 2020, 25, 2315–2324. [Google Scholar] [CrossRef] [Green Version]
- Aseel, S.; Al-Yafei, H.; Kucukvar, M.; Onat, N.C.; Turkay, M.; Kazancoglu, Y.; Al-Sulaiti, A.; Al-Hajri, A. A Model for Estimating the Carbon Footprint of Maritime Transportation of Liquefied Natural Gas under Uncertainty. Sustain. Prod. Consum. 2021. [Google Scholar] [CrossRef]
- Qatar Petroleum. Qatar Petroleum Books 7.2 MTPA of LNG Receiving and Storage Capacity Up to 2050 in the United Kingdom. Available online: https://qp.com.qa/en/MediaCentre/Pages/ViewNews.aspx?NType=News (accessed on 21 May 2021).
- International Gas Union. 2020 World LNG Report; International Gas Union: Barcelona, Spain, 2020. [Google Scholar]
- Ports. Sea Route & Distance. Available online: http://ports.com/sea-route/port-of-doha,qatar/isle-of-grain,united-kingdom/#/?a=3961&b=0&c=Port%20of%20Ras%20Laffan,%20Qatar&d=Isle%20Of%20Grain (accessed on 15 May 2021).
- Kim, K.; Park, K.; Roh, G.; Chun, K. Case Study on Boil-Off Gas (BOG) Minimization for LNG Bunkering Vessel Using Energy Storage System (ESS). J. Mar. Sci. Eng. 2019, 7, 130. [Google Scholar] [CrossRef] [Green Version]
- Cooper, D.; Gustafsson, T. Methodology for Calculating Emissions from Ships: 1. Update of Emission Factors; SMHI Swedish Meteorological and Hydrological Institute: Norrköping, Sweden, 2004. [Google Scholar]
- Degiuli, N.; Martić, I.; Farkas, A.; Gospić, I. The impact of slow steaming on reducing CO2 emissions in the Mediterranean Sea. Energy Rep. 2021. [Google Scholar] [CrossRef]


Publisher’s Note: MDPI stays neutral with regard to jurisdictional claims in published maps and institutional affiliations. |
© 2021 by the authors. Licensee MDPI, Basel, Switzerland. This article is an open access article distributed under the terms and conditions of the Creative Commons Attribution (CC BY) license (https://creativecommons.org/licenses/by/4.0/).