Article

Reliability-Based Robust Design Optimization of Lithium-Ion Battery Cells for Maximizing the Energy Density by Increasing Reliability and Robustness

1
Graduate School of Mechanical Design & Production Engineering, Konkuk University, 120, Neung dong-ro, Gwangjin-gu, Seoul 05029, Korea
2
Department of Industrial Engineering, Konkuk University, 120, Neung dong-ro, Gwangjin-gu, Seoul 05029, Korea
3
Department of Chemical Engineering, Konkuk University, 120, Neung dong-ro, Gwangjin-gu, Seoul 05029, Korea
4
Department of Electrical and Electronics Engineering, Konkuk University, 120, Neung dong-ro, Gwangjin-gu, Seoul 05029, Korea
5
School of Mechanical Engineering, Konkuk University, 120, Neung dong-ro, Gwangjin-gu, Seoul 05029, Korea
*
Author to whom correspondence should be addressed.
Energies 2021, 14(19), 6236; https://doi.org/10.3390/en14196236
Submission received: 16 August 2021 / Revised: 17 September 2021 / Accepted: 24 September 2021 / Published: 30 September 2021

Abstract

:
Lithium-ion batteries (LIBs) are increasingly employed in electric vehicles (EVs) owing to their advantages, such as low weight, and high energy and power densities. However, the uncertainty encountered in the manufacturing of LIB cells increases the failure rate and causes cell-to-cell variations, thereby degrading the battery capacity and lifetime. In this study, the reliability and robustness of LIB cells were improved using the design of experiments (DOE), and the reliability-based robust design optimization (RBRDO) approaches. First, design factors sensitive to the energy density and power density were selected as design variables through sensitivity analysis using the DOE. RBRDO was performed to maximize the energy density while reducing the failure rate and cell-to-cell variations. To verify the superiority of the reliability and robustness offered by RBRDO, the obtained results were compared with those from conventional deterministic design optimization (DDO), and reliability-based design optimization (RBDO). RBRDO increased the mean of the energy density by 33.5% compared to the initial value and reduced the failure rate by 98.9%, due to improved reliability, compared to DDO. Moreover, RBRDO reduced the standard deviation in the energy density (i.e., cell-to-cell variations) by 30.0% due to the improved robustness compared to RBDO.

1. Introduction

Recently, because of the depletion of traditional fossil fuels and environmental regulations, the demand for new energy systems, such as lithium-ion batteries and solar panels, is increasing, and studies are being conducted accordingly [1,2,3,4,5,6]. Lithium-ion batteries (LIBs) offer advantages, such as a high energy density, high power density, and low weight [7]. Therefore, LIBs are increasingly being used in electric vehicles (EVs) and large-capacity energy storage systems (ESSs) [8]. With increasingly stringent environmental regulations in recent years, the market demand for EVs has increased, and so has the need to use LIBs in EVs, with the annual average growth being 20% [9,10]. Accordingly, studies to increase the energy density of LIB cells for improving the mileage per charge of EVs are underway [4,5,6].
Mass production often leads to performance variations in the obtained products due to uncertainty in the manufacturing process. Manufacturing uncertainties increase the failure rate and degrade the performance of the product [11]. LIBs are manufactured through several processes (electrode, assembly, and formation processes) [12]. Owing to the manufacturing uncertainty arising from these processes, LIB cells show variations in the thicknesses of the electrode, separator, and collector, as well as in the particle size and porosity of the electrode [13,14,15,16,17]. This, in turn, leads to variations in the capacity and impedance of the LIB cell, reducing the lifetime of the battery pack and increasing the internal resistance [18,19,20,21]. Rumpf et al. confirmed that variations in the current and temperature of commercial LIB cells due to manufacturing uncertainties lead to variations in the lifetime and voltage of the LIB pack [18]. Barsukov et al. confirmed that the operating voltage of LIB cells varies because of the capacity variation between cells arising from manufacturing uncertainties, leading to the degradation of the LIB pack and posing safety issues [19].
Studies have been conducted to mitigate the negative impact of cell-to-cell variations, such as reducing the lifetime of the battery pack and lowering energy efficiency using a battery management system (BMS). Ziegler et al. improved the lifetime and increased the capacity of a battery pack by stabilizing its aging, and reduced performance variations between each cell through active cell balancing using the BMS [22]. Khan proposed the Lagrange multiplier method fused with SPKF to reduce errors through the efficient SOC estimation of lithium-ion batteries [23]. Samanta et al. used dual DC-DC converter-based active cell balancing to mitigate the capacity reduction of LIB packs caused by differences in the capacity and voltage of LIB cells and internal resistance, resulting in the increased capacity and lifespan of the LIBs [24]. However, these studies offer approaches to mitigate the effects of cell-to-cell variations in LIB cells that were already mass-produced. Thus far, there has been no study on design optimization to reduce cell-to-cell variations at the design stage, before the manufacturing of LIB cells.
In previous optimization studies on improving the performance of LIB cells, the conventional deterministic design optimization (DDO) approach was used with electrochemical numerical LIB models. These models were developed by Doyle and Newman, and methods to improve the performance were devised by changing the design variables [25,26,27]. De et al. conducted a DDO study to maximize the energy density using the electrode thickness and electrode porosity as design variables [1]. Lee et al. performed the optimization of LIB cells using an evolutionary algorithm, with the electrode thickness, separator thickness, electrode porosity, separator porosity, and electrode particle size as design variables; thus, they achieved the maximized energy density while satisfying constraint conditions [2]. Kim et al. determined the design variables through sensitivity analysis of the design factors of LIB cells using the design of experiments (DOE) method and performed optimization to maximize the energy density while satisfying the constraint conditions for maintaining the power density [3]. However, these studies did not consider the uncertainty arising from the manufacturing process because the design variables were set to deterministic values.
Reliability-based design optimization (RBDO) is an optimization method to improve the reliability, and that considers the manufacturing uncertainty. Recently, Kim et al. applied RBDO for the first time to reduce the failure rate arising from the manufacturing uncertainty of LIB cells [28]. Although RBDO can reduce the failure rate through improved reliability, it cannot reduce the performance variations. Therefore, it is imperative to develop a method that simultaneously improves the robustness and reliability of performance under manufacturing uncertainties. Reliability-based robust design optimization (RBRDO) is generally applied to reduce the failure rate and improve the reliability of performance at the product design stage in various industries [29,30,31,32]. However, there are no studies applying RBRDO to LIB cells.
In this study, we applied RBRDO to maximize the energy density while reducing the failure rate and cell-to-cell variations caused by the manufacturing uncertainty of LIB cells. To calculate the energy density and power density, an electrochemical numerical model of a graphite/LMO-type LIB cell was used. First, sensitivity analysis using the DOE was performed for nine design factors with distribution. Six design factors sensitive to the energy density and power density were chosen as design variables; these were the anode particle size, cathode porosity, anode thickness, cathode thickness, negative current collector thickness, and separator thickness. RBRDO was performed as a multi-objective problem for maximizing the mean of the energy density and minimizing the standard deviation in the energy density. The constraint range was defined as approximately 5% of the initial power density. Finally, by comparing the results from RBRDO with those from DDO and RBDO, the superiority of the reliability and robustness offered by RBRDO was confirmed.

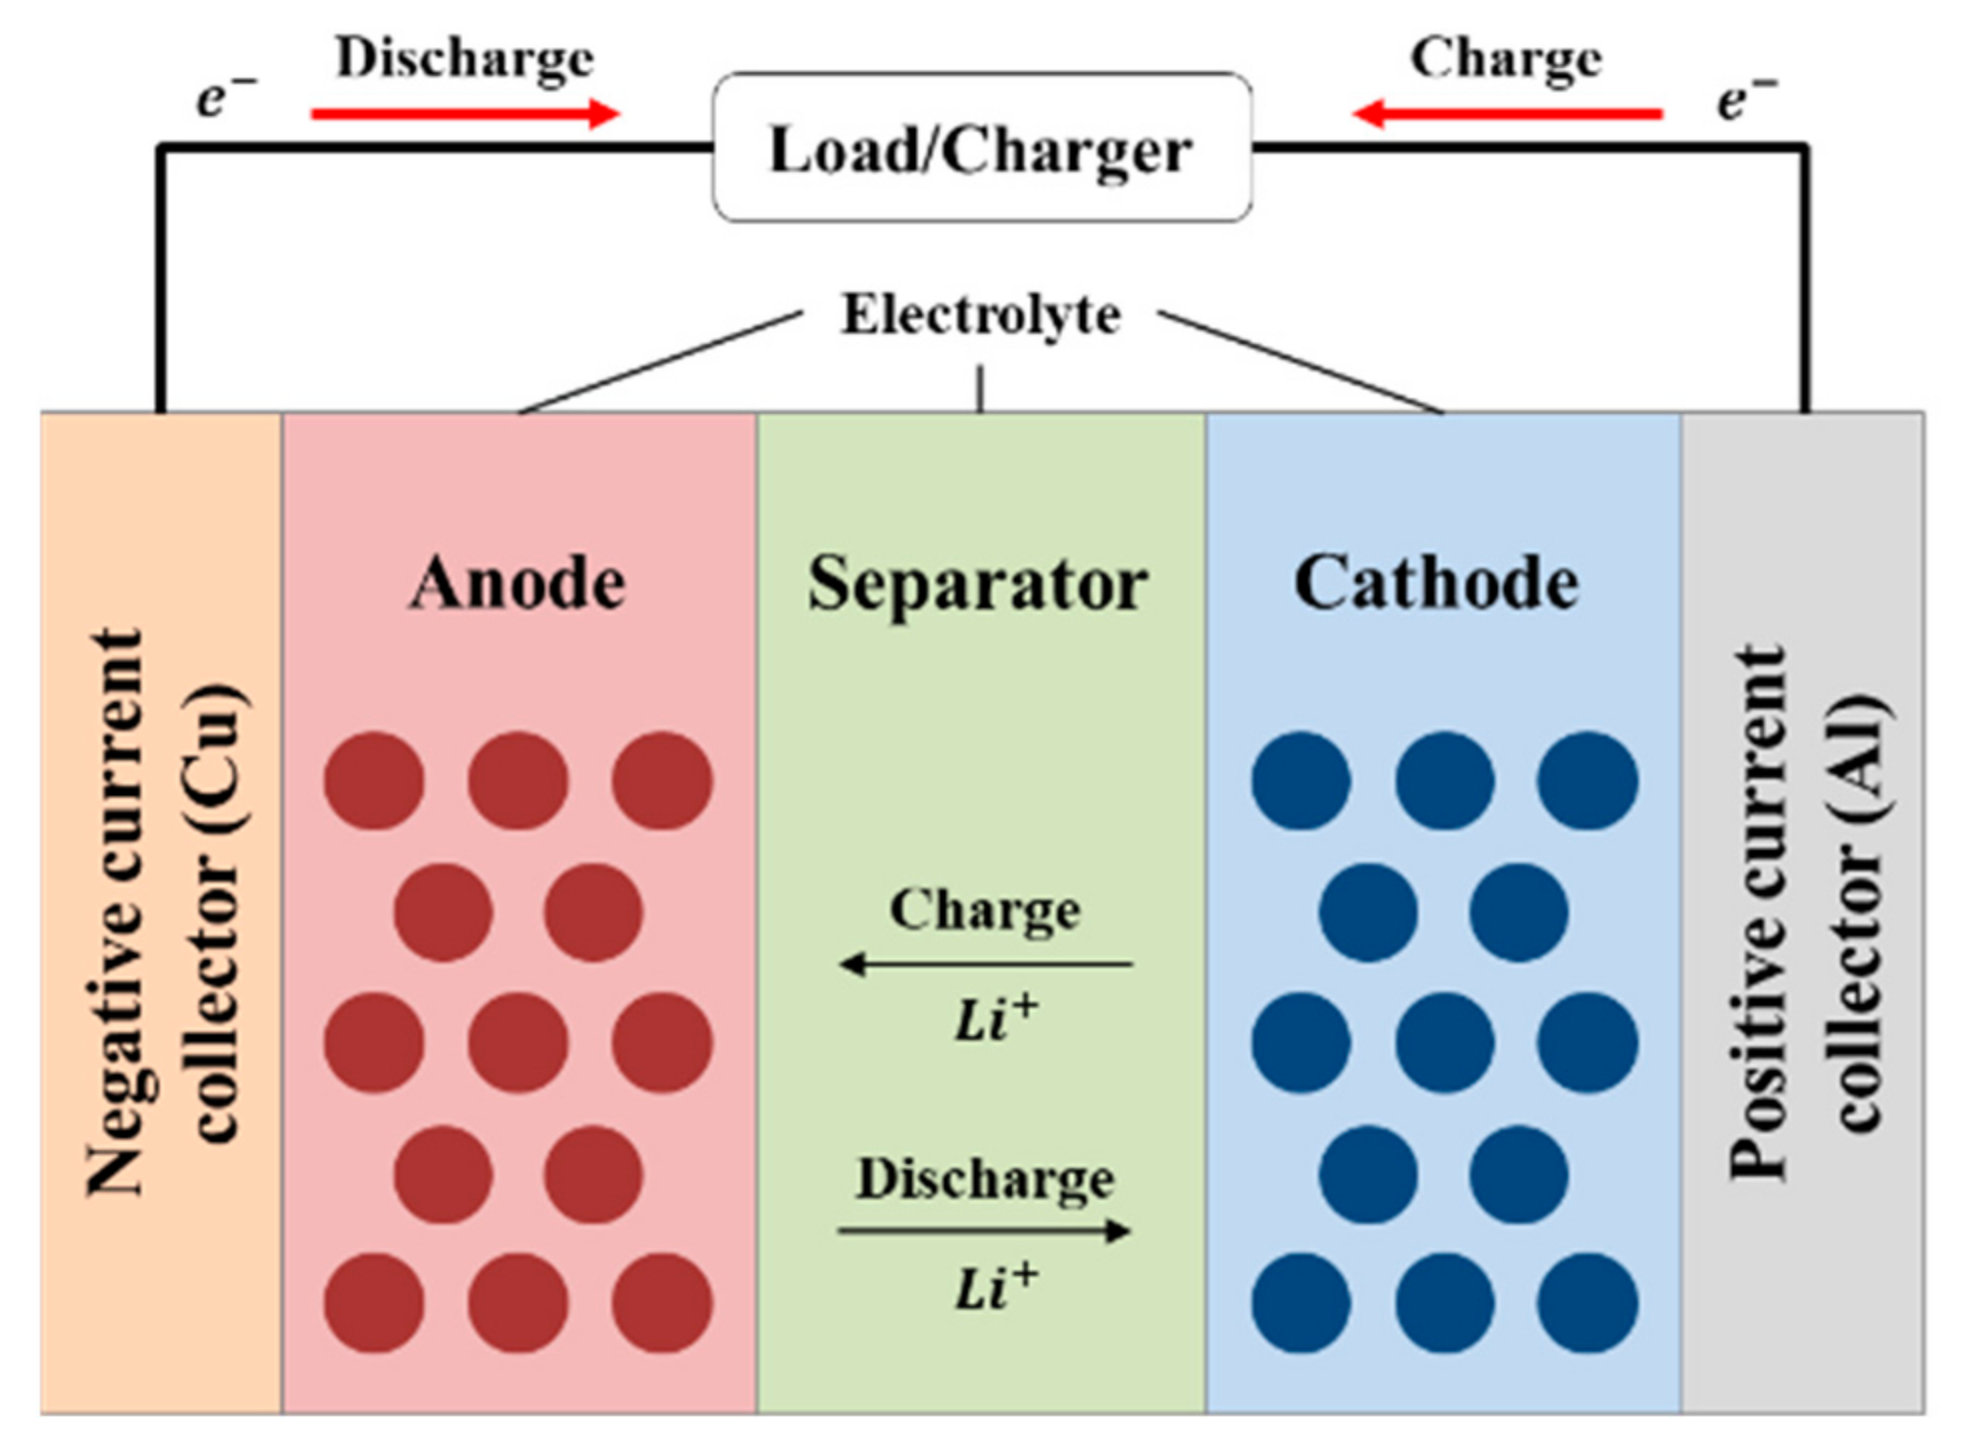
2. Electrochemical Numerical Analysis Model of LIB Cells

An electrochemical numerical analysis model was used to calculate the energy density and power density of the LIB cells. Figure 1 shows the structure and illustrates the charge-discharge cycle of an LIB cell. The LIB cell consists of five layers (electrodes, separators, and collectors). The LIB cell model was a pseudo-two-dimensional (P2D) model studied by Doyle et al. based on the porous electrode theory and concentrated electrolyte theory. The LIB cells were graphite/LMO-type cells [25,26,27].
Equations (1)–(5) are the governing equations for the electrochemical reaction of an LIB cell. Equation (1) is an electronic charge balance equation. Equation (2) is the ionic charge balance equation in the electrolyte. Equation (3) is Fick’s second law expressed in a spherical coordinate system and is the equation for the diffusion of active particles. Equation (4) represents the ionic charge transport of Li-ion in the electrolyte. Equation (5) represents the Li+ flux and the Butler–Volmer equation for an active particle surface, and is an equation for the reaction kinetics.
k 1 ϕ 1 = a j n
k 2 e f f ϕ 2 + 2 R c T k 2 e f f F 1 + ln f ± ln c 2 1 t + ln c 2 = a j n
d c 1 d t + 1 r 2 r r 2 D 1 c 1 r = 0
d c 2 d t = D 2 e f f c 2 1 F i 2 t + + a j n 1 t +
N 0 = j n F , j n = i 0 exp η F R c T exp η F R c T
To validate the electrochemical numerical analysis model, the discharge results were compared with the actual battery discharge curve from Newman’s experiment [26]. Table 1 lists the parameters for the numerical analysis. Figure 2 confirms the validity of the LIB model through comparison between the discharge analysis and experiment. The initial energy density and the initial power density were confirmed through the 1C-rate constant-current discharge analysis of the LIB model. The LIB cell was discharged from an initial voltage of 4.2 V to a cut-off voltage of 3 V. The 1C-rate current density was 25 A / m 2 and the cell temperature was 298 K. The initial Li-ion concentration of the negative electrode was 22,055 mol / m 3 , and that of the positive electrode was 4000 mol / m 3 . The initial concentration of the electrolyte was 1000 mol / m 3 . The initial energy density of the LIB cell was 138.7 Wh/kg, and the initial power density was 140.05 W/kg, calculated through discharge analysis. Energy density and power density are calculated depending on the design variables ( x i ) of LIB cells. Energy density ( E c e l l ) is calculated by dividing the total discharged energy, multiplied by the electric potential ( V c e l l ) and the discharge current ( i a p p ) during discharge time ( t e n d ), by the mass of the cell ( M c e l l ), through Equation (6). Power density ( P c e l l ) is calculated by dividing the average power up to the cutoff voltage, the total discharge energy divided by the discharge time, and by the mass of the cell through Equation (7). The mass of the cell was calculated by the sum of the weights of the anode, cathode, separator, electrolyte, and collector.
E c e l l x i = 1 M c e l l 0 t V c e l l · i a p p d t
P c e l l x i = 1 M c e l l 0 t V c e l l · i a p p d t · 1 t e n d

3. Reliability-Based Robust Design Optimization of LIB Cell

3.1. Variations in LIB Cell Performance due to Manufacturing Uncertainties

LIB cells are manufactured through the electrode, assembly, and formation processes. The design factors exhibit a probabilistic distribution due to manufacturing uncertainties. Table 2 shows the distribution of the design factors of LIB cells [13,14,15,16,17]. Because of this distribution, the manufactured LIB cells do not fulfil performance requirements, leading to an increase in the failure rate. Further, this distribution causes cell-to-cell variations which, in turn, lead to differences in the impedance and temperature of the battery module and pack, thereby reducing the capacity, lifetime, and thermal stability of the LIBs [18,19,20,21]. Therefore, the RBRDO of LIB cells was performed to maximize the energy density and reduce the failure rate and cell-to-cell variations.

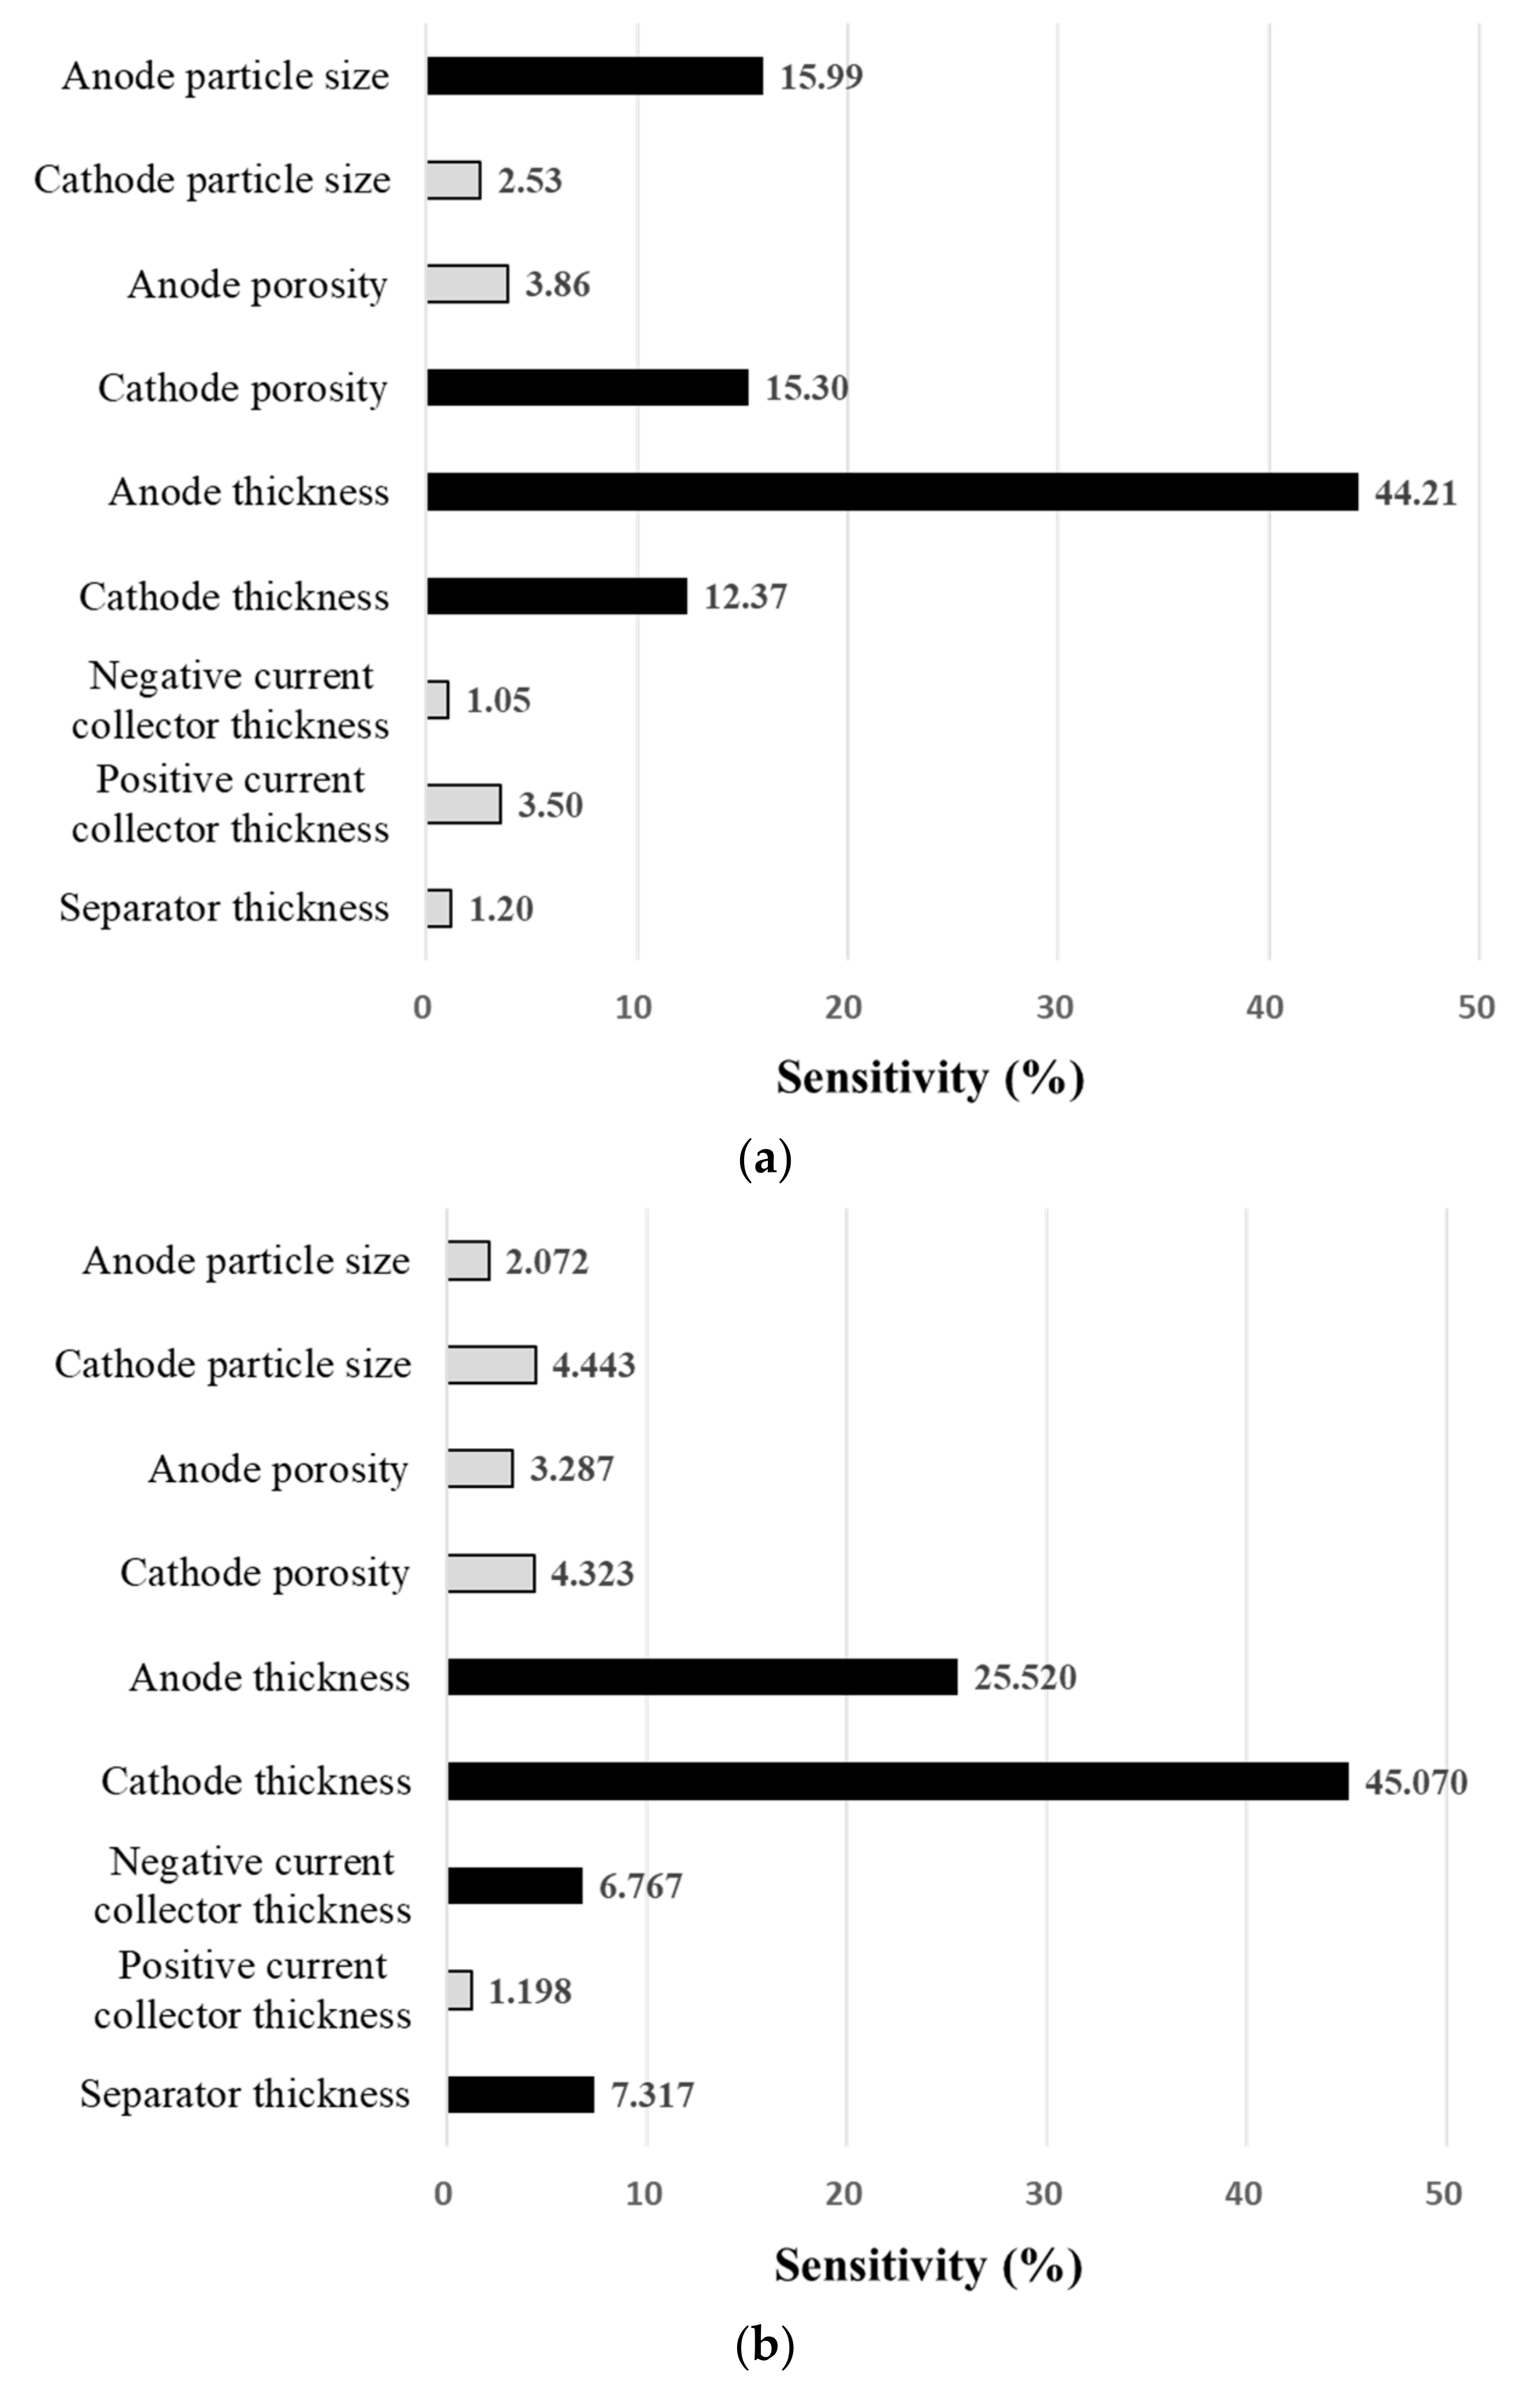
3.2. Sensitivity Analysis through DOE

Before performing the RBRDO of LIB cells, sensitivity analysis through the DOE was performed to determine the design factors sensitive to the energy density and power density. Sensitivity analysis of the design factors through the DOE is an efficient method to determine sensitive design variables for response and to save on computational costs and time. The DOE was performed on the following nine design factors: anode particle size, cathode particle size, anode porosity, cathode porosity, anode thickness, cathode thickness, negative current collector thickness, positive current collector thickness, and separator thickness. Table 3 lists the design areas for the design factors [33,34]. Responses at 3000 points were obtained using the optimal Latin hypercube design (OLHD) sampling method. The OLHD method is widely used in the DOE as it offers excellent space-filling quality to express the design space using a limited number of sampling points [35].
Regression analysis was performed on the sampling points to determine the design variables for optimization through sensitivity analysis. Regression analysis involves the calculation of the regression coefficient from the response approximated using the least squares method for nonlinear sampling points [36]. Figure 3 shows the regression results for design factors sensitive to the energy density and power density. Design factors with a sensitivity of 5% or more were chosen as the design variables. Thus, six design variables were determined for optimization: anode particle size, cathode porosity, anode thickness, cathode thickness, negative current collector thickness, and separator thickness.

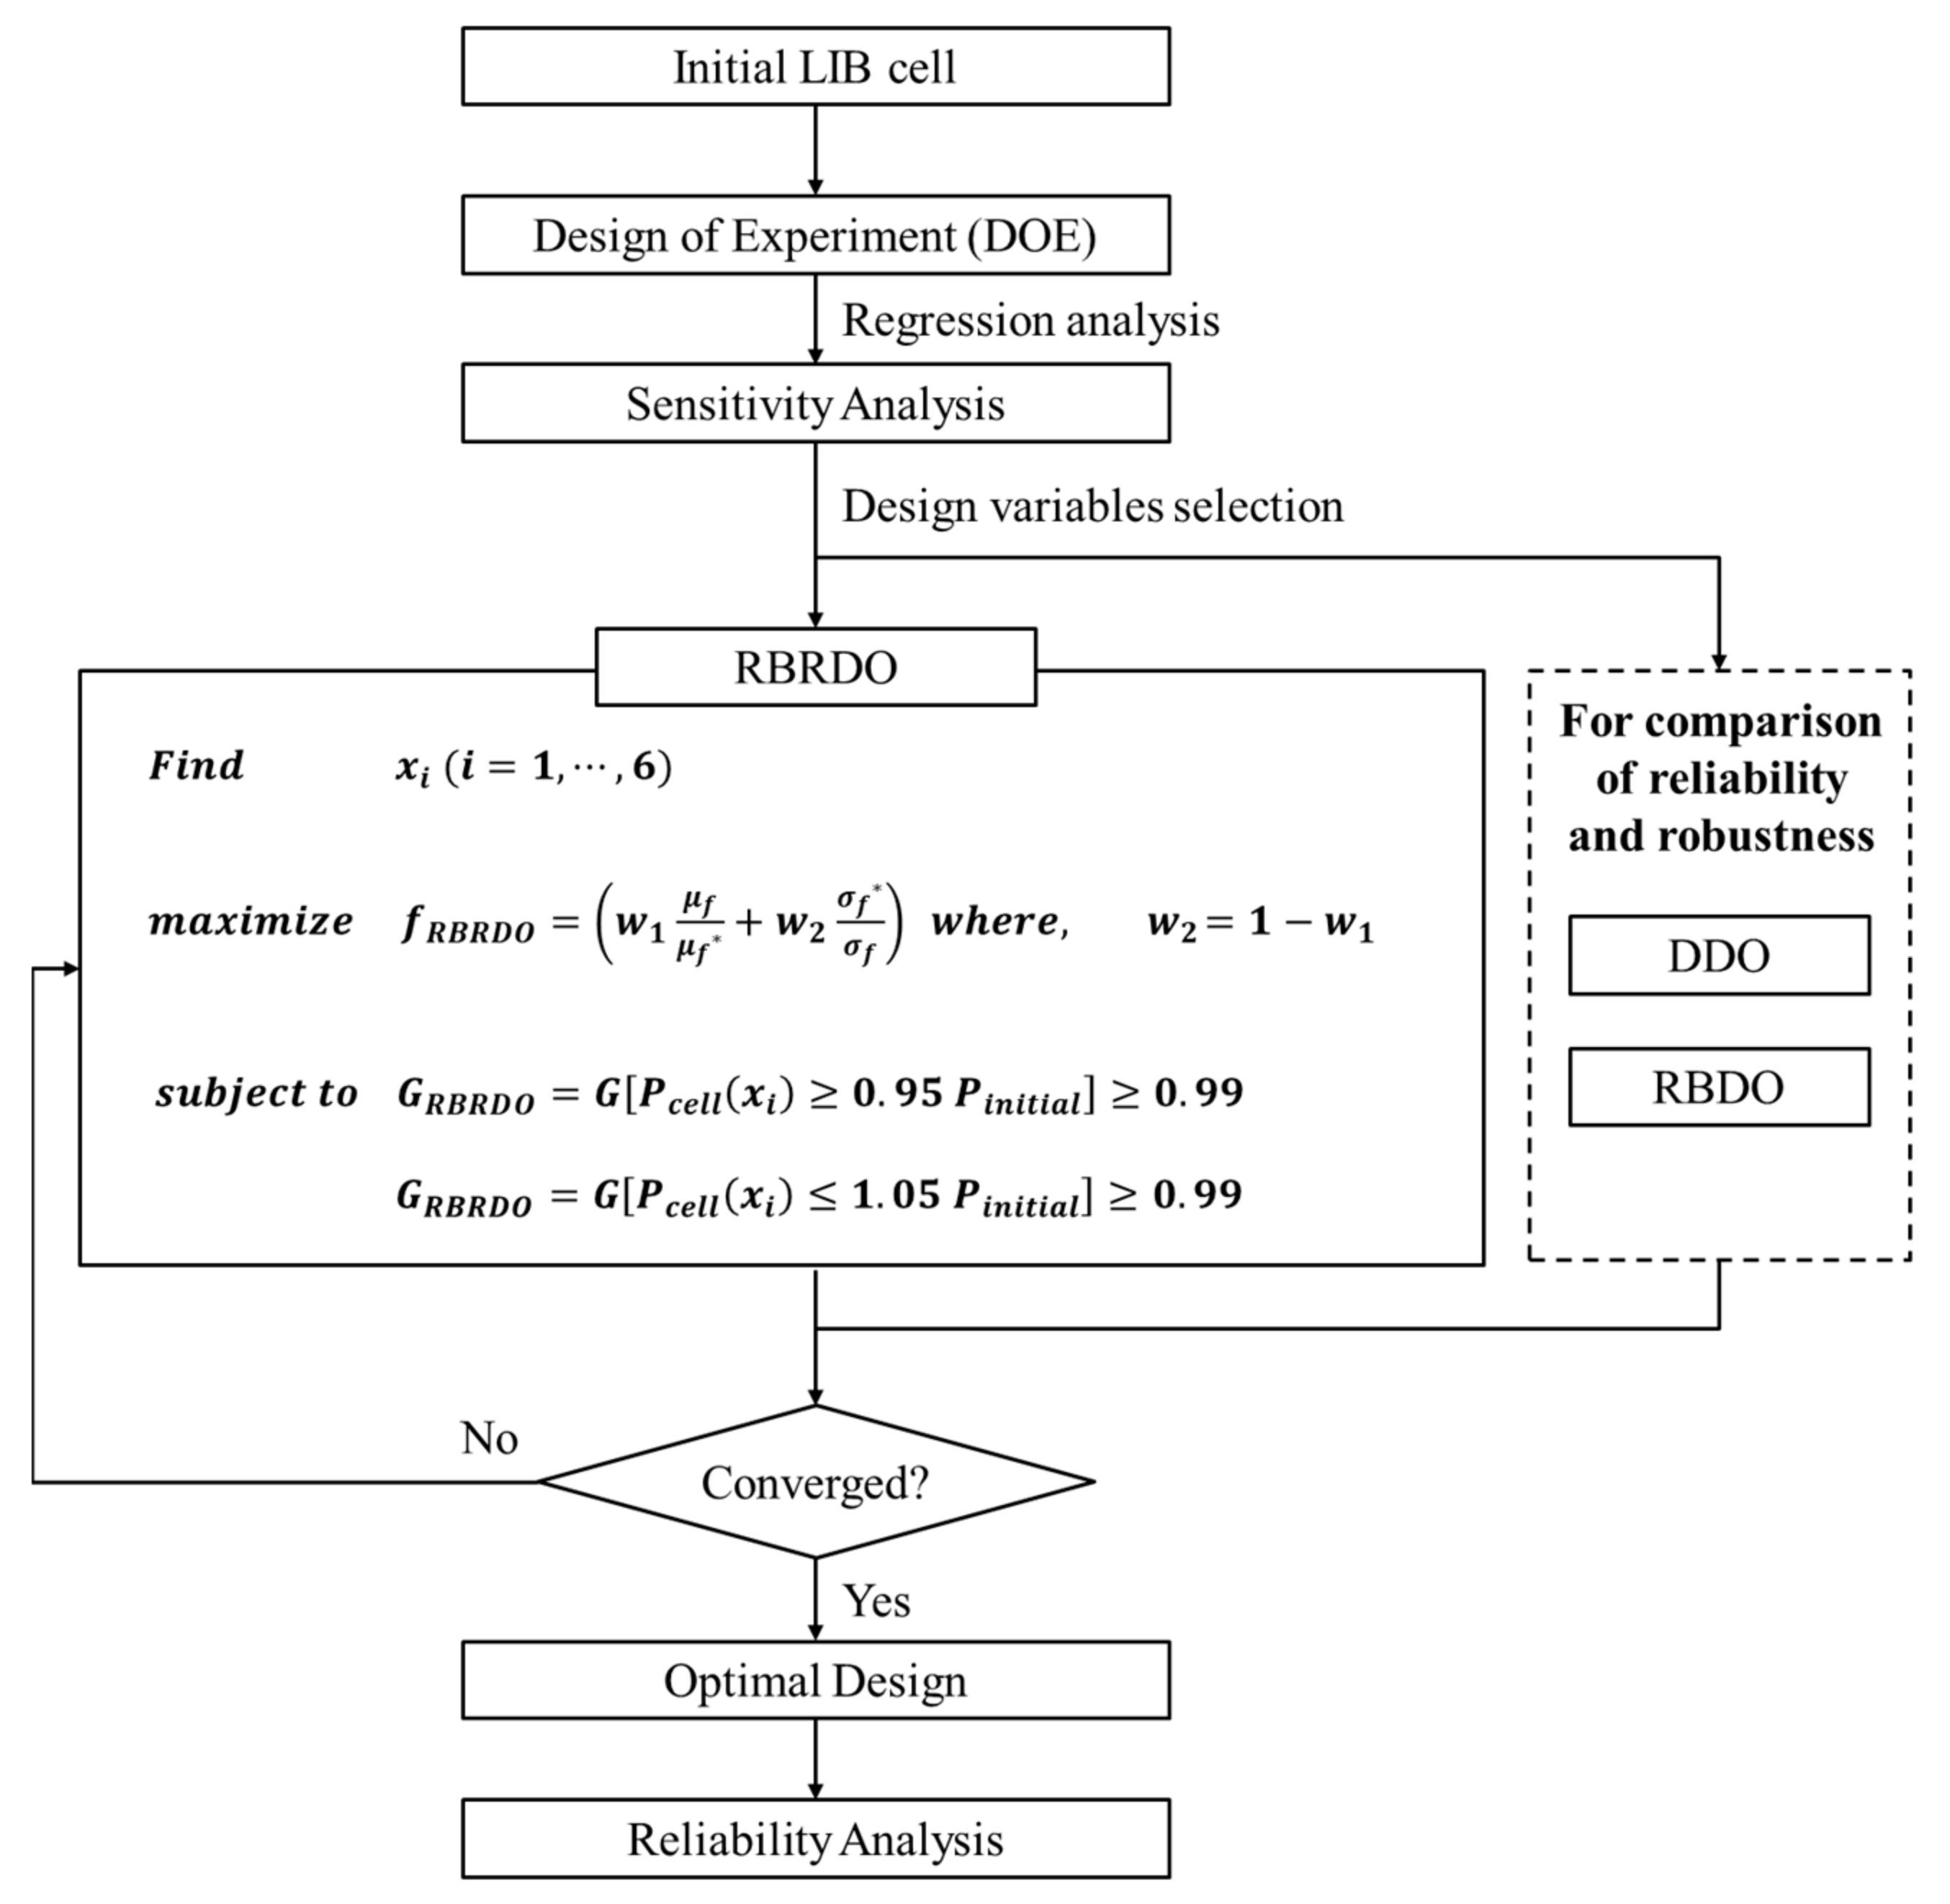
3.3. Formulation of RBRDO

RBRDO is an optimal design method that considers the robustness of the objective function and can obtain reliability within a desired range for constraints. RBRDO is defined as a multi-objective function, and performance improvement is defined as the average value of the stochastic distribution of the objective function. Moreover, the robustness of the objective function is a performance that is less sensitive to changes in design variables and is defined as the standard deviation of the stochastic distribution of the objective function. The reliability of constraint conditions is defined as the probabilistic distribution of performance for uncertain design variables.
Equation (8) shows the formulation of the RBRDO problem. Figure 4 illustrates the RBRDO process. Six design variables were determined through sensitivity analysis. RBRDO, DDO, and RBDO were performed using the determined design variables, and the results of the reliability analysis were sequentially compared. The RBRDO of the LIB cell is a multi-objective problem to minimize the standard deviation in the energy density while also maximizing the mean of the energy density. The first objective function is the mean ratio ( μ f / μ f * ), which is the ratio of the mean of the energy density ( μ f ) to that of the initial LIB cell ( μ f * ). The second objective function is the standard deviation ratio ( σ f * / σ f ), which is the ratio of the standard deviation in the initial energy density ( σ f * ) to that in the energy density ( σ f ). The standard deviation ratio represents the cell-to-cell variation of the LIB cell. x i represents the six design variables chosen in Section 3.2. The constraint was defined by the failure rate, which was set to possess a reliability of 99% within a change rate of ±5% compared to the initial power density [37]. The sequential optimization and reliability assessment (SORA) algorithm was used in RBRDO [37].
F i n d       x i i = 1 , , 6 m a x i m i z e           f R B R D O = w 1 μ f μ f * + w 2 σ f * σ f                     w h e r e ,     w 2 = 1 w 1 s u b j e c t   t o             g R B R D O = g P c e l l x i 0.95   P i n i t i a l 0.99 g R B R D O = g P c e l l x i 1.05   P i n i t i a l 0.99

4. Discussion

4.1. RBRDO Results

Figure 5 shows the convergence history of two objective functions related to the energy density—the mean and standard deviation—during optimization. Table 4 shows the changes in design variables and performance before and after RBRDO. Figure 6 shows the superiority of the optimal design result by comparing the probability distributions of the energy density and the power density of the initial design and the results after RBRDO. With optimization, the mean of the energy density was 185.21 Wh/kg, representing an increase of 33.5% compared to the initial value. The mean of the power density was 139.51 W/kg, and the constraint condition was satisfied with a failure rate of 0.6%.

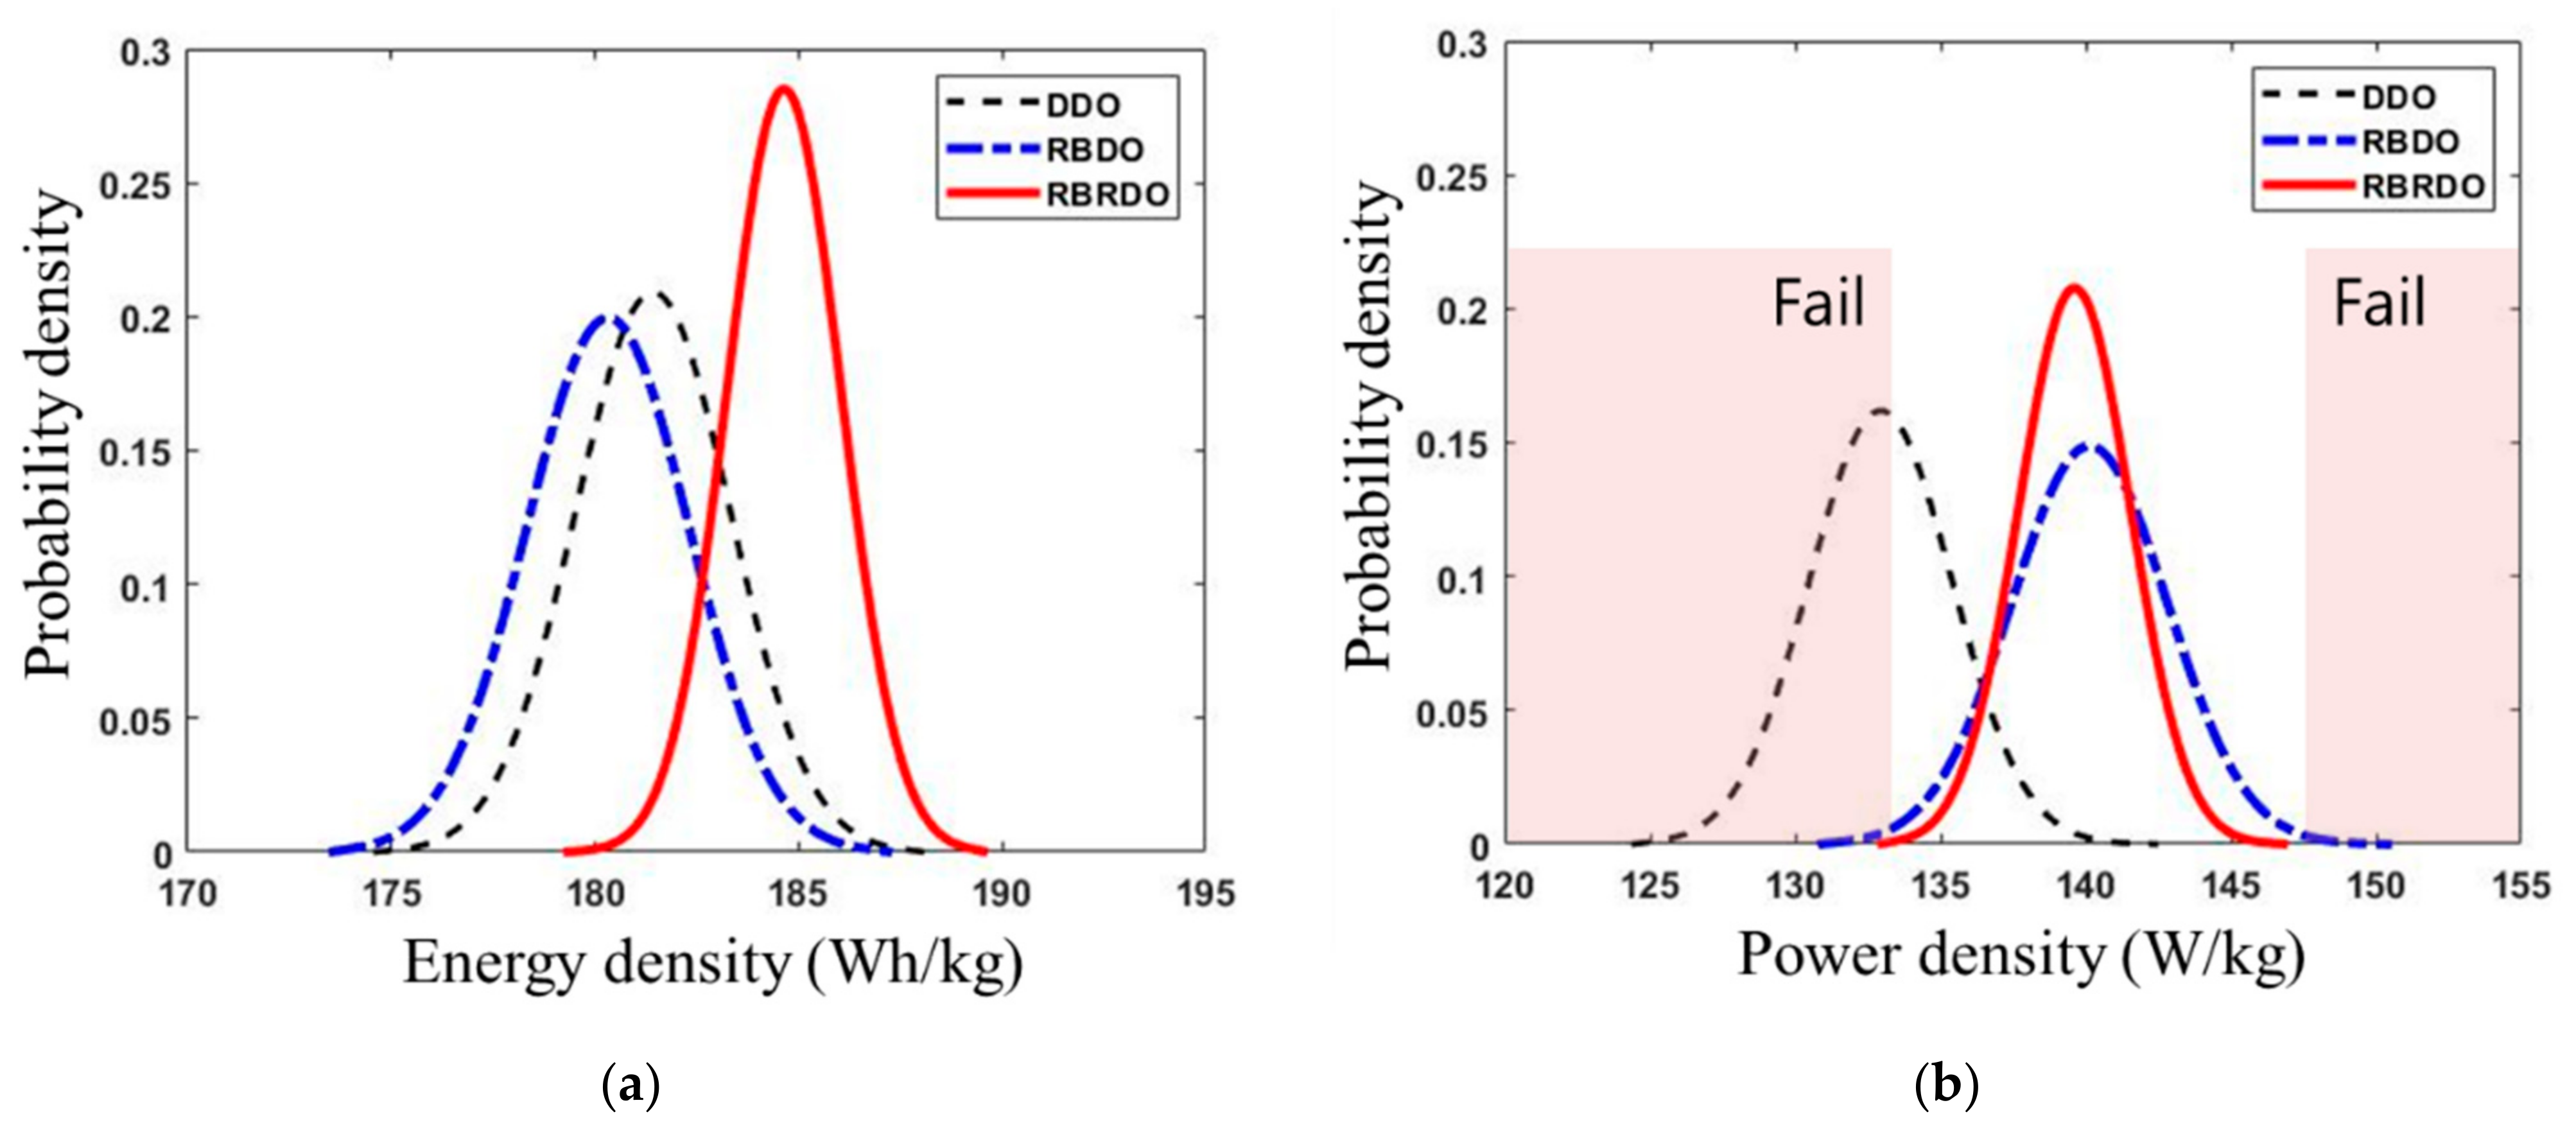
4.2. Comparison of Results from RBRDO with Those from DDO and RBDO

In this study, RBRDO was performed to maximize the mean of the energy density while reducing the failure rate and cell-to-cell variations arising from the manufacturing uncertainty of LIB cells. To confirm the superiority of the reliability and robustness offered by RBRDO, its reliability results were compared with those from the conventional DDO and RBDO approaches. Compared with the traditional DDO, RBRDO improves the reliability while also considering the uncertainty. In addition, compared with RBDO, RBRDO minimizes the standard deviation in the performance, making it possible to obtain a narrow performance distribution by increasing the robustness.
Table 5 shows the difference in energy density, output density, and the defect rate of each optimization result. Figure 7 shows the probability distribution of energy density and power density as the reliability analysis result for each optimization. With DDO, the mean of the energy density increased by 30.8% compared to the initial value, but the failure rate was 55.8%. This indicates that a reduction in the failure rate entails an increase in the reliability, requiring consideration of the distribution of the design variables. With RBDO, the mean of the energy density increased by 29.9% compared to the initial value, the failure rate was 1.0%, and the standard deviation in the energy density was 2.00 Wh/kg. However, since RBDO does not consider the robustness, it cannot reduce the cell-to-cell variations. With RBRDO, the mean of the energy density increased by 33.5% compared to the initial value, the failure rate was 0.6% (representing a reduction of 98.9% compared to that obtained by DDO), and the standard deviation in the energy density was reduced by 30.0% compared to that obtained by RBDO.

5. Conclusions

In this study, RBRDO was performed to maximize the energy density while reducing the failure rates and cell-to-cell variations due to the manufacturing uncertainty of LIB cells. The multi-objective functions in the RBRDO of the LIB cell were defined as the maximization of the mean of the energy density, and the minimization of the standard deviation in the energy density. Sensitivity analysis using the DOE was performed for nine design factors, and six design factors sensitive to the energy density and power density were chosen as the design variables; these were the anode particle size, cathode porosity, anode thickness, cathode thickness, negative current collector thickness, and separator thickness. The constraint condition was set to a reliability of 99% within a change rate of ±5% compared to the initial power density.
Using RBRDO, the optimal mean of the energy density was 184.6 Wh/kg, which represented an increase of 33.5% compared to the initial value. The conventional DDO and RBDO were also performed to demonstrate the superiority of the reliability and robustness offered by RBRDO, and all results were compared through reliability analysis considering the distribution of the design variables. Comparison of the RBRDO and DDO results confirmed that the failure rate was reduced by 98.9% through improved reliability. Comparison of the RBRDO and RBDO results confirmed that the standard deviation in the energy density, representing the cell-to-cell variations, was reduced by 30.0% through improved robustness. Thus, the RBRDO of LIB cells maximized the energy density while simultaneously reducing the failure rate and cell-to-cell variations arising from manufacturing uncertainties. The RBRDO of LIB cells presented in this paper is applied to the actual initial design stage of LIB cells, and it is expected that the energy density can be improved while considering the manufacturing uncertainty of LIB cells.

Author Contributions

Conceptualization, J.P. (Jinhwan Park); Data Curation, J.M.; Formal Analysis, J.Y.; Investigation, D.Y. and J.P. (Jungtae Park); Methodology, J.P. (Jinhwan Park); Software, J.P. (Jinhwan Park); Supervision, C.K.; Validation, D.L.; Visualization, S.L.; Writing—original draft, J.P. (Jinhwan Park). All authors have read and agreed to the published version of the manuscript.

Funding

This paper was supported by Konkuk University Premier Research Fund in 2019.

Institutional Review Board Statement

Not applicable.

Informed Consent Statement

Not applicable.

Data Availability Statement

Not applicable.

Acknowledgments

Not applicable.

Conflicts of Interest

The authors declare no conflict of interest.

Nomenclature

List of Symbols
E c e l l Energy density (Wh/kg)
P c e l l Power density (W/kg)
M c e l l Mass of cell (kg)
V c e l l Electric potential of cell
i a p p Discharge current of cell
t e n d Discharge time
x i Design variable
μ f Mean of energy density
μ f * Mean of initial energy density
σ f Standard deviation in energy density
σ f * Standard deviation in initial energy density
w Weighting factor
f x Objective function
g x Constraint function
Subscripts and superscripts
i n i t i a l Initial value
c e l l Lithium-ion battery cell

References

  1. De, S.; Northrop, P.W.; Ramadesigan, V.; Subramanian, V.R. Model-based simultaneous optimization of multiple design parameters for lithium-ion batteries for maximization of energy density. J. Power Sources 2013, 227, 161–170. [Google Scholar] [CrossRef]
  2. Kim, C.-W.; Yang, H.-I.; Lee, K.-J.; Lee, D.-C. Metamodel-Based Optimization of a Lithium-Ion Battery Cell for Maximization of Energy Density with Evolutionary Algorithm. J. Electrochem. Soc. 2019, 166, A211–A216. [Google Scholar] [CrossRef]
  3. Kim, J.-S.; Lee, D.-C.; Lee, J.-J.; Kim, C.-W. Optimization for maximum specific energy density of a lithium-ion battery using progressive quadratic response surface method and design of experiments. Sci. Rep. 2020, 10, 15586. [Google Scholar] [CrossRef]
  4. Ahmed, W.; Hanif, A.; Kallu, K.D.; Kouzani, A.Z.; Ali, M.U.; Zafar, A. Photovoltaic Panels Classification Using Isolated and Transfer Learned Deep Neural Models Using Infrared Thermographic Images. Sensors 2021, 21, 5668. [Google Scholar] [CrossRef]
  5. Ali, M.U.; Saleem, S.; Masood, H.; Kallu, K.D.; Masud, M.; Alvi, M.J.; Zafar, A. Early hotspot detection in photovoltaic modules using color image descriptors: An infrared thermography study. Int. J. Energy Res. 2021. [Google Scholar] [CrossRef]
  6. Mannan, J.; Kamran, M.A.; Ali, M.U.; Mannan, M.M.N. Quintessential strategy to operate photovoltaic system coupled with dual battery storage and grid connection. Int. J. Energy Res. 2021. [Google Scholar] [CrossRef]
  7. Yuan, C.; Deng, Y.; Li, T.; Yang, F. Manufacturing energy analysis of lithium ion battery pack for electric vehicles. CIRP Ann. 2017, 66, 53–56. [Google Scholar] [CrossRef]
  8. Zubi, G.; Dufo-López, R.; Carvalho, M.; Pasaoglu, G. The lithium-ion battery: State of the art and future perspectives. Renew. Sustain. Energy Rev. 2018, 89, 292–308. [Google Scholar] [CrossRef]
  9. Ma, J.; Li, Y.; Grundish, N.S.; Goodenough, J.B.; Chen, Y.; Guo, L.; Peng, Z.; Qi, X.; Yang, F.; Qie, L.; et al. The 2021 battery technology roadmap. J. Phys. D Appl. Phys. 2021, 54, 183001. [Google Scholar] [CrossRef]
  10. Pagliaro, M.; Meneguzzo, F. The driving power of the electron. J. Phys. Energy 2018, 1, 011001. [Google Scholar] [CrossRef]
  11. Jang, J.; Cho, S.-G.; Lee, S.-J.; Kim, K.-S.; Kim, J.-M.; Hong, J.-P.; Lee, T.H. Reliability-based robust design optimization with kernel density estimation for electric power steering motor considering manufacturing uncertainties. IEEE Trans. Magn. 2015, 51, 18–21. [Google Scholar] [CrossRef]
  12. Heimes, H.; Lienemann, C.; Kampker, A.; Locke, M. Battery Cell Production Process. 23 February 2019. Available online: https://www.researchgate.net/publication/330902286_Lithium-ion_Battery_Cell_Production_Process (accessed on 15 August 2021).
  13. Mohanty, D.; Li, J.; Born, R.; Maxey, L.C.; Dinwiddie, R.; Daniel, C.; Wood, D. Non-destructive evaluation of slot-die-coated lithium secondary battery electrodes by in-line laser caliper and IR thermography methods. Anal. Methods 2014, 6, 674–683. [Google Scholar] [CrossRef]
  14. DuBeshter, T.; Sinha, P.K.; Sakars, A.; Fly, G.W.; Jorne, J. Measurement of Tortuosity and Porosity of Porous Battery Electrodes. J. Electrochem. Soc. 2014, 161, A599–A605. [Google Scholar] [CrossRef]
  15. Santhanagopalan, S.; White, R.E. Modeling Parametric Uncertainty Using Polynomial Chaos Theory. ECS Trans. 2006, 3, 243–256. [Google Scholar] [CrossRef]
  16. Shin, D.; Poncino, M.; Macii, E.; Chang, N. A statistical model-based cell-to-cell variability management of Li-ion battery pack. IEEE Trans. Comput. Des. Integr. Circuits Syst. 2015, 34, 252–265. [Google Scholar] [CrossRef]
  17. Cannarella, J.; Arnold, C.B. Ion transport restriction in mechanically strained separator membranes. J. Power Sources 2013, 226, 149–155. [Google Scholar] [CrossRef]
  18. Rumpf, K.; Rheinfeld, A.; Schindler, M.; Keil, J.; Schua, T.; Jossen, A. Influence of Cell-to-Cell Variations on the Inhomogeneity of Lithium-Ion Battery Modules. J. Electrochem. Soc. 2018, 165, A2587–A2607. [Google Scholar] [CrossRef]
  19. Barsukov, Y. Battery Cell Balancing: What to Balance and How; Texas Instruments: Dallas, TX, USA, 2005; pp. 1–8. Available online: http://focus.ti.com/download/trng/docs/seminar/Topic2-Battery Cell Balancing-What to Balance and How.pdf (accessed on 15 August 2021).
  20. Aizpuru, I.; Iraola, U.; Canales, J.M.; Unamuno, E.; Gil, I. Battery pack tests to detect unbalancing effects in series connected Li-ion cells. In Proceedings of the 4th International Conference on Clean Electrical Power: Renewable Energy Resources Impact, ICCEP 2013, Alghero, Italy, 11–13 June 2013; pp. 99–106. [Google Scholar] [CrossRef]
  21. Bentley, W.F. Cell balancing considerations for lithium-ion battery systems. In Proceedings of the Twelfth Annual Battery Conference on Applications and Advances, Long Beach, CA, USA, 14–17 January 1997; pp. 223–226. [Google Scholar] [CrossRef]
  22. Ziegler, A.; Oeser, D.; Hein, T.; Montesinos-Miracle, D.; Ackva, A. Reducing Cell to Cell Variation of Lithium-Ion Battery Packs during Operation. IEEE Access 2021, 9, 24994–25001. [Google Scholar] [CrossRef]
  23. Khan, H.F.; Hanif, A.; Ali, M.U.; Zafar, A. A Lagrange multiplier and sigma point Kalman filter based fused methodology for online state of charge estimation of lithium-ion batteries. J. Energy Storage 2021, 41, 102843. [Google Scholar] [CrossRef]
  24. Samanta, A.; Chowdhuri, S. Active Cell Balancing of Lithium-Ion Battery Pack Using Dual DC-DC Converter and Auxiliary Lead-Acid Battery. J. Energy Storage 2021, 33, 102109. [Google Scholar] [CrossRef]
  25. Doyle, M.; Fuller, T.F.; Newman, J.S. Modeling of galvanostatic charge and discharge of the lithium/polymer/insertion cell. J. Electrochem. Soc. 1993, 140, 1526–1533. [Google Scholar] [CrossRef]
  26. Doyle, M.; Newman, J.; Gozdz, A.S.; Schmutz, C.N.; Tarascon, J. Comparison of Modeling Predictions with Experimental Data from Plastic Lithium Ion Cells. J. Electrochem. Soc. 1996, 143, 1890–1903. [Google Scholar] [CrossRef]
  27. Srinivasan, V.; Newman, J. Design and optimization of a natural graphite/iron phosphate lithium-ion cell. J. Electrochem. Soc. 2004, 151, A1530–A1538. [Google Scholar] [CrossRef] [Green Version]
  28. Yoo, D.; Park, J.; Moon, J.; Kim, C. Reliability-Based Design Optimization for Reducing the Performance Failure and Maximizing the Specific Energy of Lithium-Ion Batteries Considering Manufacturing Uncertainty of Porous Electrodes. Energies 2021, 14, 6100. [Google Scholar] [CrossRef]
  29. Jang, G.U.; Kim, C.-W.; Bae, D.; Cho, Y.; Lee, J.-J.; Cho, S. Reliability-based robust design optimization for torque ripple reduction considering manufacturing uncertainty of interior permanent magnet synchronous motor. J. Mech. Sci. Technol. 2020, 34, 1249–1256. [Google Scholar] [CrossRef]
  30. Doh, J.; Yang, Q.; Raghavan, N. Reliability-based robust design optimization of polymer nanocomposites to enhance percolated electrical conductivity considering correlated input variables using multivariate distributions. Polymer 2020, 186, 122060. [Google Scholar] [CrossRef]
  31. Carneiro, G.D.N.; António, C.C. Reliability-based Robust Design Optimization with the Reliability Index Approach applied to composite laminate structures. Compos. Struct. 2019, 209, 844–855. [Google Scholar] [CrossRef]
  32. Lim, J.; Jang, Y.S.; Chang, H.S.; Park, J.C.; Lee, J. Role of multi-response principal component analysis in reliability-based robust design optimization: An application to commercial vehicle design. Struct. Multidiscip. Optim. 2018, 58, 785–796. [Google Scholar] [CrossRef]
  33. Xue, N.; Du, W.; Gupta, A.; Shyy, W.; Sastry, A.M.; Martins, J. Optimization of a Single Lithium-Ion Battery Cell with a Gradient-Based Algorithm. J. Electrochem. Soc. 2013, 160, A1071–A1078. [Google Scholar] [CrossRef] [Green Version]
  34. Zhu, J.; Wierzbicki, T.; Li, W. A review of safety-focused mechanical modeling of commercial lithium-ion batteries. J. Power Sources 2018, 378, 153–168. [Google Scholar] [CrossRef]
  35. Wang, Q.; Nakashima, T.; Lai, C.; Mutsuda, H.; Kanehira, T.; Konishi, Y.; Okuizumi, H. Modified Algorithms for Fast Construction of Optimal Latin-Hypercube Design. IEEE Access 2020, 8, 191644–191658. [Google Scholar] [CrossRef]
  36. PIDOTECH Inc. PIAnO User’s Manuals and Tutorials; PIDOTECH Inc.: Seoul, Korea, 2019. [Google Scholar]
  37. Du, X.; Chen, W. Sequential optimization and reliability assessment method for efficient probabilistic design. J. Mech. Des. 2004, 126, 225–233. [Google Scholar] [CrossRef] [Green Version]
Figure 1. Schematic of the Li-ion battery cell.
Energies 14 06236 g001
Figure 2. Comparison of discharge curves of the LIB cell between the experiment [26] and numerical analysis.
Energies 14 06236 g002
Figure 3. Sensitivity results for design factors sensitive to (a) energy density and (b) power density.
Energies 14 06236 g003
Figure 4. Flowchart of the RBRDO process.
Energies 14 06236 g004
Figure 5. Convergence history for optimization of the objective functions related to the energy density: (a) mean and (b) standard deviation.
Energies 14 06236 g005
Figure 6. Comparison of initial and RBRDO results for (a) energy density and (b) power density.
Energies 14 06236 g006
Figure 7. Comparison of results obtained by DDO, RBDO, and RBRDO for (a) energy density and (b) power density.
Energies 14 06236 g007
Table 1. Parameters and dimensions of initial LIB cell [26].
ParametersValue
AnodeSeparatorCathodeNegative
Current
Collector
(Cu)
Positive
Current
Collector
(Al)
Electrolyte
Thickness ( μ m )100521741010-
Porosity0.3570.460.444---
Particle size ( μ m )12.5-8.5---
Density ( kg / m 3 )22709004140870027001210
Diffusivity ( m 2 / s ) 3.9 × 10 14 - 1.0 × 10 13 -- 7.5 × 10 11
Reaction rate constant 2.0 × 10 11 - 2.0 × 10 11 ---
Electrical conductivity ( S / m )100-3.8---
Initial concentration ( mol / m 3 )22,055-4000--1000
Maximum concentration ( mol / m 3 )26,390-22,860---
Table 2. Probabilistic distributions of LIB cell parameters [13,14,15,16,17].
ParametersMeanStandard DeviationDistribution
Anode particle size (µm)12.5±0.42Normal
Cathode particle size (µm)8.5±0.447Normal
Anode porosity0.357±0.013Normal
Cathode porosity0.444±0.0025Normal
Anode thickness (µm)100±1.27Normal
Cathode thickness (µm)174±2.57Normal
Negative current collector thickness (µm)10±0.76Normal
Positive current collector thickness (µm)10±0.23Normal
Separator thickness (µm)52±0.23Normal
Table 3. Design factors and their bounds [32,33].
Design FactorsLower BoundUpper Bound
Anode particle size (µm)0.220
Cathode particle size (µm)0.550
Anode porosity0.10.6
Cathode porosity0.10.6
Anode thickness (µm)40250
Cathode thickness (µm)40250
Negative current collector thickness (µm)1015
Positive current collector thickness (µm)1025
Separator thickness (µm)10100
Table 4. Comparison of design variables and performance between initial and optimal designs.
Design Variables and
Performance
MeanRate of Change (%)
Initial DesignOptimal Design
Anode particle size (µm)12.50.653−94.8
Cathode porosity0.4440.100−77.5
Anode thickness (µm)100121+21.0
Cathode thickness (µm)12598.5+21.2
Negative current collector thickness (µm)1010.7+7.00
Separator thickness (µm)5251.8−0.39
Energy density (Wh/kg)138.71184.64+33.1
Power density (W/kg)140.05139.62−0.31
Failure (%)-0.60-
Table 5. Comparison of results obtained by DDO, RBDO, and RBRDO.
Optimal Design Methodology
DDORBDORBRDO
Energy density
(Wh/kg)
Mean181.424180.3143184.6439
Standard deviation1.9074811.9997021.399288
Power density
(W/kg)
Mean132.9427140.1326139.6208
Standard deviation2.4633612.6830311.919787
Failure (%)55.801.00.6
Publisher’s Note: MDPI stays neutral with regard to jurisdictional claims in published maps and institutional affiliations.

