Article

Assessing the Risk to Indoor Thermal Environments on Industrial Sites Offering AHU Capacity for Demand Response

1
Department of Mechanical, Biomedical and Manufacturing Engineering, Munster Technological University, Bishopstown, T12 P928 Cork, Ireland
2
Intelligent Efficiency Research Group (IERG), Department of Civil and Environmental Engineering, University College Cork, College Road, T12 K8AF Cork, Ireland
3
DePuy Ireland Unlimited Company, Loughbeg, Ringaskiddy, P43 NP38 Cork, Ireland
4
Department of Process, Energy and Transport Engineering, Munster Technological University, Bishopstown, T12 P928 Cork, Ireland
*
Author to whom correspondence should be addressed.
Energies 2021, 14(19), 6261; https://doi.org/10.3390/en14196261
Submission received: 16 August 2021 / Revised: 24 September 2021 / Accepted: 29 September 2021 / Published: 1 October 2021

Abstract

:
Increasing participation in demand response within the industrial sector may be crucial to growing the levels of available flexible capacity required to reliably control national electricity grids as renewable generation increases to satisfy emission targets. This research aims to assist the uptake of demand response in the industrial sector by investigating risk to indoor thermal environments on industrial sites offering air handling unit capacity for demand response. This evaluation uses a systematic model-based approach, calibrated and validated with empirical data from a relevant case study industrial building to assess risk through a number of scenarios. The conditions investigated cover several relevant grid response times and durations, and national and international extreme external ambient temperatures in the past, present and future under a variety of temperature limits. The study demonstrated that there is very low risk to the case study site participating in demand response, with only 15 of 264 initial and 284 of 936 total scenarios triggering any risk. The major factors affecting risk levels identified were more stringent temperature limits and the influence of more extreme climates. The development and implementation of this concept has considerable potential to benefit industrial participants and the wider national electricity grids.

1. Introduction

In order to meet binding international targets and climate commitments limiting global warming to less than 2 °C relative to pre-industrial levels [1], governments and policy-makers worldwide are urgently driving strategies to reduce emissions with particular emphasis on Renewable Energy Sources (RES). The inherent variability and specific intricacies of incorporating ever-growing levels of RES creates multi-factor challenges for Transmission System Operators (TSO) tasked with maintaining reliable control of national electricity grids [2]. In 2019, the share of RES in the Irish generation fuel mix increased to 25.7% compared with 22.3% in 2018, primarily due to the significant increase in wind generation [3]. Overall, the share of RES in the electricity generation mix increased by 13% in 2019 compared to the previous year [3]. Throughout 2019, wind generation accounted for 31.3% of normalised electricity generated, making it the second largest source of electricity generation after natural gas in the Irish network [3]. This increase and continued growth in RES are vital for Ireland to achieve its emission reduction targets, particularly the EU-wide emissions policies aggressively chasing a 40% reduction by 2030 [4]. A major factor to achieving this is increasing the level of RES and non-synchronous generation that can be safely and reliably included in the grid at any time, as this will help the transition away from fossil fuels towards a cleaner and more stable electricity grid. Ireland’s TSO rolled out and implemented the multi-year “Delivering a Secure, Sustainable Electricity System” (DS3) programme [5] to assist this aim. The main goal of this programme is to provide the structure, policies and tools for the Irish electricity grid to increase the level of RES required to meet its ambitious emission reduction targets in a safe and reliable fashion. To date, the programme has already increased instantaneous RES levels on the grid from 50 to 65%, with plans already in place to strive towards consistent levels of 75% and above [5]. Important aspects of this process are the system services and incentive schemes put in place for electricity producers and consumers to participate in the electricity market for both their own benefit, earning the financial rewards and green imagine, and the grids benefit of increased flexible capacity and reliable control capabilities. This has been achieved to some degree through individual large electricity users being included in Demand Response (DR) schemes, but further development and inclusion of more response assets or aggregated groups of smaller units will be required to reach the ambitious target of 75% [5]. The industrial sector is a prime candidate for aggregated response sources as they have diverse portfolios of suitable response assets, where individual power consumption is generally high, advanced metering infrastructure is often already in place, policies and standards drive innovation and cost-effective strategies are rarely overlooked [6]. This compliments the DS3 programme, as the Irish industrial sector accounted for 26.2% of final electricity consumption in 2019 [3]. As a result, the capacity exists to provide meaningful impact on a national scale through further developments in this sector.
The smart grid philosophy and concept of Demand Side Management (DSM) are regarded as integral foundations of the “electricity grid of the future” [7]. DSM can play a role in solving intermittent supply issues, addressing supply shortages, optimizing resource allocation and controlling the paradigm shifts in load growth and makeup [8]. A considerable factor in this area is the increasing role and emergence of electrical “prosumers”, regarded as both producers and consumers of electricity by a TSO [9]. This move towards a more interactive, dual flow and user influenced electricity grid is driven by the continued uptake of distributed energy resources and policy-makers encouraging sustainability and energy efficiency measures [10]. The DSM and smart grid interaction capabilities of commercial and purpose-built office buildings has been well explored. The ability of these buildings to reduce or shift electricity use to improve grid control and reliability have previously been explored, with one study investigating the possibility of shutting down part of the operating chillers to react to fast DR events [11]. Other studies addressing building DR schemes have investigated the optimisation of a commercial building heating system [12], using simulated values to run evaluations and a simplified model approach where the computational demand was unmanageable. Utilising the thermal inertia of a commercial building for DR has also been studied [13], using modelled and simulated data for validation and experiments in the absence of a case study or practical building information. A simulated case study was also carried out applying model control and DSM strategies to a commercial building, resulting in a model to analyse this and its distinct goal of reducing peak power demand [14]. Extensive research has been conducted in the commercial sector, with other notable contributions including; the potential demand side flexibility of single function office buildings [15,16], similarly occupied buildings such as classrooms [17], smart buildings [18] and other types of air-conditioned buildings [19]. The optimised scheduling of Heating Ventilation and Air Conditioning (HVAC) systems in multi zone commercial office spaces for DR has also been studied [20], demonstrating the available opportunities to extend these concepts beyond the purpose-built and well documented commercial sector.
To achieve the high levels of flexibility required to maintain the balance of the national electricity grid a number of new sources of response capacity will need to be found. One large sector with considerable potential is the industrial sector, as this accounts for over a quarter of the country’s final electricity consumption [3]. Therefore, if even a small portion of the quantity being used in this sector could be incorporated into the flexible capacity available to the TSO, it would be highly beneficial. The value then of identifying and validating a low to risk free asset with a regular operating schedule in this sector could have a sizeable positive impact on the national grid. Certain aspects are already being explored in the literature to date, with specific industrial systems and processes being investigated for their suitability in DR schemes. One study evaluates air separation units on an industrial site for the potential to synchronise their operation with DR schedules [21]. While these are a prime example of a large energy consuming industrial asset, their operation is agnostic to time of production and so less risk surrounds them being included in DSM programmes. Further studies have investigated the potential of industrial energy users participating in reserve electricity markets in continental Europe [22,23] and the integration of load flexibility potential from large industrial refrigeration and cooling systems into flexible demand portfolios [24,25]. Existing published research and the ongoing work in this area highlights the considerable opportunities as well as illustrates the benefits yet to be captured. The scale of individual industrial units and potential to aggregate multiple assets, such as Air Handling Units (AHU), chillers and other utilities systems to assist in balancing the grid further demonstrates the potential within this sector.
Effectively capturing AHU and building thermal response dynamics remains an integral challenge to overcome when modelling buildings as an element in DSM flexibility programmes. Considerable research has also been conducted to date into modelling the internal temperature conditions of naturally ventilated office spaces [26,27]. A variety of modelling concepts have been employed in this area, with Grey Box (GB) models [26] and Resistance Capacitance (RC) techniques [28] being the predominant methodologies. In modelling terms, White Box (WB) models are physics-based and mechanistic in operation, typically utilising a large number of building descriptive parameters and system specifications, whereas black box models are generally data-driven and use complex algorithms to map the relationship between system inputs and outputs using large amounts of empirical data. GB models are closer to WB models in that they are mechanistic by design, however the iterative physics-based operations are simplified and aggregated. Thus, GB models are less computationally demanding and require fewer building descriptive parameters [26]. RC models are based on the shared relationship between electrical circuits and thermal systems, where the thermal energy flow and storage in a building can be represented by resistors (R) and capacitors (C), similarly to those in an electrical circuit [28]. In the industrial sector, studies have been conducted evaluating the synergies between manufacturing heat sources and HVAC loads to reduce peak power demand [29] as well as exploring passive measures for preventing overheating in an industrial building [30]. However, an area that has received little attention is that of mechanically ventilated office spaces in the industrial sector, for example manufacturing and pharmaceutical sites where production is the primary function but office space still accounts for a significant proportion of the facility. These buildings are often characterised as large, low complexity, prefabricated shells, typically classified as very light to medium internal thermal storage capacity according to ISO 52016-1, the International Organisation for Standardisation’s standard for energy performance of buildings [31]. These office spaces are also influenced by the thermal comfort and temperature ramp requirements of the predominant industry standards, for example ASHRAE Standard 55—Thermal Environmental Conditions for Occupancy [32]. The thermo-physical characteristics of these particular industrial office spaces and associated operations of their AHUs are generally not directly comparable to their custom-built commercial counterparts. This is largely due to the differentiating operational culture on large manufacturing sites, varying priorities and targets in the industrial sector, dominant construction types and unique electricity supply and demand dynamics at the site-grid interface. As such, there is value to be gained for the site “prosumer” as well as at the TSO and national grid by thoroughly investigating this area.

Proposed Contributions

The aim of this research is to evaluate the suitability and assess any risk to indoor thermal environments within industrial office spaces providing AHU capacity to the national electricity grid for DR. To the author’s knowledge, there is currently no study methodically evaluating this potential for the Irish grid and industrial sector. Therefore, the intention is to increase the body of knowledge on this topic in the Irish industrial sector, particularly as its energy consumption accounted for 2295 ktoe compared to 1760 ktoe in the services sector in 2019 [3]. With manufacturing making up almost 40% of the industrial sector where the majority of these buildings are found, even capturing a fraction of the non-process critical assets represents a significant capacity potential. One of the main priorities is to address the unease with isolating systems, adjusting operating procedures or varying parameters due to the validation culture ingrained in industry to satisfy business requirements. Thus, clarifying the perceived risk associated with industrial participation in national electricity markets is essential to the development of this topic. The overarching contribution of this research is to increase the body of knowledge and reduce the perceived risk of AHUs on industrial sites participating in DR schemes. Additionally, beyond the main contribution of assessing any risk, the sensitivity of this risk and impact of boundary conditions and other impacts will also be evaluated.
The remainder of this paper is divided into four further sections. The study methodology is presented in Section 2, outlining the modelling approach, methodology, calibration and scope of the analysis. Section 3 demonstrates the results of the study, covering the model performance and outputs of the simulated scenarios. Discussion of these results and potential impacts on the research landscape follows in Section 4. Finally, Section 5 presents the conclusions from this research, addresses possible limitations and highlights potential avenues for future work on this topic.

2. Materials and Methods

2.1. Overview of the Approach

Industrial AHUs were selected as a non-critical asset with enough capacity to offer useful DR potential to the electricity grid as well as being highly prevalent throughout the wider sector to benefit from further investigation. To satisfy the aim of this research, it was important to evaluate the impact of responding to relevant grid events and assess how this would affect the participant and benefit the national electricity grid. To investigate the operational risks associated with office based industrial AHU interactions with the grid, an offline, simulation-based approach was adopted, given the barriers to field investigations with live operating systems. A mechanistic 1R1C air temperature model of a representative industrial building office space, coupled to a simplified thermal energy model of an AHU was developed. This was utilised to extensively evaluate the effect and illustrate any possible impacts of shutting off an AHU in response to grid events designed to maintain the balance of the national electricity grid. This relationship between the industrial site and national grid is illustrated in Figure 1, where the demonstrated risk evaluations clarify whether the AHU capacity is available to respond. The model was manually calibrated through an iterative process, using empirical data obtained from in situ field measurements and staged input variable tuning from accurate building survey details. The calibrated model was then employed with varying combinations of grid event data, climate boundary conditions and building-system configurations to map the thermal comfort risk topology associated with episodic grid driven AHU shut downs.

2.2. Model Methodology

2.2.1. Description of the Model

A systematic modelling approach outlined in Figure 2, using a methodology based on existing published studies [26,27,28,33] was adopted to capture the complexity of this application. The main aim of this approach is to adequately reproduce, and subsequently predict, the internal air temperature ramps within the indoor occupied space being modelled during shut down of the AHU, based on a number of defined input variables. As there are multiple factors involved in such a complex system, a modular nodal network approach [34] was used to capture every variable and allow each interaction to be broken down into calculations suitable for processing. Employing this modular approach ensured the granular resolution required to capture and analyse specific temperature deviations and the impact of short-term grid events was achievable, thus providing measurable outputs to analyse the perceived risk and demonstrate the suitability of the asset being investigated. Python and more specifically Jupyter Notebooks [35] was selected as the platform on which to develop and instantiate the modelling methodology. This was largely due to its significant processing power, simple design structure, file and dataset compatibility, ease of scalability, connection to appropriate visual outputs and ease of access. These embodied traits ensure this software package met the modelling tool selection criteria and was suitable to complete the modelling aspects of the study.

2.2.2. Model Theory

As multiple influences and interactions exist, a nodal network approach was required to accurately capture the observed empirical phenomena being numerically modelled. This approach was chosen as it builds on the concept of quantifying the energy balance at discrete time intervals for each of the nodes in the system, allowing for an approximate solution to the continuous functions describing the energy flow through the system [34]. In the adopted approach, the coupled zone and AHU model are spatially discretised into four main nodes, external (boundary condition), internal (the occupied zone), supply and return (providing energy to and from the internal node at each time step). Using the 1R1C approach, the energy and mass balance equations at each node are solved sequentially requiring all unknowns at the previous time step for a given node to be calculated prior to moving to the current time step.
The model initialises by reading in the input files, setting specific constants and variables and assigning initial values to model parameters. The base model for calibration comprised of thermo-physical and operating characteristics taken from the representative industrial building, Table 1 details these various model inputs. The heating and cooling values are assigned at this point, ensuring the model is constrained to the actual capacities of the case study building. In addition to the above, any variables with fixed operating values were also set in the model, including mass flow rates, operating schedules and so forth. Once this initial phase is complete, a data frame is created to store each of the output values of the process. The model is then prepared to begin running through the iterations at 60 s intervals over a 24 h period. The 1 min resolution was selected as a trade-off between computational speed and a suitable duration to capture the effect of short-term grid events.
There are a number of calculations completed at each time step, to complete the energy balance between each of the nodes, with the most significant calculations, Equations (1) and (2), obtaining T z at each time step. This formula takes the initial room temperature for the first run and then the value from the previous time step thereafter. The result of the energy balance, composed of ES, EF and EC, captures the energy lost and gained for each time step, allowing the model to predict T z (t)
T z t + d t = T z t + d T z t
where the change in temperature, d T z , during the current time step, d t , is obtained from Equation (2), shown in integral form but summed discretely in the numerical model
d T z t = t t + d t d E s t + d E f t + d E c t ρ A · V z · C p dt
The energy supplied by the AHU, d E s , is calculated from Equation (3) as the product of ρ A , CP, V ˙ and the difference between T s and T z at the particular time step. The d E s value and heating or cooling mode is determined by a check within the model of whether the T z is above or below the T s e t , ensuring the correct d E s is delivered
d E s t = t t + d t ρ A · V ˙   · C p   T S t T Z t   dt
The d E f value, captures the energy loses attributed to the zone envelope and the external surroundings. As shown in Equation (4), this is calculated as the product of UA, the U value of the individual building elements multiplied by their corresponding area A and the difference between T E X T and T z
d E f t = t t + d t U A T E X T t T Z t 1000 dt
The d E C value in this case is attributed to the occupancy, equipment and solar gains within the zone and is calculated as shown in Equation (5). A field-based observational study was conducted to capture the EOC and suitable EEQ values.
d E C t = t t t + d t E O C + E E Q + T e x t t + E S O   dt  
The ESO in this case were calculated using a solar heat gain factor based on the GA per m2 in place at the case study building [36]. Equation (6) demonstrates this calculation, where ESO is found as the product of α and the total solar radiation incidence and SHGF, It, divided by ho all multiplied by the GA. This low-complexity inclusion was considered acceptable as the glazing accounted for less than 10% of the wall area, therefore it was deemed to have a negligible impact. However, a sensitivity analysis was conducted to ensure this decision was adequately justified.
E S O = α   It h o   G A

2.2.3. Description of the Case Study Building

The case study industrial office space selected to build, train and validate the model was constructed in 1997 and is located at a multi-national manufacturing plant in county Cork, Ireland. A number of design principles and building specifics are shared across a large organizations multiple international sites under their defined best practices [37], making this study more globally relevant. This particular building, chosen to investigate the interactions, also provides a representative example of a large proportion of buildings in Irish industrial estates. According to the Central Statistics Office in Ireland, more than 50% of the non-domestic buildings receiving Building Energy Ratings (BER) up to 2021 were constructed before the year 2000 [38]. A significant number of manufacturing and industrial buildings designed and built in this era used similar materials and design practices. The building information and values used are shown in Table 2, which were sourced from building specifications and relevant standards [39,40] where certain values were unavailable. Further to capturing the material areas and U-values, an internal heat capacity calculation was performed for the zone being assessed. Using the methodology outlined in the appropriate standard, ISO 52016-1 [31] and supplemental documents, ISO 13786 [41], the zone was found to have a Light internal heat capacity (Table 2). These low thermal inertia and light fabric envelope characteristics provide interesting responses to changing AHU behaviours, warranting further investigation. This particular internal space maintains a consistent Monday to Friday occupancy and regular AHU schedule (Table 1). The unit itself is monitored and operated from a central Building Management System (BMS), where the internal, external, mixed and return temperatures can be viewed as well as the percentage of fresh air incorporated and a number of other fan states and operating modes. This AHU is located on an industrial site where innovation and continual improvement is right at the forefront, particularly due to its exemplary sustainability goals and the influence of its well-maintained industrial certifications [37] encouraging investigation into energy and emission reduction projects. Thus, evaluating the DR potential of this particular case study, as it is representative of other AHUs, buildings and office spaces throughout the wider industrial sector, offers considerable value to the greater research area.

2.3. Model Calibration

2.3.1. Data Collection for Model Tuning

In order to obtain empirical data for model tuning and calibration, a calibrated Hanwell, wireless data logging system, accurate to ±0.1 °C between −10 °C and 40 °C, was used to collect field measurement data. The sensors were used to collect indoor air temperatures at six desk level locations (1.2 m above finished floor level) in the selected open plan office used for model calibration as outlined in Figure 3. Temperature data was collected at locations that were each chosen following a review of supply and exhaust diffuser locations, occupancy layout, perimeter glazing and any other factors that would interfere with the results. The Hanwell system logged the data at 1 min time intervals for each sample location. The data was retrieved from the in situ loggers at 4-week intervals with any data drops or outliers subsequently cleaned, wrangled and processed in Jupyter Notebooks [35] using Pandas to read in the large volumes of data and process each value into a standard format. There was only one significant data drop, aside from the 5 min per sensor gap during the data collection and resetting process that occurred in the first week caused by one of the sensors being inadvertently moved. This was accounted for in the data compilation process and prevented from being repeated by informing the occupants and placing additional signage around the sensor devices.
Data from the six locations was statistically aggregated in the same manner that the internal temperature is monitored by the BMS to send and receive signals from the AHU and internal space. This resulted in a single averaged temperature value for the internal space, which was used for model calibration. A review of sub zonal variations between locations determined that there was negligible impact across any studied time horizon and particularly for the time interval of any grid event.
To fully evaluate and demonstrate the low risk associated with shutting these assets down, it was important to be exhaustive in evaluating the impact of changeable weather conditions. The processed internal air temperature data and measured external ambient conditions were utilised for model calibration. The external temperature data was taken from the sites BMS external temperature archive from sensors accurate to ±0.2 °C between −20 °C and 60 °C. Table 3 contains a summary of the field measurements and related external temperature data.

2.3.2. Model Calibration and Validation

The 1R1C air temperature model was calibrated using empirical data obtained from field measurements at the case study building. Being a law-driven model relying on the influence of the energy balance equations, a tailored calibration process was employed to obtain sufficient model prediction accuracy. A hybrid of the Morris Method [42], detailed model calibration techniques [33] and iterative calibration processes [43] was used to manually tune the model parameters. The Morris method has been demonstrated as an effective technique to identify the most influential input variables to a model with the lowest computational cost and has been suggested by previous researchers as an appropriate technique for HVAC-Building model calibration [42]. Once the main influencing parameters have been identified, the iterative process of varying their input values to improve the accuracy and train the model is considerably more efficient and effective.
The model was calibrated on one day of actual measured conditions and validated across the remaining 8 days of measured values using the C1V8 process [26], thereby allowing the model to be trained effectively on empirical conditions whilst minimising bias and reducing the risk of over fitting. As the AHU was run on a consistent daily schedule with minimal operational variations, it was found that additional validation days were more valuable than calibration days to gain insights and build confidence in the accuracy of the outputs. By individually adjusting the most influential variables and iteratively generating simulated results for each of the 8 days it was possible to minimise model error through a systematic refinement process. The most influential inputs were found to be: the EC both during and outside its operating schedule, the zone volume and hence associate UA values and the AHU start-up hour where its cooling or heating power is slightly reduced. The overview of the calibration process in Figure 4 demonstrates the systematic process of adjusting a single variable, EC in steps 1 through 4, UA values in steps 5 and 6 and the AHU start-up in step 7, to reduce the level of error in the results. This level of error was demonstrated by the statistical analysis metrics used to determine the accuracy between the actual and simulated temperature within the internal space across the 8 validation days.

2.3.3. Statistical Analysis Techniques

A number of different statistical metrics were employed to assess the model’s performance. This allowed for a quantifiable and comparable measure of accuracy to be applied to the model outputs providing a reliable level of confidence in the results. The first metric applied was the Root Mean Squared Error (RMSE) method demonstrated in Equation (7) [27]. This quadratic scoring rule measures the magnitude of the error.
R M S E = I T z T A 2 N
The R-squared (R2) or goodness of fit measure for linear regression method was also applied. This indicates the amount of variance in the dependant variable that the independent variables explain collectively [44]. This value demonstrates the strength of the relationship between the modelled and the actual values, as shown in Equation (8)
R 2 = 1 i = 1 N T A T z 2 i = 1 N T A T A ^ 2
The Mean Absolute Error (MAE) and Mean Bias Error (MBE) techniques were also chosen to evaluate the model outputs, Equation (9). The MAE presents the average of the absolute differences between the predicted and actual values where each of the errors hold equal weighting [45]. The MBE measures the average bias of the results, demonstrating whether the results are skewed in a positive or negative orientation. This takes the average error between the set of predicted and actual values including the positive or negative value of the errors. It should be noted that as this method incorporates both positive and negative values some cancellation could occur. Therefore, this should be taken as more of a general indicator and interpreted cautiously. MAE can range from zero to infinity in the unit of the variable of interest and MBE from 0 to 100%, as it is converted to a percentage output, each of the scores are negatively oriented, meaning the closer to zero the better.
M A E = 1 N j = 1 N T z j T A j
The final statistical analysis technique used to evaluate the model outputs accuracy was the Pearson’s Correlation (PC) coefficient, Equation (10). The PC is a measure of the strength of the linear relationship between two variables, in this case the simulated and actual values. PC can range from −1 to 1, with a value of −1 representing a perfect negative linear relationship, 1 representing a perfect positive linear relationship and a value of 0 indicating no linear relationship between the variables. Generally, a PC value of less than 0.39 is considered weak, values between 0.4 and 0.69 are seen as moderate, between 0.7 and 0.89 strong or high and above 0.9 very strong or very high correlations [46].
P C = i = 1 n T z T ^ z · T A T A ^ i = 1 n T z T ^ z 2 · i = 1 n T A T A ^ 2

2.4. Study Methodology

2.4.1. Scenarios

The aim of this research is to assess any risk to indoor thermal environments and evaluate the suitability of industrial office spaces providing AHU capacity to the national electricity grid for DR. The predominant indicator of the perceived risk to occupant comfort in the area being assessed is the internal room temperature and its rate of change during the times in question. The ASHRAE Standard 55—Thermal Environmental Conditions for Human Occupancy [32] offers considerable insights into this domain with defined temperature ranges and limits of acceptability necessary for these zones. Table 5.3.5.3 of this standard outlines the maximum operative temperature changes allowed over specified time horizons with a few additional acceptability requirements. The conditions set out in this document form the basis of the risk factors and acceptable limits for the results of this study. Any temperature drift or ramp of more than 2.2 °C in a 1 h period will be categorized as unacceptable and high risk to occupant thermal comfort [32], Temperature Drift Risk 1 (TDR1). Furthermore, any temperature drift or ramp greater than 1.1 °C in a 15 min time interval within this same 1 h period or at any stage will also be categorised as unacceptable and high risk to occupant thermal comfort [32], (TDR2).
Three Thermal Comfort Thresholds were applied to assess the risk to the occupant’s thermal comfort, shown in Table 4. The first threshold, Thermal Comfort Risk 1 (TCR1), was based on the case study site’s BMS settings with the lower limit being 20 °C and the upper limit being 25 °C. These temperature limits were applied on the case study building and are also closely aligned to the normal level of expectation outlined in the ISO 7730 standards [47]. TCR2 applies the same lower limit of 20 °C but has a marginally tighter upper limit of 23 °C. This smaller threshold highlights times where the zone exceeds a reasonably high temperature or overheating events. TCR3 enforces a similarly tight threshold, with a lower limit of 20.5 °C and upper limit of 23.5 °C. This further captures temperature deviations outside of the reasonable temperature limits, while placing additional emphasis on overcooling events. The risk assessment process and criteria for a no risk or risk result are outlined in Equations (11) and (12).
N o   R i s k = T C R 1 :   i f   20.0 < T Z < 25.0 ,   M a x   D r i f t < T D R 1   a n d   M a x   D r i f t < T D R 2 T C R 2 :   i f   20.0 < T Z < 23.0 ,   M a x   D r i f t < T D R 1   a n d   M a x   D r i f t < T D R 2 T C R 3 :   i f     20.5 < T Z < 23.5 ,   M a x   D r i f t < T D R 1   a n d   M a x   D r i f t < T D R 2
R i s k = T C R 1 :   i f   T Z < 20.0 , T Z > 25.0 ,   M a x   D r i f t > T D R 1   o r   M a x   D r i f t > T D R 2 T C R 2 :   i f   T Z < 20.0 , T Z > 23.0 ,   M a x   D r i f t > T D R 1   o r   M a x   D r i f t > T D R 2 T C R 3 :   i f   T Z < 20.5 , T Z > 23.5 ,   M a x   D r i f t > T D R 1   o r   M a x   D r i f t > T D R 2
The AHU shutoff times and durations for the scenarios were selected following a study of previous grid events and aggregator information, to ensure the study was fully aligned with real world grid interactions. By analysing the EirGrid 2019 and 2020 grid frequency data [48] it was possible to identify when the frequency approached or dropped below 49.7 Hz, which generally indicates the need for a response. The events occurring during the AHUs operating schedule were quite evenly spread throughout the day from early morning to late afternoon. Based on this evaluation, the 6 shutoff times shown in Table 4 were selected to accurately represent and analyse potential shutoffs as part of this research. The shutoff durations were also selected to align with the DS3 system services, particularly the reserve and fast-acting categories [49] most suitable to DR participants in the Irish electricity market. These DS3 system services would be the categories of DR a prosumer would offer in response to a grid frequency event. Therefore, if no risk could be proven during these timeframes then an overall conclusion on the DR potential could be drawn. The 5 min duration being most closely aligned to the quick response and short duration grid events, which are the most valuable to the grid and lucrative to the responder. The longer durations shown in Table 4 were then selected to evaluate the potential to shut off and remain off for longer amounts of time thereby allowing the responder to maximise their payments by capturing the fast response incentives and remaining off to avail of the remaining payment categories. The results of this evaluation can also help to illustrate the potential of participating in the slower response but longer duration events, for participants where fast responses are not feasible. These categories are also required by the grid and help to create additional capacity and flexibility in the DR portfolio.

2.4.2. Boundary Conditions and Future Temperature Data

To stress test and comprehensively evaluate the likelihood of any grid interaction resulting in high risk or unacceptable indoor conditions, a number of different extreme event boundaries were explored. As the case study site is located in county Cork, Ireland, the synoptic meteorological weather station at Roches Point was selected as a representative data source. 30 years of historical weather data from the nearest synoptic weather station maintained by the national meteorological service [50] were analysed to identify 99th percentile maximum and minimum daily temperatures (hottest and coldest days) and their corresponding diurnal temperature profiles. This analysis identified Monday, the 2nd of July and Thursday, the 1st of March 2018 as the hottest and coldest recorded days, respectively [50]. Formalised datasets of these daily profiles were both used to simulate the AHU’s operation in scenarios with extreme external temperature conditions, thereby evaluating the potential risk of participating in grid events on both ends of the external temperature scale. Table 5 contains a summary of this historical data and the predicted future temperature data used in this study. The future temperature data was sourced from Meteonorm Version 7.3.4 [51]. Allowing evaluation of potential future cases for the Cork region in the years 2030, 2050 and 2100 as well as an example of Budapest (BP), Hungary in the year 2050. This example of anticipated Budapest temperature offers valuable insights into how this system would perform in more extreme conditions representative of the wider European climate with much larger temperature swings. Additionally, the impact on its climate and the shape of daily temperature profiles [52] and conditions in 2050 present even further interesting elements worthy of analysis. These datasets were created based on the assumptions of the Intergovernmental Panel on Climate Change (IPCC) AR4 A2 scenario, the most pessimistic or lowest year on year reduction in carbon emissions available for simulation. After more analysis, these annual datasets allowed both the hottest and coldest days in each of the selected years to be extracted and daily profiles to be created, shown in Table 5. Further analysis was then carried out including these extreme boundary conditions to generate additional insights, results and valuable discussion from this research.

2.5. Assumptions

Throughout this study, a number of assumptions were made as this research deals with concepts and practices that are not yet commonplace in industry. The first of which was that a company would be willing to engage in the works presented in this paper. It was also assumed that having the risks, if any, of participation outlined would be beneficial to any potential participants in DR. Additionally, it was assumed that once selected, an asset would be capable of responding to frequency triggers and would participate in the DR schemes appropriately. During the assessment, all building specifications, materials and boundary conditions were assumed appropriate as they are taken from credible sources. It was also assumed that the studied AHU would maintain its defined operating schedule and the observed occupancy and equipment levels would not fluctuate dramatically over time. Furthermore, the climate data files taken from Meteonorm and based on the IPCC assumptions for future scenarios were assumed suitable, as these are both referenced and credible sources. Finally, it was assumed that any costs, of hardware or systems, would not be prohibitive if this concept were implemented. Generally, these initial setup costs can be subsidized through incentive schemes encouraging participation or are often part of the aggregator or TSOs performance contract. This allows initial costs to be spread over the year or duration of the contract, meaning no upfront costs from the participant are required and earnings can be seen from their first contractual payment.

3. Results

3.1. Model Performance

3.1.1. Calibration and Validation

A number of statistical analysis metrics were employed to assess the model’s performance and indicate the prediction accuracy of internal TZ throughout the calibration and validation process. The average value for these metrics at each calibration step across the 8 validation days is illustrated in Table 6. This demonstrates the gradual improvement, or reduction in error, across each value during the calibration process until acceptable levels for each metric were achieved.
The average RMSE value for each of these days was 0.3 °C, with a range from 0.2 °C to 0.5 °C. This is an adequately low figure and from a thermal comfort perspective would be relatively indiscernible, meaning it is at an acceptable level of error for the purposes of this study. The post-validation average R2 value was 0.49, which represents a moderate relationship between the modelled and actual internal temperature values. The MAE was found to be 0.2 °C across each of the days, with a range from 0.1 °C to 0.4 °C. This value, similarly to the RMSE, was found to be at an acceptable level of deviation from observed values for the purposes of this study. The final MBE value was 0.22%, ranging from −1.08% to 1.35%. The range represents a very low level of error, less than 1.5% in both the positive and negative direction. The marginally positive bias of the average value was also noted, but deemed acceptable as overheating of the room or the danger of under-predicting the internal temperature was seen as a higher risk. Finally, the PC resulted in an average value of 0.93, with a range from 0.88 to 0.97. The lowest value within this range falls within the strong to high correlation category and the average value is even within the very strong or very high category thereby demonstrating that there is a very strong correlation between the predicted and TA values. A number of examples of the model predicted and the actual internal temperatures for a number of selected validation days are shown in Figure 5. The strong correlation is clearly demonstrated in each of the graphs, with (a) and (d) particularly highlighting this during the AHUs operating hours of 06:00 to 18:00 which are the focus of this study. Graph (b) also demonstrates the strong relationship between the modelled and TA results but highlights the minor positive bias quantified by the MBE. Graph (a) before 06:00 and graphs (b) and (c) after 18:00 additionally offer visual insights into why the RMSE and MAE are not even lower as there is some deviation between the values during these times.

3.1.2. Sensitivity Analysis

To gain a deeper understanding of the model outputs and develop further insights into the level of influence of the major input variables, a sensitivity analysis of the model was conducted. This analysis focused on the UA-Values and Solar gains attributed to the level of glazing present in the zone, which were found to be two of the most influential factors on the internal TZ. To conduct this analysis, two days of external temperature data were selected to form the baseline for comparison. The first day selected was Day 3 of the measured data, shown in Figure 6. The second day selected was the external temperature data for the hottest day in Budapest in 2050, Figure 7, which provides an insight into potentially extreme external temperature conditions. As shown in each of these figures, a number of results were generated based on a 5, 15, 25, 50 and 75% increase in glazing levels compared to each baseline. For each of the scenarios the UA value of the zone was updated to reflect the changes made to the glazing areas. As illustrated in Figure 6, the Day 3 temperature data shows that the zone was noticeably cooler outside of the AHU operating hours due to increased losses caused by the modified UA values and effect of no solar gains during the cooler nighttime period. Additionally, it is clear there was minimal impact to the indoor thermal environment caused during the AHUs operating hours across each of the scenarios, as there was never more than a 0.05 °C deviation from the baseline at any stage. A similar result was found when evaluating the Budapest data, Figure 7, as the zone was marginally hotter outside of the AHUs operating schedule caused by the increased heat gain from the higher external temperatures and differing UA values of the zone. This impact along with the increased solar gains visible during the AHU’s on period is further illustrated by an increase in internal temperature during the extreme heat of the daytime hours. Although again this does not have a major impact on the model performance, as the deviation in temperatures even in this extreme scenario do not exceed 0.12 °C. This does not influence the case study building being evaluated, but it does offer valuable insights for future implementations of this research both nationally and internationally, given the representative nature of the case study building.
In industrial office spaces with considerably higher levels of glazing, the opportunity for risk free shutoffs may be marginally shorter. This would be particularly evident in extremely cold climates where the risk of dropping below the set point would be higher, similar to Figure 6, but in a more extreme manner. The equivalent impact on risk may be observed in hotter climates, illustrated in Figure 7, as the internal temperatures would likely approach the upper limits more quickly than demonstrated in the case study building. When we consider the building response in Figure 6 and Figure 7, once the active temperature control is removed at 18:00, we observe a maximum difference in T Z of 0.38 °C and 1.29 °C between different models, respectively. When we only consider reasonable glazing/opaque area ratios in line with both existing industrial office buildings and building regulations these differences are 0.13 °C for Figure 6 and 0.88 °C for Figure 7. This would suggest that the sensitivity of results to building thermal properties is low supporting the portability of the study to other building fabric configurations. In conclusion, this sensitivity analysis demonstrates that varying levels of glazing will influence the buildings internal air temperature. However, the impact during the AHU operating hours, which are the core focus of this study, is very low to negligible. Furthermore, the impacts outside of the operating hours suggest the findings are reasonably applicable to other scenarios and increase the generalizable nature of the study. As shown in Figure 6 and Figure 7 the internal air temperature is quickly returned to its controlled state in each case, meaning no additional risk or impact on the occupants would be incurred.

3.2. Study Results

A number of scenarios were modelled and assessed in line with the aim of this research, to evaluate the impact or perceived risk to occupant comfort associated with turning off AHUs in response to grid events. These scenarios, with each of the criteria represented, are outlined in Figure 8, where the resulting outcome is categorised by colour, with green representing no risk, red an overheating risk and blue an overcooling risk. There were no risks encountered for the case study site, excluding the Budapest data, for 5, 15 and 30 min shutoffs under the TCR1 criteria, while each of the overheating events in this case were triggered and deemed a risk due to TDR1. With the exception to this being events occurring during 2050 BP H, the hottest predicted day in Budapest, which also exceeded the upper temperature limit in 8 cases where the shutoff was less than 1 h. In the case of TCR2 and TCR3, all risk events were triggered by excursions outside the temperature limits while 21 of these events deemed a risk also exceeded the requirements of TDR1. TCR2 registered significantly more overheating events than TCR3, as a number of days exceeded 23 °C but not the 23.5 °C upper limit of TCR3. The AHU was unable to meet the minimum temperature requirements of any of the TCR categories, therefore encountering an overcooling risk, during 2050 BP C, the extremely cold predicted day of Budapest in 2050 while it also failed to meet the minimum required 20.5 °C of TCR3 during Past C, the coldest day recorded for this location. This could be corrected in practice by increasing the actual heating coil capacity, although this would incur an additional energy cost and is beyond the scope of this study. None of the overcooling risk events exceeded TDR1, while no events across any of the modelled scenarios exceeded TDR2 at any stage. There were no risk events during the 5 min shutoffs in the TCR2 category or the 5 or 15 min shutoffs in TCR3 category aside from the past coldest day for Cork weather data. The performance over all of the coldest days shown in Figure 8, with the exception of Past C in TCR3 again, demonstrate very promising potential in the Irish context. As the Irish electricity grid is particularly influenced by wind generation, which will continue to grow in the future, the clear risk free flexible capacity available from this concept during these times could be invaluable to the TSOs. This concept could have a considerable impact during the colder winter months, where the volatile wind resources are often subject to more severe fluctuations, complimenting the TSOs ability to maintain reliable control of the national electricity grid.
The temperature drift during each shutoff event for all of the scenarios is illustrated in Figure 9. This shows a clear trend where the longer the shutoff period is, the larger and more variable the resulting temperature drift becomes. This was demonstrated by a mean drift of only 0.15 °C, minimum of −0.03 °C and max of 0.29 °C for 5 min durations compared to that of 60 min durations, which resulted in a mean value of 1.58 °C, a minimum value of −0.34 °C and maximum value of 3.01 °C.
The temperature drift occurring at each shutoff time for all of the scenarios is illustrated in Figure 10. This shows that generally the highest temperature drifts occur later in the day, particularly during the 14:00 and 15:30 shutoff times. While the earliest shutoff time, 07:00, stands out as the lowest risk of overheating, it also presents the lowest temperature drop closely followed by the latest time in the day considered. This may represent an overcooling event but as shown, the temperature does not drift by more than −0.35 °C, which would not exceed the risk limits.
The actual indoor air temperature for each of the hottest and coldest days is presented in Figure 11, which shows the mean temperature within the zone in addition to the hottest and coldest extreme temperatures for each of the scenarios. In the case of the Irish weather data, the past datasets represent the most extreme conditions with the future scenarios gradually increasing in temperature drift and variability. Although even in these extreme cases, the temperature within the zone never rises above 24.87 °C or drops below 20.48 °C at any stage. The colder scenarios also provide a general indication of the possible impacts of climate change and the potentially hotter temperatures in Ireland in the future. There is a noticeable increase in the lowest temperatures expected compared to the historical coldest day, with the 2100 coldest day, 2100 C in Figure 11, most clearly illustrating this gradual increase. The Budapest scenarios illustrate a much more volatile and wider range of temperatures, which add greater variability to the internal temperature of the zone with a recorded upper extreme temperature of 27.2 °C and mean of 24.27 °C during the hottest day and a lower extreme temperature of 19.43 °C and mean of 20.27 °C during the coldest day assessed. There is clearly much higher risk of participation in DR schemes in this climate, without appropriate changes to the AHU capacity or building specifications.
The daily temperature profile for each Actual Day 1 scenario is presented in Figure 12, under the TCR2 conditions. The normal AHU operating schedule is clearly visible as from when it comes on at 06:00 and until it goes off at 18:00 the temperature remains comfortably within the limits. Each of the simulated grid events are also clearly visible by the sudden spikes at each of the times analysed by the scenarios. The 4 failing events on this day, under TCR2 conditions, are demonstrated by the peaks highlighted in Figure 12, which exceed the upper temperature limit of 23 °C and would be considered as risks. Each of these risk events were triggered by 1 h long shutoffs, which was the longest expected grid event trialled. As illustrated in Figure 12 none of the other scenarios or shorter shutoff durations exceeded the temperature or drift limits. This graph also demonstrates that none of the scenarios exceed the temperature limits of the case study building, TCR 1, and therefore would be risk-free for participation in DR schemes.

4. Discussion

Overall, the key findings of this research demonstrate that the case study AHU deals predominantly with cooling and therefore, longer AHU shutoff durations lead to larger temperature drifts. This is particularly evident in Figure 8, Figure 9 and Figure 12, where the highest levels of risk to thermal comfort are demonstrated. This knowledge gained can be particularly valuable to industries considering participation in DR schemes as it further emphasises the value of targeting the shorter duration, faster response categories. These short duration responses present minimal risk to thermal comfort, with no risk at all for 5 min shutoffs at the case study site and only occasional excursions outside of the risk limits during 15 and 30 min shutoffs during the extreme hottest days assessed. This further highlights the significant potential available for industries to participate in these DR schemes safely. The participant would also receive the additional benefits through the incentive and payment structures provided to participants that emphasise and reward the more lucrative fast and short response categories. Equally, based on the knowledge gained from assessing this AHU there is potential to target all of the response categories, thereby maximising the value to the grid and the site itself. By joining the slower response but longer duration shutoffs, it would be possible to evaluate in advance the risk of participating in the event or even pre-cooling the zone within allowable limits to ensure minimal impact on thermal comfort. This would allow the industrial site participating in the response schemes to maximise their performance by opting to contribute to the short and long duration shutoffs. Furthermore, the potential is also there to shutoff for both and benefit from the payment multipliers granted to participants who can remain off throughout a number of response categories.
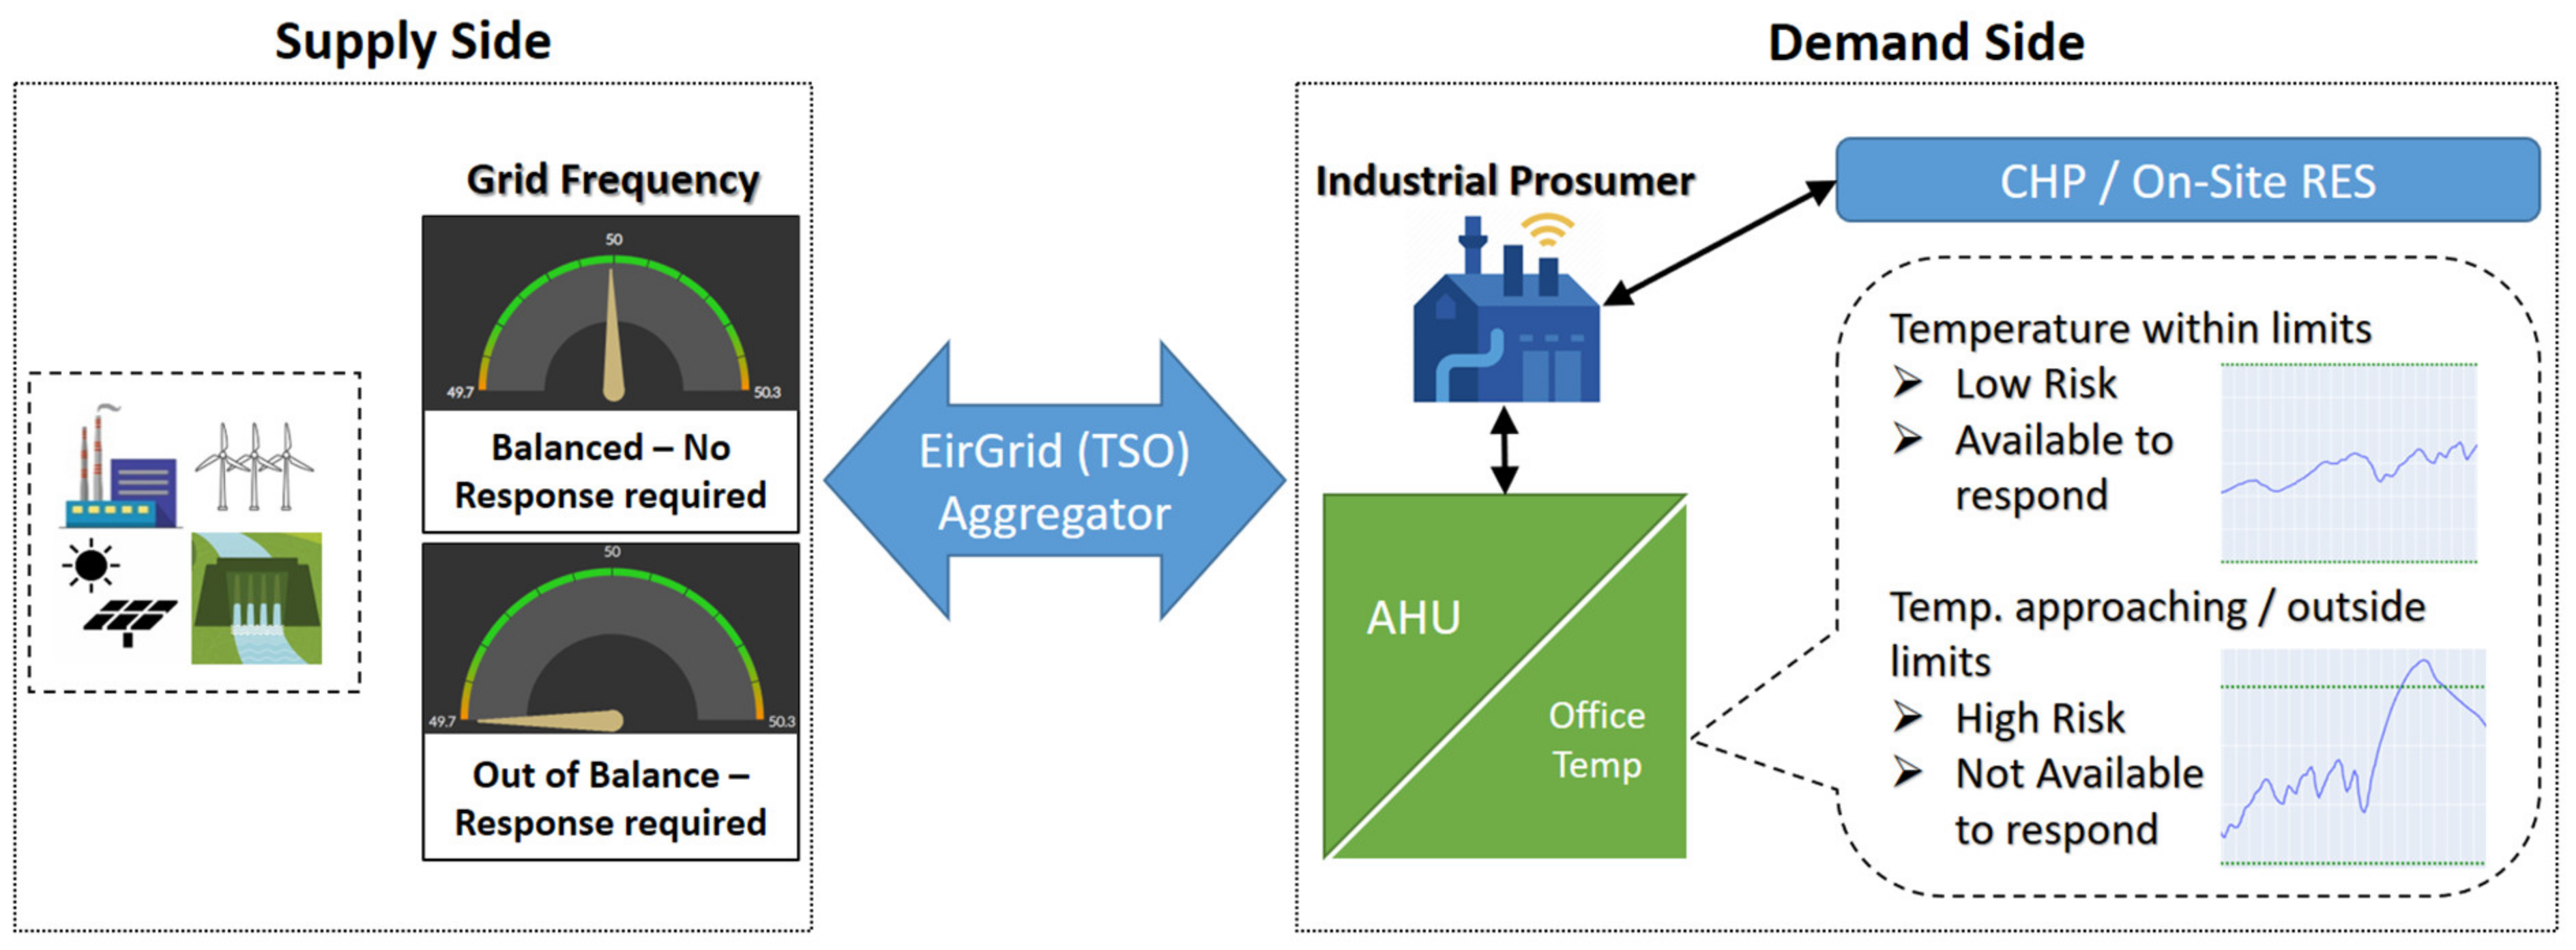
Based on the results of this study, it is evident that there is significant potential for industrial AHUs that serve buildings with low thermal inertia-high thermal response characteristics to be included in DR schemes. The evaluated operational risk to indoor thermal environments is also demonstrated to be at a low level, particularly in the case of the shorter duration shutoffs. To mitigate any potential risks further, industrial participants could work with the TSO or a DR aggregator to develop their availability criteria based on this work. For example, the participant could setup agreed limits for response availability. Where within certain temperature bounds there is no risk meaning the response capacity is available and conversely if the TZ is outside the known no-risk limits then the capacity is not available to respond. This process could easily be automated by combining the temperature readings from the site’s BMS with the frequency-monitoring device used to trigger the response. Additionally, a time-of-day response criteria could also be incorporated based on this research, particularly from the results shown in Figure 9. For industries operating a similar AHU and occupancy schedule, it would be possible to target only events in the earlier hours of the day where the risk was demonstrated to be lower. Alternatively, the participant could choose to avoid only the peak risk hours of the day, which were shown to be roughly between 14:00 and 16:00 during the day.
There is significant capacity potential achievable through including these industrial AHUs in the national electricity market and DR schemes. In the case study building and a number of similar buildings of the same type, the amount of office space in what are deemed industrial buildings ranged from 20 to 25% of the overall building floor space. Considerable capacities could be achieved if this concept, of shutting down AHUs in these areas for DR, was adopted by the Irish industrial sector as a whole. If the members of the Large Industry Energy Network (LIEN) [53] which represent close to 200 of the largest industries in Ireland were to adopt this practice, useful capacities could be achieved, as this group accounts for 21% of Ireland’s total primary energy requirement [53]. The aggregated capacities achievable would be similar to existing aggregator’s response portfolios and even comparable to virtual power plants. If for example, half of the LIEN members contributed as little as 100kW of response each, this would amount to 10 MW of flexible response capacity. This figure is just less than the max output, 11.9 MW, of the ESB operated windfarm at Carnsore county Wexford and more than the full generation capacity, 8 MW, of the Carrigadrohid hydro station located in county Cork [54]. As this 100 kW figure is potentially feasible through including a single large AHU or combining the response of a number of smaller units on a site, there is certainly a low risk pathway to much higher levels of flexible capacity within the Irish national grid. This additional flexible capacity would assist the TSO to maintain control of the electricity grid during times of high fluctuation, particularly as the level of renewables on the grid continues to rise.
The underlying concept of this study and the main takeaways from its results build upon, and further strengthen existing and comparable research. Generally, the results and outputs align with the fundamental conclusion that there is flexible capacity available from buildings in different sectors to participate safely in DR schemes. One similar study focuses on an optimal price-based control strategy of HVAC systems in a multi-zone office space [20]. While this only considers a single use commercial building, purpose built for this main function it does offer valuable comparison. In this case, there are comparable DR capabilities demonstrated that also result in minimal impact on thermal comfort, particularly in the lower comfort thresholds similarly to the results demonstrated in Figure 7. The reduced order modelling approach adopted in our study is also suitable for coupling with extraneous applications, thereby offering the potential to integrate risk to participation for AHU systems in broader decision support systems. The methodology presented in our study is highly scalable and transferrable and the model functionality can be extended appropriately to include additional parameterization. Further similarities can also be drawn from a study investigating the quantification of electricity flexibility in another designated office building for DR [16]. Again, this particular study focuses on a large commercial building, which is not directly relatable to the industrial buildings considered in this research. However, the results of that study also demonstrate the considerable flexible capacities available for DR through a similar approach. Their evaluation also draws attention to the influence of occupants’ behaviour and thermal comfort preferences, which further highlights the additional capabilities and risk mitigation achievable under less stringent temperature limits. Even this brief snapshot of research in this area adds further confidence to our findings and demonstrates the value of evaluating the potential within the industrial sector to provide even greater benefits to the participant and wider national grid. This research helps to develop the current body of knowledge in the industrial sector, compared to that of others, such as the commercial sector, which has been thoroughly investigated in existing studies.

5. Conclusions and Future Work

The overall goal of this research was to assess the risk to indoor thermal environments on industrial sites offering AHU capacity for DR. This was achieved using a systematic modelling approach and simple model calibrated and validated with empirical data collected from a relevant case study industrial building. The fundamental conclusion from this research is that there is minimal to no risk from participation in national or international electricity grid DR schemes outside of extreme weather conditions or particularly tight temperature limits. This outcome should help to reduce the perceived risk of including industrial AHUs in DR and encourage more participants to engage in these programmes. As demonstrated, one of the most influential factors on the level of risk are the upper and lower temperature limits, which are selected by the participant or based on the prevailing standards recommendation. This is highlighted by only close to 6% of scenarios being classified as risky for the case study site under TCR1 and approximately 17%, when the Budapest data is included under the same conditions. Higher values of close to 26% and 25% are found for the case study site under TCR2 and TCR3, respectively, that again rise to almost 38% and 37%, respectively, when the Budapest data is also included in the same regard. Furthermore, it is clear that shorter duration shutoffs or generally shutoff times earlier in the day present the lowest risk. Presenting a positive opportunity as the shorter shutoff times are often more lucrative, provided the participant and asset can respond in the required timeframe. Overall, this research continues the development of the DR concept and further demonstrates the considerable potential available within the industrial sector. Engaging in these DR schemes can offer considerable benefits to the participant on a site level, in addition to the significant positive impact on the wider electricity grid. These benefits include increased grid flexibility and security, a consistent and stable increase in levels of RES on the grid and the realisation of national emission reduction targets.
As this research is focused on industrial office spaces and electricity market participation, the findings presented should be understood in the context of the industrial sector, these particular industrial buildings and the purpose being studied. A potential limitation of this methodology is that internal room temperature is taken as the main indicator of performance and any effects. This indicator was selected as it is largely available through a site’s BMS and is used within the particular control strategies thus increasing the suitability and ease of applying the methodology to existing systems without the need for specialised infrastructure. This research is also focused on suitability for grid event participation and short, fast responses where temperature changes in these types of buildings most comprehensively and simply illustrated the effect and possible risks. This study is also focused largely on centralized Constant Air Volume (CAV) AHU systems, which are very common in the industrial sector but the work may need to be extended further beyond the scope of this study for alternative HVAC system types. Additional variables or calculations may be required for more advanced systems, where complex setups with varying airflow systems, heat recovery strategies or refrigeration cycles are required. Including further inputs such as humidity and CO2 data would increase the computational demand and complexity of the model. However, this has the potential to further inform and increase the insights gained into the thermal comfort within the room being investigated. While fresh air percentage is included, for the mixed air temperature calculations and impact of external air temperature, the internal CO2 levels are not factored into the results. The rate at which CO2 levels increase within the room during a shutoff and decrease in the time thereafter are not considered. This may be seen as a limitation, particularly in the current climate with COVID-19 restrictions and their impact on AHU operation. In future implementations of this research, CO2 sensors could be placed within the room to gather and incorporate this information. This would easily allow warnings to be created if the CO2 parts per million were increasing too rapidly or getting close to exceeding the upper threshold, further informing the risk assessment or setting a hard limit on the allowable shutoff duration.
Additional value may also be gain by conducting future work investigating additional weather and external data files. The daily profiles of shoulder months or other variable external temperatures, in addition to the actual measured, hottest and coldest days could provide additional insights. These extra daily temperature profiles would help to further develop the current result outcomes and improve the certainty of risk levels for any time of the year. There is also possible knowledge to be gained by evaluating different sizes and locations of office spaces to the case study zone evaluated. This, along with varying the AHU schedule and other parameters, such as glazing or occupancy levels, would offer further interesting results. The inclusion of CO2 and humidity monitoring and data as part of a thermal comfort quantification could also generate additional value within this area. Whether as an additional risk factor or simply to tailor the actual incurred risk factor of changing internal zone temperatures to the thermal comfort requirements of the zone occupants. Finally, a detailed cost analysis and study of the financial viability of this concept or such systems would also help to expand the understanding of this topic. This would build confidence in implementing these systems and offer key insights into their long-term sustainability.

Author Contributions

Conceptualization, A.B., K.B. and P.D.O.; methodology, A.B. and P.D.O.; software, A.B.; validation, A.B., K.B. and P.D.O.; formal analysis, A.B. and P.D.O.; investigation, A.B.; resources, K.B. and P.D.O.; data curation, A.B.; writing—original draft preparation, A.B.; writing—review and editing, A.B., K.B. and P.D.O.; visualization, A.B. and P.D.O.; supervision, K.B. and P.D.O.; project administration, K.B. and P.D.O.; funding acquisition, K.B. All authors have read and agreed to the published version of the manuscript.

Funding

This research was supported by Science Foundation Ireland (SFI) through MaREI, the SFI Centre for Energy, Climate, and Marine Research and DePuy Ireland Unlimited Company on a co-funded grant agreement (SFI Targeted Project Agreement Reference No. 12/RC/2302) and the Article Processing Charge (APC) was funded by SFI.

Institutional Review Board Statement

Not applicable.

Informed Consent Statement

Not applicable.

Data Availability Statement

Data available upon request.

Conflicts of Interest

The authors declare no conflict of interest.

Nomenclature

Units:
°CDegrees Celsius AHUonAHU Scheduled On [s]
ktoeKilotonnes of Oil EquivalentAHUoffAHU Scheduled Off [s]
WWatts V ˙ Volumetric Flow of Supply Air [m3/s]
KKelvinVZZone Volume [m3]
JJoulesUAUA-Value [W/K]
kgKilogrampFAPercentage of Fresh Air [%]
sSecondsESSupply Energy [J]
mMetersEFFabric Energy Loss [J]
HzHertzECCasual Gains [J]
CO2Carbon DioxideEOCOccupancy Energy Gains [J]
Values and Model Identifiers:EEQEquipment Energy Gains [J]
dThickness [m]ESOSolar Gains [J]
ρDensity [kg/m3]GAGlazing Area [m2]
cSpecific Heat Capacity [L/kgK]αSolar Absorptivity [Ws1/2/m/K]
CmInternal Effective Heat Capacity [J/Km2]SHGFSolar Heat Gain Factor [W/m2]
tTime [s]hoConvection Heat Transfer Coefficient [W/m2K]
dtTime Step [s]TSSupply Air Temperature [°C]
rtRuntime [s]TAActual Temperature [°C]
T s e t Room Temperature Setpoint [°C]NNumber of Iterations
T H , s e t Heating Setpoint [°C] T A ^ Mean of Actual Temperatures [°C]
T C , s e t Cooling Setpoint [°C] T Z ^ Mean of Simulated Temperatures [°C]
T e x t External Temperature [°C]ρADensity of Air [kg/m3]
T z Zone Temperature [°C]CPSpecific Heat Capacity of Air [J/kgK]

References

  1. Vandyck, T.; Höhne, N.; Sha, F.; Fekete, H.; van Soest, H.; Kuramochi, T.; Cantzler, J.; Roelfsema, M.; den Elzen, M.; Fransen, T.; et al. Are the G20 economies making enough progress to meet their NDC targets? Energy Policy 2018, 126, 238–250. [Google Scholar] [CrossRef]
  2. Brem, A.; Adrita, M.M.; O’Sullivan, D.T.J.; Bruton, K. Industrial smart and micro grid systems—A systematic mapping study. J. Clean. Prod. 2020, 244, 118828. [Google Scholar] [CrossRef]
  3. Sustainable Energy Authority of Ireland. Energy in Ireland—2020 Report; Sustainable Energy Authority of Ireland: Dublin, Ireland, 2020. [Google Scholar]
  4. SEAI. Ireland’s Energy Targets; SEAI: Dublin, Ireland, 2016; Available online: https://www.seai.ie/about/irelands-energy-targets/ (accessed on 9 August 2021).
  5. EirGrid Group. DS3 Programme. 2021. Available online: https://www.eirgridgroup.com/how-the-grid-works/ds3-programme/ (accessed on 8 March 2021).
  6. Zhang, Q.; Grossmann, I.E. Enterprise-wide optimization for industrial demand side management: Fundamentals, advances, and perspectives. Chem. Eng. Res. Des. 2016, 116, 114–131. [Google Scholar] [CrossRef] [Green Version]
  7. Carlini, E.M.; Schroeder, R.; Birkebæk, J.M.; Massaro, F. EU transition in power sector: How RES affects the design and operations of transmission power systems. Electr. Power Syst. Res. 2019, 169, 74–91. [Google Scholar] [CrossRef]
  8. Dranka, G.G.; Ferreira, P. Review and assessment of the different categories of demand response potentials. Energy 2019, 179, 280–294. [Google Scholar] [CrossRef]
  9. Fabrizio, E.; Branciforti, V.; Costantino, A.; Filippi, M.; Barbero, S.; Tecco, G.; Mollo, P.; Molino, A. Monitoring and managing of a micro-smart grid for renewable sources exploitation in an agro-industrial site. Sustain. Cities Soc. 2017, 28, 88–100. [Google Scholar] [CrossRef]
  10. Cui, H.; Zhou, K. Industrial power load scheduling considering demand response. J. Clean. Prod. 2018, 204, 447–460. [Google Scholar] [CrossRef]
  11. Tang, R.; Wang, S.; Xu, L. An MPC-based optimal control strategy of active thermal storage in commercial buildings during fast demand response events in smart grids. Energy Procedia 2019, 158, 2506–2511. [Google Scholar] [CrossRef]
  12. Bianchini, G.; Casini, M.; Vicino, A.; Zarrilli, D. Demand-response in building heating systems: A model predictive control approach. Appl. Energy 2016, 168, 159–170. [Google Scholar] [CrossRef]
  13. Li, W.; Yang, L.; Ji, Y.; Xu, P. Estimating demand response potential under coupled thermal inertia of building and air-conditioning system. Energy Build. 2019, 182, 19–29. [Google Scholar] [CrossRef]
  14. Yin, R.; Kiliccote, S.; Piette, M.A. Linking measurements and models in commercial buildings: A case study for model calibration and demand response strategy evaluation. Energy Build. 2016, 124, 222–235. [Google Scholar] [CrossRef] [Green Version]
  15. Aduda, K.O.; Labeodan, T.; Zeiler, W.; Boxem, G. Demand side flexibility coordination in office buildings: A framework and case study application. Sustain. Cities Soc. 2017, 29, 139–158. [Google Scholar] [CrossRef] [Green Version]
  16. Chen, Y.; Chen, Z.; Xu, P.; Li, W.; Sha, H.; Yang, Z.; Li, G.; Hu, C. Quantification of electricity flexibility in demand response: Office building case study. Energy 2019, 188, 280–294. [Google Scholar] [CrossRef]
  17. Aghniaey, S.; Lawrence, T.M.; Sharpton, T.N.; Douglass, S.P.; Oliver, T.; Sutter, M. Thermal comfort evaluation in campus classrooms during room temperature adjustment corresponding to demand response. Build. Environ. 2019, 148, 488–497. [Google Scholar] [CrossRef]
  18. Ghofrani, A.; Nazemi, S.D.; Jafari, M.A. HVAC load synchronization in smart building communities. Sustain. Cities Soc. 2019, 51, 101741. [Google Scholar] [CrossRef]
  19. Utama, C.; Troitzsch, S.; Thakur, J. Demand-side flexibility and demand-side bidding for flexible loads in air-conditioned buildings. Appl. Energy 2021, 285, 116418. [Google Scholar] [CrossRef]
  20. Amin, U.; Hossain, M.J.; Fernandez, E. Optimal price based control of HVAC systems in multizone office buildings for demand response. J. Clean. Prod. 2020, 270, 122059. [Google Scholar] [CrossRef]
  21. Tsay, C.; Kumar, A.; Flores-Cerrillo, J.; Baldea, M. Optimal demand response scheduling of an industrial air separation unit using data-driven dynamic models. Comput. Chem. Eng. 2019, 126, 22–34. [Google Scholar] [CrossRef] [Green Version]
  22. Rodríguez-García, J.; Álvarez-Bel, C.; Carbonell-Carretero, J.F.; Escrivá-Escrivá, G.; Calpe-Esteve, C. Design and validation of a methodology for standardizing prequalification of industrial demand response resources. Electr. Power Syst. Res. 2018, 164, 220–229. [Google Scholar] [CrossRef]
  23. Pechmann, A.; Shrouf, F.; Chonin, M.; Steenhusen, N. Load-shifting potential at SMEs manufacturing sites: A methodology and case study. Renew. Sustain. Energy Rev. 2017, 78, 431–438. [Google Scholar] [CrossRef]
  24. Rahnama, S.; Stoustrup, J.; Rasmussen, H. Integration of heterogeneous industrial consumers to provide regulating power to the smart grid. Proc. IEEE Conf. Decis. Control. 2013, 6268–6273. [Google Scholar] [CrossRef]
  25. Mohammad, N.; Rahman, A. Transactive control of industrial heating–ventilation–air-conditioning units in cold-storage warehouses for demand response. Sustain. Energy Grids Netw. 2019, 18, 100201. [Google Scholar] [CrossRef]
  26. Murphy, M.D.; Sullivan, P.D.O.; de Graca, G.C.; O’Donovan, A. Development, calibration and validation of an internal air temperature model for a naturally ventilated nearly zero energy building: Comparison of model types and calibration methods. Energies 2021, 14, 871. [Google Scholar] [CrossRef]
  27. Donovan, A.O.; Sullivan, P.D.O.; Murphy, M.D. Predicting air temperatures in a naturally ventilated nearly zero energy building: Calibration, validation, analysis and approaches. Appl. Energy 2019, 250, 991–1010. [Google Scholar] [CrossRef]
  28. Fayazbakhsh, M.A.; Bagheri, F.; Bahrami, M. A resistance-capacitance model for real-time calculation of cooling load in HVAC-R systems. J. Therm. Sci. Eng. Appl. 2015, 7, 1–9. [Google Scholar] [CrossRef]
  29. Dababneh, F.; Li, L.; Sun, Z. Peak power demand reduction for combined manufacturing and HVAC system considering heat transfer characteristics. Intern. J. Prod. Econ. 2016, 177, 44–52. [Google Scholar] [CrossRef]
  30. Gourlis, G.; Kovacic, I. Passive measures for preventing summer overheating in industrial buildings under consideration of varying manufacturing process loads. Energy 2017, 137, 1175–1185. [Google Scholar] [CrossRef]
  31. ISO. ISO 52016-1:2017—Energy Performance of Buildings—Energy Needs for Heating and Cooling, Internal Temperatures and Sensible and Latent Heat Loads; ISO: Geneva, Switzerland, 2017. [Google Scholar]
  32. Schoen, L.J.; Alspach, P.F.; Arens, E.A.; Aynsley, R.M.; Bean, R.; Eddy, J.; Int-hout, D.; Khalil, E.E.; Simmonds, P.; Stoops, J.L.; et al. ANSI/ASHRAE Standard 55-2013—Thermal Environmental Conditions for Human Occupancy; ASHRAE: Atlanta, GA, USA, 2013. [Google Scholar]
  33. Coakley, D.; Raftery, P.; Keane, M. A review of methods to match building energy simulation models to measured data. Renew. Sustain. Energy Rev. 2014, 37, 123–141. [Google Scholar] [CrossRef] [Green Version]
  34. Clarke, J. Energy Simulation in Building Design, 2nd ed.; Routledge: London, UK, 2001. [Google Scholar]
  35. Jupyter, P. Jupyter Notebook. 2021. Available online: https://jupyter.org/index.html (accessed on 10 August 2021).
  36. Hernandez, M.; Medina, M.A.; Schruben, D.L. Verification of an energy balance approach to estimate indoor wall heat fluxes using transfer functions and simplified solar heat gain calculations. Math. Comput. Model. 2003, 37, 235–243. [Google Scholar] [CrossRef]
  37. Brem, A.; Cusack, D.Ó.; Adrita, M.M.; O’Sullivan, D.T.J.; Bruton, K. How do companies certified to ISO 50001 and ISO 14001 perform in LEED and BREEAM assessments? Energy Effic. 2020, 13, 751–766. [Google Scholar] [CrossRef]
  38. C.S.O. (CSO), BERs by Period of Construction (Non-Domestic), Non-Domestic Build. Energy Ratings. 2021. Available online: https://www.cso.ie/en/releasesandpublications/er/ndber/non-domesticbuildingenergyratingsq12021/ (accessed on 15 April 2021).
  39. Department of Housing, Planning and Local Government. TGD Part L—Conservation of Fuel and Energy—Buildings other than Dwellings 2017. Department of Housing, Planning and Local Government, 2017; Volume 2, pp. 9–120. Available online: http://www.housing.old.gov.ie/sites/default/files/publications/files/tgd_l_2017_for_buildings_other_than_dwellings.pdf (accessed on 9 August 2021).
  40. ASHRAE. ANSI/ASHRAE/IES Standard 90.1-2019—Energy Standard for Buildings Except Low-Rise Residential Buildings; ASHRAE: Atlanta, GA, USA, 2019. [Google Scholar]
  41. ISO. ISO 13786—Thermal Performance of Building Components—Dynamic Thermal Characteristics—Calculation Methods; ISO: Geneva, Switzerland, 2017. [Google Scholar]
  42. Garcia, D.; Arostegui, I.; Prellezo, R. Robust combination of the Morris and Sobol methods in complex multidimensional models. Environ. Model. Softw. 2019, 122, 104517. [Google Scholar] [CrossRef]
  43. Raftery, P.; Keane, M.; O’Donnell, J. Calibrating whole building energy models: An evidence-based methodology. Energy Build. 2011, 43, 2356–2364. [Google Scholar] [CrossRef]
  44. Mazzeo, D.; Matera, N.; Cornaro, C.; Oliveti, G.; Romagnoni, P.; de Santoli, L. EnergyPlus, IDA ICE and TRNSYS predictive simulation accuracy for building thermal behaviour evaluation by using an experimental campaign in solar test boxes with and without a PCM module. Energy Build. 2020, 212, 109812. [Google Scholar] [CrossRef]
  45. JJ, MAE and RMSE—Which Metric is Better? Human in Machine World. 2016. Available online: https://medium.com/human-in-a-machine-world/mae-and-rmse-which-metric-is-better-e60ac3bde13d (accessed on 4 February 2021).
  46. Fu, T.; Tang, X.; Cai, Z.; Zuo, Y.; Tang, Y.; Zhao, X. Correlation research of phase angle variation and coating performance by means of Pearson’s correlation coefficient. Prog. Org. Coat. 2020, 139, 105459. [Google Scholar] [CrossRef]
  47. International Organisation For Standardization. ISO 7730:2005—Ergonomics of the Thermal Environment—Analytical Determination and Interpretation of Thermal Comfort Using Calculation of the PMV and PPD Indices and Local Thermal Comfort Criteria; International Organisation For Standardization: Geneva, Switzerland, 2005. [Google Scholar]
  48. EirGrid Group. Frequency: All Island, Smart Grid Dashboard. 2021. Available online: http://smartgriddashboard.eirgrid.com/#all/frequency (accessed on 25 August 2021).
  49. EirGrid. SONI, DS3 System Services Protocol—Regulated Arrangements 3.0; EirGrid: Dublin, Ireland, 2020. [Google Scholar]
  50. The Irish Meteorological Service. MET Éireann Historical Data, Climate. 2021. Available online: https://www.met.ie/climate/available-data/historical-data (accessed on 3 February 2021).
  51. Meteotest, Meteonorm. 2021. Available online: https://meteonorm.com/en/ (accessed on 13 August 2021).
  52. Dias, J.B.; Soares, P.M.M.; da Graça, G.C. The shape of days to come: Effects of climate change on low energy buildings. Build. Environ. 2020, 181, 107125. [Google Scholar] [CrossRef]
  53. Sustainable Energy Authority of Ireland, Large Industry Energy Network. 2017. Available online: https://www.seai.ie/energy-in-business/lien/ (accessed on 23 August 2021).
  54. Electricity Supply Board, Generation Asset Map, ESB Gener. Trading. 2021. Available online: https://esb.ie/our-businesses/generation-energy-trading-new/generation-asset-map (accessed on 15 September 2021).
Figure 1. Overview of grid and building response relationship.
Energies 14 06261 g001
Figure 2. Overview of systematic steps followed as part of the modelling approach.
Energies 14 06261 g002
Figure 3. Overview of zone (red boundary line) and sensor locations marked (1 – 6) within the open plan office space used for model calibration.
Energies 14 06261 g003
Figure 4. Overview of the systematic calibration process to improve the models accuracy.
Energies 14 06261 g004
Figure 5. Illustration of model vs. empirical internal air temperatures for selected validation days: (a) 10/Jun/2020; (b) 11/Jun/2020; (c) 12/Jun/2020; (d) 22/Jun/2020, with AHU operating hours highlighted by green shaded area.
Energies 14 06261 g005
Figure 6. Daily internal air temperature profile for model sensitivity analysis of Day 3 data, with AHU operating hours highlighted by green shaded area.
Energies 14 06261 g006
Figure 7. Daily internal air temperature profile for model sensitivity analysis of Budapest 2050 hottest day data, with AHU operating hours highlighted by green shaded area.
Energies 14 06261 g007
Figure 8. Overview of all scenarios, categorized by no risk (green), overheating risk (red) and overcooling risk (blue).
Energies 14 06261 g008
Figure 9. Box and whisker plot of internal air temperature drift vs. shutoff duration for all scenarios, with median represented by green horizontal line.
Energies 14 06261 g009
Figure 10. Box and whisker plot of internal air temperature drift vs. shutoff time for all scenarios, with median represented by green horizontal line.
Energies 14 06261 g010
Figure 11. Box and whisker plot of internal air temperature for all hottest and coldest days, with median represented by green horizontal line.
Energies 14 06261 g011
Figure 12. Daily internal air temperature profile for each actual Day 1 scenario under TCR2 conditions (red dashed lines).
Energies 14 06261 g012
Table 1. Model inputs, operating schedules and physical characteristics.
VariableAbbreviationValueUnits
Initial Timet0s
Time Stepdt60s
Runtime (1 Day)rt86,400s
Room Temperature SetpointTset21°C
Heating SetpointTHset28°C
Cooling SetpointTCset12°C
External TemperatureTEXT-°C
AHU Scheduled Turn On (06:00)AHUon21,600s
AHU Scheduled Turn Off (18:00)AHUoff64,800s
Volumetric Flow of Supply Air V ˙ 12m3/s
Zone VolumeVZ2834m3
UA-ValueUA866.453W/K
Percentage of Fresh AirpFA20%
Table 2. Case study building information and values.
ItemAreaU-ValueMaterialdρcCm
(m2)(W/m2K) (m)(kg/m3)(J/kgK)(J/(km2))
Internal Wall445.50.3Plasterboard0.0138008408736
Insulation0.08735-
External Wall230.463Plasterboard0.01380084052,584
Concrete Block (Lightweight)0.087600840
Windows462.476
Floor944.50.322Carpet0.02186136078,740
Concrete Screed0.051000840
Cast Concrete (M. Density)0.031200880
Ceiling944.50.322Ceiling Tile0.016380100608
Air0.0841.20.001
Total UA Value866W/K
Zone Volume2834 m3
Total Cm140,668J/Km2
ISO 52016-1 Internal Effective Heat Capacity ClassificationLight
Table 3. Field measurements and external temperature data collected from the case study site.
Internal Temperature DataExternal Temperature Data
DayDateMinDaily MeanMaxMinDaily MeanMax
(°C)Time(°C)(°C)Time(°C)Time(°C)(°C)Time
05/06/2021.407:1022.122.620:155.922:4612.318.916:41
18/06/2021.306:5022.222.819:558.103:3513.52114:36
29/06/2020.807:5521.822.421:00904:1512.919.413:31
310/06/2021.306:4021.822.319:309.422:5612.917.317:41
411/06/2020.906:5021.622.223:05804:151320.214:36
512/06/2021.107:4021.822.621:309.503:1013.923.418:56
615/06/2021.508:3522.623.720:4511.301:2518.226.219:51
722/06/2021.307:2522.122.800:0012.201:0513.615.217:31
824/06/2021.107:0521.922.921:1512.804:1518.326.115:01
Table 4. Shutoff times, durations, external temperature files and thermal comfort thresholds used as modelling scenario variables.
Shutoff TimeShutoff Duration (Mins)External Temperature Data FilesThermal Comfort Threshold (°C)
07:005Actual 12050 HTCR 1 [20–25]
09:3015Actual 22050 CTCR 2 [20–23]
11:0030Actual 32100 HTCR 3 [20.5–23.5]
14:0060Past H2100 C
15:30 Past C2050 BP H
17:00 2030 H2050 BP C
2030 C
Table 5. Overview of hottest and coldest daily external temperature profiles.
ClimateYearType (Day)DateMinDaily MeanMax
(°C)Time(°C)(°C)Time
Historical2018Hottest02/07/201814.706:0019.926.314:00
Coldest01/03/2018−5.203:00−3.2−1.123:00
Future2030Hottest24/07/203017.602:0020.424.519:00
Coldest27/12/2030−1.100:000.92.515:00
Future2050Hottest21/07/205013.300:0019.524.915:00
Coldest01/01/2050−0.608:001.12.913:00
Future2100Hottest19/08/210016.705:0021.426.115:00
Coldest01/04/2100−1.009:001.54.015:00
Budapest—Representative of European Climate2050Hottest BP07/07/205027.500:0035.943.715:00
Coldest BP14/01/2050−14.707:00−10.2−6.700:00
Table 6. Averaged results for each of the statistical analysis metrics through the calibration process steps.
Step 1Step 2Step 3Step 4Step 5Step 6Step 7
RMSE(°C)0.400.400.300.500.300.300.30
R2 0.03−0.110.39−0.410.490.460.49
MAE(°C)0.400.400.300.400.300.300.20
MBE(%)1.17−1.080.081.350.380.170.22
PC 0.840.870.890.910.920.920.93
Publisher’s Note: MDPI stays neutral with regard to jurisdictional claims in published maps and institutional affiliations.

