Article

Feasibility Analysis of a DC Distribution System for a 6 kW Photovoltaic Installation in Ireland

Power Electronics Research Centre, College of Science and Engineering, National University of Ireland Galway, H91 HX31 Galway, Ireland
*
Author to whom correspondence should be addressed.
Energies 2021, 14(19), 6265; https://doi.org/10.3390/en14196265
Submission received: 13 August 2021 / Revised: 3 September 2021 / Accepted: 26 September 2021 / Published: 1 October 2021

Abstract

:
Recent developments in micro-grids have led to increased interest in DC distribution due to its high efficiency in distributing energy from renewable energy sources to DC loads. This paper seeks to analyse the performance of AC and DC systems in a relatively large-sized 6 kW PV installation to determine the level of improvement in efficiency provided by DC distribution and to identify methods for further improvement. Baseline annual data for the AC system were collected from a live installation on a national school in Inis Oirr, an island off the west coast of Ireland. The results indicate that usage of a DC distribution system has the potential to reduce system losses by up to 50% as well as the ability for an annual saving in grid energy of 5% compared to the existing AC system. Moreover, the analysis reveals that DC outperforms AC distribution more in spring and autumn, when power consumption is comparable to the system production, but there is less impact in summer, when PV production is significantly higher than demand. These findings provide insights into the benefits of future DC distribution systems in individual buildings and in larger-scale micro-grids.

1. Introduction

The depletion of oil has awakened realization of the importance of renewable energies to achieve sustainability and energy security for the future. Renewable energies have various forms such as solar photovoltaic (PV), wind turbines, biomass, thermal, tidal, etc. Solar PV is considered better than other forms because it is environmentally friendly and has a low implementation cost [1,2,3]. This cannot be claimed by other renewable sources such as biomass and wind turbines due to their negative externalities.
Because solar PV produces DC power, it is particularly suitable for supplying several emerging building load requirements, such as heat pumps, LED lights, and PCs as these are inherently DC load devices [4,5,6]. Furthermore, traditional AC systems have a relatively high power loss [7]. As a result, there is a growing body of empirical studies that recognize the benefits of using DC distribution over AC due to the optimal efficiency it offers, with up to 33% higher efficiency reported for residential buildings [8,9]. Therefore, recent developments in utilizing DC systems have heightened the need for reducing the electricity consumption in commercial buildings in which the energy efficiency could be improved [10,11]. Since the load profile of residential buildings is lower than that of commercial buildings, it is believed that the integration of renewable energy with DC systems and other sources of energy would be promising in terms of cost benefit [12,13,14]. Meanwhile, the relative advantages and disadvantages of employing the DC solution have been discussed in some review studies [15,16], including the effects of battery storage [17].
However, much of the current literature is based on theoretical models of AC vs. DC distribution systems with little account taken of the variation in the efficiency of power converter blocks with operating power levels, or indeed of varying source and load profiles. Therefore, many existing studies may be overestimating the relative performance of DC versus AC distribution. Only one study considered the contribution of different power conversion stages to AC and DC distribution systems in a network building [18]. The highest AC system losses were found in the rectifier, followed by the inverter, with the efficiency of the DC system being higher than the equivalent AC system by 11%. The authors of [19] assert that such AC/DC converters can introduce particularly high losses when operated at low power levels in commercial buildings. Meanwhile, the major losses for DC systems were reported in the battery related to the manufactured materials. Nonetheless, their analysis shows that the energy savings provided by a battery increase from 8% to 15% by using a DC system instead of AC.
Despite the proposed superiority of DC distribution systems, there is a large variability in the level of improvement in power losses and conversion efficiency reported in different research studies, as shown in Table 1. The highest efficiency reported so far for the DC system is 50% when alternative power sources such as renewable energy and energy storage are included [20]. However, the variation in load demand and geographical location can contribute to potential increases in the overall system efficiency. Furthermore, the DC system performance can be improved under different operational conditions over various seasons where the power level and efficiency of power conversion stages determine the system loss breakdown.
The most detailed studies on DC distribution focus on large installations for applications such as data centres and commercial buildings. Therefore, to address the gap in lower power systems, this study (as an extension of [31]) investigates the detailed system losses in a typical implementation of a 6 kW PV system, as installed in a school in Inis Oirr and as shown in Figure 1a. The system has 22 × 285 W panels, configured as two parallel strings, each of 11 series-connected panels, to enable the inverter to operate within its voltage range. By combining live measurement data of the power produced in the existing AC system with the quoted efficiency versus power curves of the individual power converter products installed, the system performance is investigated over the full range of operating conditions for different seasons. The relative contribution of different power converter blocks is determined, and proposals for system improvements provided by an equivalent DC distribution (shown in Figure 1b) are presented, where power conversion blocks for the DC system are chosen to be as similar as possible to those in the AC system.
The remaining part of this paper proceeds as follows: Section 2 describes the existing AC system and its equivalent DC model, including a range of operational PV and load profiles based on live measurement data taken over a year. Section 3 outlines the loss models applied to each of the power conversion blocks in both AC and DC systems. These are applied in Section 4 to compare the performance of both systems under the same source and load conditions in terms of overall system losses and energy savings. The work is concluded in Section 5.

2. System-Level Model

2.1. AC System

The approach taken in this study is based on reliable measurement data of the power production and consumption at different points in an existing AC system in a school in Inis Oirr, as shown in Figure 1a, and the application of these data to predict the performance of a comparable DC system (Figure 1b). There are six positions of measurement, as illustrated in Figure 1a and described in Table 2, which allow individual loss contributions to be calculated in each of the power conversion blocks. The battery power (PAC1) can represent either charging from the installed PVs (PAC1 > 0) or discharging to supply the load demand (PAC1 < 0). System production (PAC2) is the inverter output power provided by the PVs and/or battery. Self-consumption (PAC3) is the inverter output power consumed by the loads. When the system production has insufficient power to supply total consumption (PAC4), the grid feeds the loads partially or entirely (PAC5), depending on system production. Excess PV power (PAC6) is measured separately as power supplied to the grid.
These measurements were captured using an energy-monitoring system installed in the school, which can be accessed online. The eligibility for accessing the measured data was approved by the installer company for ethical purposes. The system data were in the form of power (W) at a sampling interval of 15 min.
Details of loss calculations based on these measurements are described in Section 3. The main power conversion components in the AC system are an MPPT power optimizer, an AC/DC inverter, and a battery charge controller, as shown in Table 3. The MPPT and AC/DC stages are often combined in the same inverter product, but they are considered separately in this case, so that the elimination of the DC/AC stage when feeding DC loads in the DC distribution system can be determined. A Tesla Powerwall 1 was chosen to provide battery storage, with a rated energy capacity of 6.4 kWh. In terms of the load profile, it is largely dominated by a 14 kW heat pump, along with smart whiteboards, LED lights, and PCs whose maximum power rating is listed in Table 4. Representative load power profiles are compared with solar PV production profiles in Figure 2 for each of the four seasons, where the representative days were chosen as those on which the average system production and consumption power levels occur in a given month. The effect of the battery is also included. PV production profiles were determined by manipulating the measured system power production data, as explained in Section 3. As expected for the Irish climate, higher load power consumption was observed during winter and autumn, along with lower PV production as shown in Figure 2. Clearly, the heat pump operated frequently, causing a rapid variation in the load profiles. By contrast, the power produced by the PV was at its optimum during spring and summer, with power consumption being relatively low in the same seasons.

2.2. DC System

The configuration of the assumed DC system is shown in Figure 1b, where DC loads are fed via a DC bus from either the PV (through an MPPT DC/DC converter), the battery (through a battery charge controller), or the grid (through a bidirectional inverter). The performance of the DC distribution system is based on the same PV production profile as the AC system, while the load profile is based on an assumption that a rectification stage needed for the connection of DC loads in the AC distribution system is eliminated in the DC system. The rectification stage is inherently included in the measured power consumption data in the AC system. Therefore the measured load data for the AC system were reduced by 8% in the DC system model to reflect the eliminated rectifier losses [25].
Otherwise, the efficiency of conversion stages such as MPPT and the DC/DC energy storage converter for the DC system are is to be the same as that for the AC system, including the grid interface inverter. In the DC system, this inverter is assumed to be bidirectional to enable the feeding of the grid with excess power production as in the AC system, while also enabling supply of the DC loads in rectifier mode when there is insufficient power production within the DC system.
It should be noted that while wiring losses are not considered, the wiring size of the DC installation can be considered the same as that of the existing AC system, where the maximum power is 5 kW for both systems. This is due to the assumption of a 380 V DC bus, which would lead to a lower current compared to the AC system. Therefore, the existing wiring would be capable of handling the required DC current levels, potentially at lower losses.
The analysis of both AC and DC distribution systems was performed based on the combination of PV production data and efficiency profiles of each of the different power converter blocks under representative operating conditions for each of the seasons; this is described in detail in Section 3.

3. System Loss Analysis

3.1. AC Analysis

The performance of the AC system was analysed by determining the breakdown in losses in the different power converter blocks in terms of the time-varying power levels measured throughout the system. By combining these measured power levels with efficiency vs. power curves provided by equipment manufacturers, power loss calculations account for power losses in each of the system components under operating conditions that vary daily and over different seasons.

3.1.1. DC/AC Inverter Losses

The rated power of the DC/AC inverter used in the existing AC system is 6 kW and its efficiency versus power profile is depicted in Figure 3 [32].
Combined with the measured inverter output power (PAC2), a curve fit of the efficiency profile was used to calculate the incoming power from either the battery or the power optimizer (MPPT), and therefore the inverter losses PlinvAC are given by:
P l i n v A C = P A C 2 (   1 ŋ i n v A C 1 )

3.1.2. MPPT Losses

A power optimizer (MPPT) was used to extract the maximum power output from the PV system. Often this stage is integrated within the inverter, but this is not so in this case, and due to the DC distribution system configuration, its loss contribution is considered separately. The rated maximum power of each PV panel is 285 W, at a voltage of 31.15 V. The quoted efficiency profile of an installed panel level MPPT stage is illustrated in Figure 4 [33].
As the inverter input power is known from Equation (1), losses in the MPPT power stage, PlmpptAC, can be calculated from:
P l m p p t A C = ( P A C 2 ŋ i n v A C + P A C 1 )   ( 1 ŋ m p p t A C 1 )
where battery power, PAC1, delivered through the inverter is included/excluded from inverter input power depending on whether the battery is charging/discharging, respectively. That is, by combining the power readings, PAC1 and PAC2 with a curve fit of the MPPT efficiency profile of Figure 4, ηmppt (scaled to the power rating of 22 panels), Equation (2) accounts for the fact that the MPPT output power is the power that comes from the PV system, whether supplying the load demand (through the inverter) or charging the battery.

3.1.3. Battery Charging/Discharging Losses

The battery used in the system is Tesla Powerwall 1.0. It has a total energy of 6.4 kWh, and an operating voltage ranging from 350 to 450 V DC. The round-trip efficiency of the battery is 92.5%, representing the ratio of battery recovered energy (Erec) to consumption (Ein), as shown in:
  ŋ r o u n d % = ( E r e c E i n ) 100  
For simplicity, the efficiency of the battery during either the charging or discharging mode can be approximated by:
    ŋ c h A C =     ŋ r o u n d %
which works out to be 96.2%. This is relatively low compared with the efficiency of other system components and is shown later to contribute significantly to the overall power losses.
The charging input power of the battery (PAC1 > 0) is a measured quantity. However, the resulting power transferred into stored energy is lower due to the inefficiency of the charging circuitry. As a result, the losses incurred by the battery during charging are calculated as PlchAC in Equation (5).
Because of the battery materials and discharging circuity, there are also losses during the discharging mode (PAC1 < 0). Consequently, the output power fed to the load demand is less than any conserved power in the battery. The losses during discharging, PldichAC, are given by:
    P l c h A C = P A C 1 (   1 ŋ c h A C )                                     ( P A C 1 > 0 ) P l d i c h A C = P A C 1 ( 1 1 ŋ c h A C 1 )             ( P A C 1 < 0 )

3.1.4. Rectifier Losses

A rectification stage is included to convert the AC power delivered by the grid (PAC5) and PV system (PAC3) to supply the DC loads. The efficiency of the rectifier is assumed to be 97.5% [25], which is used with the total AC consumption (PAC4 = PAC3 + PAC5) to calculate rectifier power loss, PlrecAC:
P l c h A C = P A C 4 (   1 ŋ r e c A C )

3.2. DC Analysis

The performance of the DC system is analysed in terms of the power levels of PV power production, PDC1, and the DC load profile, PDC2. These two power levels correspond to the PV power production calculated for the AC system and the measured AC loads minus rectifier losses, PDC2 = PAC4 × ŋrec, respectively. Loss calculations for the different power converter stages depend on these relative values of PDC1 and PDC2 as described in the following.

3.2.1. MPPT Losses

The input PV power (PDC1) is used to calculate the output power and therefore the MPPT stage losses, PlmpptDC:
P l m p p t D C = P D C 1 (   1 ŋ m p p t D C )
where the same curve fit of the MPPT efficiency profile in Figure 3 was applied as before.

3.2.2. Battery Charging/Discharging Losses

As the available MPPT output power is known, the charging and discharging power of the battery can be calculated separately. The charging power, PchDC, can be found as:
P c h D C = ( P D C 1     ŋ r e c D C ) P D C 1       P D C 2 < P D C 1     ŋ m p p t D C   SOC % < 100
When combined with the battery charging efficiency, the power loss during charging, PlchDC, is calculated as:
P l c h D C = P c h D C (   1 ŋ c h D C )
The discharge power of the battery, PdichDC, is enabled when the MPPT output power is inadequate to compensate for the required power demand (PDC2).
P d i c h D C = P D C 2 ( P D C 1   ŋ m p p t D C )   P D C 2 < P D C 1     ŋ m p p t D C         S O C % > 6.5
The discharging loss, PldichDC, is then calculated using the battery discharging efficiency as:
    P l d i c h D C = P d i s c h D C (   1 ŋ d i c h D C 1 )
In this case, since the battery state-of-charge, SOC, is not a measured quantity, it needs to be calculated according to:
SOC % = SOC 0 + (   P c h D C + P d i c h D C   0.25     ŋ d i c h D C 6400 ) 100
where SOC0 is the starting SOC of the battery (taken at midnight) and Pch and Pdich are the charging and discharging power of the battery, respectively. The factor of 0.25 accounts for the data sampling time (in hours) to achieve the battery energy in Wh. This is then converted into a percentage of the 6.4 kWh battery capacity.

3.2.3. Bidirectional Inverter Losses

When there are power shortages from either the PV or battery to supply the DC loads (PDC2), the demand power needs to be fed by the grid. In such cases, the bidirectional inverter enables the rectifier mode and the absorbed grid power, Pin_grid, is given by:
P i n _ g r i d = P D C 2 ( P D C 1     ŋ m p p t D C ) P d i c h D C         P D C 2 > ( P D C 1     ŋ m p p t D C + P d i s c h D C )    
The inverter output power is then used to calculate the inverter losses, PlinvDC, with incoming power from the grid as shown in Equation (14).
P l i n v D C = P i n _ g r i d   (   1 ŋ i n v D C   )
However, when the MPPT output power is greater than the total consumption (PDC2) and the battery SOC is 100%, an excess power from the PV, Pout_grid, is delivered to the grid as shown in Equation (15). In such a case, the bidirectional inverter operates in inverter mode.
P l o u t _ e x = ( P D C 1   ŋ m p p t D C ) P D C 2   SOC = 100 %   P D C 2 < P D C 1   ŋ m p p t D C
The inverter loss, PlexDC, is then given by:
    P l e x D C = P o u t _ g r i d   (   1 ŋ i n v D C   )
In this case, the efficiency profile of the bidirectional inverter is assumed to be the same as the AC inverter of Figure 2, where the differences between inversion and rectification are minimal [27].

4. Results and Discussion

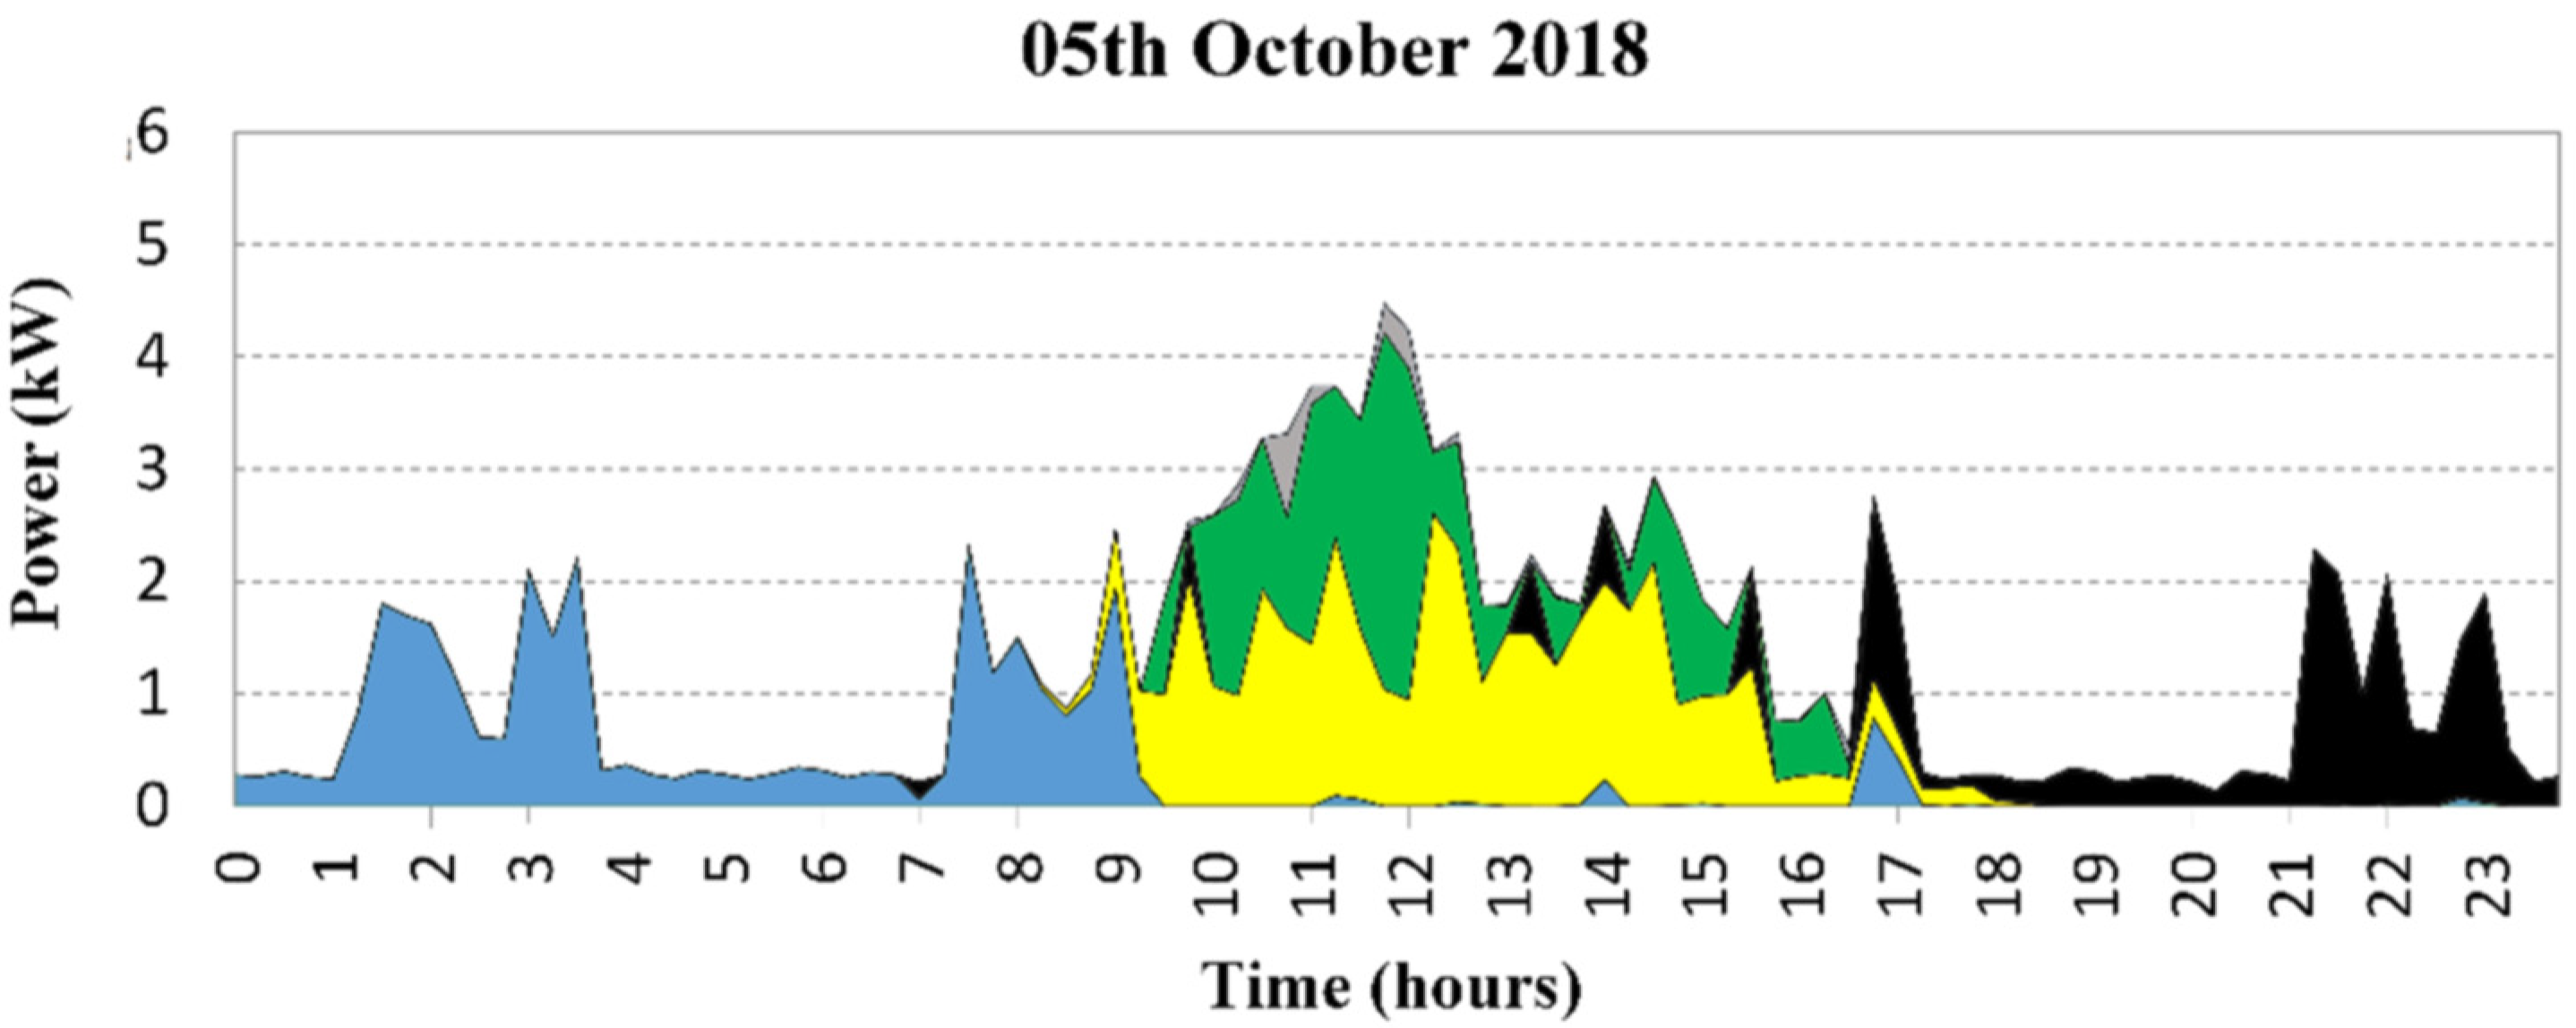
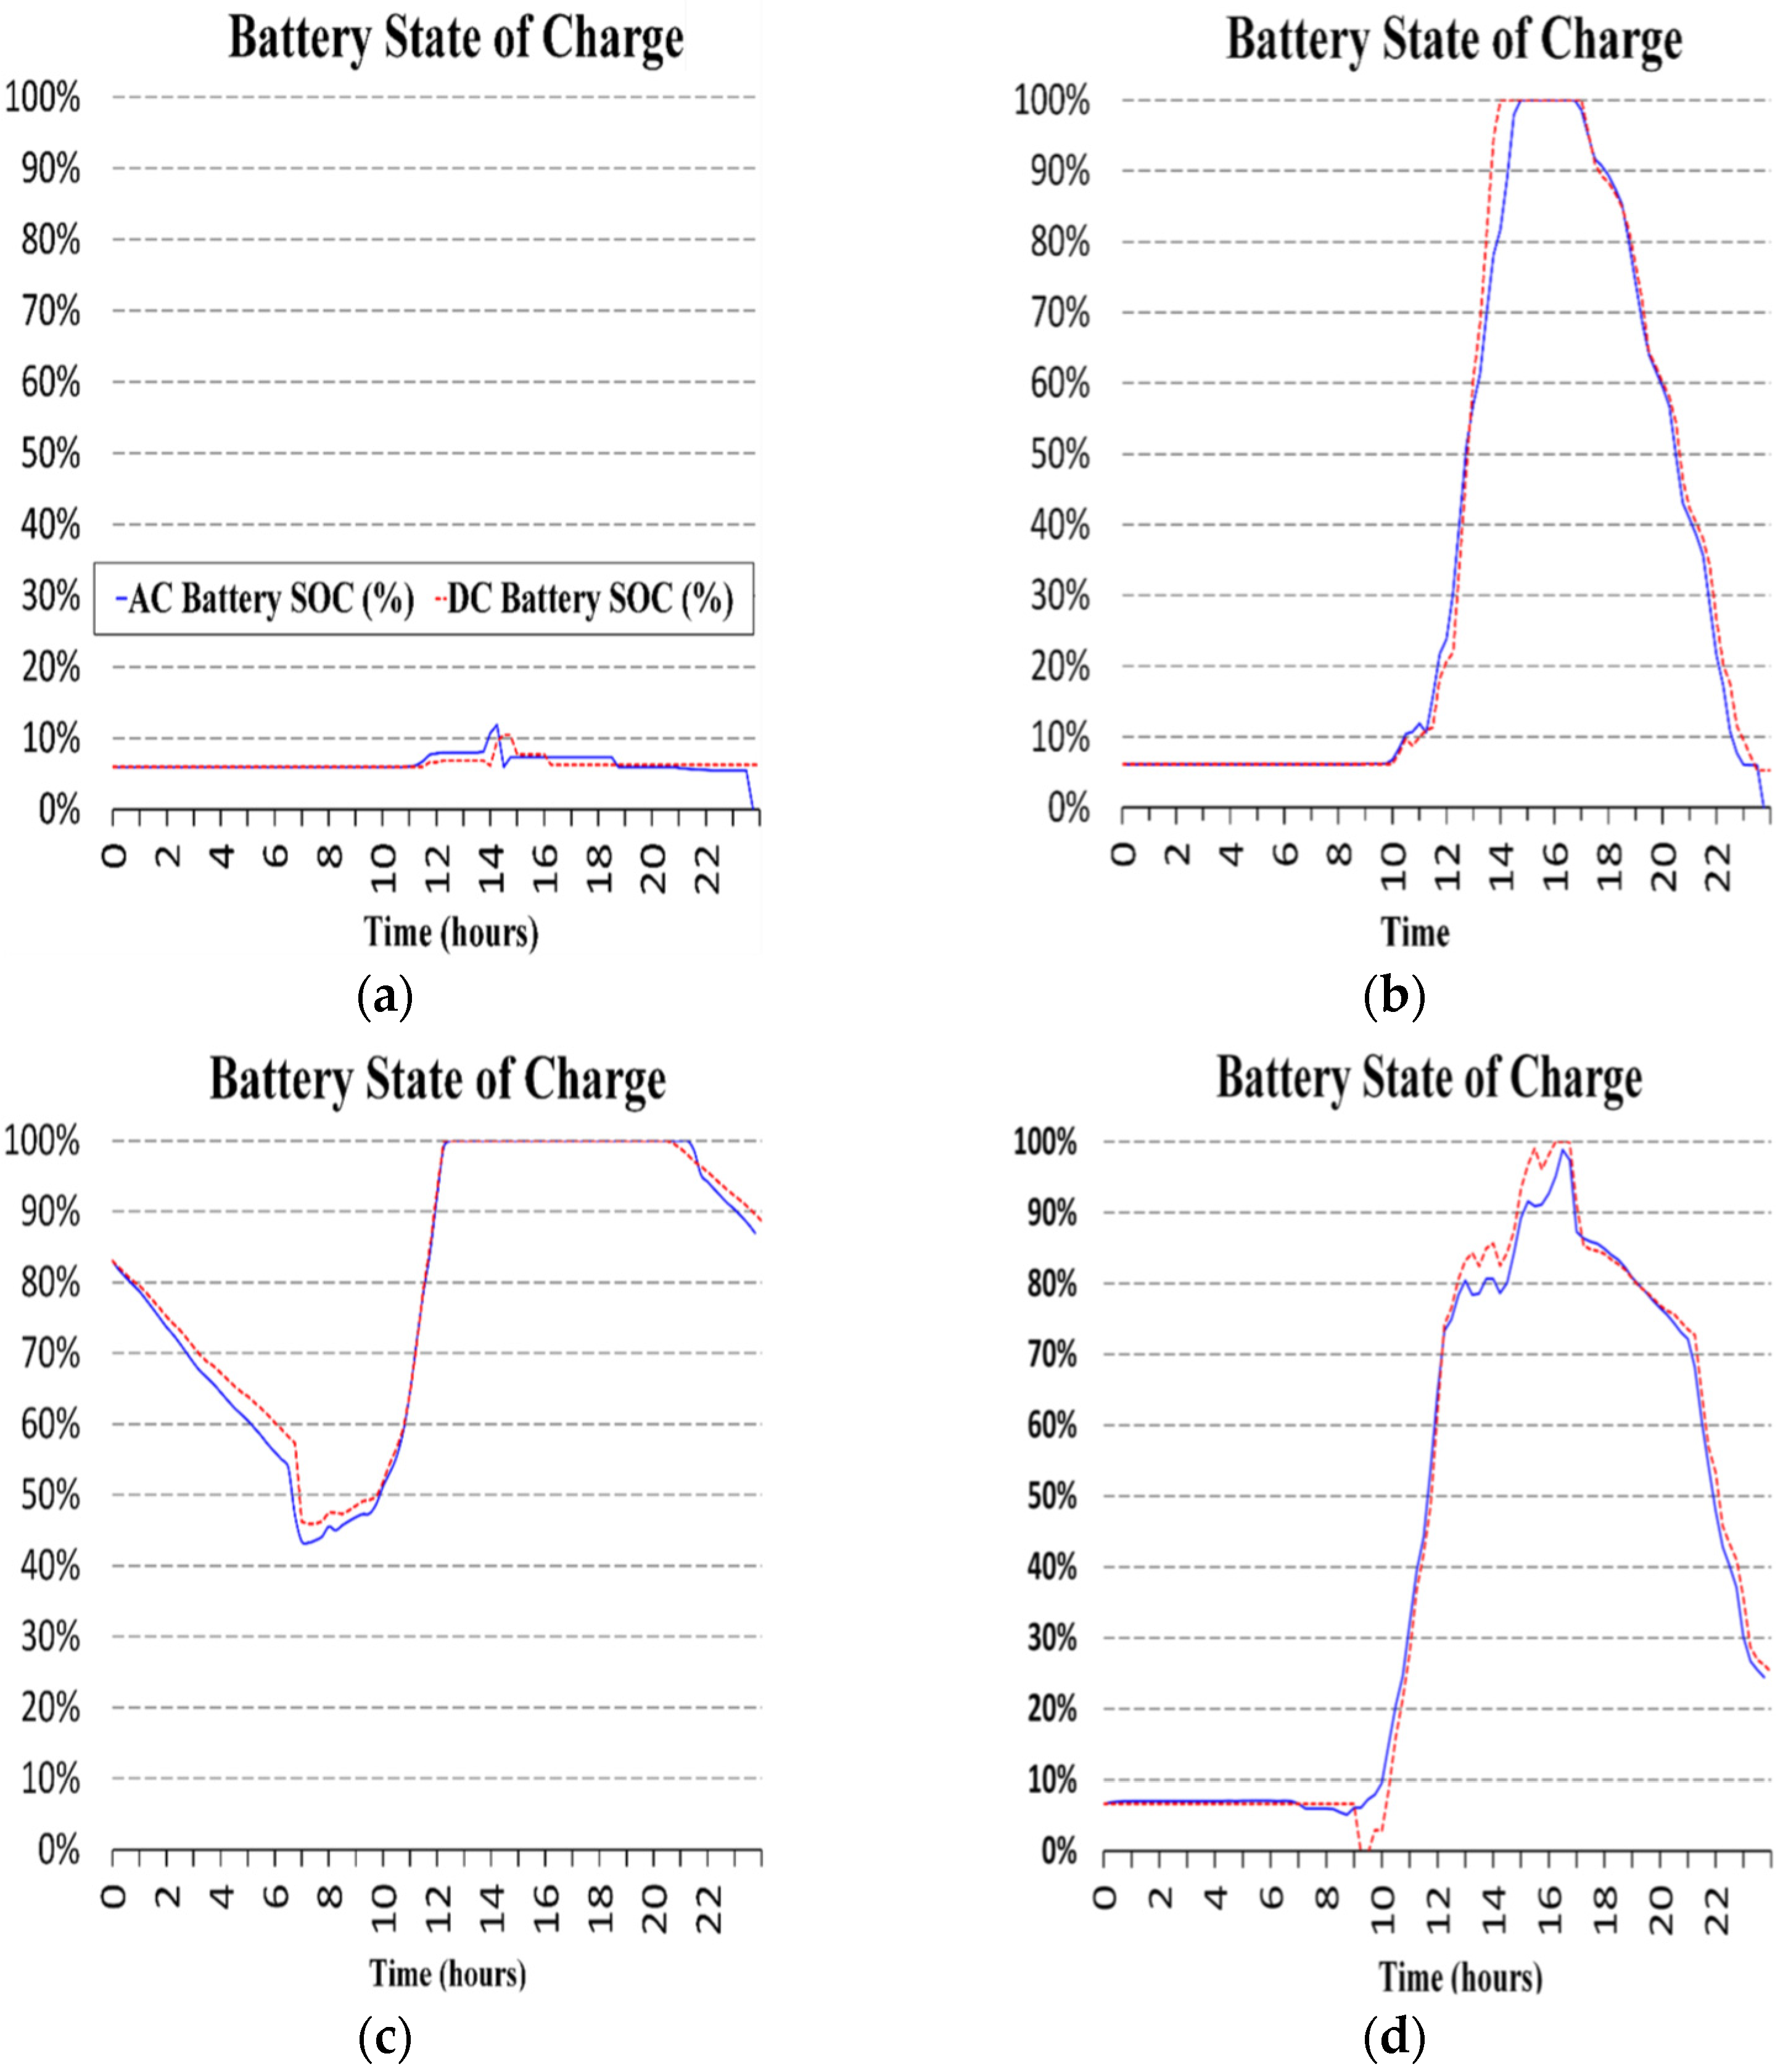
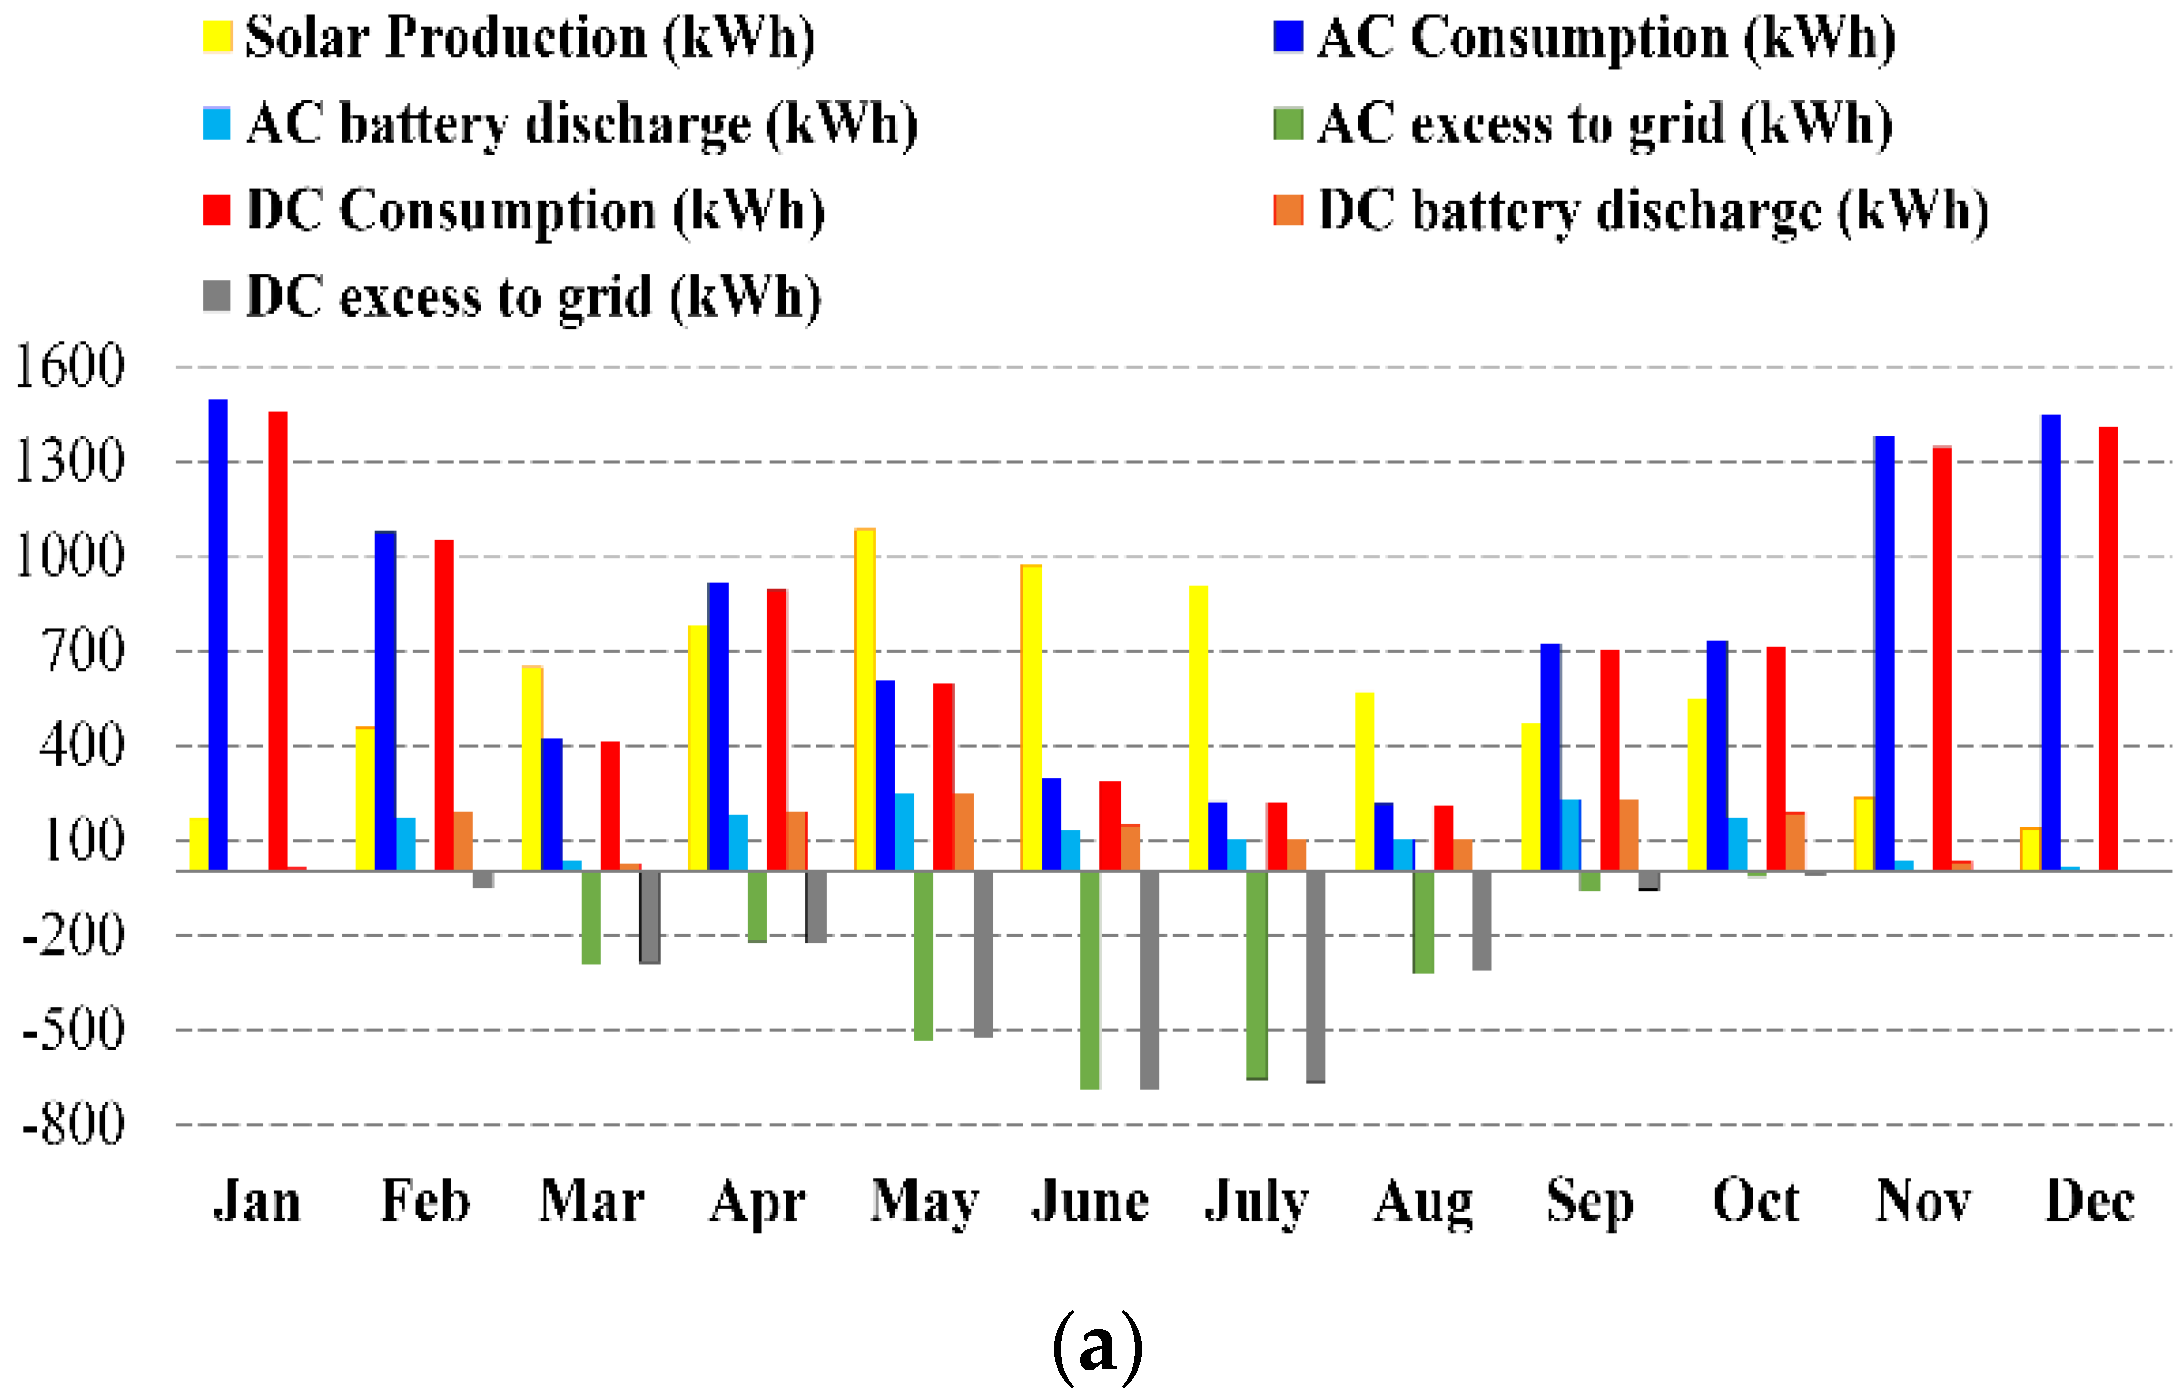
4.1. Grid Power and Battery Usage Levels
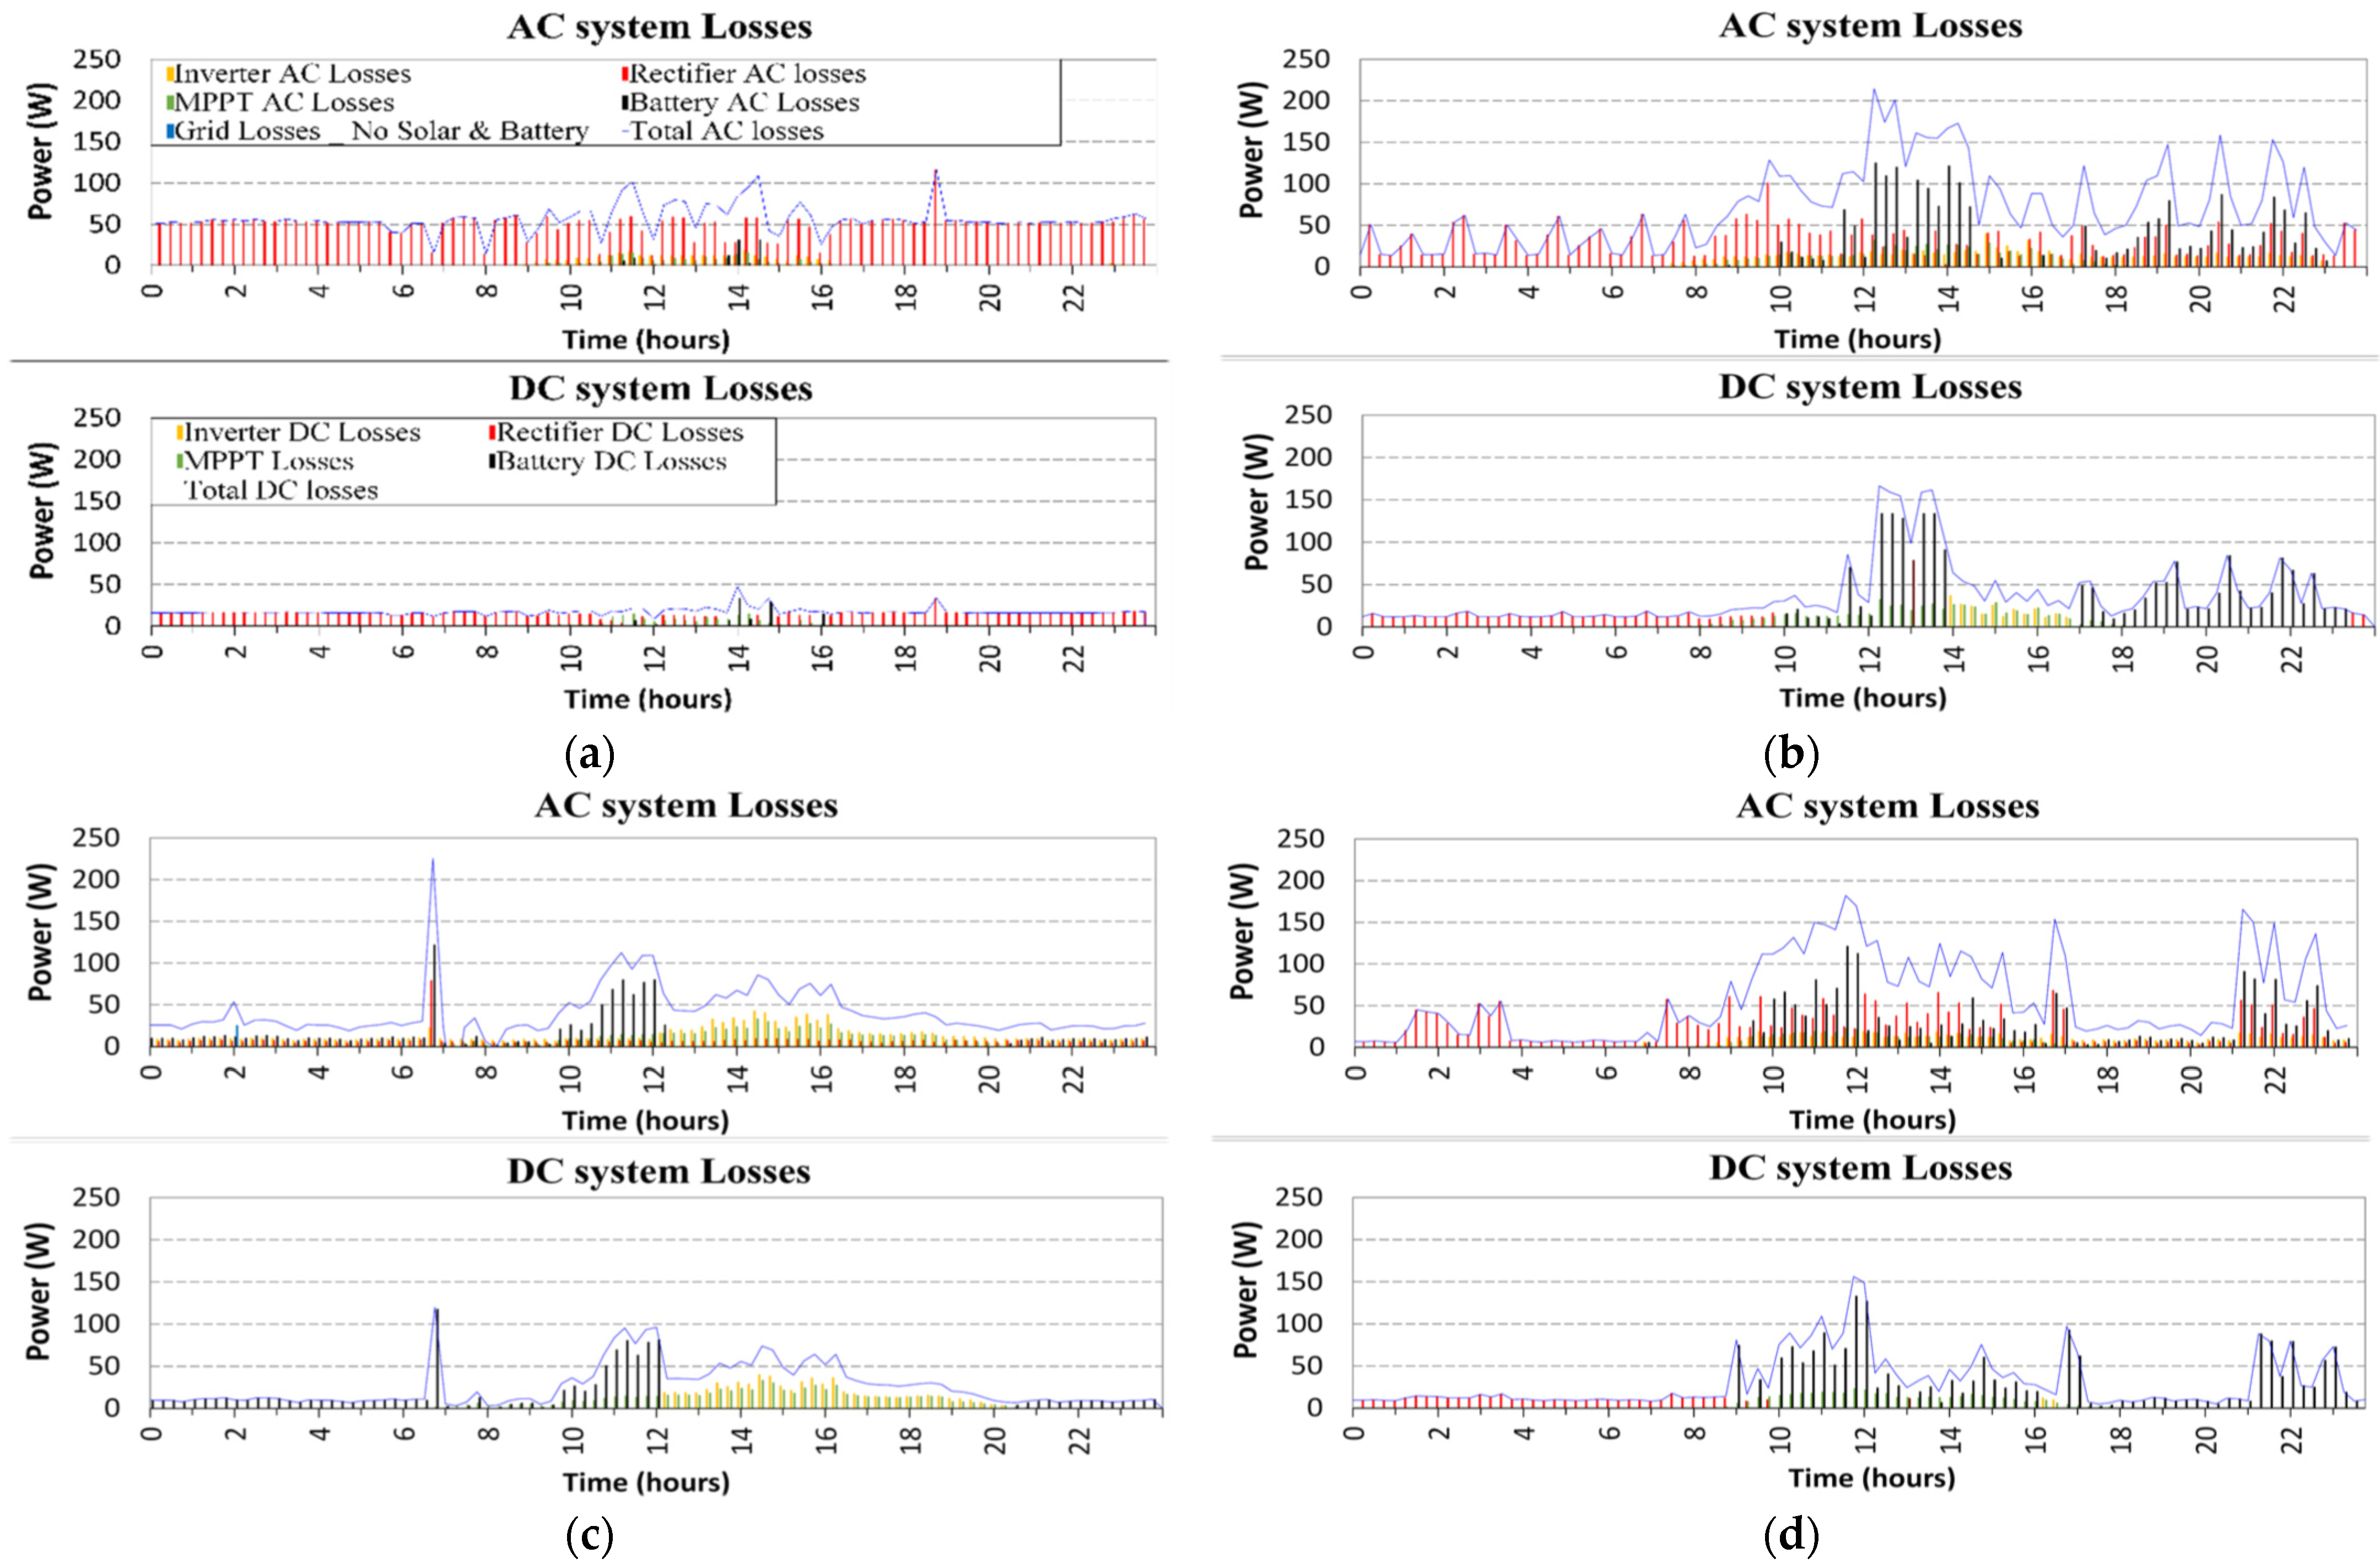
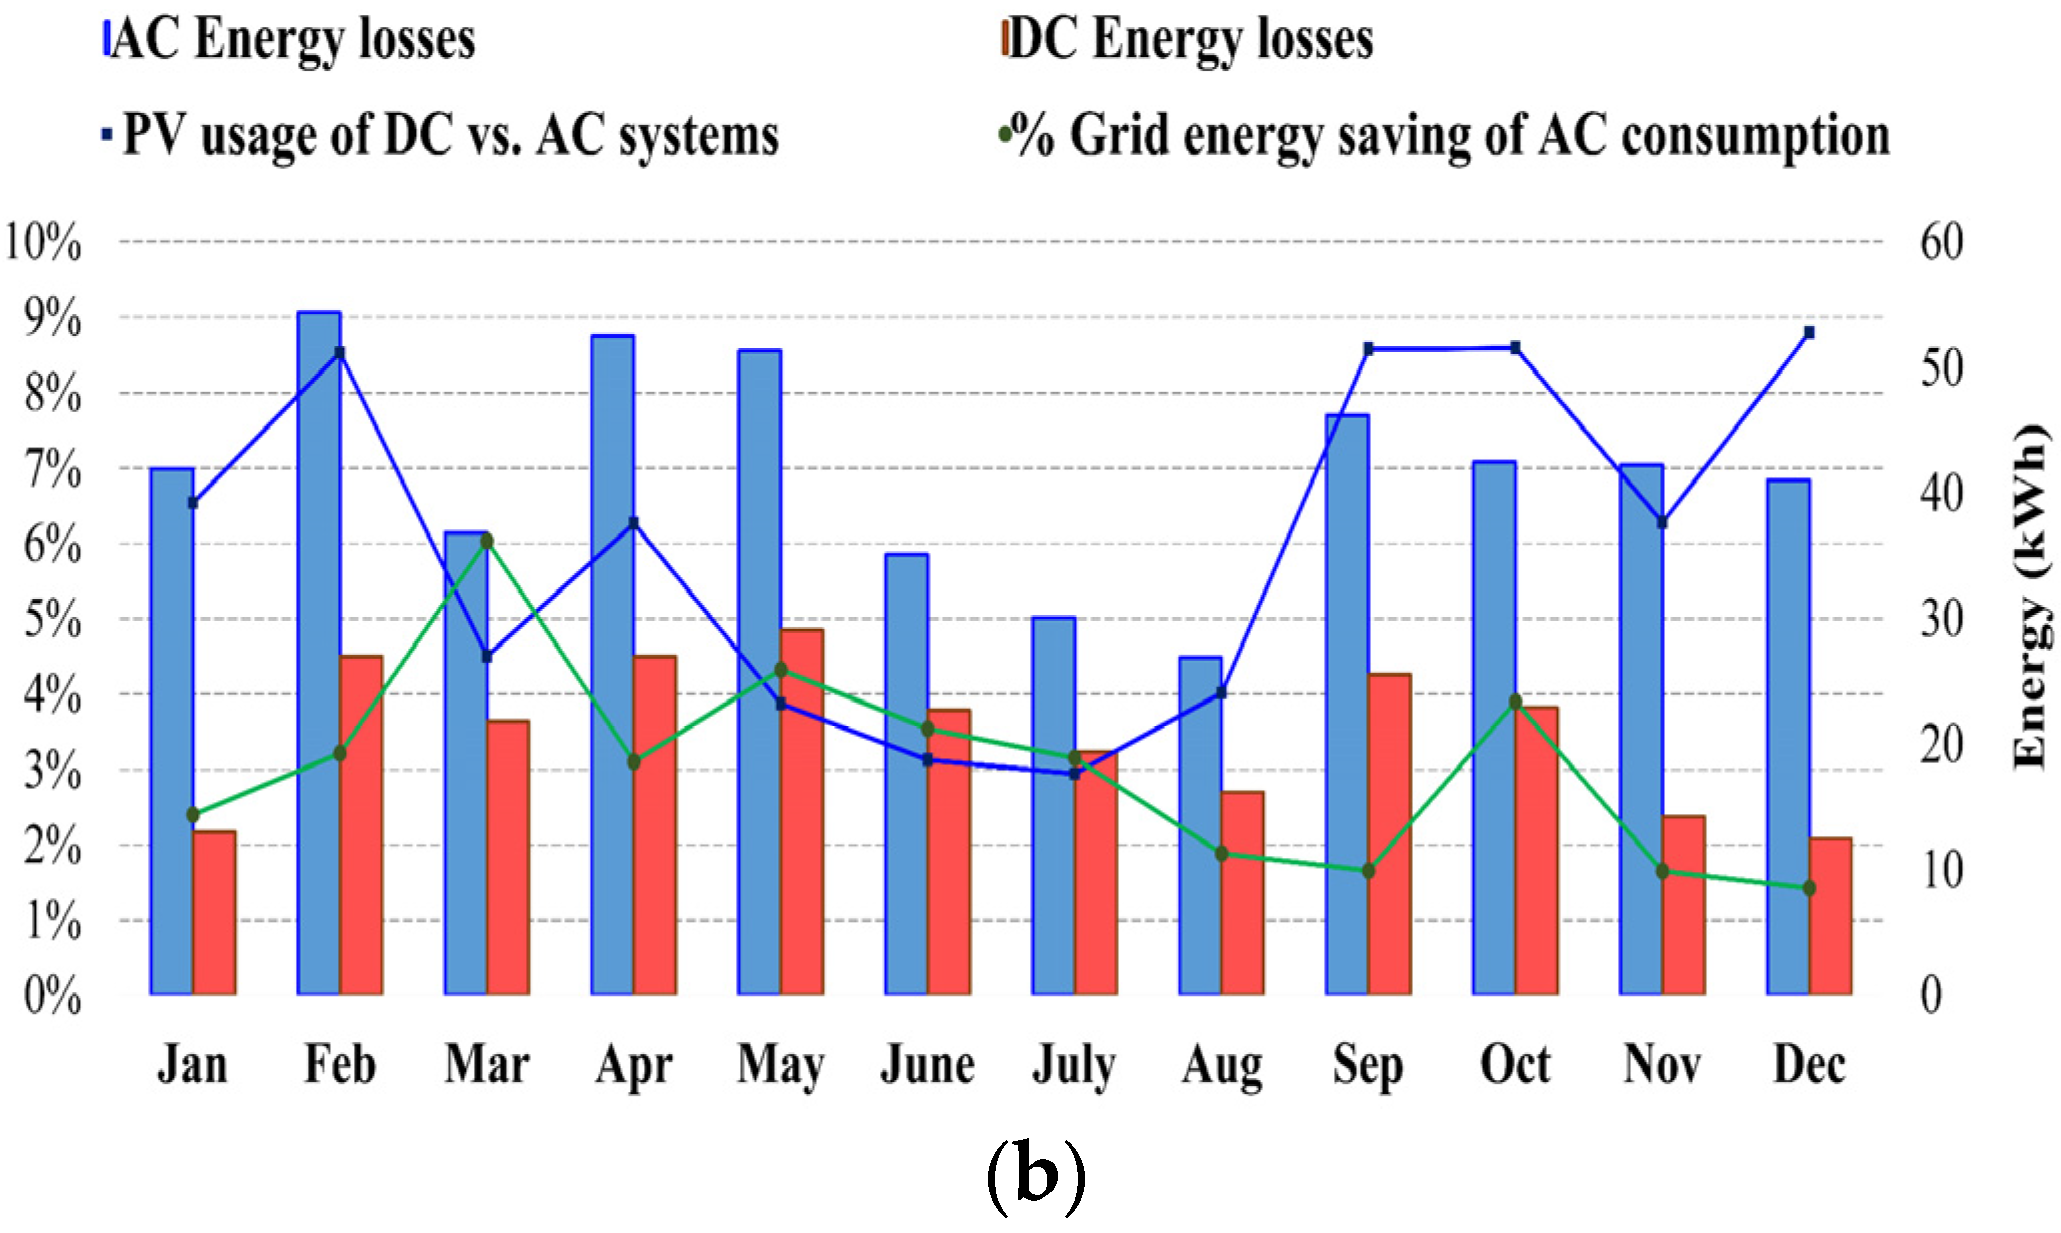
The analysis of the existing AC system is based on a typical day for each season, where the day was chosen as that which has similar source and load profiles to the average monthly profile for that season. As described in Section 3, the data measured on the AC system were applied to predict PV production and grid power for the DC system, along with the battery SOC and system losses for both systems. A comparison of the DC and AC grid energy consumption is presented in Figure 5. The consumption of the DC system is lower than AC in all seasons as a result of the rectification stage needed to supply the AC loads. The greatest difference occurs in spring and autumn when the PV is active, with daily percentage differences in energy of 15.2% and 11.6%, respectively. These percentages reduce to 2.7% in winter when the contribution of PV is minimal. Typically, there is no grid consumption in summer because the heating load power reduces significantly and PV production is the highest. Instead, during summer the most striking difference is in terms of the daily excess PV energy fed into the grid, where it is higher in the DC system than AC by up to 9% and 3% in spring and summer, respectively.
On closer investigation, it is found that the most significant differences relate to battery charging/discharging and grid export power levels.
During spring and autumn, in addition to more efficient delivery of PV power to loads in the DC system, the losses incurred in supplying DC loads during battery discharge are also lower than in the AC system. This is also shown in terms of battery SOC in Figure 6, where it is clear that faster charging and slower discharging are provided in the DC system. A similar effect is seen during summer, but due to much lower load power levels and the dominance of battery discharging losses, the difference between the DC and AC systems is not significant.
Instead, during summer, the most striking difference is in terms of the daily excess PV energy fed into the grid, where it is higher in the DC system than AC by up to 9% and 3% in spring and summer, respectively. This is largely due to a reduction in the power consumption in the DC system as the rectifier stage required in the AC system is eliminated. In addition, in spring, the battery discharges more to supply the load demand compared to summer, when the system production covers the load consumption. This is due to the lower load consumption in summer, when surplus power is fed to the grid.

4.2. Loss Breakdown

To identify the potential for improving the overall efficiency, losses for each of the system components were calculated according to their daily operational power level for each season using the equations provided in Section 3 and are compared for the AC and DC systems in Figure 7.
During winter when the PV and battery are least active, rectifier losses dominate in both systems, although the higher efficiency of the centralized bidirectional inverter in the DC system produces lower losses than individual rectifier stages in the AC system. This is explained by the fact that diodes are most widely applied in rectifiers with a typical efficiency of 97.5% [25], while bidirectional switches such as MOSFETs need to be applied in bidirectional inverters to facilitate the flow of energy to and from the grid. Since losses in MOSFETs are lower than in diodes, the efficiency of a bidirectional inverter in rectification mode is higher than that of a diode rectifier by up to 2%. Therefore, while the main advantage of DC distribution is in feeding energy from PV more directly to the load, it also provides improved performance when loads are supplied through a bidirectional inverter from the grid.
When the PV is active (in spring, summer, and autumn), the most dominant losses are incurred in the battery during charging and discharging in both systems, with little difference between them. However, when the battery discharges to supply the loads, the associated inverter and rectifier losses are eliminated in the DC system. Furthermore, during periods of PV generation when the load demand is relatively high, there is a clear reduction in losses in the DC system as rectifier losses are reduced or eliminated compared to the AC system.
When the battery is fully charged or when the maximum charging power is exceeded, higher inverter losses in the DC system are explained by higher excess PV energy delivered to the grid, as shown in Figure 5. It may be the case therefore that these variations in excess power from the PV depend on the load profile as well as weather conditions when the system operates at high power production.
Finally, as might be expected, the results show that losses in the MPPT stage have similar contributions in both systems because the same PV production profiles apply and it is interesting to note that they are of a similar order of magnitude as the inverter losses.

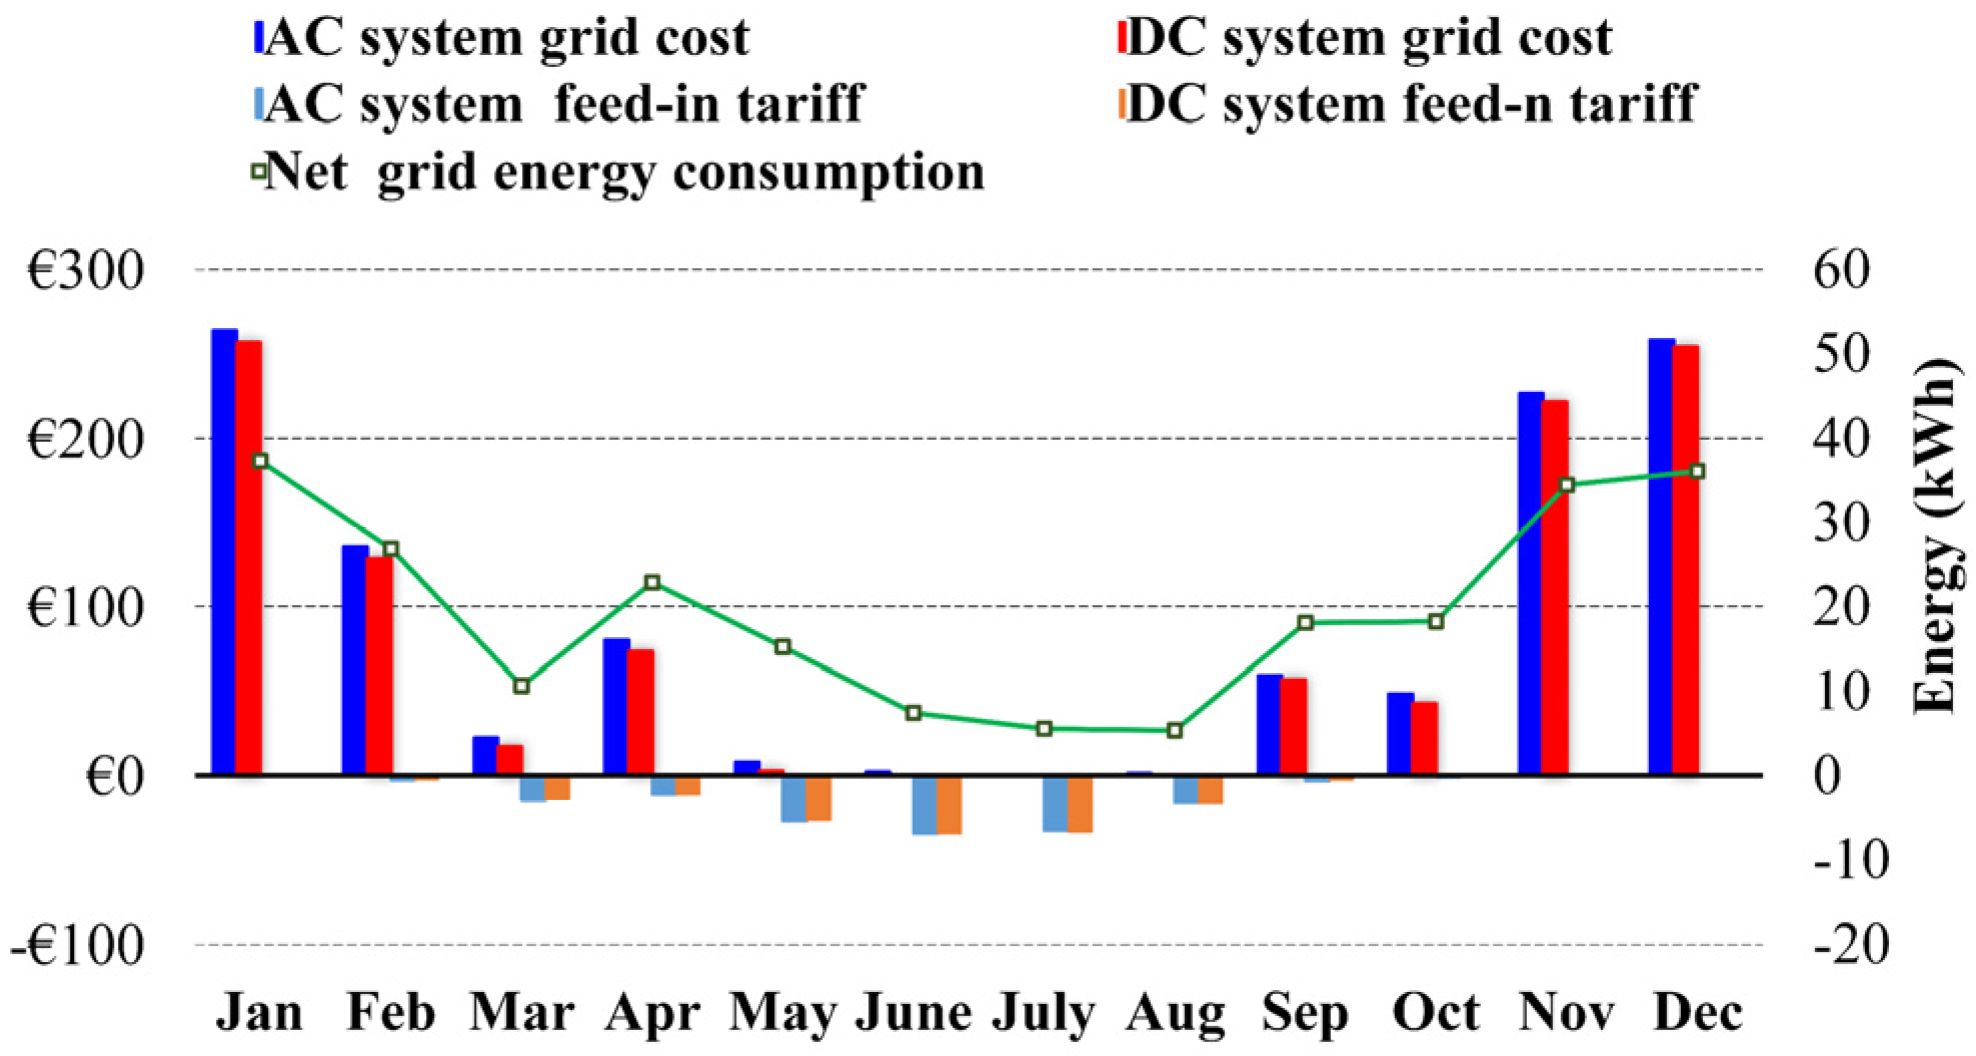
4.3. Summary Analysis

As indicated earlier in the daily profiles of Figure 5, it is found that the AC system has 5% higher annual grid energy consumption when compared to the DC system. This relatively small difference is a result of power being delivered to the loads from the combination of PV, battery, and grid sources and under a range of load conditions. To identify the optimum conditions under which DC distribution provides benefits over AC, a more detailed analysis is completed for each month, as shown in Figure 8. In Figure 8a, the results of PV production are compared with DC vs. AC consumption and grid export levels. It is found that the greatest improvement in net grid energy consumption (import minus export) is when PV production is close to load consumption and when battery use is low. This is shown more clearly in Figure 8b, where the reduction in net grid energy enabled by DC distribution is presented as a percentage of total AC consumption. A maximum improvement of up to 6% is found in March, when PV power is sufficient to supply the load, and low battery discharge levels indicate that PV power is produced when needed. Lesser performance in April is explained by the lower PV production relative to consumption and a mismatch in source and load profiles, as evidenced by relatively high levels of battery discharge. Similar conditions explain the relatively higher performance in October vs. September but to a lesser extent. Surprisingly, the percentage improvement in summer when PV levels are the highest is only 2–4%, but this is because most of the PV energy is being delivered to the grid through an inverter where the power path is the same for DC and AC systems.
Another measure of performance that illustrates optimum conditions for DC vs. AC distribution is the total percentage usage of PV production, which is defined as the sum of local PV usage plus battery discharge plus grid export as a percentage of PV production. The results of the percentage improvement provided by the DC vs. AC system are included in Figure 8b, along with DC vs. AC system losses, where it is seen that there is a strong correlation between PV usage and reduction in losses. It should be noted that losses in the AC system are almost double the DC system for most months of the year except summer. Again, the DC system provides the best performance when PV power is used locally, either directly or through the battery, reflecting lower losses in the power path from the PV/battery to DC loads. High-percentage PV usage levels in winter correspond to low production levels, and therefore the gain in energy (in kWh) is limited during these months. Overall, the total energy saving compared to the annual PV production is 4% for this DC system compared to an equivalent standard AC system.
Building on the findings of other studies which are based only on modelled data [29,30], this work confirms the conditions for which optimal efficiency is provided by DC vs. AC distribution. Thus, it is shown in Figure 8b that the system is more efficient when the load demand is more closely matched by renewable energy sources during the autumn and spring seasons. This study also confirms that improved performance is provided when energy is supplied from the grid via a bidirectional inverter rather than a unidirectional diode rectifier, as described in Section 4.2. Consequently, the associated losses in the grid interface converter were reduced significantly in the winter season as the load demand is high.
Finally, the question of how much reduction in the grid energy cost is provided by the DC over AC distribution for supplying the given load demand is considered. Assuming a price of 18.34 EUR/kWh for energy purchased from the grid and a feed-in tariff rate of 0.09 EUR/kWh [34,35], the results of monthly costs/credit are presented in Figure 9. It can be seen that due to limited PV production, electricity costs of both AC and DC systems are higher in winter and autumn, but with still a small but noticeable reduction in DC system costs. This is explained by lower losses in the DC system and the net grid energy consumption compared to the AC system as discussed above. The relative improvement is higher in spring and summer, when total energy costs are lower and the PV production better matches demand. Higher feed-in tariff from the DC vs. AC system is also shown, but even though energy levels are high in summer, this benefit is limited by the low tariff rate.

5. Conclusions

The performance of AC and DC distribution systems in a 6 kW PV installation in a school building is demonstrated over a range of operating conditions, including varying PV generation levels (according to weather) and varying load profiles (due to seasonal variations in the building usage). The analysis is based on power consumption data collected from a 6 kW installation over the period of a year (at 15 min intervals), combined with detailed efficiency vs. power curves of each component of the installed equipment. In this way, it provides a means for identifying the optimum conditions for DC vs. AC distribution, as well as limitations in power conversion equipment, which can be addressed in future research. The results show that DC distribution has the potential to reduce system losses by up to 50% under heavy load conditions and to reduce the annual energy taken from the grid by up to 5%. Optimum DC system performance is found when PV production is of a similar level to load consumption, and when supply and demand profiles coincide in time.
Although it is outside the scope of this study, an additional advantage of DC distribution is that the harmonics associated with the inverter and rectifier stages are eliminated when the loads are supplied from PV and/or the battery. This is expected to further reduce the losses in the DC system, but needs further investigation. Furthermore, harmonic effects would be comparable for both systems when the loads are supplied from the grid through their respective rectifier stages, which are required to meet harmonic regulations. Other limitations of the study include an assumption that all loads can be operated directly from a DC supply, although this is true for the range of load types considered. Secondly, distribution wiring losses are not considered, but these are expected to be comparable due to the assumption of a 380 V DC bus voltage.
In summary, it is found that a DC distribution system has potential benefits in energy-efficient buildings compared with the conventional AC system. Thus, the findings of this study have a number of important implications for future practice to enhance the DC system efficiency.
  • In both systems, losses are dominated by battery charging/discharging processes, and there is scope to improve this by demand side management.
  • There is scope for further improvement in terms of sizing the energy source to better match the load demand and to reduce the need for energy storage.
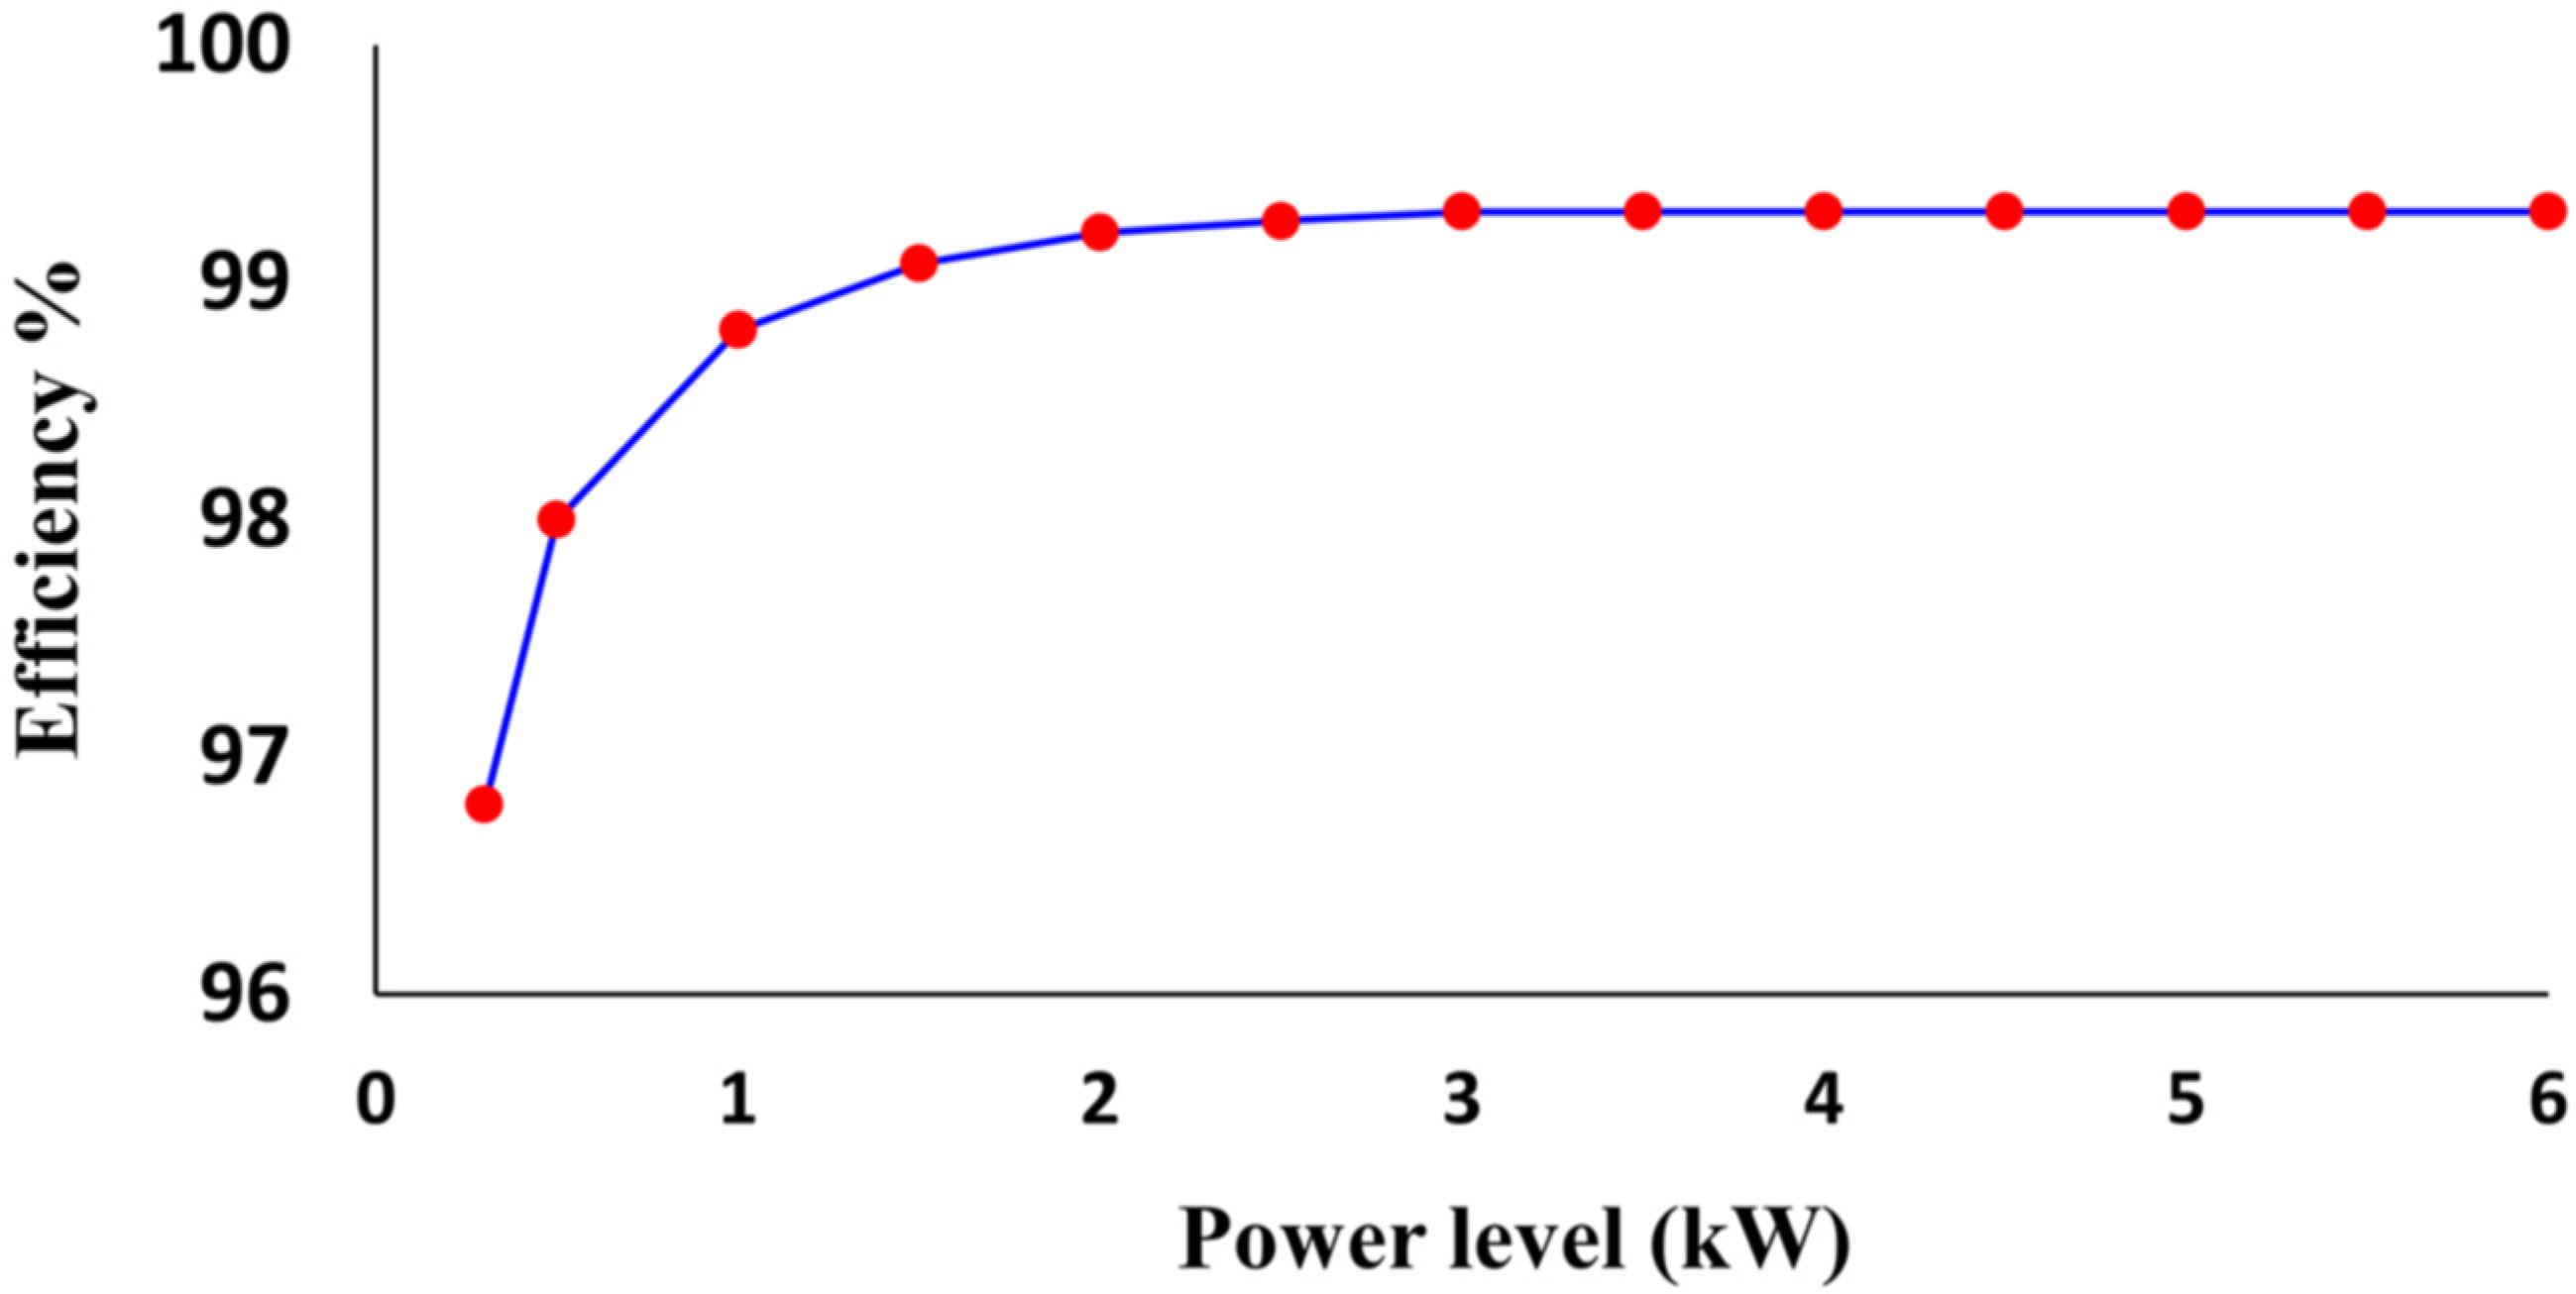
  • There is also scope to improve the efficiency of power conversion stages, particularly bidirectional inverters for battery charging and grid connection, which have optimal efficiency when there is a high power level, but operate under reduced capacity most of the time.

Author Contributions

Conceptualization, M.A. and M.D.; methodology, M.A. and M.D.; software, M.A.; validation, M.A. and M.D.; formal analysis M.A.; investigation, M.A.; resources, M.A. and M.D.; data curation, M.A.; writing—original draft preparation, M.A.; writing—review and editing, M.D.; visualization, M.A. and M.D.; supervision, M.D.; project administration, M.A. and M.D.; funding acquisition, M.A. All authors have read and agreed to the published version of the manuscript.

Funding

Aljouf University, Sakaka, KSA.

Institutional Review Board Statement

Not applicable.

Informed Consent Statement

Not applicable.

Data Availability Statement

The data are available upon request with reasonable purpose via an email to the correspondence author.

Acknowledgments

The authors would like to acknowledge Comhar Caomhán Teo/Inis Oírr Community Development Cooperative and Greenwatt Ltd., who provided access to the power consumption data used in this study. Moreover, this work is subsidized by Aljouf University, Sakaka, KSA under Grant No. IRJU801.

Conflicts of Interest

The authors declare no conflict of interest.

Nomenclature

ACAlternative current
DCDirect current
LED Light-emitting diode
MPPT Maximum power point tracking
PV Photovoltaic

References

  1. Khoury, J.; Mbayed, R.; Salloum, G.; Monmasson, E.; Guerrero, J. Review on the integration of photovoltaic renewable energy in developing countries—Special attention to the Lebanese case. Renew. Sustain. Energy Rev. 2016, 57, 562–575. [Google Scholar] [CrossRef]
  2. Virupaksha, V.; Harty, M.; McDonnell, K. Microgeneration of electricity using a solar photovoltaic system in Ireland. Energies 2019, 12, 4600. [Google Scholar] [CrossRef] [Green Version]
  3. Murphy, F.; McDonnell, K. A feasibility assessment of photovoltaic power systems in Ireland; a case study for the Dublin region. Sustainability 2017, 9, 302. [Google Scholar] [CrossRef] [Green Version]
  4. Mishra, A.; Rajeev, K.K.; Garg, V. Assessment of 48 volts DC for homes. In Proceedings of the 2018 IEEMA Engineer Infinite Conference (eTechNxT), New Delhi, India, 13–14 March 2018; pp. 1–6. [Google Scholar]
  5. Rodriguez-Diaz, E.; Vasquez, J.C.; Guerrero, J.M. Potential energy savings by using direct current for residential applications: A Danish household study case. In Proceedings of the 2017 IEEE Second International Conference DC Microgrids (ICDCM), Bamberg, Germany, 27–29 June 2017; pp. 547–552. [Google Scholar]
  6. Rodriguez-Diaz, E.; Savaghebi, M.; Vasquez, J.C.; Guerrero, J.M. An overview of low voltage DC distribution systems for residential applications. In Proceedings of the 5th IEEE International Conference on Consumer Electronics-Berlin (ICCE-Berlin), Berlin, Germany, 6–9 September 2015; pp. 318–322. [Google Scholar]
  7. Ahn, J.; Koo, K.; Kim, D.; Lee, B.; Jin, H. Comparative analysis and safety standard guideline of AC and DC supplied home appliances. In Proceedings of the 8th International Conference on Power Electronics—ECCE Asia, Jeju, Korea, 30 May–3 June 2011; pp. 1118–1125. [Google Scholar]
  8. Park, J.S.; Choi, J.H.; Gu, B.G.; Jung, I.S. Feasibility study of DC electrical distribution system. In Proceedings of the 8th International Conference on Power Electronics-ECCE Asia, Jeju, Korea, 30 May–3 June 2011; pp. 2935–2938. [Google Scholar]
  9. Vossos, V.; Garbesi, K.; Shen, H. Energy savings from direct-DC in U.S. residential buildings. Energy Build. 2014, 68, 223–231. [Google Scholar] [CrossRef]
  10. Noritake, M.; Yuasa, K.; Takeda, T.; Shimomachi, K.; Hara, R.; Kita, H.; Matsumura, T. Experimental study of a 400 v class DC microgrid for commercial buildings. In Proceedings of the 9th International Conference on Power Electronics andECCE Asia (ICPE-ECCE Asia), Seoul, Korea, 1–5 June 2015; pp. 1730–1735. [Google Scholar]
  11. Zhang, F.; Meng, C.; Yang, Y.; Sun, C.; Ji, C.; Chen, Y.; Wei, W.; Qiu, H.; Yang, G. Advantages and challenges of DC microgrid for commercial building a case study from Xiamen university DC microgrid. In Proceedings of the 2015 IEEE First International Conference on DC Microgrids (ICDCM), Atlanta, GA, USA, 7–10 June 2015; pp. 355–358. [Google Scholar]
  12. Iyer, S.; Dunford, W.G.; Ordonez, M. DC distribution systems for homes. In Proceedings of the IEEE Power Energy Society General Meeting, Denver, CO, USA, 26–30 July 2015; pp. 1–5. [Google Scholar]
  13. Baek, J.W.; Ryu, M.H.; Kim, J.H.; Kim, T.J. A Study on the DC Distribution System for Small Scale Residential Buildings. In Proceedings of the 9th International Conference on Power Electronics and ECCE Asia (ICPE-ECCE Asia), Seoul, Korea, 1–5 June 2015; pp. 2527–2531. [Google Scholar]
  14. Das, J.P.; Fatema, R.J.; Anower, M.S. Feasibility study of low voltage DC distribution system for residential buildings in Bangladesh & hybrid home appliance design for tropical climate. In Proceedings of the 2nd International Conference on Electrical, Computer and Telecommunication Engineering (ICECTE), Rajshahi, Bangladesh, 8–10 December 2017; pp. 1–4. [Google Scholar]
  15. Dastgeer, F.; Gelani, H.E.; Anees, H.M.; Paracha, Z.J.; Kalam, A. Analyses of efficiency/energy-savings of DC power distribution systems/microgrids: Past, present and future. Int. J. Electr. Power Energy Syst. 2019, 104, 89–100. [Google Scholar] [CrossRef]
  16. Gelani, H.E.; Dastgeer, F.; Nasir, M.; Khan, S.; Guerrero, J.M. AC vs. DC distribution efficiency: Are we on the right path? Energies 2021, 14, 4039. [Google Scholar] [CrossRef]
  17. Lo Franco, F.; Morandi, A.; Raboni, P.; Grandi, G. Efficiency Comparison of DC and AC Coupling Solutions for Large-Scale PV+BESS Power Plants. Energies 2021, 14, 4823. [Google Scholar] [CrossRef]
  18. Gerber, D.L.; Vossos, V.; Feng, W.; Khandekar, A.; Marnay, C.; Nordman, B. A simulation based comparison of AC and DC power distribution networks in buildings. In Proceedings of the IEEE 2nd International Conference Direct Current Microgrids (ICDCM), Nuremburg, Germany, 27–29 June 2017; pp. 588–595. [Google Scholar]
  19. Vossos, V.; Gerber, D.; Bennani, Y.; Brown, R.; Marnay, C. Techno-economic analysis of DC power distribution in commercial buildings. Appl. Energy 2018, 230, 663–678. [Google Scholar] [CrossRef] [Green Version]
  20. Chauhan, R.K.; Rajpurohit, B.S. DC Distribution System for Energy Efficient Buildings. In Proceedings of the 2014 Eighteenth National Power System Conference (NPSC), Guwahati, India, 18–20 December 2014; pp. 1–6. [Google Scholar]
  21. Hofer, J.; Svetozarevic, B.; Schlueter, A. Hybrid AC/DC building microgrid for solar PV and battery storage integration. In Proceedings of the 2017 IEEE 2nd International Conference Direct Current Microgrids (ICDCM), Nuremburg, Germany, 27–29 June 2017; pp. 188–191. [Google Scholar]
  22. Kakigano, H.; Nomura, M.; Ise, T. Loss evaluation of dc distribution for residential houses compared with ac system. In Proceedings of the 2010 International Power Electronics Conference—ECCE Asia, Sapporo, Japan, 21–24 June 2010; pp. 480–486. [Google Scholar]
  23. Amin, M.; Arafat, Y.; Lundberg, S.; Mangold, S. Low voltage DC distribution system compared with 230 V AC. In Proceedings of the 2011 IEEE Electrical Power and Energy Conference, Winnipeg, MB, Canada, 3–5 October 2011; pp. 340–345. [Google Scholar]
  24. Weiss, R.; Ott, L.; Boeke, U. Energy efficient low-voltage DC-grids for commercial buildings. In Proceedings of the 2015 IEEE 1st International Conference Direct Current Microgrids (ICDCM), Atlanta, GA, USA, 7–10 June 2015; pp. 154–158. [Google Scholar]
  25. Fregosi, D.; Ravula, S.; Brhlik, D.; Saussele, J.; Frank, S.; Bonnema, E.; Scheib, J.; Wilson, E. A comparative study of DC and AC microgrids in commercial buildings across different climates and operating profiles. In Proceedings of the 2015 IEEE 1st International Conference Direct Current Microgrids (ICDCM), Atlanta, GA, USA, 7–10 June 2015; pp. 159–164. [Google Scholar]
  26. Manandhar, U.; Keng, T.; Jonathan, K. Efficiency Comparison of DC and AC Microgrid. In Proceedings of the 2015 IEEE Innovative Smart Grid Technolgies—Asia (ISGT ASIA), Bangkok, Thailand, 3–6 November 2015; pp. 1–6. [Google Scholar]
  27. Liu, Z.; Li, M. Research on Energy Efficiency of DC Distribution System. AASRI Procedia 2014, 7, 68–74. [Google Scholar] [CrossRef]
  28. Al-Subhi, A.; El-Amin, I. Experimental performance analysis of existing conventional AC air conditioner and corresponding new pure DC air conditioner. In Proceedings of the 2017 IEEE 2nd International Conference Direct Current Microgrids (ICDCM), Nuremburg, Germany, 27–29 June 2017; pp. 330–336. [Google Scholar]
  29. Sahoo, N.C.; Mohapatro, S.; Sahu, A.K.; Mohapatro, B.S. Loss and cost evaluation of typical DC distribution for residential house. In Proceedings of the IEEE 6th International Conference Power Energy (PECon), Melaka, Malaysia, 28–29 November 2017; pp. 668–673. [Google Scholar]
  30. Glasgo, B.; Azevedo, I.L.; Hendrickson, C. How much electricity can we save by using direct current circuits in homes? Understanding the potential for electricity savings and assessing feasibility of a transition towards DC powered buildings. Appl. Energy 2016, 180, 66–75. [Google Scholar] [CrossRef] [Green Version]
  31. Alshammari, M.; Duffy, M. Comparative analysis between AC and DC distribution systems in a photovoltaic system: A case study of a school in Ireland. In Proceedings of the PCIM Europe 2019, International Exhibition and Conference for Power Electronics, Intelligent Motion, Renewable Energy and Energy Management, Nuremberg, Germany, 7–9 May 2019; pp. 1–8. [Google Scholar]
  32. America, N. SolarEdge Single Phase Inverters. Change 5–6. Available online: https://cutt.ly/LcIPu9f (accessed on 1 May 2018).
  33. Solaredge Efficiency of P Series Power Optimizers. 2018, pp. 1–5. Available online: https://cutt.ly/DcIAcKT (accessed on 1 May 2018).
  34. Northern Ireland Residential Electricity Customers Price Schedule—Simpler Living 24 Hour BillPay. 2019. Available online: https://cutt.ly/3cIAYKm. (accessed on 1 October 2018).
  35. Action, C.; Stanley, T.D. ESB’s Role The EU Clean Energy Package Provides a Regulatory Framework for Microgeneration. 2021, pp. 1–5. Available online: https://cutt.ly/TcIABdo (accessed on 1 October 2018).
Figure 1. A schematic diagram of (a) the existing AC distribution system and (b) the proposed DC distribution system.
Energies 14 06265 g001
Figure 2. Representative solar production and load profile of the AC system for different seasons.
Energies 14 06265 g002aEnergies 14 06265 g002b
Figure 3. Inverter efficiency.
Energies 14 06265 g003
Figure 4. MPPT efficiency.
Energies 14 06265 g004
Figure 5. Grid and energy storage power of AC and DC systems in (a) winter, (b) spring, (c) autumn, and (d) summer.
Energies 14 06265 g005
Figure 6. Battery SOC% in a typical day in (a) winter, (b) spring, (c) autumn, and (d) summer.
Energies 14 06265 g006
Figure 7. AC and DC power losses in a typical day in (a) winter, (b) spring, (c) summer, and (d) autumn.
Energies 14 06265 g007
Figure 8. Annual AC and DC systems: (a) solar production, consumption, and battery discharge; (b) energy losses, grid energy saving, and PV percentage usage with the DC system.
Energies 14 06265 g008aEnergies 14 06265 g008b
Figure 9. Annual AC and DC systems, grid cost and feed-in tariff, and net grid energy.
Energies 14 06265 g009
Table 1. Comparative studies on the efficiency of AC and DC distribution systems.
Building TypeRef.Energy SourcesEfficiency Improvement
Residential[20]0.9 kW PV, Grid, Energy storage 500 Ah50.1%
Residential[21]7.4 kW PV, Grid, Energy storage 10 kWh20–30%
Residential complex[22]30 kW PV, 6.6 kW Gas engine15%
Residential[23]PV, Micro turbine, and Fuel cellLow for 48 V DC
Commercial[24]PV5.5%
Commercial[25]41 kW PV8%
Residential[26]Grid-
Office[27]Grid14.9%
Residential[28]Grid25.3%
Residential[29]PV, Energy storage6.4%
Residential[30]PV, Energy storage16%
Table 2. Power measurement of the AC system.
Power ParameterMeasurement Quantity (W)
PAC1Battery charging and discharging (W)
PAC2System production (W)
PAC3Self-consumption (W)
PAC4Total consumption (W)
PAC5Power from grid (W)
PAC6Excess power from solar (W)
Table 3. Conversion efficiency of AC and DC distribution systems.
ComponentSystemsModel
Power optimizer (MPPT)AC & DCSolarEdge
InverterACSolarEdge
Battery charge controller AC & DCTesla
RectifierAC[25]
Bidirectional Inverter DCSolarEdge
Table 4. Systems loads profile.
AppliancesQuantityPower (W)
Heat pump114 k
Smart whiteboards5800
LED lights2515/38
PC7120
Others--
Publisher’s Note: MDPI stays neutral with regard to jurisdictional claims in published maps and institutional affiliations.

