Article

A Novel Hybrid Life Cycle Assessment Approach to Air Emissions and Human Health Impacts of Liquefied Natural Gas Supply Chain

1
Engineering Management, College of Engineering, Qatar University, Doha P.O. Box 2713, Qatar
2
Mechanical and Industrial Engineering, College of Engineering, Qatar University, Doha P.O. Box 2713, Qatar
3
Division of Sustainable Development, College of Science and Engineering, Hamad Bin Khalifa University, Qatar Foundation, Doha P.O. Box 34110, Qatar
4
Qatar Transportation and Traffic Safety Center, College of Engineering, Qatar University, Doha P.O. Box 2713, Qatar
*
Author to whom correspondence should be addressed.
Energies 2021, 14(19), 6278; https://doi.org/10.3390/en14196278
Submission received: 10 July 2021 / Revised: 4 September 2021 / Accepted: 10 September 2021 / Published: 2 October 2021

Abstract

:
Global interest in LNG products and supply chains is growing, and demand continues to rise. As a clean energy source, LNG can nevertheless emit air pollutants, albeit at a lower level than transitional energy sources. An LNG plant capable of producing up to 126 MMTA was successfully developed and simulated in this study. A hybrid life cycle assessment model was developed to examine the social and human health impacts of the LNG supply chain’s environmental air emission formation. The Multiregional Input–Output (MRIO) database, the Aspen HYSYS model, and the LNG Maritime Transportation Emission Quantification Tool are the key sources of information for this extensive novel study. We began our research by grouping environmental emissions sources according to the participation of each stage in the supply chain. The MDEA Sweetening plant, LNG loading (export terminal), and LNG transportation stages were discovered to have the maximum air emissions. The midpoint air emissions data estimated each stage’s CO2-eq, NOx-eq, and PM2.5-eq emissions per unit LNG generated. According to the midpoint analysis results, the LNG loading terminal has the most considerable normalized CO2-eq and NOx-eq emission contribution across all LNG supply chain stages. Furthermore, the most incredible intensity value for normalized PM2.5-eq was recorded in the SRU and TGTU units. Following the midpoint results, the social human health impact findings were calculated using ReCiPe 2016 characterization factors to quantify the daily loss of life associated with the LNG process chain. SRU and TGTU units have the most significant social human health impact, followed by LNG loading (export terminal) with about 7409.0 and 1203.9 (DALY/million Ton LNG produced annually), respectively. Natural gas extraction and NGL recovery and fractionation units are the lowest for social human health consequences.

1. Introduction

1.1. LNG Industry and Supply Chain

Natural Gas (NG) has changed significantly all across the world. Due to the changes of industries, they have been forced to pour their heavy investments into supply chains to efficiently reach the Liquefied Natural Gas (LNG) worldwide supply. The LNG trading is undertaking off an intensifying transition from regional, the bilateral flow of trade to local and increasing to the global economy. The NG demand has heightened in a lot of nations that rely on coal as their source of power generation and so that they can reduce the causes of environmental problems. The NG clients established that LNG is a sustainable and promising preference to restore coal and fulfill the necessary energy demands, including the generation of electricity [1]. Between 2018 and 2023, there is the capability to produce over one hundred billion cubic meters of LNG production, with the majority of these additions coming from the United States and Australia [2]. The International Gas Union (IGU) [3] announced the world’s top LNG exporters in its 2020 report, with Russia producing 8% of LNG exports, the USA 10%, Australia 21%, and the leading state, Qatar 22%, exporting 22%.
The entire supply of NG is dependent on the distribution of pipeline networks between the fields of demand and supply. LNG manufacturers are currently specializing in an enhanced process of liquefaction and regasification to achieve an environmentally friendly work climate [4,5]. The transformation of NG through the various processes of the LNG industry chain necessitates the use of a considerable quantity of fuel, which is mainly obtained from the NG feed. A substantial amount of carbon dioxide (CO2) and extra gases such as SO2 and NOx result from the combustion of this fuel. As long as LNG production continues, the expectation of the atmospheric ventilation of industrial air pollutants will be there. Accurate accounting and monitoring of the midpoint air pollution footprint are essential to determine the viability of the LNG management and supply chains and to quantify the human health effects at the endpoint.

1.2. Socio-Environmental Impacts of LNG Chain

It cannot be denied that the industrial activity-to-trade revolution is helping countries to grow and fulfill various social status requirements, such as providing jobs, eradication of poverty, and improving labor standards, gender equality, and access to healthcare and education. On the other hand, industrial practices may have devastating effects on the environment, causing many significant international issues, such as global warming, the destruction of natural resources, the pollution of water and air, and the degradation of organisms. Because of the supply market and enormous demands, the supply chain and the LNG industry are included in this industrial revolution. To ensure the long-term viability of the trading using the LNG process as a significant energy source, the main pillars of sustainability must be carefully measured and evaluated to optimize the positive effects of industrial growth while limiting or removing its adverse effects worldwide. Therefore, the use of sustainable resources and the protection of environmental resources should be of a high level; social cohesion and economic growth also mutually reinforce sustainability.
One of the most profound consequences of LNG industrial growth is the rise in air pollution. Air pollution typically harms humans, plants, and the ecosystem in different ways. For humans, exposure to particular matter increases the risk of developing lung cancer and cardiovascular diseases. Ecosystems are affected by air pollution through ground-level ozone, eutrophication, and acidification. At the same time, greenhouse gases are the primary reason for climate change and its associated ecosystem, health, and economic impacts [6]. According to the World Health Organization (WHO), particle emissions, carbon monoxide, ground-level ozone, nitrogen oxides, sulfur oxides, and lead are the six recorded major air pollutants. Our key focus in this context is to concentrate on the PM2.5-eq, NOx-eq, and CO2-eq, pollutants, as they are related to more common and severe human health problems and have environmental impact issues [7,8].
According to Shah et al. [9], over two million persons die yearly as an immediate consequence of air pollution, which causes harm to the respiratory system and the lungs due to the pollutants found in both indoor and outdoor environments.
Global air pollution-related healthcare has associated costs for general care, treatment, and hospitality; this is according to a research study on the economic effects of outdoor air pollution published by the Organization for Economic Cooperation and Development, OECD [10]. These costs are currently estimated to increase from USD 21 billion in the year 2015 to USD 176 billion in the year 2060, and the amounts are anticipated to even rise above that to USD 176 billion. By the year 2060, the yearly loss of working days, which influences work productivity, is likely to surpass 3.7 billion; in comparison, the current situation sees an annual working loss of only around 1.2 billion days; this will happen at the global level. Limiting the impact of air pollution is a critical decision for environmental policymakers and decision-makers, as it would enable to lower the chances of severe health effects, enrich the surrounding air quality, and produce substantial cobenefits for the atmosphere and environment if appropriately implemented.

1.3. Novelty and Research Objectives

The main objective of this research is to assess and determine the midpoint air emissions associated with the method of LNG trading, including extraction, treatment, liquefaction, shipping, and regasification at the receiving terminals. Using multiple quantification tools such as the MRIO database, Aspen HYSYS, and LNG Maritime Transportation Emission Quantification tools, the approximate air pollution footprint will be used to obtain the endpoint effect on human health based on ReCiPe 2016 characterization factors [11]. This hybrid model will construct the primary human health influence and air emission for the industries of LNG.
In this context, we established a functional and novel model for the mechanism trading processes of LNG to estimate air pollution and human health impacts. Air emissions such as carbon dioxide equivalent, nitrogen oxide equivalent, and particulate matter equivalent were accounted for in the proposed model. The questions about the effect of air pollution from each phase of LNG processing and transportation on the atmosphere and human health in the long run and the reliability and uncertainties of the air emission reporting and accounting tools ignited the interest in this research. It is valid to discuss this area of concern because of the continuous activity of supply and demand for LNG trading and the global appeal of the use of renewable energy sources for maritime transport in the light of the present effect of greenhouse gases (GHG) on global warming and other pollution on the impact of human health all around the world. An outline of the key objectives of this research is as follows:
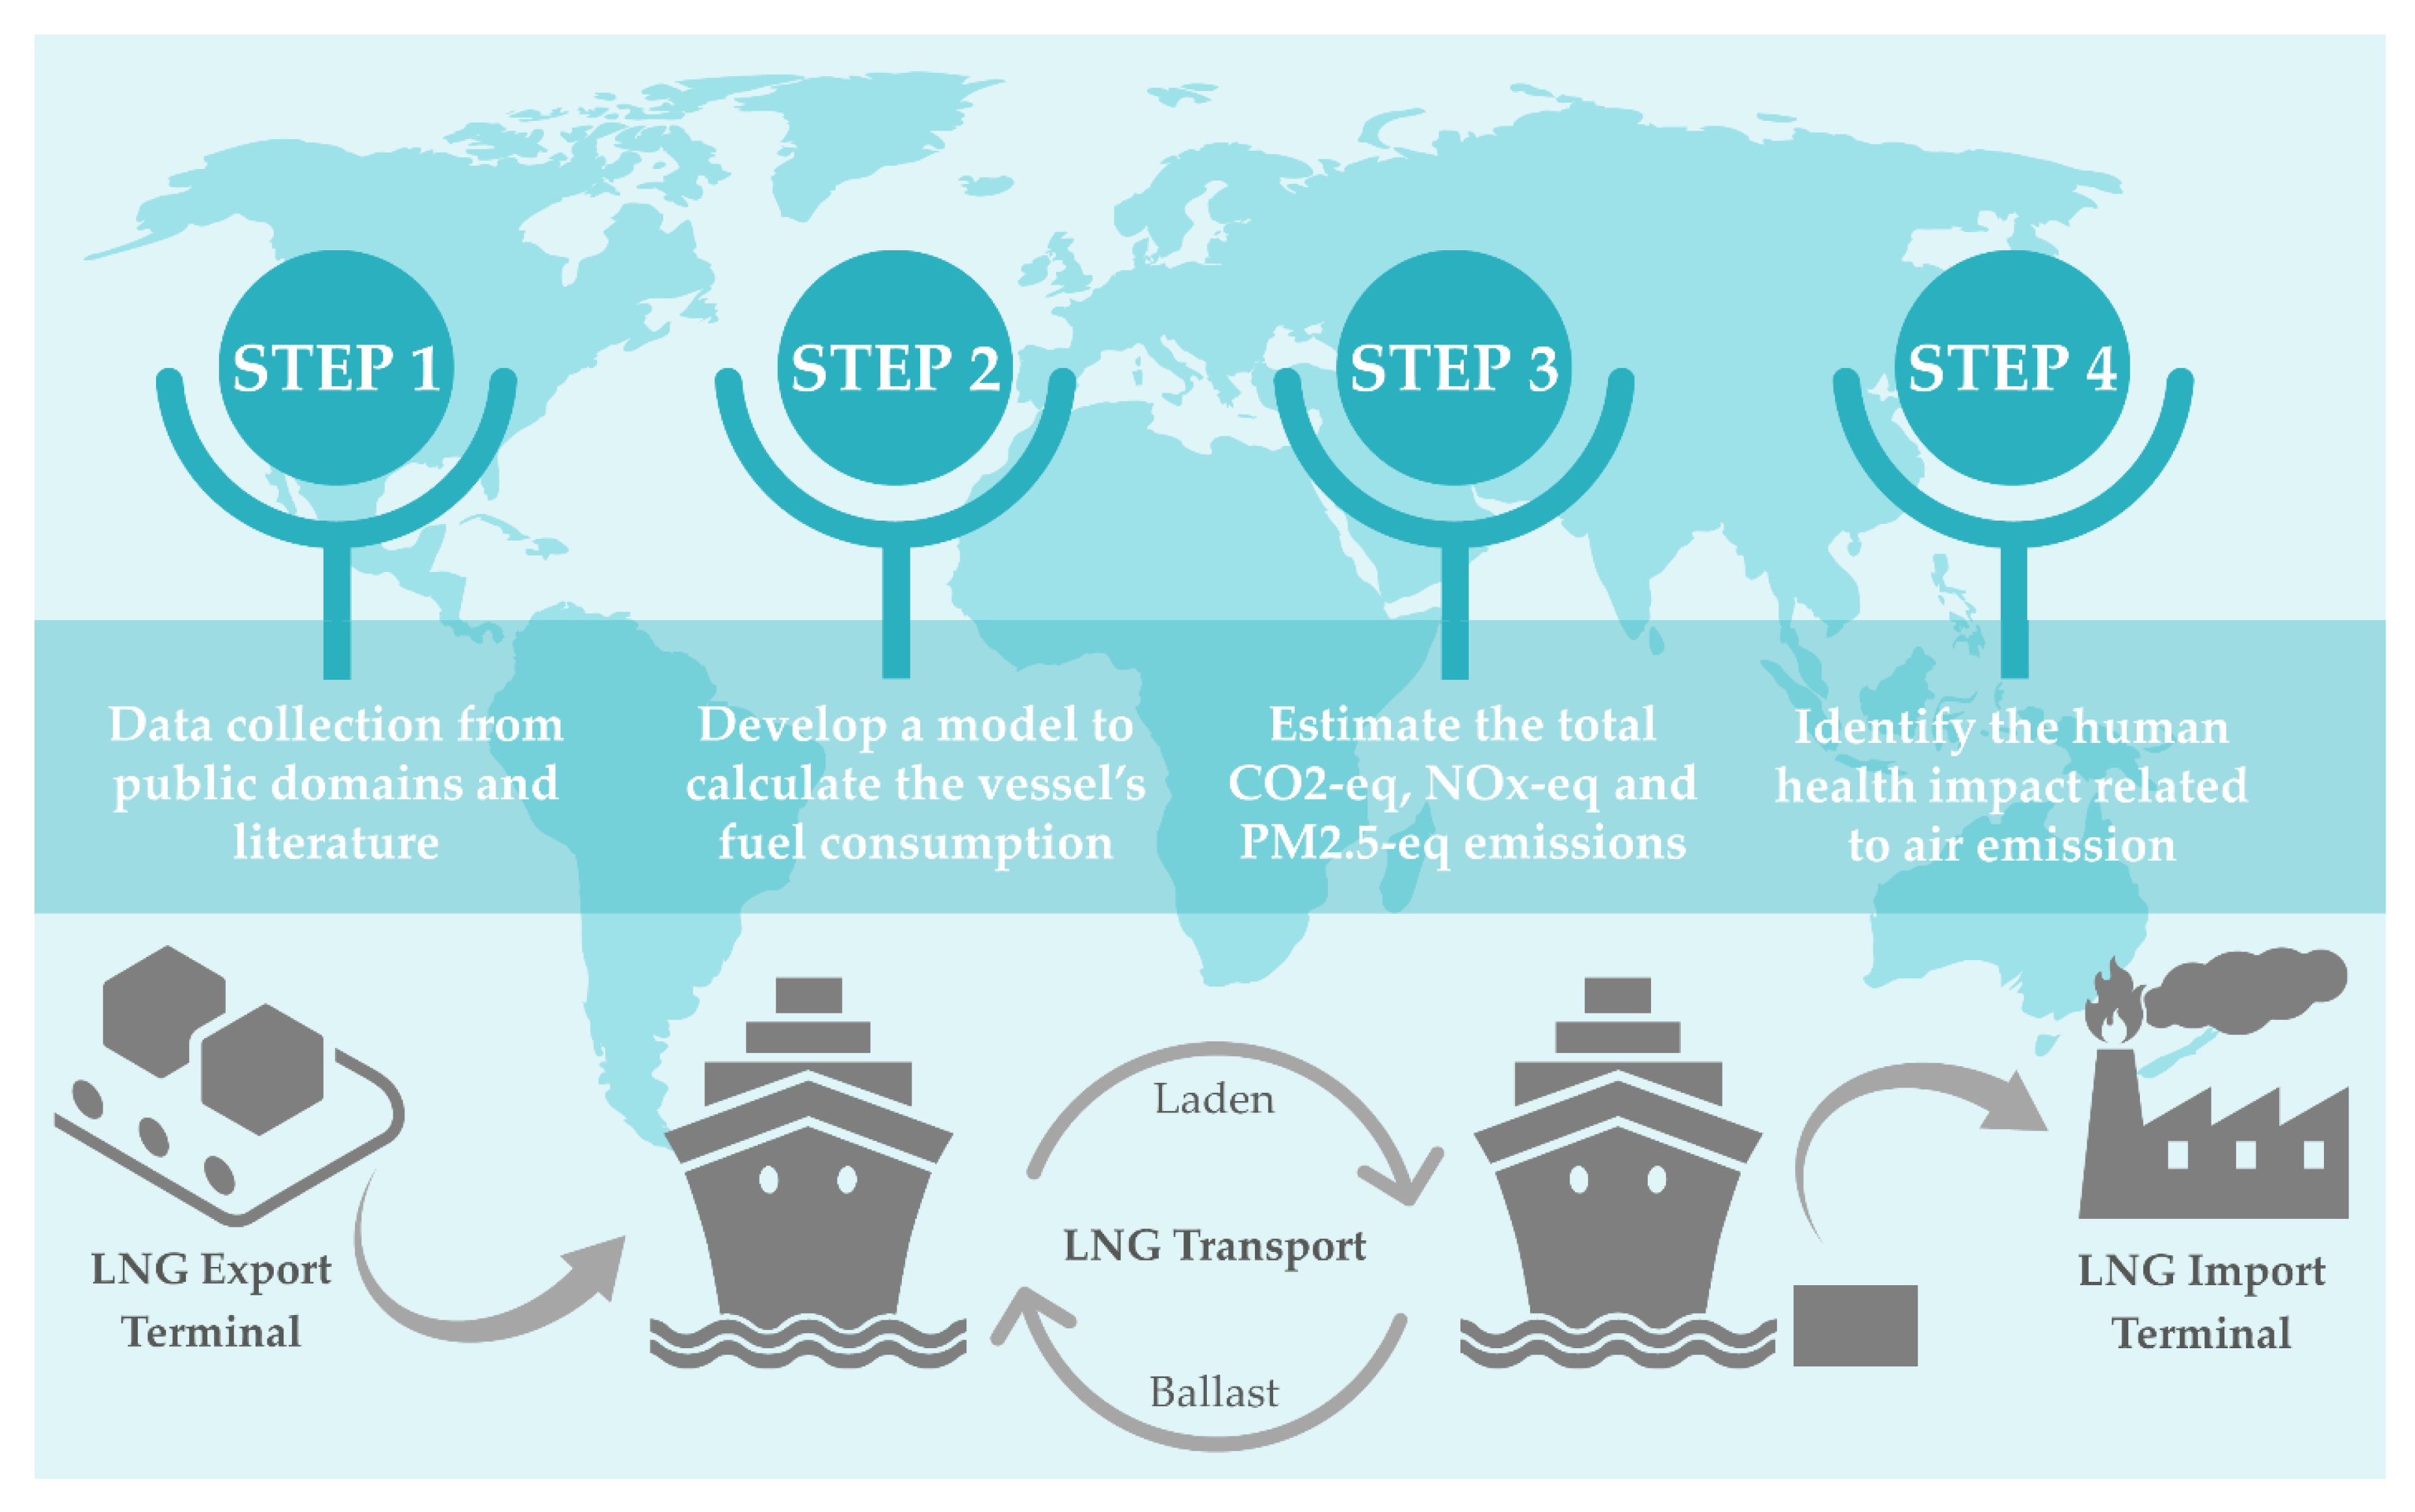
  • Presenting a framework for measuring the footprint of air pollution and human health from LNG manufacturing and maritime transportation.
  • Formulating and building a hybrid life cycle assessment (LCA) model combining both process-LCA and MRIO models.
  • Establishing a high accurate simulation model for the optimized LNG process using the Aspen HYSYS tool.
  • Proposing an accurate and effective human health impact accounting tool that various gas and oil process-related disciplines can use.
  • Implementing further analysis helps to identify critical parameters that influence the LNG process and shipping air pollution footprints.

1.4. Organization of the Research

A brief overview of the organization of this research is as follows. Section 2 of this research represents the literature review associated with the LNG process, LNG process chain, and LCA. The methodology followed in the research and the approaches taken into consideration are illustrated in Section 3. It transmits information from various air emissions studies as well as the equations utilized for the various LNG process and supply chain stages. It also contains details on how to use emission and characterization factors in the computation process. Section 4 reviews the research outcomes, calculated data, and observations in addition to the human health impact analysis. Section 5 summarizes the research conclusion and provides recommendations to the decision-makers. Moreover, it includes the constraints and related forthcoming suggested works.

2. Literature Review

2.1. Environmental LCA for Energy Production Sectors

The methods for quantifying the impacts of the LCA framework have become increasingly available and accessible over the last two decades [12]. Through this, the influence on many viewpoints is measured and quantified. Nonetheless, environmental impacts, on the other hand, are focused on—but are not restricted to—pollution, ecological footprint, energies, discharges, and so on [13,14]. Quantitative and qualitative evaluation direct decision-makers regarding any current or planned projects about critical environmental effects, mitigation strategies, and the way forward with regards to environmental protection [15]. A lot of researchers have investigated sustainability in LNG and the energy sector. For instance, Aberilla et al. [16] researched a synthetic integrated sustainability assessment to provide water and energy applications in isolated and remote constituencies.
On the other hand, Barnett [15] researched the environmental effects of liquefaction, regasification, and the shipping processes of LNG. Other researchers working in this field include Tamura et al. [17], who concentrated on carbon footprint emission among further atmospheric contaminants during the LNG production. The researchers studied these emissions during the period of an LNG delivery.
The process of LCA was used by Korre et al. [18], whose work pertained to using NG distribution in a similar manner as that which might be used to generate an alternative power source. Biswas et al. [19], in Western Australia, evaluated the carbon emissions generated in the supply and production of LNG. According to this review, the authors dealt with LNG release to Australian markets such as China. The carbon footprint of the emissions generated in the process of delivering the LNG is considerably lower than the amounts generated during all the other stages, such as separation and exploration. Jaramillo et al. [20] worked on the estimation of electricity production. Additionally, the research considered emissions of sulfur, nitrogen oxides, and greenhouse gases and the gas’ life cycle, particularly those coming from energy sources. The researchers created an air pollutants’ life cycle comparison from various energy sources that can help in reducing the weaknesses and benefits of absorbing fuel in the context of the global production of the use of NG to generate electrical power.
The research conducted by Raj et al. [21] is concentrated on the LCA of GHG and emissions expenditures related to the LNG trade between China and Canadian countries. Nevertheless, the prototype is not established on such strict traits as the chain’s subsystems. The research on the GHG life cycle and techno-economic were performed by Sapkota et al., who examined the supply chain of NG emissions from the Canadian production areas to the European countries’ receivers. Nevertheless, their estimation depended on ranges and estimates instead of the rigorous quantification of emissions generated by equipment and simulation quantification [22]. Regardless, their exploration never included the pretreatment of NG and other crucial processing elements. The optimization model is sufficient for robust and tolerable evaluation is very accessible in an open literature publication. The prototypes can be categorized into stochastic and deterministic manners. However, a lot of the tasks that aim to consider the supply chain of LNG emphasize shipping operations: cute algorithms, and the MIP branch, the optimization of mixed-integer linear programming (MILP), the method of optimization horizon heuristic MIP-rolling and mixed-integer programming (MIP) are the methods used here to accomplish specific goals such as voyage cost minimization or lost production, or LNG revenue maximization. Monte Carlo simulation, the optimization of MIP single objective, and stochastic MILP are the other studies of the LNG supply chain. However, they are only focused on the delivery and shipping procedures within a chain [23,24].
The cost projections of the air pollution in the outdoor environment are presented by the OECD [10]. This research focuses on the consequences to human health, incorporating both morbidity and mortality and also the agricultural sector. The economic repercussions and the welfare cost from suffering and the pain to premature deaths are assessed quantitatively. The other consequences, such as the health impacts, e.g., the immediate results of exposure to nitrogen dioxide (NO2) and biodiversity, cannot possibly be calculated simply because the available information is insufficient. On the other hand, indoor air pollution is also a reason for some premature deaths, and it should be clear that this article concentrates on air pollution taking place outdoors only.

2.2. Social LCA of Human Health Impact for Energy Sectors

The most severe factor increasing the risk of negative socio-environmental development is air pollution [25]. According to the most current Global Burden of Disease (GBD) study, the combination of outdoor and indoor air pollution was the reason for 5.5 million premature deaths globally the year 2013. Further consequences of air pollution on healthy human beings have notably led to cardiovascular and respiratory problems increasing in number [10]. Additionally, there is sufficient evidence to suggest that air contamination has a significant negative effect on people’s thoughts and moods, thereby lowering the level of happiness and elevating the danger to a person with depression. The classification of air pollutants can be either primary or secondary. The particulate matter (PM2.5 or PM10) is contained in primary pollutants: nitrogen oxides, the voltaic organic compound, carbon monoxides, arsenic, sulfur oxides, and specks of metals such as mercury, copper, and cadmium [26]. When considering secondary toxins, on the other end, these emerge in the atmosphere as an effect of chemical reactions, which differ between particular materials that incorporate ozone nitrogen oxides [27]. According to WHO reports, there is an overall death rate of 43% from air pollution pertaining to chronic obstructive infections of the human lungs: lung cancer, in comparison, had a rate of 29%, dental issues had a rate of 25%, stroke had a rate of 24%, and pulmonary disease had a rate of 17%. The impact of lowering the air quality in an environment is crucial, both in the developing states and in industrialized countries that have stable and reliable growth [27].
Other research included conducting an initial analysis of scenarios predictive of air pollution reduction and the related expenses in one of the Brazilian largest metropolises, Fortaleza city [28]. From 2015 to 2017, the analyzed pollutants were particulate matter ranging from PM2.5 and PM10 (μm). Contemplating the predictive methods, a short period of reduction in PM10 by an amount of 5 μg m−3 could avoid 130 people being hospitalized because of cardiorespiratory problems annually, and lowering it by 20 μg m−3 could lead to 410 people avoiding hospitalizations. In terms of finance, this is equal to MUSD 0.063 for a 5 μg m−3 reduction and MUSD 0.19 for a 20 μg m−3 reduction. The hospitalization of over 200 people has been avoided over an extended period due to a decrease of 5 μg m−3 in PM2.5. Additionally, over 580 hospitalizations would not have happened had there been a reduction of 10 μg m−3, which corresponds to MUSD 780.6 for 200 hospitalizations and MUSD 2239.9 for 580 hospitalizations.
For the last twenty years, China has had rapid economic growth, resulting in a proportional increase in atmospheric contamination, which affects both public health and the environment. As of 2013, NO, SO2, and CO2 levels in China have reached a degree that could result in a change of climate and have unfavorable effects on the residents’ health. This paper employed a new criterion to analyze China’s thirty-one main towns’ economic, health, and environmental efficiencies [29]. The outcome was as follows:
  • While all of the towns or cities were required to increase their gross domestic product (GDP), the efficiency of the environment was rising further in a lot of the cities.
  • The health efficiency directory implied that the illness efficiency had heightened in a lot of the cities but decreased in one-third of them. This finding means that it is essential to strengthen the efficiency of medication.
  • The efficiency of the treatment of respiratory disease in the majority of towns increased, and the chance for development reduced substantially.
  • The mortality rate improved in 15 towns; however, the medication effectiveness of the mortality rate decreased in 11 towns.
In terms of the scenario in the Netherland, a study portrayed heavy industrial emissions as dangerous air pollutants, and additional analysis on the effect on respiratory and lung function symptoms among schoolchildren has been conducted [30]. It was established that exposure to NOx and PM2.5 from industries is not linked with decreasing lung function Susceptibility to PM2.5 was related to the presence of a dry cough, according to parents’ reports about their youngsters’ health.
In conclusion, the basic fact is that exposure to particulate matter has negative health impacts [31]; according to the deep analysis given, policymakers should begin to deal with these implications so that more strict policies can be executed to decrease the health effects caused by air pollution. The researchers emphasized that creating beneficial air quality management is an essential measure to reduce danger to health to a minimal level.

2.3. LNG Process Chain

In this research, a flow block diagram of the LNG process chain is considered in Figure 1. The processing train of LNG is portioned into two different subsections: cold and hot [32]. The divisions are classified into NG obtained from wells, NG preseparation, sweetening, sulfur recovery unit (SRU) in the acid gas removal unit (AGRU), and dehydration units for the hot section and Natural Gas Liquids (NGL) fractionation and recovery, Helium Extraction (HeX), liquefaction, and Nitrogen Removal (NR) units, and the cold section loading terminals. Associated utilities and electrical power are required for both sections. After the process of liquefaction, the shipment of LNG to the importing terminal for it to be regasified takes place. The electrical power developed by employing the LNG gasified portion is the main terminal utility import.
The LNG technique includes a given number of units, and a brief explanation of the units is as follows: First, impurities and hydrocarbon are the elements present in NG. The liquids from NG divided at this phase must be transferred for recovery to a processing plant. The preseparation unit is where sour NG is passed through to remove water and condensate. Then, the divided sour NG goes into the sweetening unit, where undesired components such as H2S and CO2, known as acidic gases, benzene, toluene, xylene (BTX), and mercaptans, are removed. The steams of acid gas byproducts departing from the sweetening unit are routed into the SRUs to generate sulfur allotropes from H2S.
Similarly, the appearance of SOx is a result of the combustion of acid gas. Before the NG leaves the sweetening unit, it should be treated to remove dehydrated water, hence minimizing downstream corrosion and preventing the formation of hydrates. The function and recovery units of NGL are crucial because they help to recover leftover NG steam condensate, providing propane and ethane—the refrigerant make-up for the system liquefaction—when required, and generating standard LNG specifications. There are three conventional distillation sections of the primary fractionation unit to fraction the NGL into propane, butane-rich streams, ethane, and unwanted condensate. The propane precooled mixed refrigerant (C3MR) process of liquefaction and cooling is utilized with the considered chain. It entails compressing vapor in two cycles that subcool, condense, compress, and throttles the refrigerants, providing the necessary cooling primarily via the evaporation process. Once liquefaction is performed, the HP LNG passes via an integrated NR and HeX departments to regain the helium and meet the specifications of LNG, such as higher heating value (HHV) and nitrogen content. Later on, LNG is immediately loaded into their maritime transport carriers by using LNG loading arms or compiled in holding tanks. The carriers of LNG are generally categorized based on their boil-off gas (BOG) presence, propulsion systems and containment types, and capacity of reliquefication unit [33,34]. The currently importing facilities and regasification plants consist basically of the supporting utilities, LNG storing tanks, and the regasification unit. The terminals work either on LNG tanks’ holding mode or loading mode.
Up to this juncture, according to the studies on the energy sustainability valuation, it is clear that there have been few studies on adequate energy, and a lot of researchers have fastened on formulating models of sustainability assessment with scarce precedence on the environmental impacts of the introduced investigation. Additionally, the literature does not have an uncertain life cycle sustainability assessment of oriented pool chains and its foreign pool chains of LNG. Besides, the integration of the life cycle environmental, social, and economical ranged are still required for the LNG industry.

3. Research Method

The suggested method primarily utilizes the process-based LCA methodologies from the LNG maritime transportation emission quantification tool, MRIO analysis, and Aspen HYSYS (see Figure 2). The spectrum of this research will comprise LNG processing and its natural gas extraction, LNG receiving terminal regasification, and distribution.
Foremost, the MRIO modeling tool is useful in the life cycle designing simply because they entail Input-Output multinational data at the global and regional levels, indicating cash flow between economic sectors within a state through worldwide trade [35]. In this respect, the database EXIOBASE 3.41 is employed in the study, which is contemplated as the most comprehensive global database of MRIO used for the analysis of sustainability [36]. Secondly, the process-based life cycle inventory (LCI) of LNG process chains is developed entangled on the data provided within the literature and, more importantly, for the procedure specification and parameter. The simulation and development of the LNG plant are built based on the information sourced, and the required data is also available to the associated resources and utilities. This information is primarily the impacts on the environment, which are viewed as the center of human health effects as well as the consumed electricity. Thirdly, the LNG air emissions information related to maritime transport is approximated by utilizing the model formulated by Aseel et al. [37] for computing the human health effect and air emissions under uncertainty. The Fourth point is the process-based LCA model incorporated with LNG maritime transport criteria and a high-resolution MRIO chart to create a hybrid LCA model for air pollutants and human health impact. The ReCiPe 2016 is used in endpoint effect quantification by using the description factors. Finally, the hybrid life cycle examination criterion is processed under further macro analysis. This research is essential for dealing with data quality issues, treating the skepticisms within the MRIO model, and output and input data index of the human health and air emission LCA model.

3.1. Scope and LCI Data

This research aims to create a hybrid LCA model to determine the LNG process chains’ on-site, downstream, and upstream life cycle effects holistically. Here, Qatar will be the case of study. To understand this objective, first, the system functional and boundary unit of the estimation was identified as the LNG process chain domain demonstrated before. It entails loading and transportation, gas processing and extraction, LNG storage and liquefaction, LNG storage in acquiring terminals, gas utilities, and regasification. Secondly, the sustainability indicators to be acknowledged, indicating the socio-environmental, are described briefly in Table 1—life cycle indicators of LNG LCA research.
Thirdly, the environmental inventory life cycle data associated with each unit’s processes for each life cycle phase will be collected. The information will be obtained from several sources such as LNG maritime transport tool, Aspen HYSYS, and MRIO database. The ReCiPe 2016 tool will then be used to measure the end-time implications on human health. Lastly, One Million Tons of LNG Production will be the definition of the functional unit.

3.2. MRIO Analysis

The Input-Output criterion is considered an essential component of the industrial ecology toolbox applying the LCA studies [38]. Jeswani et al. [39] emphasize the importance of Input-Output analysis incorporating with LCA to develop a hybrid model with the ability to depict the influences of LCA inter-and intra-sectoral events. When operating with sophisticated systems such as LNG supply chains, IO-established LCA models can be precious to assist the process-based criterion. The unique contribution is according to the comprehensive economic analysis given by the database enclosing the duties of trade-based economic exchanges between different sectors [40].
In this context, Input-Output primarily based LCA models offer a top-down analysis victimization financial dealing matrix between sectors of the economy, considering advanced interactions between the sectors of one country. Though single-region IO models are widely utilized in earlier research papers [41,42], MRIO models are thought-about because they advanced within the analysis of the triple bottom line (TBL) impacts of consumption and production at a worldwide scale [43,44]. Of late, there are various world multiregional databases developed for the environmental footprint analysis of production, such as the World Input-Output data (WIOD), spatial association information and Input-Output tools for Policy Analysis (EXIOPOL), world Resource Accounting Model (GRAM), world Trade Analysis Project (GTAP) and Eora [45]. Many studies used these MRIO databases and centered on the environmental footprint of consumption [46], producing [47,48], trade [49], and nations [50]. EXIOBASE 3.41 is a more preferred choice than the traditional EIO-LCA model. That is because of the enhancements provided over the 2015 model compared with the 2007 model by Carnegie Mellon University’s EIO-LCA. Additional explanation, in this concern, is the CMU’s EIO-LCA that entails insufficient data towards environmental effects such as consumption of energy and GHG. The conventional air contaminant emissions are utilized to approximate the life cycle environmental consequence of consumption or production actions [51]. The EXIOBASE 3.41 is a global high-resolution MRIO database that covers 90% of the world’s economy. It gives the most updated data, including material satellite and socio-economic accounts, in summation of all that EIO-LCA provides for the year 2015 database [36]. Therefore, the EIO-LCA model is not suited for the LCA. The development of a sustainability assessment of a multiregional life cycle framework employing the most comprehensive EXIOBASE 3.41 database is considered innovative and unique for the LNG sector.
Within the universal MRIO databases, this study will utilize the EXIOBASE 3.41. This database is the most comprehensive MRIO database that apprehends all indirect and direct results at a global and regional scale discerning 43 nations, 5 national regions, entailing the Middle East, and 163 sectors [52,53]. However, the MRIO mentioned above database is not sufficiently integrated for a global life cycle sustainability analysis of energy production sectors and energy policymaking in many regions worldwide. A review of MRIO studies also stressed that the energy sector sustainability impacts must be evaluated with the TBL metric, including the whole world and revealing as several countries and sectors as possible [54].
The main steps of midpoint air emissions calculation using the MRIO database are illustrated in Figure 3.
From the MRIO table for NG extraction and processing, the parameter factors relevant to this work are: CO2, CH4, N2O, NH3, PM2.5, SOx, and NOx (SOx and NOx are considered as SO2 and NO2, respectively). The factors are considered in units of kg emissions per million euros as an annual expenditure. To calculate the yearly emissions, the annual investment of NG extraction and process shall be estimated per million Euros. In the literature, the cost associated with NG extraction is USD 4 per MMBTU NG [55]. Unit conversion has been used as per [56] to convert the NG to LNG factors. To calculate the price of each ton of LNG in Euros, the following Equations (1) and (2), have been followed:
U n i t   C o s t N a t u r a l   g a s   e x t r a c t i o n = C o s t   p e r   M M B T U   n a t u r a l   g a s × c o n v e r s i o n   f a c t o r
U n i t   C o s t N a t u r a l   g a s   e x t r a c t i o n = 4.0   U S D M M B T U   n a t u r a l   g a s × E U R O 1.21   U S D × 1 × 10 6   M M B T U T r i B T U   n a t u r a l   g a s × 0.021   T r i B T U   n a t u r a l   g a s 1000   t o n   L N G = 0.0694 U S D T o n   L N G   P r o d u c e d
A n n u a l   C o s t N a t u r a l   g a s   e x t r a c t i o n = A n n u a l   L N G   P r o d u c t i o n × U n i t   C o s t
A n n u a l   C o s t N a t u r a l   g a s   e x t r a c t i o n = 126 × 10 6   T o n   L N G × 0.0694   E U R O T o n   L N G   P r o d u c e d = 8.75   M   E U R O
To calculate the annual emissions, each MRIO emission factor is multiplied by the annual cost of NG extraction, as per Equation (3).
A n n u a l   E m i s s i o n m i d p o i n t = A n n u a l   C o s t × M R I O   E m i s s i o n   F a c t o r

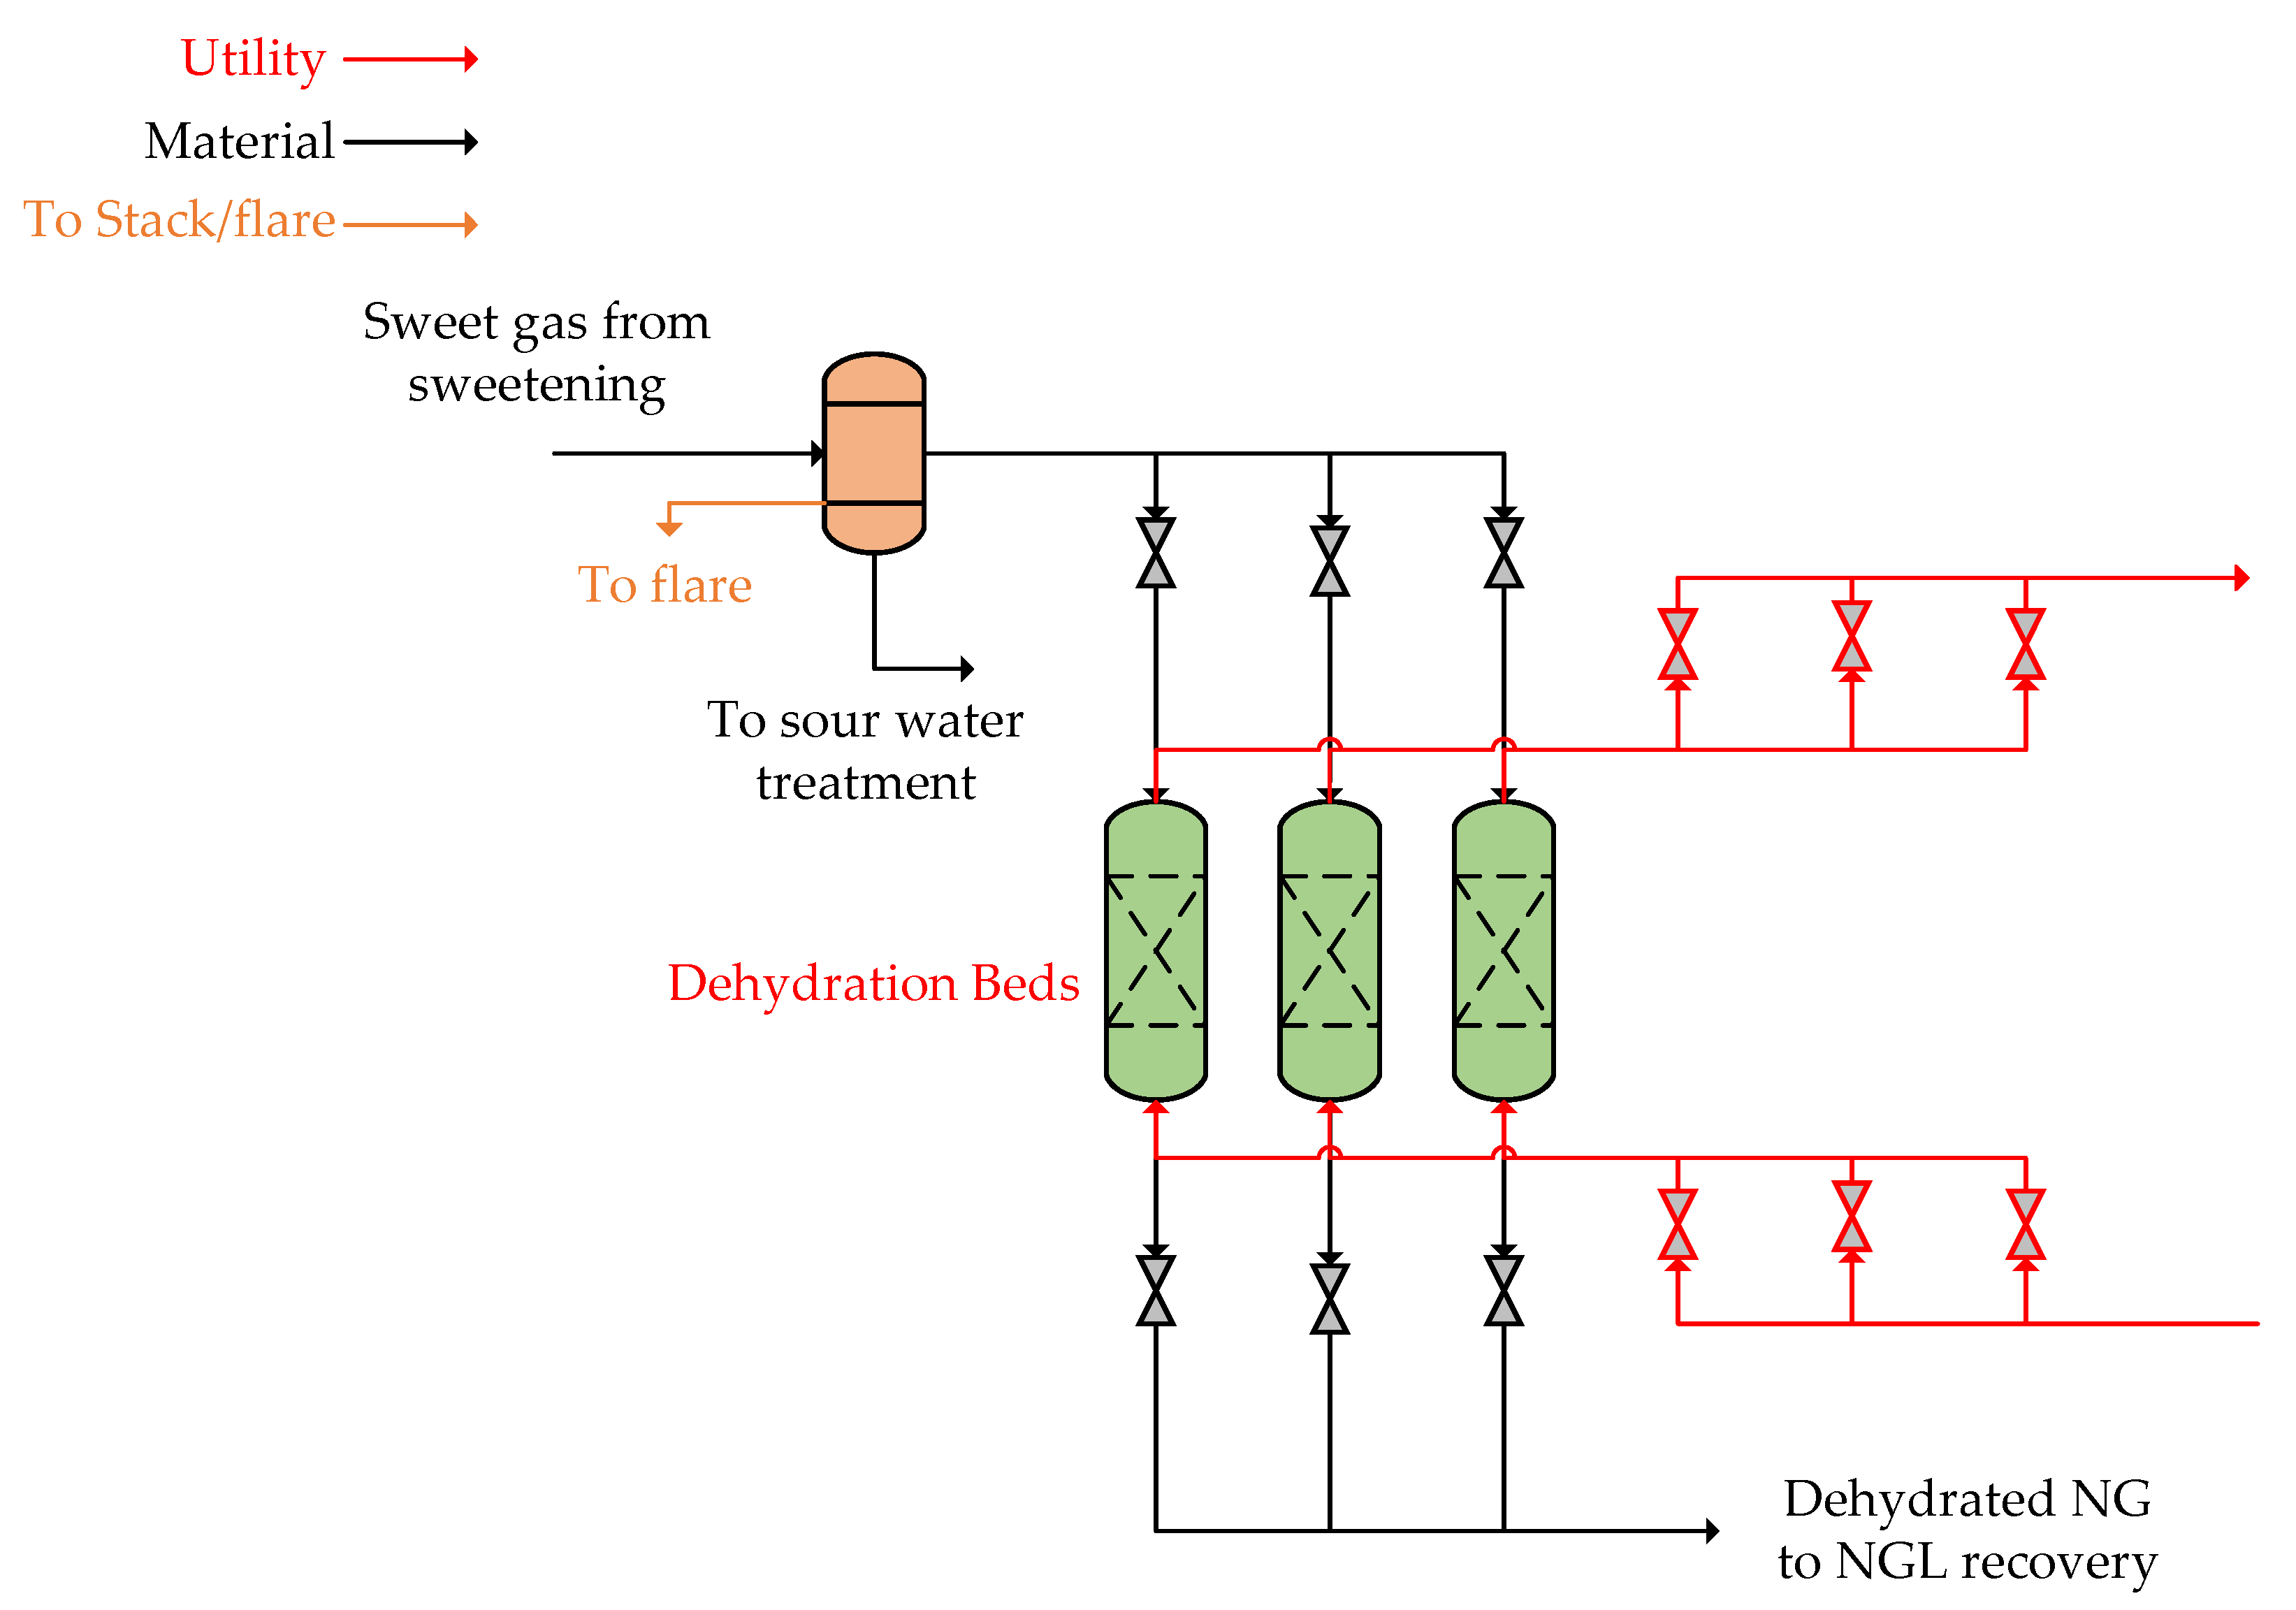
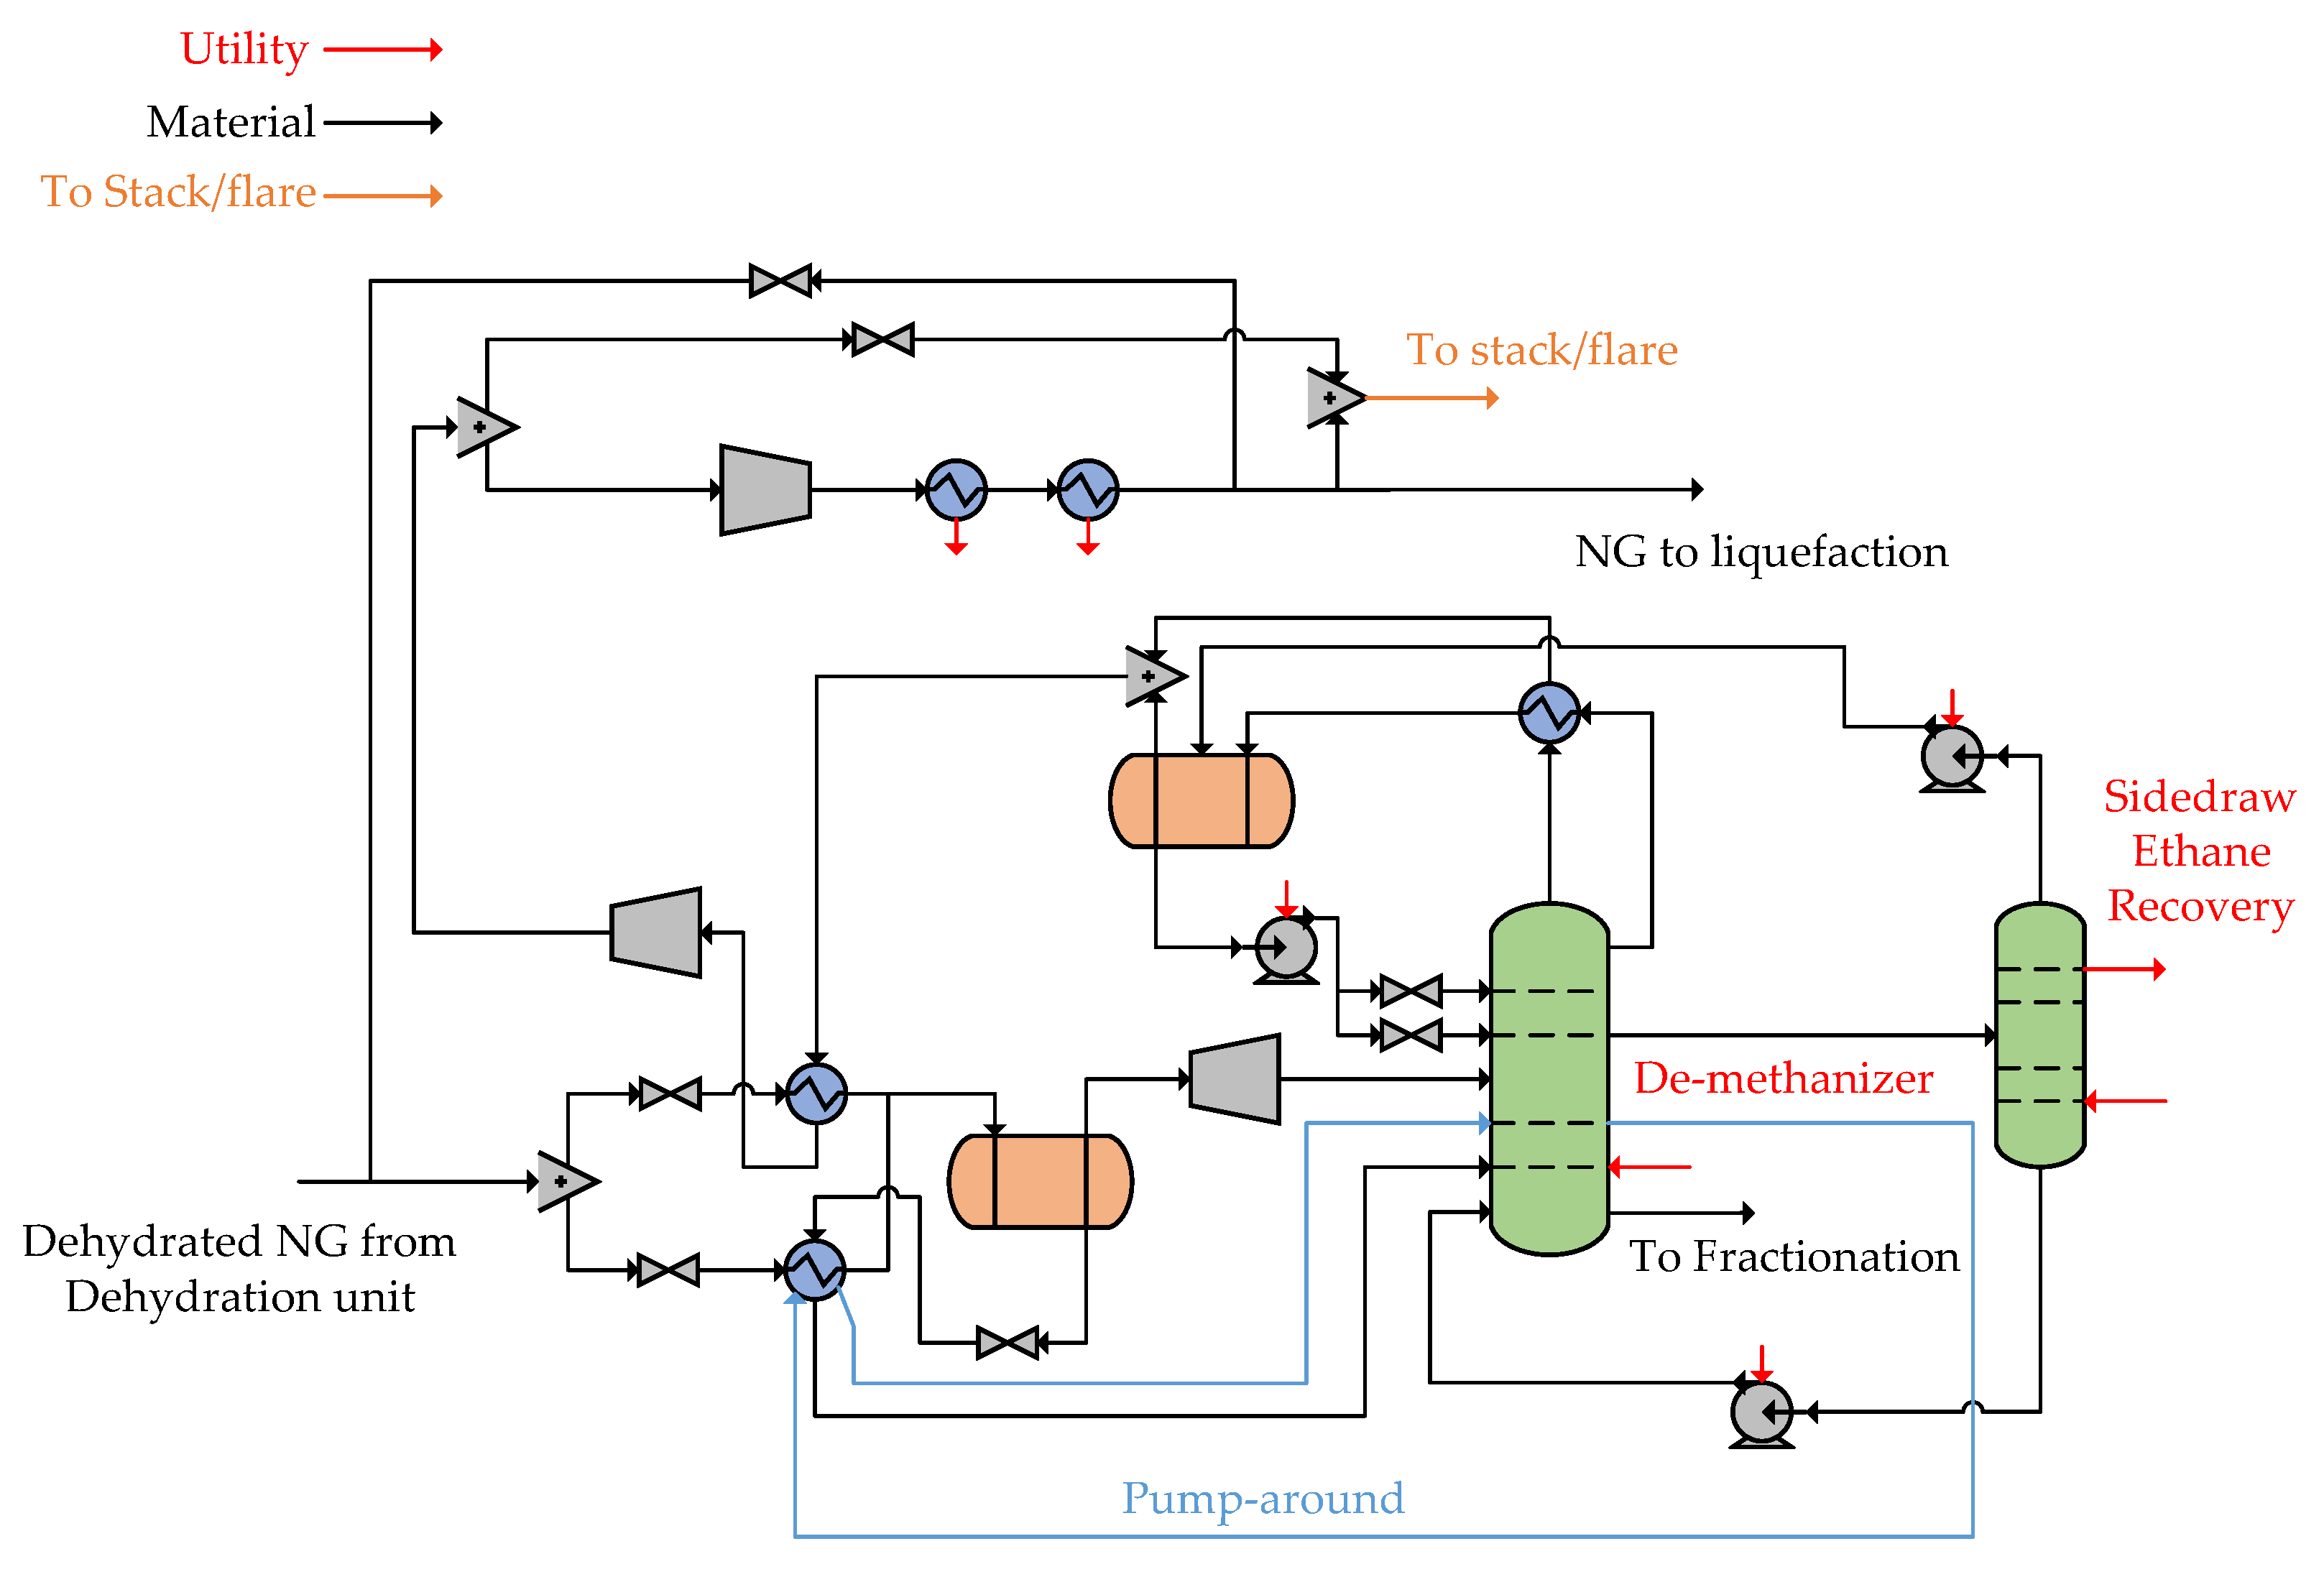
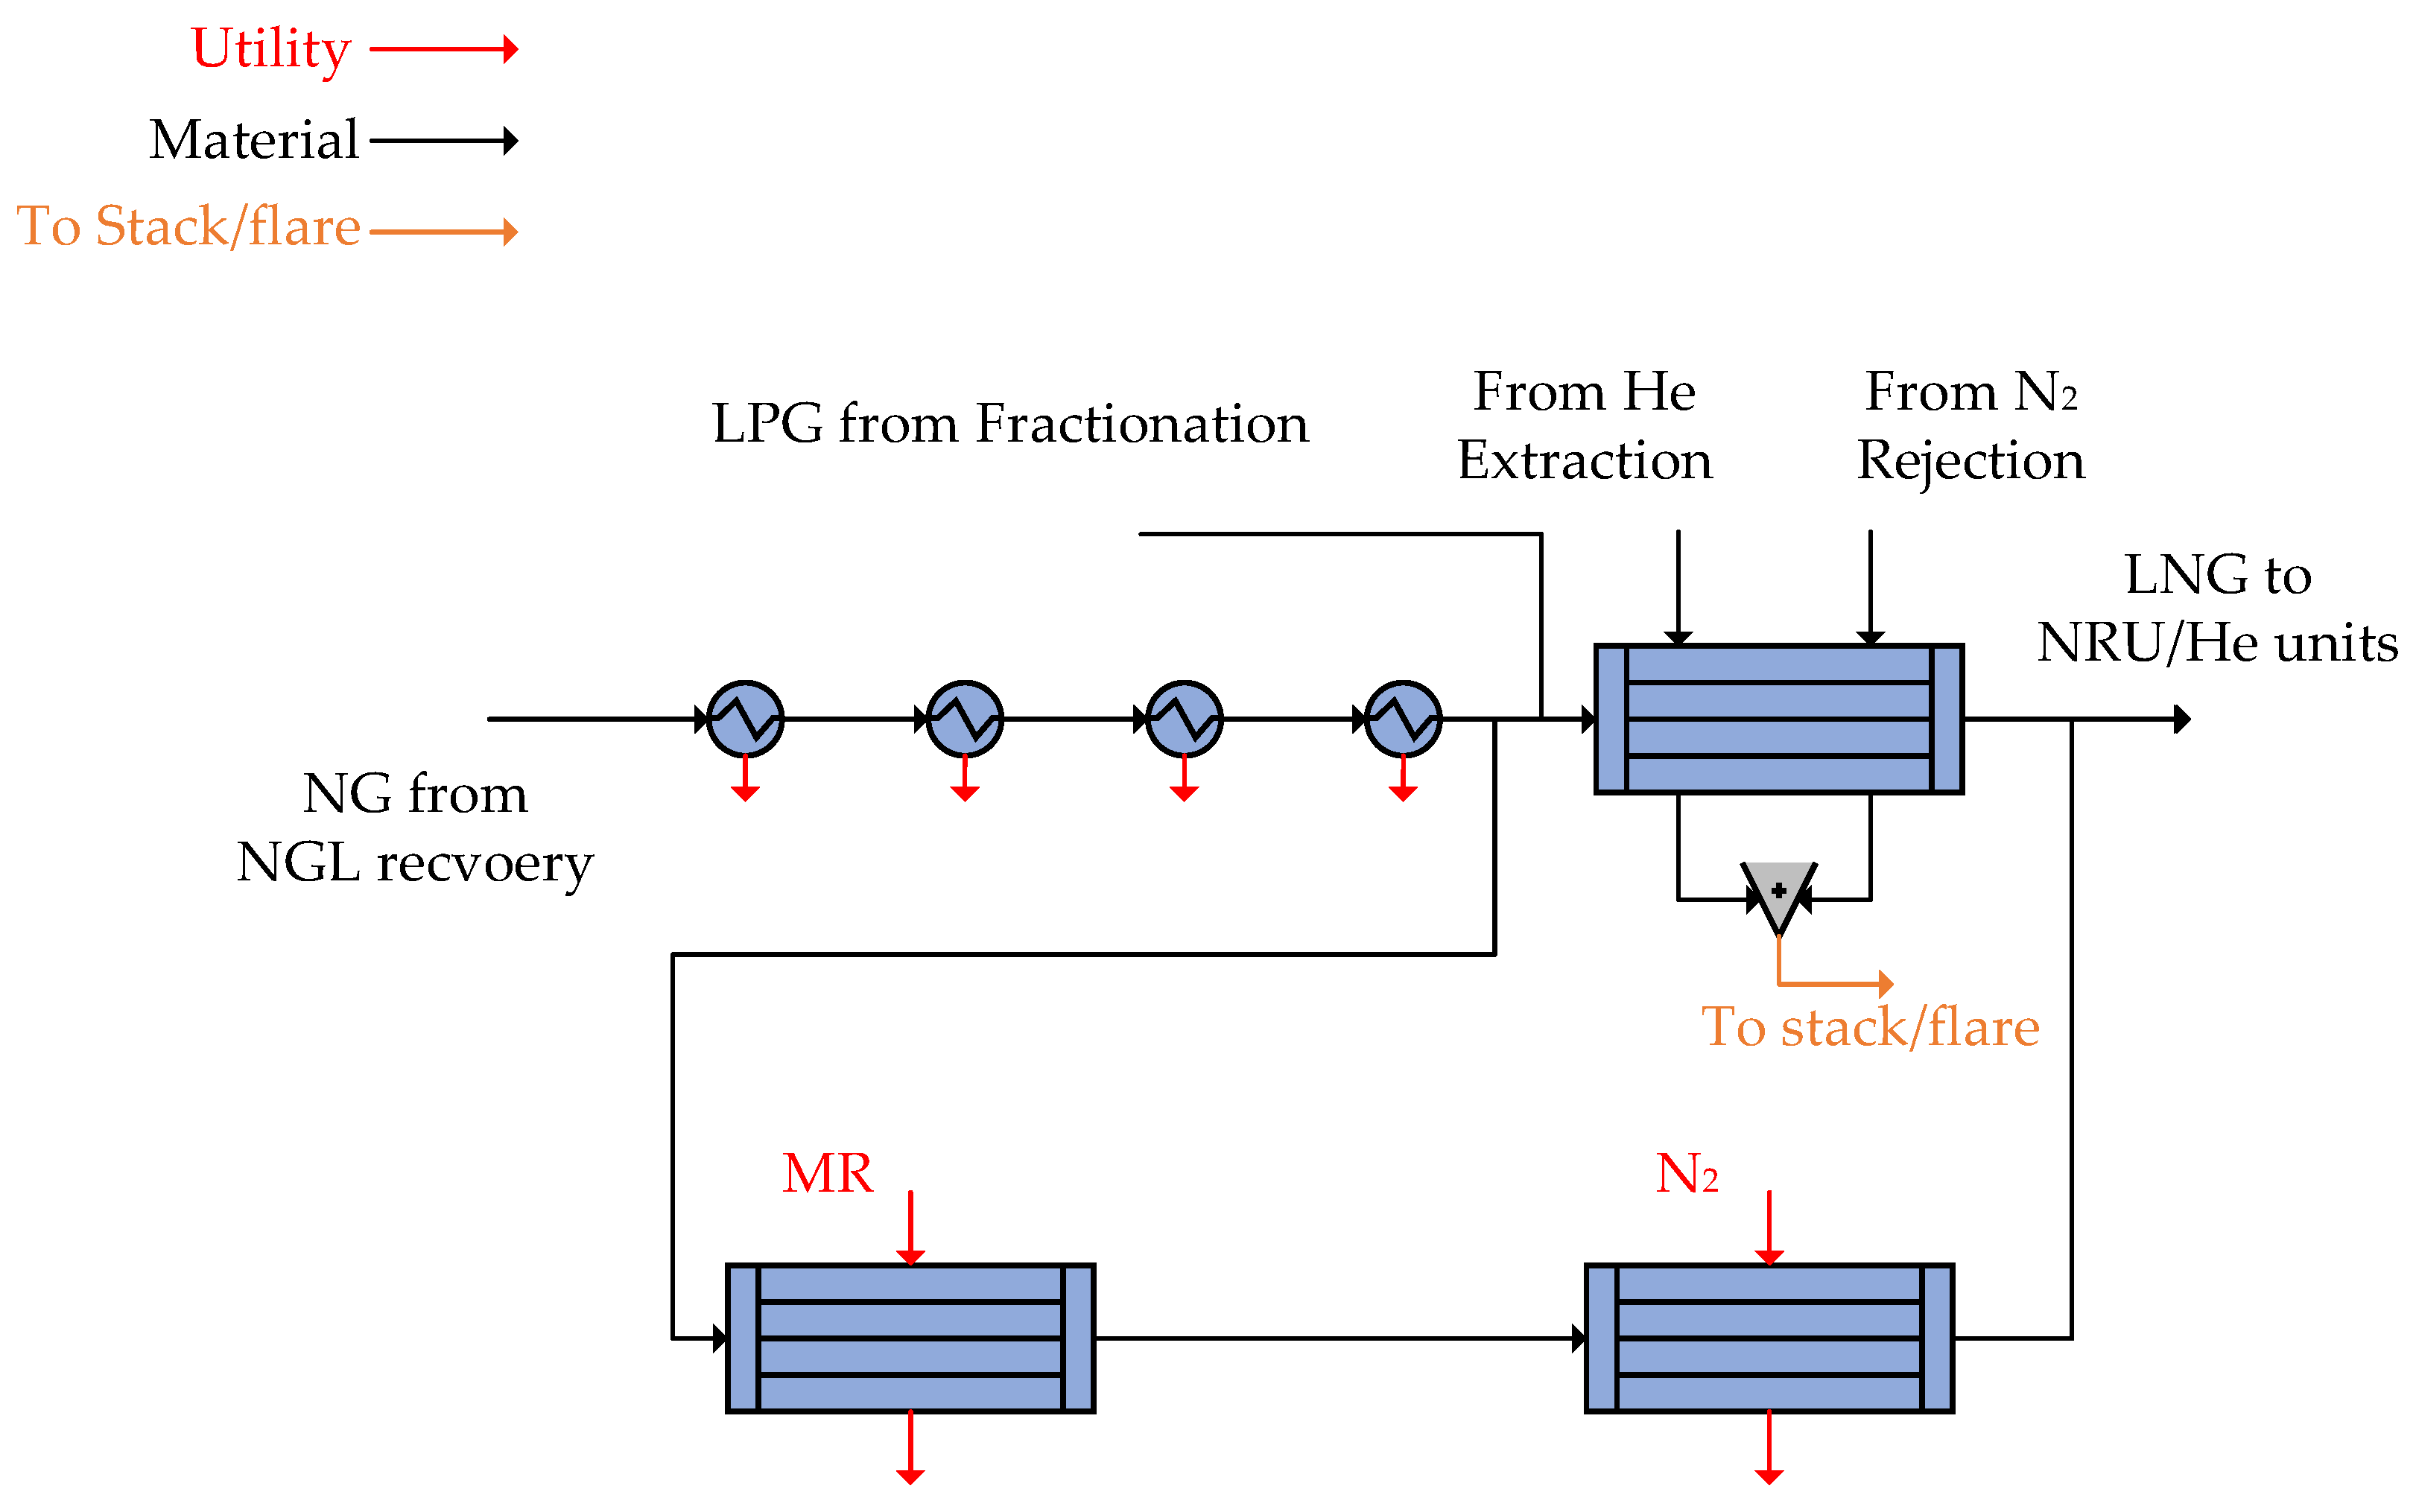
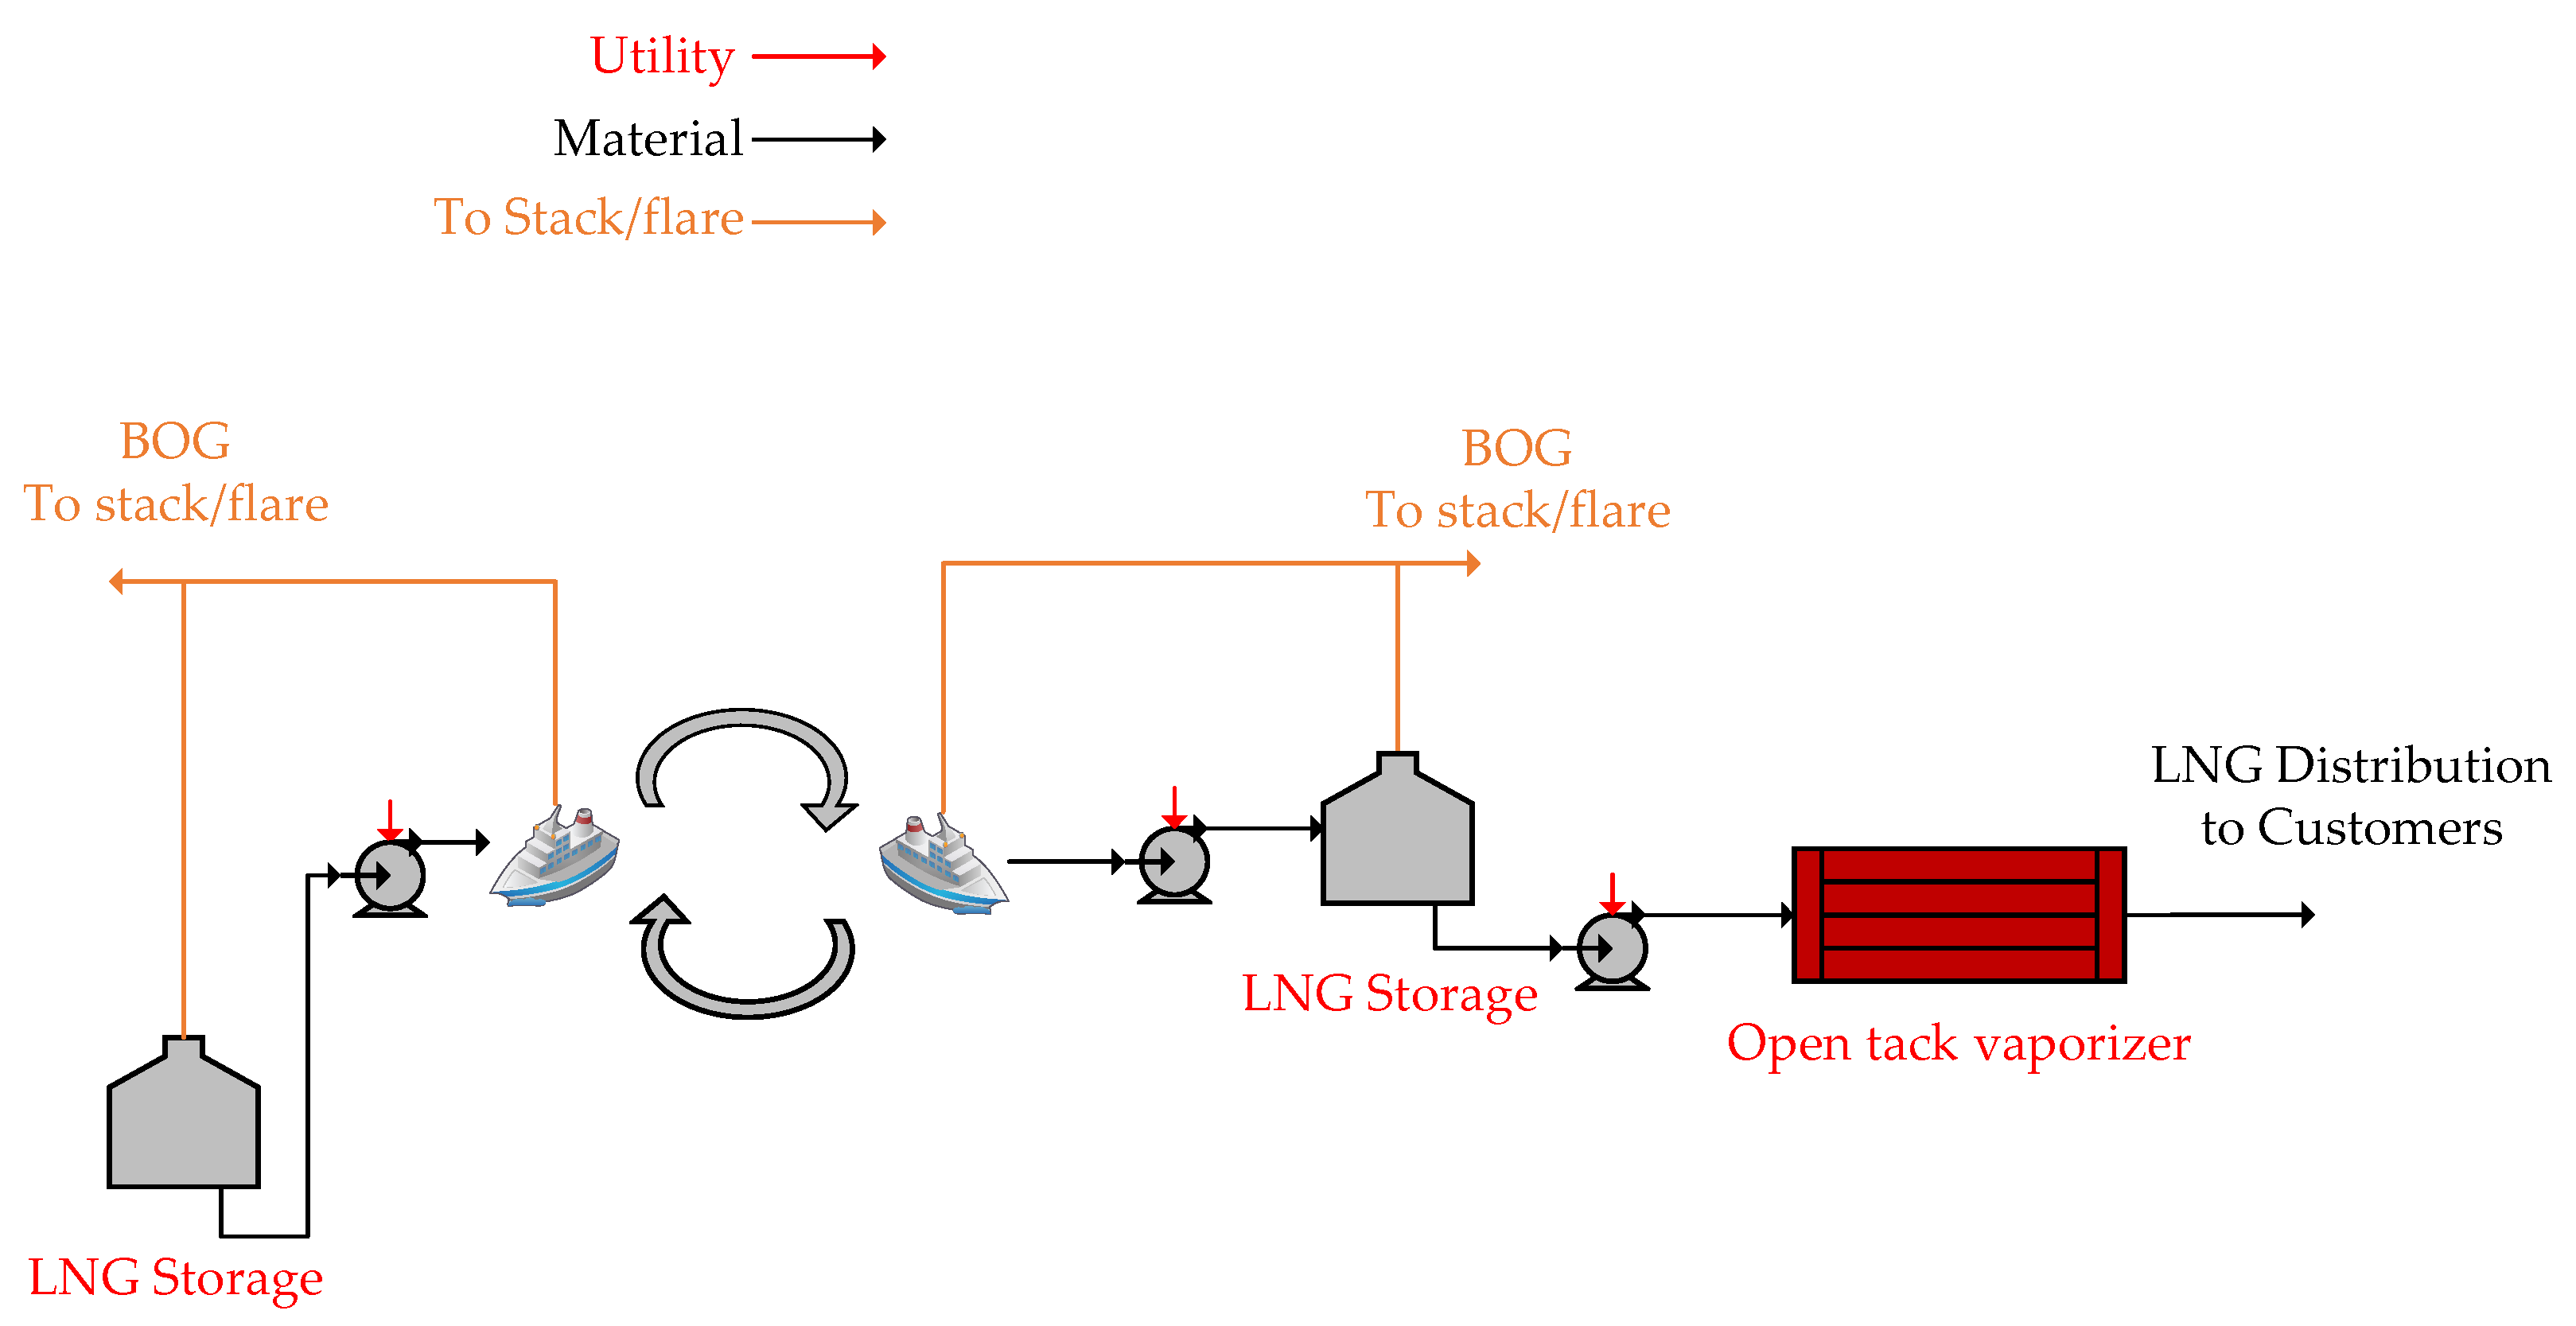
3.3. Aspen HYSYS Model

This model is a simulation program that is widely used within the energy industry. The optimization process is the primary purpose of this software; it involves the downstream, upstream, and midstream processes. The flow process for many industrial operations might include hydrocarbon processes, gas flue enumeration for emissions reporting, wastewater treatment (among other operations), process performance troubleshooting and monitoring. The simulation tool utilized here is promising and has already been in use for over 35 years [57].
In this research, the stages starting from the preseparation unit until the regasification unit in the receiving terminals are simulated in the Aspen HYSYS chemical process simulator—except for the transportation stage. Two subsections of the LNG transformation train are considered; hot and cold. The hot section operates above ambient temperature and includes the NG preseparation, sweetening, SRU, and dehydration sections. On the other hand, the cold part comprises the recovery and fractionation of NGL, nitrogen/mixed-refrigerant coolant cycle liquefaction, HeX, the NR facilities, and the export terminal. Cooling, heating, power, and shaft work supplies are required for the hot and cold portions. Most are produced and delivered via the plant’s utility area, fueled by hot and cold waste hydrocarbons. The LNG is sent to the exporting terminals after liquefaction, where it is shipped to the end-users. The receiving terminal at the end-user’s side takes care of regasifying the LNG by heating for future customer distribution. Approximately 126 MMTPA of LNG were provided for end-users during tank holding mode, with an 18,146 MMSCFD NG feed based on a simulation for the whole LNG chain. The NG feed terms and product specifications are listed in Table 2.
The rough feed acid NG on the LNG train passes first via the condensate and water preseparation section. For the simulation technique and the Process Flow Diagram (PFD), see Figure 4. The principal limitation of this method is the Reid Vapor Pressure condensate product (RVP). The reboiler duty of C1 was thus changed in the simulation, producing 9.4 psi of RVP condensate. The model shows that about 336,000 standard barrels of stabilized condensate (kS-bbl/day) are generated from the specified NG feed, which is equal to approximately 90.8 percent of feed pentane plus recovery. The rest of the conditions specific to the preseparation unit are illustrated in Table 3.
The separated sour NG is placed in the sweetening unit after the preseparation section to extract undesired acid gases (CO2 and H2S), mercaptans, and BTX and send them to the SRU and Tail Gas Treatment (TGT) sections. Figure 5 and Figure 6 demonstrate the flowsheets of the sweetening and SRU/TGT units with the simulation technique. Methyl diethanolamine (MDEA) was utilized in this study to eliminate NG acid gasses on the basis of a reaction separation model. All the reactions, aside from the kinetically constrained CO2, were considered to be in equilibrium. Sulfur allotropes are produced by SRUs by the acid gas byproduct from the sweetening unit. The SRUs employ the Claus process, which consists of both the thermal and the catalytic parts. The first phase consists of the heat recovery system for steam production and the reaction chamber. In this step, the oxidation of part of the H2S input produces sulfur allotropes and SO2. The use of a downstream TGT unit is one technique used to reduce excess SOx generation from the SRUs. The SRU scheme follows the acid gas removal unit with a two stage Claus process and TGT unit [58]. The conditions and specifications illustrated in Table 4 and Table 5 demonstrate 99.61% removal of CO2 and 99.97% removal of SRU from the sour NG, respectively. The acid gas from the first regenerator rich in CO2 is sent directly to the TGT unit, whereas the acid gas from the first regenerator rich in H2S is sent to the SRU unit to convert it into elemental sulfur.
To avoid downstream corrosion and hydrate creation, which can clog pipes and heat exchanger passes, NG exiting the sweetening unit should be treated to remove water (dehydration). Figure 7 shows the simulated dehydration unit’s PFD with three molecular sieve adsorbers. If water has saturated an adsorber, the NG feed must be regenerated into a new adsorber where in, principle, two of the beds are in use, and one is in regeneration mode. The conditions and specifications illustrated in Table 6 demonstrate 100% dehydration of the sweet NG.
Dehydrated NG enters the NGL recovery unit after pretreatment. This unit contributes to the regeneration of the residual condensate of the NG stream, provides the ethane/propane cooling makeup, and facilitates the production of necessary LNG specifications for the liquefaction system. As seen in Figure 8, a scrub column for feed precooling and reflux generation is installed in the NGL recovery unit for the chain under examination. This compresses, condenses, subcools, and throbs refrigerant compression over two vapor compression cycles, such that coolers are provided mainly through evaporation. Low-pressure mixed refrigeration (MRs) is given for cooling and liquefaction in the primary cryogenic heat exchanger (MCHE), as indicated in Figure 9. The NG is emitted from the NGL recovery unit at 36 °C and 67 bar, as illustrated in Table 7, and is then cooled to −148.4 °C and 43 bar, as illustrated in Table 8.
After the liquefaction process, the LNG transfers to the helium and nitrogen recovery through the integrated HeX and NR units. As illustrated in Figure 10, a self-refrigeration flash mechanism separates helium from the chain. On the other hand, nitrogen is rejected using a column with a stripper produced by a cold built-in reboiler. Some light hydrocarbons are found in the rejected nitrogen; thus, they are used as fuel. The final LNG project is stored at −161.6 °C and 1.2 bar, as indicated in the unit conditions and specifications in Table 9.
The fractionating unit consists mainly of three conventional distilling columns. One of them is the de-ethanizing column (C-21), one is the de-propanizer (C-22), and the other is the de-butanizer (C-23), as indicated by Figure 11. The conditions and specifications of this unit are illustrated in Table 10. The liquefied petroleum gas (LPG) is sent back to liquefaction to be mixed with LNG.
As indicated in Figure 12, after entry into the tank, the LNG pressure is lowered and the storage temperature is set to around −161 °C. The high LNG pressure in the storage tank, heat leaks, the cooling of pipes via part of the LNG, and the displacement of steam filling the vapor space were detected as sources of BOG. The terminals in receipt of LNG mainly contain LNG storage, regasification, and support utilities. The conditions specific to the simulated regasification plant are illustrated in Table 11.
Some assumptions and constraints in the LNG process were considered in this simulation to comply with the environmental protection requirements, minimize ecological pollution and apply the best operational practices:
  • LNG process simulation while plant normal operations only.
  • Minimum flaring is anticipated.
  • BOG flaring while holding and loading modes is reliquefied and reused to the maximum extent.
  • Seawater cooling water intake and outfall differential temperature are assumed to be within 3 °C for heating/cooling purposes.
  • Point sources stack emissions shall not exceed the limits set by the authorities.
  • Zero liquid discharges of treated industrial water to the sea.
  • LNG product holding mode was assumed in this research. However, another assumption is that all LNG products are loaded and distributed to customers throughout the year by LNG carriers.

3.4. LNG Maritime Transport Emission Quantification Tool

LNG product transport is a significant stage for the LNG trading supply chain and contributes to the LNG industry’s overall life cycle. The LNG maritime transport emission quantification tool has been developed by Aseel et al. [37]. The tool included the data collection process, assumptions, tools to estimate the energy used, and emissions calculations as midpoint impact. The proposed mechanism is used in the research to qualify the midpoint air emissions impact of LNG supply by Qatar to the UK as a case study. The method set for the tool is to calculate the GHG and other emissions based on the estimation of the fuel consumed and to calculate the primary pollutants by using the emission factors.
Calculating the emissions begins with collecting the essential information and outlining the assumptions to determine the emission value for each vessel. The information-gathering stage consisted of many data required as input to the tool, such as—but not limited to—marine route distance between exporter and importer, days of duration of each operation, types of carrier, carrier maximum loading capacity in line with the International Maritime Organization (IMO) requirements, fuel types per carrier, carrier’s engine, and BOG operations during the Laden and Ballast operations.
Following the fuel consumption estimation per carrier and deciding the fuel category, the subsequent phase uses the relevant emissions factors to convert the total energy combusted into midpoint emissions. The emission factors used in the proposed tool are those that were published by Cooper and Gustafsson [59]. Equation (4) presents the means of calculation considered:
L N G   T r a n s p o r t   E m i s s i o n m i d p o i n t = F u e l   c o n s u m p t i o n × E m i s s i o n   f a c t o r
Figure 13 explains the four life cycle air emissions steps using the LNG maritime transport emission quantification tool.

3.5. Hybrid Life Cycle Air Emission Assessment Model

LCA is an extensively recognized methodology used to estimate the air emissions and human health impacts of products or processes [60]. This research has three core methodologies for conducting LCA in the LNG industry and supply chain: MRIO-LCA, process-based (P-LCA), and LNG Transport-LCA. The MRIOLCA method can capture environmental impacts and emissions for the entire supply chain and eliminate cutoff errors. Additionally, the MRIO-LCA method can only provide typical processes [61], and NG extraction and exploration are well addressed and combined. However, the MRIOLCA method also introduces uncertainties anticipated from the aggregation of sectors indicative of the manufactured goods or activities analyzed [62].
On the other hand, the P-LCA method utilizes the resources and power information for each LNG process stage designed in the LNG industry for product manufacturing. Direct emissions and energy used are the main results from the P-LCA, which are then adequately inventoried and analyzed. Aspen HYSYS is a valuable tool used by chemical engineers to achieve the level of detail desired for this research. Furthermore, LNG maritime transport emission quantification and human health impact estimation tools have been utilized to estimate the energy used, to calculate emissions, and to estimate endpoint human health impact. This tool is set to calculate LNG maritime transport-related emissions and then convert them into human health impact based on the characterization factors set by the ReCiPe 2016 tool.
This research’s approach combines the MRIO-LCA, P-LCA, and LNG Transport-LCA, known as hybrid LCA air emissions, and the human health impact approach. Various hybrid models including MRIO have been used in the manufacturing of many products. However, no study has been found with a hybrid MRIO tool related to LNG product manufacturing and its supply chain.

3.6. Midpoint and Endpoint Human Health Impact with RECIPE

The determination of both the midpoint and the endpoint of human health are crucial. The endpoint analysis simply presents the final effect on human health due to the midpoint environmental footprint. Other endpoint effects could be related to ecosystem quality and resource depletion. However, the research focuses only on the social and human health impacts relevant to the LNG trade. Transferring midpoint results to endpoint results gives researchers a better ability to interpret the exact large number of impacts using endpoint methods that do not necessitate massive expertise regarding environmental consequences. In this research, the calculated air emissions footprints accounting for LNG trade include the NG extraction, LNG process, LNG product storage option, LNG maritime shipping, and end with regasification at the receiving terminal. The main calculation estimates the equivalence of the global potential of CO2, NOx and PM2.5 in relation to human health.
Generally, the approximate consequence of a substance on human health is calculated by multiplying the characterization factor (CF) with the amount of substance emitted [63]. The total human health effect of the substances radiated by the manufacturing activity is equivalent to the total amount of the impacts of an individual substance. The accumulation effects of industrial emitted substances and production processes and regions are also utilized to evaluate ecoefficiency.
The conversion of Global Warming CO2-eq to human health equivalence is achieved following Equation (5), where the GWP100 is calculated first for GHG emissions. Then, the human health impact is calculated based on the characterization factor:
E n d p o i n t   H H H i e r a r c h i c = M i d p o i n t   H i e r a r c h i c × C F H i e r a r c h i c
where Endpoint HHHierarchic is the human health impact and CFHierarchic is the characterization factor as defined in Table 12. A hierarchical perspective is applied for all midpoint and endpoint level analyses, representing the impacts for a 100-year time horizon. Similarly, the conversion of fine particulate matter formation (PM2.5-eq) and photochemical ozone formation (NOx-eq) to human health equivalence is achieved. The PM2.5-eq and NOx-eq are calculated first for emitted substances. Then, the human health impact is calculated based on characterization factors as defined in Table 12.

4. Results and Discussion

4.1. Sources and Midpoint Emissions Clustering in the LNG Supply Chain

The LNG manufacturing and supply chain consist of many processing stages. Each one contributes to the environmental air emissions at different rates for several production operation scenarios. The air emission pollutants for each operation stage are identified and analyzed using a heat map diagram for LNG production and supply chain, as shown in Figure 14. The heat map evidently demonstrates the pattern and corresponding formation for all air pollutants associated with the LNG process chain. The ultimate ranking of the air emissions generation is performed by assigning each indicator’s weight individually and subsequently calculating the whole weight for each LNG operational stage. These results help to emphasize the clustering irrespective of the LNG process sequence from upstream to downstream. The used analysis technique helps to focus on the significant emissions contributors directly impacting human health. As a result, the highest emission formations are found from MDEA Sweetening unit, LNG loading (export terminal), and LNG shipping stages, respectively. However, the NGL recovery and fractionation units were found the have the lowest numbers in terms of environmental releases.

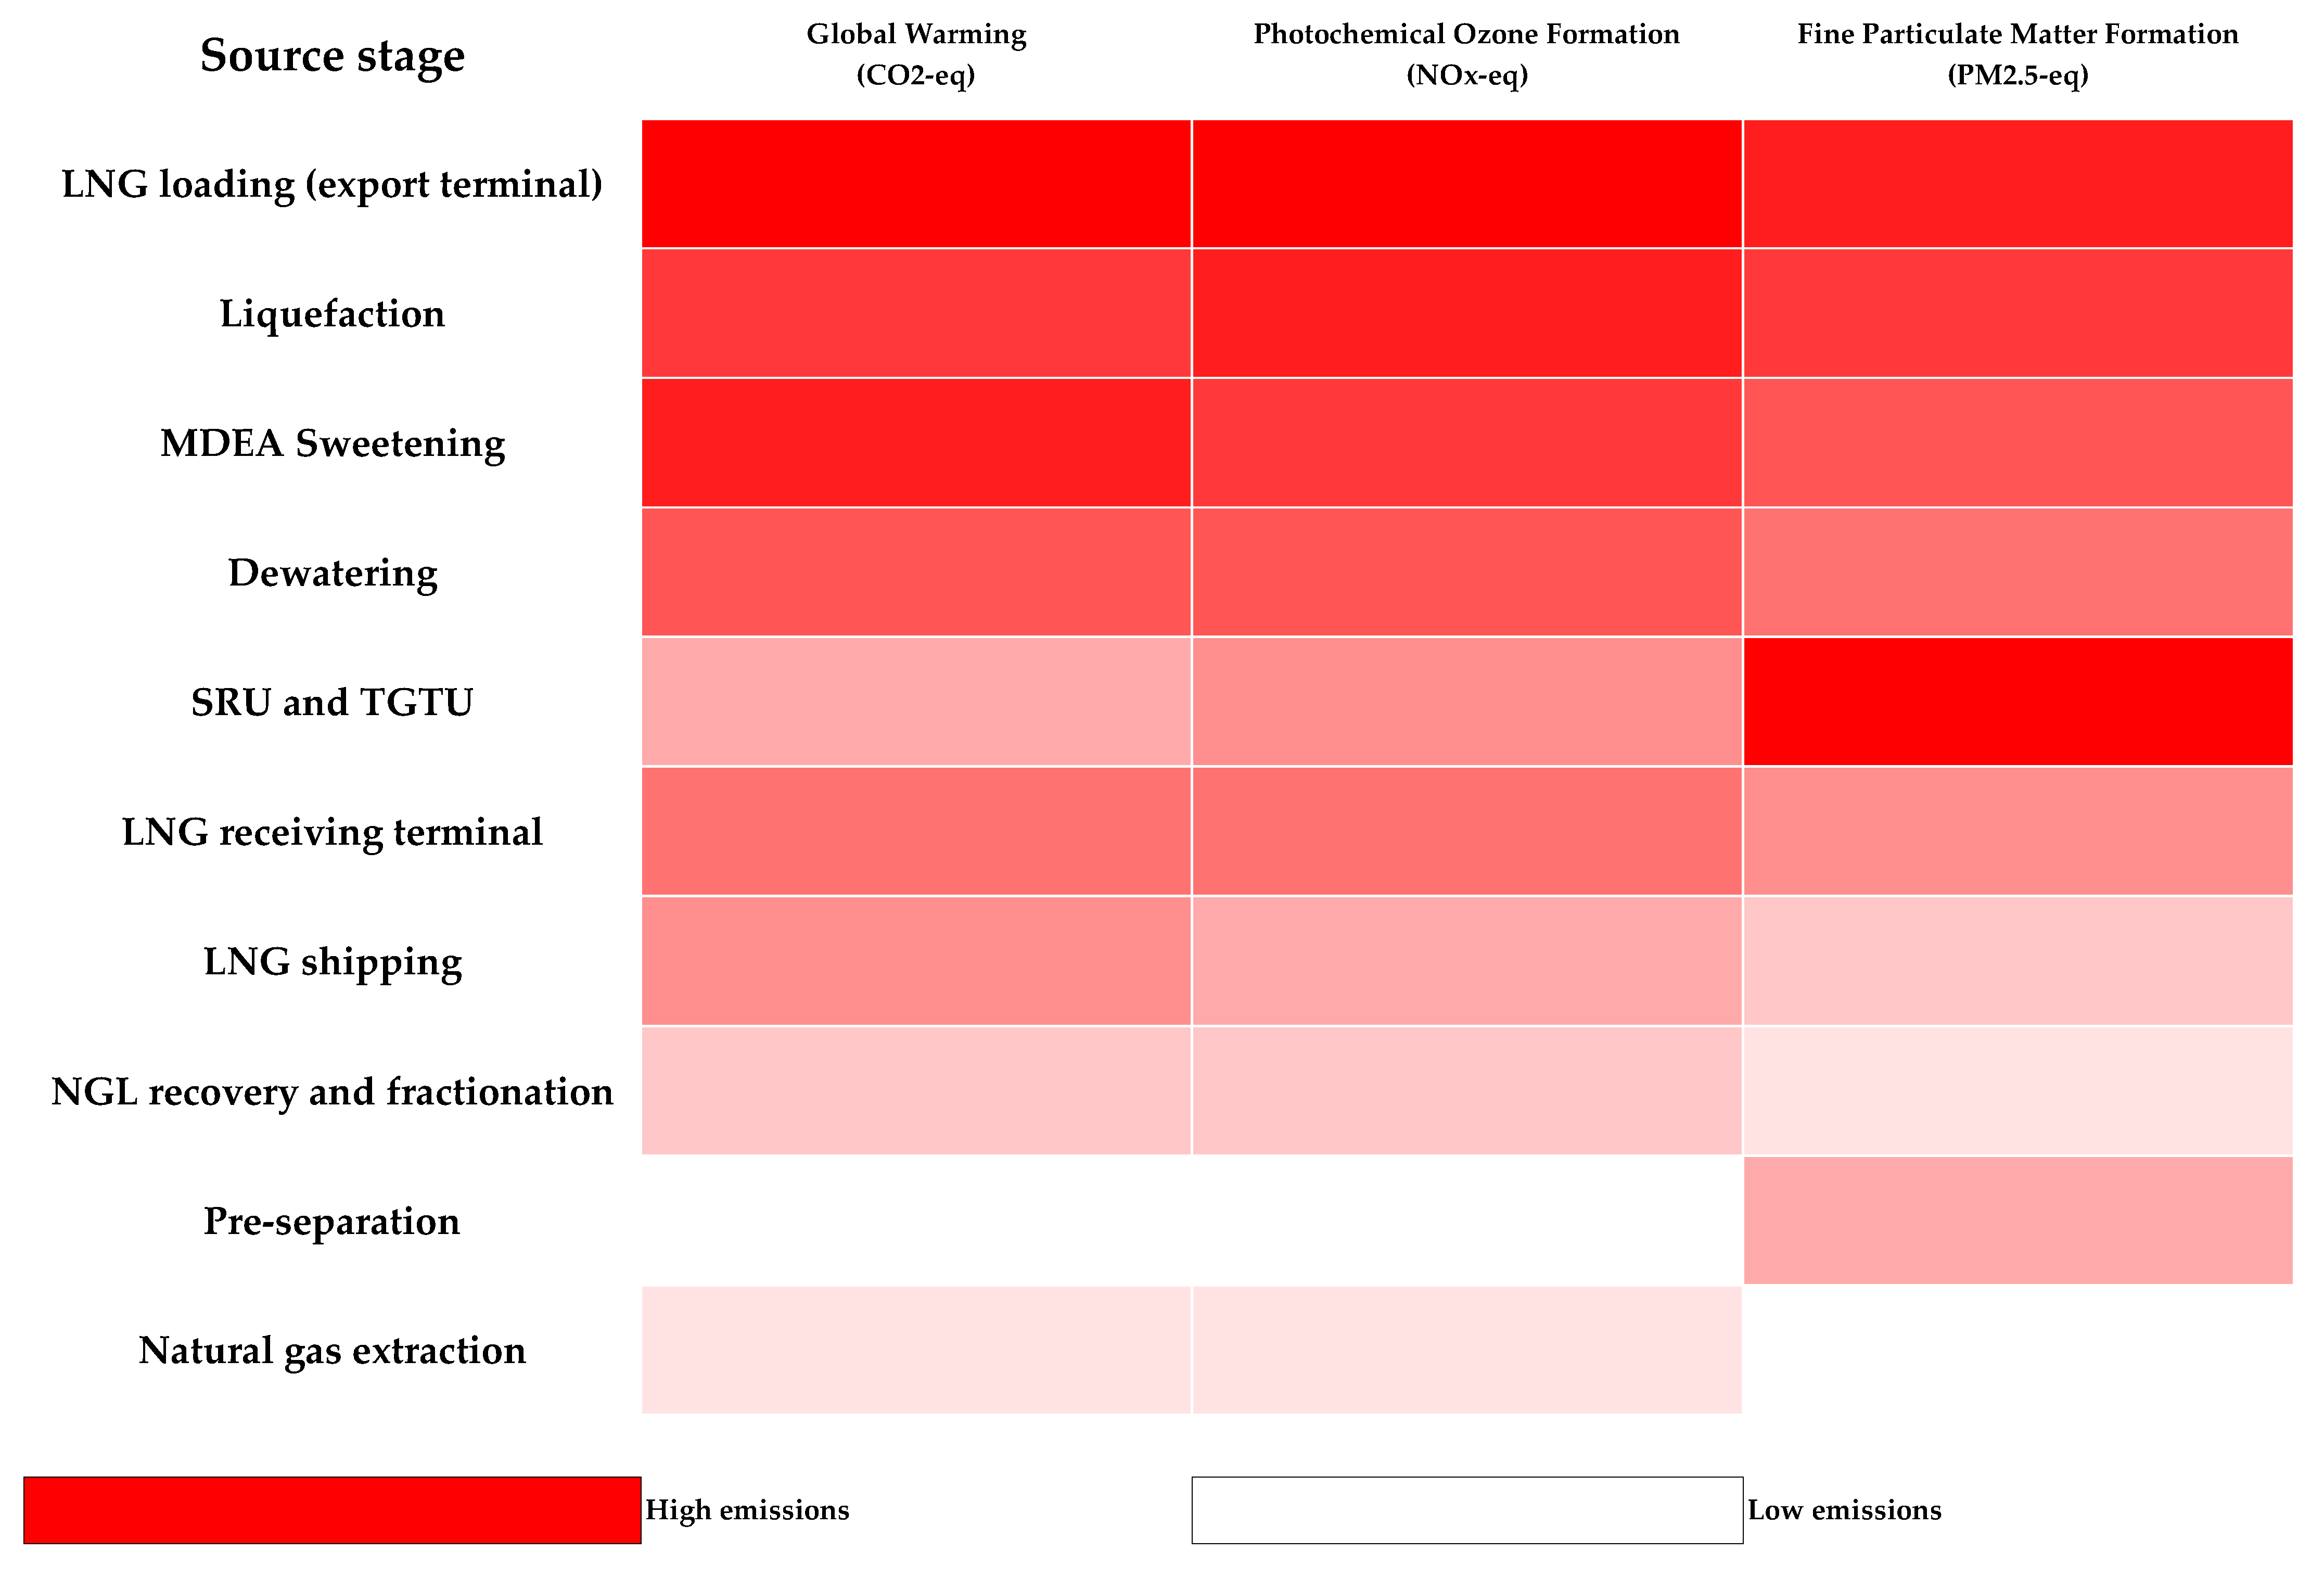
4.2. Midpoint Emission Results for LNG Supply Chain Stages

The air emission generated from each operation stage is converted to the midpoint impact using CFs and analyzed using another heat map diagram, as shown in Figure 15. The midpoint impact is in mass unit that mainly represents global warming potential (counted as CO2-eq), photochemical ozone formation (counted as NOx-eq), and fine particulate matter formation (counted as PM2.5-eq). The heat map shows the pattern and corresponding formation for all midpoint impacts associated with the LNG process chain and the respective contributions of each stage. As a result, the highest overall midpoint formation is found from LNG loading (export terminal), liquefaction, and MDEA Sweetening unit, respectively. However, the lowest in terms of midpoint impact results was found to be natural gas extraction.
The midpoint emissions have been calculated for all the LNG process stages and all the results are presented in Table 13. NG extraction-related emissions data based on the annual LNG production show a noticeable amount of CO2-eq per year. The CO2-eq is mainly found either in the raw gas from the wellhead (in a considerable percentage) or by the off-shore platforms’ combustion processes. The NG extraction process contributes around 0.5% of the overall CO2-eq in the LNG supply chain. NOx-eq and PM2.5-eq are mainly produced due to the combustion process at the upstream facility, and their contributions to the life cycle are considered negligible.
The emissions generated from the preseparation unit are pretty lower than NG extraction emissions for the CO2-eq and NOx-eq. However, PM2.5-eq is higher than in the previous stage. The presence of the emissions in this stage is due to the separation of the off-gases and venting in the separation vessels and the minor utilities needed to operate the unit. Based on the annual LNG production, PM2.5-eq represents 0.1% of the total PM2.5-eq in the LNG supply chain. CO2-eq and NOx-eq are not considered significant in this unit, which may rely on the separation process, and their contribution to the life cycle is deemed minimal.
The MDEA sweetening unit represents the second-highest contributor of CO2-eq and the third-highest contributor of NOx-eq along the LNG supply chain life cycle. Table 13 shows that the CO2-eq emissions generated from the MDEA sweetening unit are significant and represent around 24.3% of the total CO2-eq in the LNG supply chain. Furthermore, considerable NOx-eq emissions are present in the same unit, with a contribution of 16.1% compared to the overall LNG life cycle. The high emissions from this unit are expected due to the nature of the acid gas removal from the NG stream and meet the purity requirements. Additionally, acid gas removal is necessary to avoid further potential damage to the downstream equipment in the supply chain. Due to the direct impact of the released gases, combustion must be ensured with high efficiency to avoid human health impacts and ensure minimum releases of PM2.5-eq to the atmosphere. Further studies to minimize the environmental impact from the MDEA sweetening unit are highly recommended to reduce ecological degradation and minimize the direct human health impact.
The SRU and TGTU units represent the highest contributors of PM2.5-eq along the LNG supply chain life cycle. The unit mainly combusts acid gases and other pollutants by combustion processes to release a lower quantity of hazardous air pollutants into the atmosphere. Table 13 shows that the CO2-eq, NOx-eq, and PM2.5-eq emissions generated from the SRU and TGTU units are considerable, with a contribution of 0.5%, 2.2% and 79.3%, respectively, of the overall emissions in the LNG supply chain. It is recommended to further research and enhance technology to reduce or capture particulate matter with higher efficiency to minimize the environmental and human health impacts associated with the LNG midstream process.
The dewatering unit contributes significantly to the vented emissions in the LNG midstream cycle. To dehydrate the NG, energy for heating is required as utilities in which emissions are mainly generated. The CO2-eq, NOx-eq, and PM2.5-eq emissions generated from the dewatering unit are presented with a medium-to-high contribution of 9.2%, 9.9%, and 2.2%, respectively, of the overall emissions in the LNG supply chain.
The NGL recovery and fractionation units are minorly emitting pollutants to the atmosphere based on the annual LNG production. CO2-eq is mainly found in the dehydrated gas from the dewatering unit. CO2-eq is expected, from the associated utilities used in the unit, to provide the necessary process resources and stream to operate the unit effectively. The NGL recovery and fractionation units contribute around 0.1% of the overall CO2-eq in the LNG supply chain. The contributions of NOx-eq and PM2.5-eq emissions to the life cycle are considered negligible.
The liquefaction unit represents the third-highest contributor of CO2-eq, second highest contributor of NOx-eq, and third highest contributor of PM2.5-eq along the LNG supply chain life cycle. Table 13 demonstrates the CO2-eq, NOx-eq, and PM2.5-eq emissions formation from the liquefaction unit. The emissions are mainly produced as part of the LNG process chain and are specifically related to utility consumption, heating, regenerations, and steam generation. Around 20.1% is the CO2-eq emitted from the liquefication unit compared with the rest of the LNG life cycle. Moreover, NOx-eq and PM2.5-eq present around 20.6% and 4.3%, respectively, along the LNG process chain.
The highest emitter of CO2-eq to the atmosphere is the LNG loading unit (export terminal), representing 40.4% of the overall LNG supply chain life cycle. Furthermore, the same unit is considered the highest contributor of NOx-eq with 45.7% and the second-highest contributor of PM2.5-eq with 9.5% along the LNG supply chain life cycle. It is essential to treat the LNG loading unit as a hot spot in which further process optimization and enhancement are required. The emissions are mainly generated from product storage, utility consumption, loading to carriers, and BOG flaring. A reliquification unit will be made to maximize the gas recovery, avoid losses and abate ecological degradation. It is certain that minimizing environmental releases to the atmosphere will help to save human lives.
LNG shipping is a crucial stage in the LNG supply chain life cycle. The emissions vary from one destination to another. In this research, the UK deliveries have been considered over the year with annual demand of 6.6 million metric tons per annum (MMTA). The fleet type assumed to be used in this research is Conventional-2, which utilizes LNG as a fuel source. Annually, 51 trips are expected to the UK based on the agreement between both countries. The CO2-eq, NOx-eq, and PM2.5-eq emissions calculations illustrated the contribution to the LNG supply chain by 0.7%, 0.1% and 0.1%, respectively. As the technology is improving fast in the ship design, further enhancement to the ship structure, engine, and fuel system could help in minimizing the environmental footprint. The emissions are mainly from fuel combustion, utilities, BOG flaring, and tank venting. Table 13 shows the emissions results for LNG shipping from Qatar to the UK annually.
Finally, LNG receiving terminals and regasification plant units add more emissions to the environment due to utility requirements and flaring. The reliquefaction of the LNG is a crucial step to avoid losses and minimize the emissions in the LNG downstream cycle. The table below presents that the CO2-eq, NOx-eq, and PM2.5-eq emissions generated from the LNG receiving terminal and regasification plant units have a medium-to-high contribution of 4.7%, 5.4% and 1.1%, respectively, of the overall emissions in the LNG supply chain. The responsibility of the importing facility is to ensure proper maintenance and operational efficiency to avoid emissions released to the atmosphere and direct and indirect human health impacts.

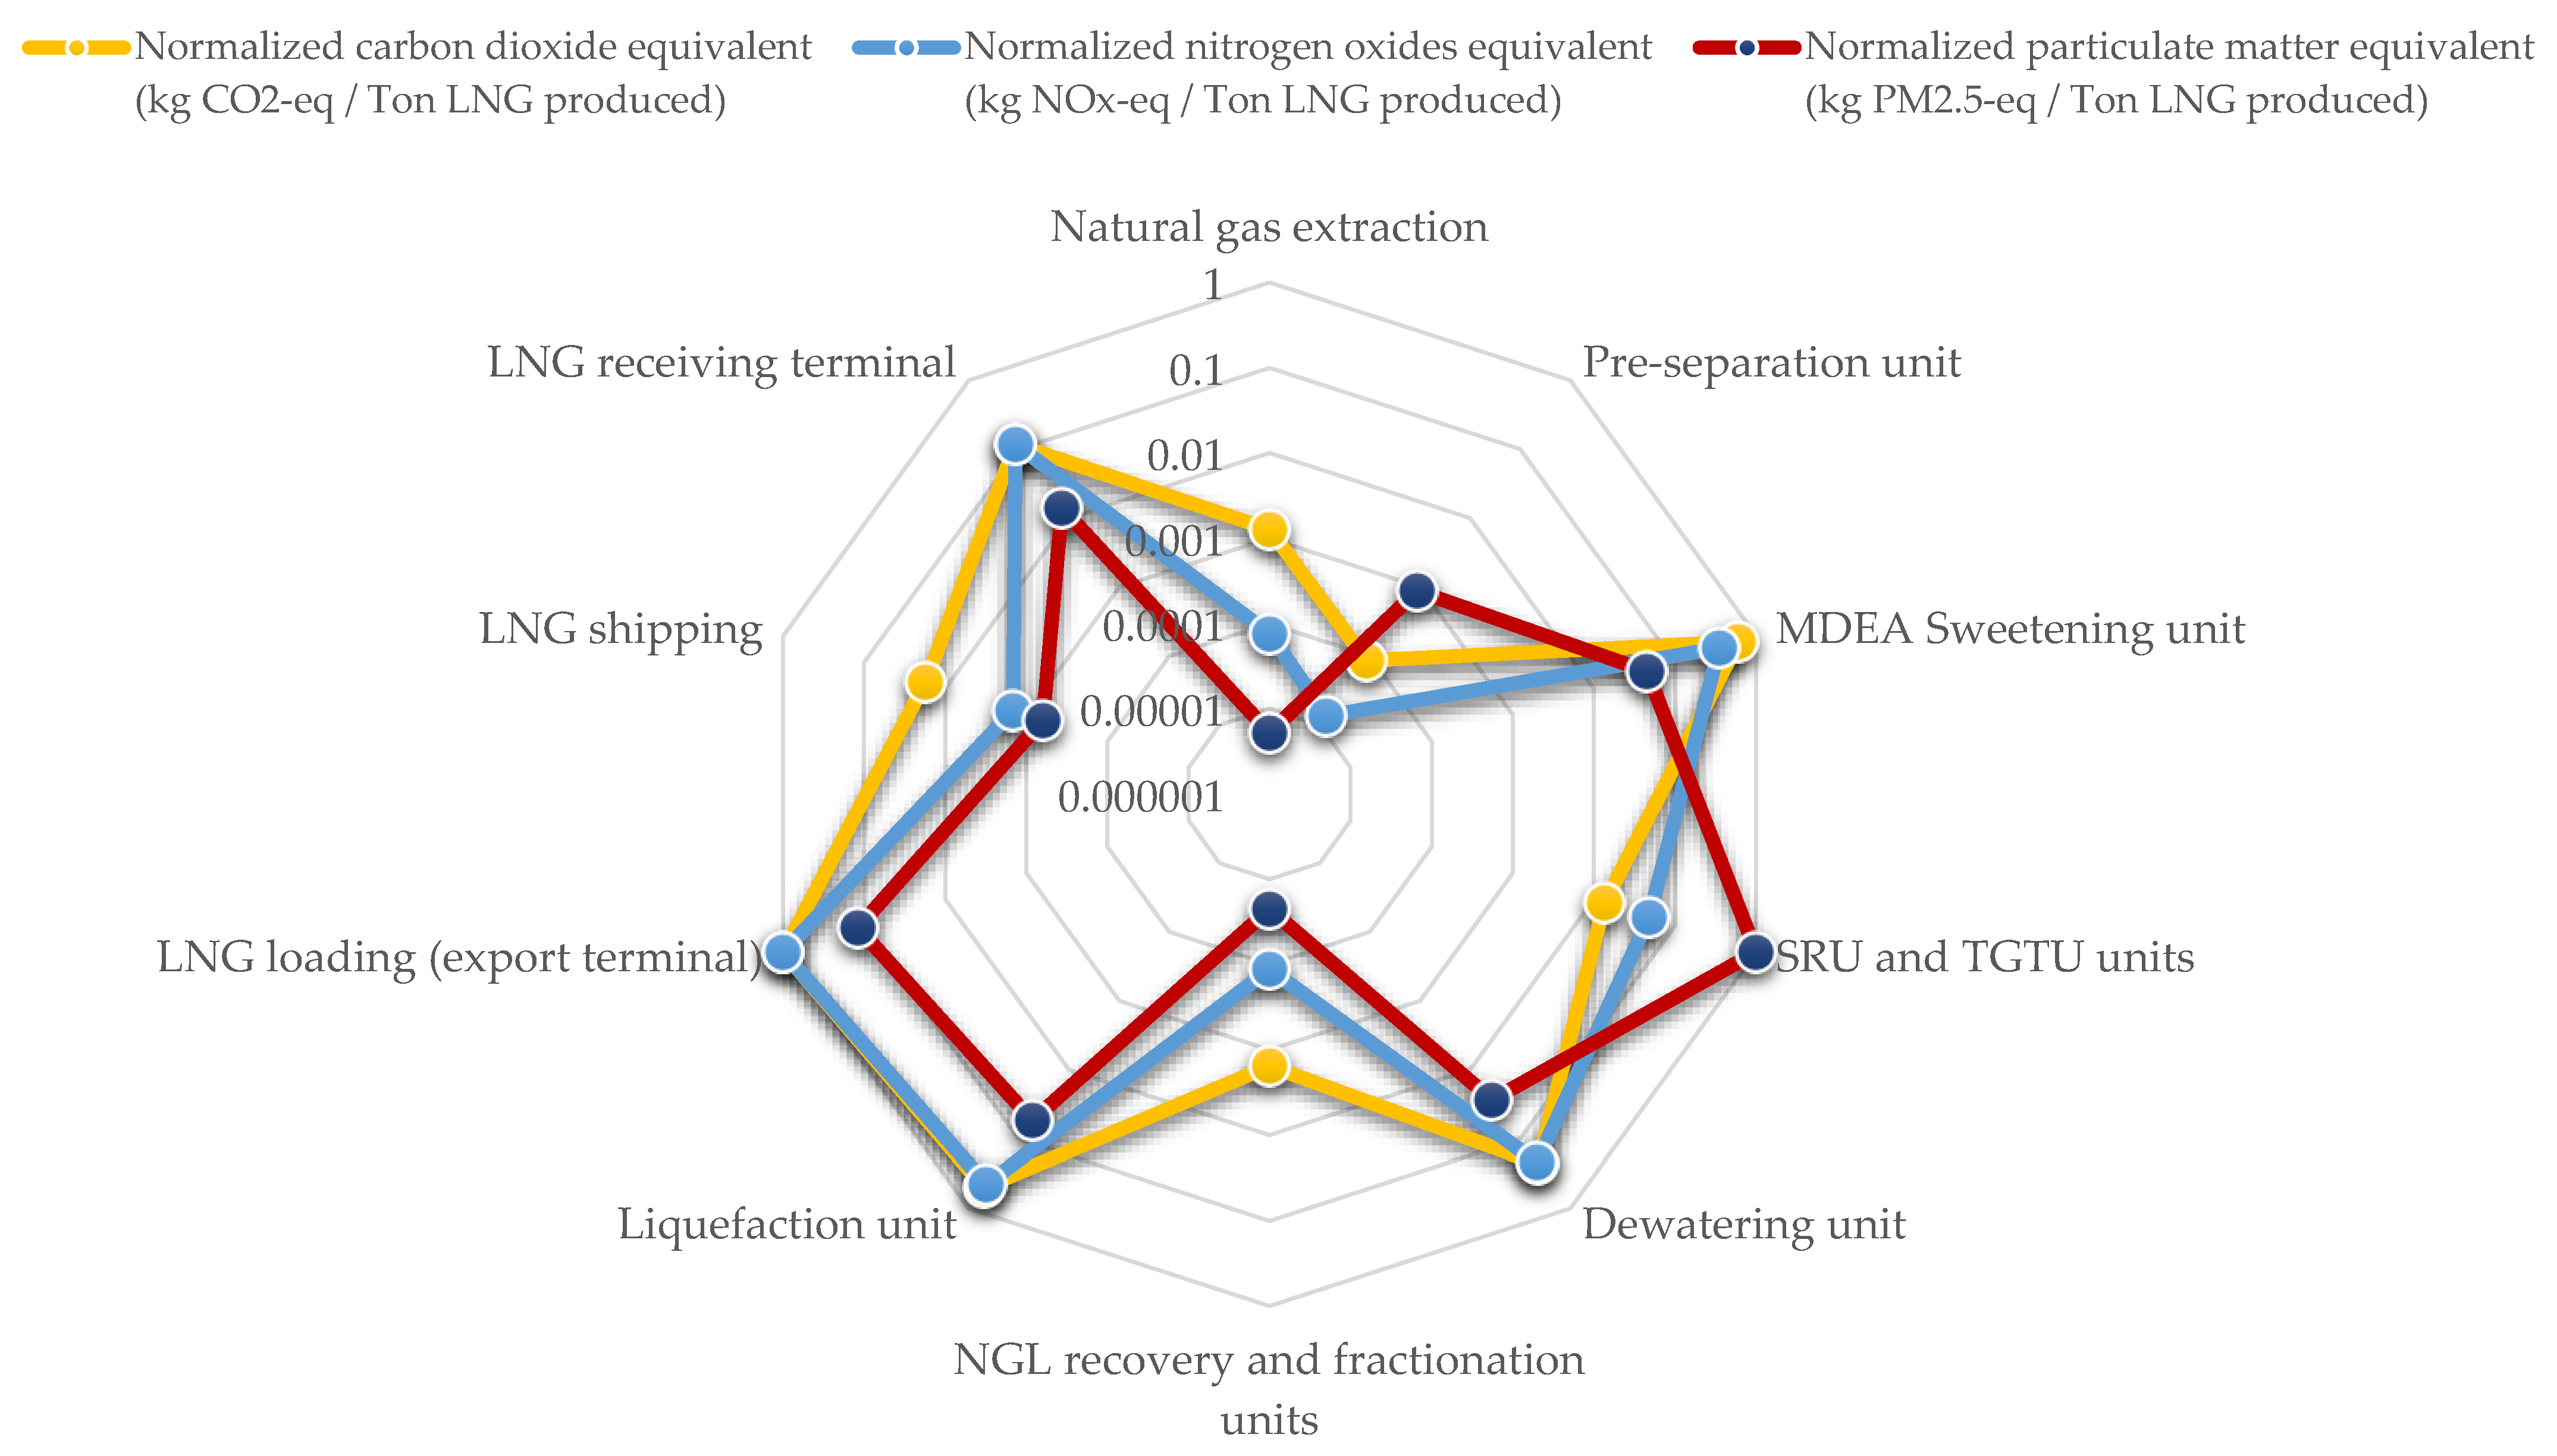
4.3. Midpoint Air Emissions Analysis

The LNG process chain emits different quantities and qualities of emissions into the atmosphere as part of LNG product manufacturing. To make the analysis simpler and profitable for the decision-makers, the emission results from different tools were normalized in ratios. The results were sorted out for the individual unit. Later, the maximum value was taken for all the stages. Each stage result was divided by the maximum value considered in the previous stage to be normalized. The normalized values are unitless and dimensionless. The range provided to meet the normalization conditions is from zero to one.
The lower value intensity for the LNG process stage obviously has a lower environmental impact and more sustainable performance in the supply chain. Figure 16 indicates the comparison of the normalized midpoint air emissions found at different points in the LNG supply chain. As shown in Figure 16, the LNG loading terminal was found to have the highest normalized CO2-eq and NOx-eq emission contribution along all of the LNG supply chain stages. On the other hand, the preseparation unit was seen as the lowest in the emission releases for normalized CO2-eq and NOx-eq emissions. Moreover, the intensity value for normalized PM2.5-eq found the maximum levels at the SRU and TGTU units, whereas the minimum levels were noticed at the NG extraction stage.

4.4. Endpoint Social Human Health Impact Analysis

After demonstrating midpoint emission results, the next milestone is to convert the air emissions into social and human health impact results. As illustrated in the methodology section of this paper, ReCiPe 2016 characterization factors are used to estimate the daily loss of life related to industrial activities to manufacture and deliver the LNG product. Figure 17 represents the normalized values of daily loss related to human health annually based on the annual emissions per stage in the supply chain.
The results indicate SRU and TGTU units as the highest stage for social human health impact with approximately 7409.0 (DALY/million Ton LNG produced annually) followed by LNG loading (export terminal) stage with 1203.9 (DALY/million Ton LNG produced annually). On the other hand, the lowest processing stages for social and human health impacts were NG extraction and NGL recovery and fractionation units associated with 0.43 and 0.65 (DALY/million Ton LNG produced annually), respectively. The results can be used to determine the significance of researching engineering solutions to capture sour gases and minimize flaring to the maximum extent during LNG production and in relative parts of the supply chain.

4.5. Social Human Health Implications

This research reveals eye-opening information about the social human health impacts of the most attractive and promising energy source for the 21st century. According to the results demonstrated in previous sections, many necessary actions need to be considered in the LNG supply chain to ensure social human satisfaction and wellbeing. The proposed implications are divided into administrative and engineering controls. A continuous stack emission monitoring system should be installed at all individual point source combustion units so that administrative controls can be used to measure the emissions during different operational scenarios. Furthermore, modeling the releases shall be considered for all sources of emissions, and simulating the impact of the critical primary receptors is required. The primary sensitive receptors could be—but are not limited to—crowded areas such as hospitals, schools, stadiums, etc. Moreover, further research is necessary to revalidate the environmental limits set by governments to ensure better air quality and minimum human health impact according to the United States Environmental Protection Agency (US EPA) laws and regulations.
For the engineering controls, industries should implement the best available control technologies (BACT) to eliminate the air pollutants associated with human health impacts. LNG producers have the social responsibility to build on the evidence with the community and worldwide customers. LNG industries and shipping companies should implement the possible solutions towards safe, healthy, and efficient processes to have such a sustainable LNG production and supply chain for long-term trading.
Besides, the WHO should continue to monitor air quality conditions and their impact on human health. Industrial evolution must include operations within WHO’s standards for air quality to avoid further costs to human health and community dissatisfaction. Finally, energy policies must also be implemented in order to improve global human health and mitigate the significant contributors to health deterioration in a sustainable manner.

5. Conclusions and Recommendations

The LNG product and supply chain market are of growing global interest, and demand continues to increase. In this study, an LNG plant with up to 126 MMTA production has been successfully designed and simulated, considering many constraints, assumptions, and limitations. In order to evaluate and analyze the sustainability of the LNG supply chain, a hybrid life cycle assessment model was developed to assess the social and human health impact based on the environmental air emission formation of the LNG industry and associated supply chains. This comprehensive research’s primary sources of information were obtained from the MRIO database, Aspen HYSYS simulator, and LNG Maritime Transportation Emission Quantification Tool.

5.1. Discussion of Key Findings

The research’s results started by clustering the environmental emissions sources based on the contribution of each stage in the supply chain. It was found that the highest emission formation is found at the MDEA Sweetening unit, LNG loading (export terminal) and LNG shipping stages, respectively. However, the lowest in terms of environmental releases were found to be the NGL recovery and fractionation units.
For the midpoint air emissions results, each stage’s emissions have been calculated to obtain the quantities of CO2-eq, NOx-eq, and PM2.5-eq per unit LNG produced. The primary emission sources and main causes of the presence of significant emissions have been addressed and justified. To make the analysis simpler and more profitable for the decision-makers, the emission results from different tools were normalized in ratios. The midpoint analysis results indicate the LNG loading terminal as the highest normalized CO2-eq and NOx-eq emission contribution along all LNG supply chain stages. Moreover, the intensity value for normalized PM2.5-eq found the maximum at the SRU and TGT units.
After demonstrating the midpoint emission results, the social human health impact results have been determined using ReCiPe 2016 characterization factors to estimate the daily loss of life related to industrial activities to manufacture and deliver the LNG product. The endpoint analysis results indicate SRU and TGTU units as the highest stage for social human health impact with approximately 7409.0 (DALY/million Ton LNG produced annually) followed by LNG loading (export terminal) stage with 1203.9 (DALY/million Ton LNG produced annually). On the other hand, the processing stages that produced the lowest quantity of social and human health impacts were NG extraction and the NGL recovery and fractionation units, associated with 0.43 and 0.65 (DALY/million Ton LNG produced annually), respectively.

5.2. Limitations of the Current Research

The MRIO lacks information providing the LNG industry-specific top-down analysis for the LNG sector, which makes evaluating several combined sources of information a challenge. Moreover, few publications in the related literature perform the verification step included in this research’s result. However, most of this work’s data are based on an optimized LNG process that is reliable. Furthermore, there is a need to establish and perform triple bottom line life cycle sustainability assessment (LCSA) modeling with more indicators, such as cost, taxes, energy, employment, safety, etc., in order to have an overall sustainability assessment of the LNG product and supply chain [64,65].

5.3. Recommendations, Future Work and Policy Making

This research went through an extensive literature review, followed by a comprehensive combination of essential tools to establish a novel hybrid model. In conclusion, further study and optimization of the design of the LNG process are recommended in order to reduce ecological degradation and minimize the direct human health impact from the MDEA sweetening and SRU units by applying more efficient scrubbers and absorbers into the processing unit. Moreover, it is advisable to review the LNG shipping route and select the best available options to avoid further unnecessary emissions. Much work relating to such enhancements has been highlighted in the literature related to the electrification of shipping carriers; however, policymakers still cannot enforce the implementation of action plans towards ensuring less emissions from shipping to the environment. Finally, it is advised to increase the reliability of work in the energy industries to prevent abnormal operations and losses to the flare wherever applicable. Additionally, maximizing CO2 as a raw material for oil recovery enhancement and exploration in the long-term is an essential step towards a circular economy for counties owning oil reservoirs and natural gas fields. The circular economy is an innovative initiative that ensures the sustainability pillars for several products and business sectors [66,67].

Author Contributions

Conceptualization, H.A.-Y. and M.K.; Formal analysis, H.A.-Y., A.A. and S.A.; Funding acquisition, H.A.-Y., M.K. and N.C.O.; Investigation, H.A.-Y., A.A. and S.A.; Methodology, H.A.-Y., A.A. and S.A.; Research administration, H.A.-Y. and M.K.; Resources, H.A.-Y.; Tools, H.A.-Y., A.A., S.A. and M.K.; Supervision, M.K.; Validation, H.A.-Y., A.A., S.A. and N.C.O.; Visualization, H.A.-Y. and A.A.; Writing—Original draft, H.A.-Y. and A.A.; Writing—Review and editing, S.A., M.K. and N.C.O. All authors have read and agreed to the published version of the manuscript.

Funding

This research was funded and supported by Qatar University Student Grant QUST-1-CENG-2021-15. The findings achieved herein are solely the responsibility of the authors.

Institutional Review Board Statement

Not applicable.

Informed Consent Statement

Not applicable.

Data Availability Statement

Data sharing not applicable.

Acknowledgments

The authors would like to acknowledge the Qatar University Student Grant Office for the support provided to complete and publish this research paper.

Conflicts of Interest

The authors declare no conflict of interest.

References

  1. EIA. Annual Energy Review 2009; Office of Energy Markets and Use, U.S. Deptment of Energy: Washington, DC, USA, 2010.
  2. IEA. World Energy Outlook 2019; IEA: Paris, France, 2019; Available online: https://www.iea.org/reports/world-energy-outlook-2019 (accessed on 1 August 2021).
  3. IGU. Global Gas Report 2020; International Gas Union (IGU), BloombergNEF (BNEF) and Snam: Milan, Italy, 2020. [Google Scholar]
  4. Oliver, M.E. Economies of scale and scope in expansion of the US natural gas pipeline network. Energy Econ. 2015, 52, 265–276. [Google Scholar] [CrossRef]
  5. Whitmore, W.D.; Baxter, V.K.; Laska, S.L. A critique of offshore liquefied natural gas (LNG) terminal policy. Ocean. Coast. Manag. 2009, 52, 10–16. [Google Scholar] [CrossRef]
  6. Agnolucci, P.; Arvanitopoulos, T. Industrial characteristics and air emissions: Long-term determinants in the UK manufacturing sector. Energy Econ. 2019, 78, 546–566. [Google Scholar] [CrossRef]
  7. Manisalidis, I.; Stavropoulou, E.; Stavropoulos, A.; Bezirtzoglou, E. Environmental and Health Impacts of Air Pollution: A Review. Front. Public Health 2020, 8, 14. [Google Scholar] [CrossRef] [PubMed] [Green Version]
  8. Kampa, M.; Castanas, E. Human health effects of air pollution. Environ. Pollut. 2008, 151, 362–367. [Google Scholar] [CrossRef]
  9. Shah, A.S.V.; Langrish, J.P.; Nair, H.; McAllister, D.A.; Hunter, A.L.; Donaldson, K.; Newby, D.E.; Mills, N.L. Global association of air pollution and heart failure: A systematic review and meta-analysis. Lancet 2013, 382, 1039–1048. [Google Scholar] [CrossRef] [Green Version]
  10. OECD. Economic Consequences of Outdoor Air Pollution; Organisation for Economic Co-operation and Development: Paris, France, 2016. [Google Scholar]
  11. Dekker, E.; Zijp, M.C.; van de Kamp, M.E.; Temme, E.H.M.; van Zelm, R. A taste of the new ReCiPe for life cycle assessment: Consequences of the updated impact assessment method on food product LCAs. Int. J. Life Cycle Assess. 2020, 25, 2315–2324. [Google Scholar] [CrossRef] [Green Version]
  12. Van Caneghem, J.; Block, C.; Van Hooste, H.; Vandecasteele, C. Eco-efficiency trends of the Flemish industry: Decoupling of environmental impact from economic growth. J. Clean. Prod. 2010, 18, 1349–1357. [Google Scholar] [CrossRef]
  13. Kucukvar, M.; Onat, N.C.; Haider, M.A. Material dependence of national energy development plans: The case for Turkey and United Kingdom. J. Clean. Prod. 2018, 200, 490–500. [Google Scholar] [CrossRef]
  14. Onat, N.C.; Kucukvar, M.; Tatari, O. Conventional, hybrid, plug-in hybrid or electric vehicles? State-based comparative carbon and energy footprint analysis in the United States. Appl. Energy 2015, 150, 36–49. [Google Scholar] [CrossRef]
  15. Kucukvar, M.; Tatari, O. Ecologically based hybrid life cycle analysis of continuously reinforced concrete and hot-mix asphalt pavements. Transp. Res. Part D Transp. Environ. 2012, 17, 86–90. [Google Scholar] [CrossRef]
  16. Aberilla, J.M.; Gallego-Schmid, A.; Stamford, L.; Azapagic, A. Synergistic generation of energy and water in remote communities: Economic and environmental assessment of current situation and future scenarios. Energy Convers. Manag. 2020, 207, 112543. [Google Scholar] [CrossRef]
  17. Tamura, I.; Tanaka, T.; Kagajo, T.; Kuwabara, S.; Yoshioka, T.; Nagata, T.; Kurahashi, K.; Ishitani, H. Life cycle CO2 analysis of LNG and city gas. Appl. Energy 2001, 68, 301–319. [Google Scholar] [CrossRef]
  18. Korre, A.; Nie, Z.; Durucan, S. Life Cycle Assessment of the natural gas supply chain and power generation options with CO2 capture and storage: Assessment of Qatar natural gas production, LNG transport and power generation in the UK. Sustain. Technol. Syst. Policies 2012, 11. [Google Scholar] [CrossRef]
  19. Biswas, W.; Engelbrecht, D.; John, M. Carbon footprint assessment of Western Australian LNG production and export to the Chinese market. Int. J. Prod. Lifecycle Manag. 2013, 6, 339–356. [Google Scholar] [CrossRef]
  20. Jaramillo, P.; Griffin, W.M.; Matthews, H.S. Comparative life-cycle air emissions of coal, domestic natural gas, LNG, and SNG for electricity generation. Environ. Sci. Technol. 2007, 41, 6290–6296. [Google Scholar] [CrossRef] [PubMed]
  21. Raj, R.; Ghandehariun, S.; Kumar, A.; Linwei, M. A well-to-wire life cycle assessment of Canadian shale gas for electricity generation in China. Energy 2016, 111, 642–652. [Google Scholar] [CrossRef]
  22. Sapkota, K.; Oni, A.O.; Kumar, A. Techno-economic and life cycle assessments of the natural gas supply chain from production sites in Canada to north and southwest Europe. J. Nat. Gas Sci. Eng. 2018, 52, 401–409. [Google Scholar] [CrossRef]
  23. Al-Haidous, S.; Al-Ansari, T. Sustainable Liquefied Natural Gas Supply Chain Management: A Review of Quantitative Models. Sustainability 2020, 12, 243. Available online: https://www.mdpi.com/2071-1050/12/1/243 (accessed on 2 August 2021). [CrossRef] [Green Version]
  24. Al-Haidous, S.; Govindan, R.; Al-Ansari, T. Swarm Optimisation for Shipping Fleet Scheduling, Routing and Delivery in Sustainable Liquified Natural Gas (LNG) Supply Chain Models. In Computer Aided Chemical Engineering; Pierucci, S., Manenti, F., Bozzano, G.L., Manca, D., Eds.; Elsevier: Amsterdam, The Netherlands, 2020; Volume 48, pp. 1225–1230. [Google Scholar] [CrossRef]
  25. Onat, N.C.; Aboushaqrah, N.N.M.; Kucukvar, M.; Tarlochan, F.; Hamouda, A.M. From sustainability assessment to sustainability management for policy development: The case for electric vehicles. Energy Convers. Manag. 2020, 216, 112937. [Google Scholar] [CrossRef]
  26. Ghorani-Azam, A.; Riahi-Zanjani, B.; Balali-Mood, M. Effects of air pollution on human health and practical measures for prevention in Iran. J. Res. Med. Sci. 2016, 21, 65. [Google Scholar] [CrossRef]
  27. Sivarethinamohan, R.; Sujatha, S.; Priya, S.; Sankaran; Gafoor, A.; Rahman, Z. Impact of air pollution in health and socio-economic aspects: Review on future approach. Mater. Today Proc. 2021, 37, 2725–2729. [Google Scholar] [CrossRef]
  28. Rocha, C.A.; Lima, J.L.R.; Mendonça, K.V.; Marques, E.V.; Zanella, M.E.; Ribeiro, J.P.; Bertoncini, B.V.; Castelo Branco, V.T.F.; Cavalcante, R.M. Health impact assessment of air pollution in the metropolitan region of Fortaleza, Ceará, Brazil. Atmos. Environ. 2020, 241, 117751. [Google Scholar] [CrossRef]
  29. Li, Y.; Chiu, Y.-H.; Lin, T.-Y. The Impact of Economic Growth and Air Pollution on Public Health in 31 Chinese Cities. Int. J. Environ. Res. Public Health 2019, 16, 393. Available online: https://www.mdpi.com/1660-4601/16/3/393 (accessed on 4 August 2021). [CrossRef] [Green Version]
  30. Bergstra, A.D.; Brunekreef, B.; Burdorf, A. The effect of industry-related air pollution on lung function and respiratory symptoms in school children. Env. Health 2018, 17, 30. [Google Scholar] [CrossRef] [PubMed] [Green Version]
  31. Kim, K.-H.; Kabir, E.; Kabir, S. A review on the human health impact of airborne particulate matter. Environ. Int. 2015, 74, 136–143. [Google Scholar] [CrossRef] [PubMed]
  32. Katebah, M.A.; Hussein, M.M.; Shazed, A.; Bouabidi, Z.; Al-musleh, E.I. Rigorous simulation, energy and environmental analysis of an actual baseload LNG supply chain. Comput. Chem. Eng. 2020, 141, 106993. [Google Scholar] [CrossRef]
  33. Anderson, T.N.; Ehrhardt, M.E.; Foglesong, R.E.; Bolton, T.; Jones, D.; Richardson, A. Shipboard Reliquefaction for Large LNG Carriers. In Proceedings of the 1st Annual Gas Processing Symposium; Alfadala, H.E., Rex Reklaitis, G.V., El-Halwagi, M.M., Eds.; Elsevier: Amsterdam, The Netherlands, 2009; Volume 1, pp. 317–324. [Google Scholar] [CrossRef]
  34. Gómez, M.R.; García, R.; Gómez, J.; Catoira, A. Cold exergy recovery during LNG regasification through a closed Brayton cycle. Int. J. Energy 2014, 14, 484–504. [Google Scholar] [CrossRef]
  35. Kucukvar, M.; Onat, N.C.; Abdella, G.M.; Tatari, O. Assessing regional and global environmental footprints and value added of the largest food producers in the world. Resour. Conserv. Recycl. 2019, 144, 187–197. [Google Scholar] [CrossRef]
  36. Stadler, K.; Wood, R.; Bulavskaya, T.; Södersten, C.-J.; Simas, M.; Schmidt, S.; Usubiaga, A.; Acosta-Fernández, J.; Kuenen, J.; Bruckner, M.; et al. EXIOBASE 3: Developing a Time Series of Detailed Environmentally Extended Multi-Regional Input-Output Tables. J. Ind. Ecol. 2018, 22, 502–515. [Google Scholar] [CrossRef] [Green Version]
  37. Aseel, S.; Al-Yafei, H.; Kucukvar, M.; Onat, N.C.; Turkay, M.; Kazancoglu, Y.; Al-Sulaiti, A.; Al-Hajri, A. A Model for Estimating the Carbon Footprint of Maritime Transportation of Liquefied Natural Gas under Uncertainty. Sustain. Prod. Consum. 2021, 27, 1602–1613. [Google Scholar] [CrossRef]
  38. Guinée, J.B.; Heijungs, R.; Huppes, G.; Zamagni, A.; Masoni, P.; Buonamici, R.; Ekvall, T.; Rydberg, T. Life Cycle Assessment: Past, Present, and Future. Environ. Sci. Technol. 2011, 45, 90–96. [Google Scholar] [CrossRef]
  39. Jeswani, H.K.; Azapagic, A.; Schepelmann, P.; Ritthoff, M. Options for broadening and deepening the LCA approaches. J. Clean. Prod. 2010, 18, 120–127. [Google Scholar] [CrossRef]
  40. Onat, N.C.; Kucukvar, M.; Tatari, O. Integrating triple bottom line input–output analysis into life cycle sustainability assessment framework: The case for US buildings. Int. J. Life Cycle Assess. 2014, 19, 1488–1505. [Google Scholar] [CrossRef]
  41. Onat, N.C.; Kucukvar, M.; Tatari, O. Scope-based carbon footprint analysis of U.S. residential and commercial buildings: An input–output hybrid life cycle assessment approach. Build. Environ. 2014, 72, 53–62. [Google Scholar] [CrossRef]
  42. Kucukvar, M.; Tatari, O. Towards a triple bottom-line sustainability assessment of the U.S. construction industry. Int. J. Life Cycle Assess. 2013, 18, 958–972. [Google Scholar] [CrossRef]
  43. Zhao, Y.; Onat, N.C.; Kucukvar, M.; Tatari, O. Carbon and energy footprints of electric delivery trucks: A hybrid multi-regional input-output life cycle assessment. Transp. Res. Part D Transp. Environ. 2016, 47, 195–207. [Google Scholar] [CrossRef]
  44. Kucukvar, M.; Haider, M.A.; Onat, N.C. Exploring the material footprints of national electricity production scenarios until 2050: The case for Turkey and UK. Resour. Conserv. Recycl. 2017, 125, 251–263. [Google Scholar] [CrossRef]
  45. Tukker, A.; Dietzenbacher, E. Global multiregional input–output frameworks: An introduction and outlook. Econ. Syst. Res. 2013, 25, 1–19. [Google Scholar] [CrossRef] [Green Version]
  46. Galli, A.; Weinzettel, J.; Cranston, G.; Ercin, E. A Footprint Family extended MRIO model to support Europe’s transition to a One Planet Economy. Sci. Total. Environ. 2013, 461–462, 813–818. [Google Scholar] [CrossRef]
  47. Kucukvar, M.; Cansev, B.; Egilmez, G.; Onat, N.C.; Samadi, H. Energy-climate-manufacturing nexus: New insights from the regional and global supply chains of manufacturing industries. Appl. Energy 2016, 184, 889–904. [Google Scholar] [CrossRef] [Green Version]
  48. Abdella, G.M.; Kucukvar, M.; Onat, N.C.; Al-Yafay, H.M.; Bulak, M.E. Sustainability assessment and modeling based on supervised machine learning techniques: The case for food consumption. J. Clean. Prod. 2020, 251, 119661. [Google Scholar] [CrossRef]
  49. Andrew, R.M.; Peters, G.P. A Multi-Region Input–Output Table Based on the Global Trade Analysis Project Database (Gtap-Mrio). Econ. Syst. Res. 2013, 25, 99–121. [Google Scholar] [CrossRef]
  50. Hertwich, E.G.; Peters, G.P. Carbon Footprint of Nations: A Global, Trade-Linked Analysis. Environ. Sci. Technol. 2009, 43, 6414–6420. [Google Scholar] [CrossRef] [Green Version]
  51. Yang, Y.; Ingwersen, W.W.; Hawkins, T.R.; Srocka, M.; Meyer, D.E. USEEIO: A new and transparent United States environmentally-extended input-output model. J. Clean. Prod. 2017, 158, 308–318. [Google Scholar] [CrossRef] [PubMed]
  52. Ivanova, D.; Vita, G.; Steen-Olsen, K.; Stadler, K.; Melo, P.C.; Wood, R.; Hertwich, E.G. Mapping the carbon footprint of EU regions. Environ. Res. Lett. 2017, 12, 054013. [Google Scholar] [CrossRef]
  53. Steinmann, Z.J.N.; Schipper, A.M.; Stadler, K.; Wood, R.; de Koning, A.; Tukker, A.; Huijbregts, M.A.J. Headline Environmental Indicators Revisited with the Global Multi-Regional Input-Output Database EXIOBASE. J. Ind. Ecol. 2018, 22, 565–573. [Google Scholar] [CrossRef] [Green Version]
  54. Wood, R.; Stadler, K.; Bulavskaya, T.; Lutter, S.; Giljum, S.; De Koning, A.; Kuenen, J.; Schütz, H.; Acosta-Fernández, J.; Usubiaga, A.; et al. Global Sustainability Accounting—Developing EXIOBASE for Multi-Regional Footprint Analysis. Sustainability 2015, 7, 138–163. Available online: https://www.mdpi.com/2071-1050/7/1/138 (accessed on 20 July 2021). [CrossRef] [Green Version]
  55. Foss, M.M. The Outlook for US Gas Prices in 2020: Henry hub at $3 or $10? Oxford Institute for Energy Studies: Oxford, UK, 2011. [Google Scholar]
  56. Chapter 1—LNG Fundamentals. In Handbook of Liquefied Natural Gas; Mokhatab, S.; Mak, J.Y.; Valappil, J.V.; Wood, D.A. (Eds.) Gulf Professional Publishing: Boston, MA, USA, 2014; pp. 1–106. [Google Scholar] [CrossRef]
  57. Aspen Technology Inc., Aspen HYSYS. In aspentech.com. 2021. Available online: https://www.aspentech.com/en/products/engineering/aspen-hysys (accessed on 6 August 2021).
  58. Perdu, G.; Normand, L.; Laborie, G.; Alhatou, O. Acid gas treatment upgrade for Qatargas. In International Petroleum Technology Conference; Society of Petroleum Engineers: Doha, Qatar, 2016; Available online: www.eptq.com (accessed on 1 August 2021).
  59. Cooper, D.; Gustafsson, T. Methodology for Calculating Emissions from Ships: 1. Update of Emission Factors; Swedish Meteorological and Hydrological Institute: Norrköping, Sweden, 2004. [Google Scholar]
  60. Aboushaqrah, N.N.M.; Onat, N.C.; Kucukvar, M.; Hamouda, A.M.S.; Kusakci, A.O.; Ayvaz, B. Selection of alternative fuel taxis: A hybridized approach of life cycle sustainability assessment and multi-criteria decision making with neutrosophic sets. Int. J. Sustain. Transp. 2021, 1–14. [Google Scholar] [CrossRef]
  61. Kucukvar, M.; Samadi, H. Linking national food production to global supply chain impacts for the energy-climate challenge: The cases of the EU-27 and Turkey. J. Clean. Prod. 2015, 108, 395–408. [Google Scholar] [CrossRef]
  62. Huang, Y.A.; Lenzen, M.; Weber, C.L.; Murray, J.; Matthews, H.S. The Role of Input—Output Analysis for the Screening of Corporate Carbon FootprINTS. Econ. Syst. Res. 2009, 21, 217–242. [Google Scholar] [CrossRef]
  63. Van Caneghem, J.; Block, C.; Vandecasteele, C. Assessment of the impact on human health of industrial emissions to air: Does the result depend on the applied method? J. Hazard. Mater. 2010, 184, 788–797. [Google Scholar] [CrossRef] [PubMed]
  64. Onat, N.C.; Kucukvar, M.; Halog, A.; Cloutier, S. Systems Thinking for Life Cycle Sustainability Assessment: A Review of Recent Developments, Applications, and Future Perspectives. Sustainability 2017, 9, 706. Available online: https://www.mdpi.com/2071-1050/9/5/706 (accessed on 1 August 2021). [CrossRef] [Green Version]
  65. Onat, N.; Kucukvar, M.; Aboushaqrah, N.; Jabbar, R. How sustainable is electric mobility? A comprehensive sustainability assessment approach for the case of Qatar. Appl. Energy 2019, 250, 461–477. [Google Scholar] [CrossRef]
  66. Kucukvar, M.; Kutty, A.A.; Al-Hamrani, A.; Kim, D.; Nofal, N.; Onat, N.C.; Ermolaeva, P.; Al-Ansari, T.; Al-Thani, S.K.; Al-Jurf, N.M.; et al. How circular design can contribute to social sustainability and legacy of the FIFA World Cup Qatar 2022™? The case of innovative shipping container stadium. Environ. Impact Assess. Rev. 2021, 91, 106665. [Google Scholar] [CrossRef]
  67. Al-Hamrani, A.; Kim, D.; Kucukvar, M.; Onat, N.C. Circular economy application for a Green Stadium construction towards sustainable FIFA world cup Qatar 2022™. Environ. Impact Assess. Rev. 2021, 87, 106543. [Google Scholar] [CrossRef]
Figure 1. LNG process chain.
Energies 14 06278 g001
Figure 2. Research method.
Energies 14 06278 g002
Figure 3. Steps of life cycle air emissions using MRIO database.
Energies 14 06278 g003
Figure 4. PFD of the simulated preseparation unit.
Energies 14 06278 g004
Figure 5. PFD of the simulated sweetening unit.
Energies 14 06278 g005
Figure 6. PFD of the simulated SRU/TGT unit.
Energies 14 06278 g006
Figure 7. PFD of the simulated dehydration unit.
Energies 14 06278 g007
Figure 8. PFD of the simulated NGL recovery unit.
Energies 14 06278 g008
Figure 9. PFD of the simulated liquefaction unit.
Energies 14 06278 g009
Figure 10. PFD of the simulated HeX and NR unit.
Energies 14 06278 g010
Figure 11. PFD of the simulated fractionation unit.
Energies 14 06278 g011
Figure 12. PFD of the export LNG loading, import terminal, and regasification plant.
Energies 14 06278 g012
Figure 13. Steps of life cycle air emissions using LNG maritime transport emission quantification tool.
Energies 14 06278 g013
Figure 14. Heat map diagram for air pollutants from several process units in LNG manufacturing and supply chain.
Energies 14 06278 g014
Figure 15. Heat map diagram for midpoint impact from several process units in LNG manufacturing and supply chain.
Energies 14 06278 g015
Figure 16. Normalized midpoint air emissions comparison of the LNG supply chain.
Energies 14 06278 g016
Figure 17. Normalized endpoint social human health impact over the LNG supply chain.
Energies 14 06278 g017
Table 1. Life cycle indicators of LNG LCA research.
Impact AreaImpact/IndicatorUnitDescription
EnvironmentalGlobal Warming Potential (GWP)kg CO2-eq.Total GHG emissions based on IPCC’s factors for GWP100 according to Assessment Report 5 (AR5)
Particulate Matter Formation Potential (PMFP)kg PM2.5-eq.Total criteria air pollutant emissions
Photochemical Oxidant Formation Potential (POFP)kg NOx-eq.Amount of airborne substances able to form atmospheric oxidants
Table 2. Chain feed conditions and products’ specifications.
NG Feed ParametersSpecifications
Temperature (°C)27
Pressure (bar)84.5
Flowrate (MMSCFD)18,146
Composition (mol%)
N23.78
H2S0.80
CO22.43
C181.3
C24.84
C31.84
C41.03
C5+2.93
BTX0.24
Mercaptans0.04
H2O0.74
He0.04
LNG Product ParametersSpecifications
Temperature (°C)−161
Higher heating value (BTU/SCF)1040
Flowrate (MMTA)126
Composition (mol%)
N20.70
C193.4
C25.90
C30.03
H2S (ppm)≤4
CO2 (ppm)≤59.2
Table 3. Preseparation unit conditions and specifications.
Specification\StreamFeed from
Off-Shore
Sour NG
to AGRU
CondensateSour Water
Temperature (°C)27.0034.5040.2428.64
Pressure (bar)84.5074.6674.6628.00
Flowrate (MMSCFD)18,145.6717,658.50368.79135.21
Composition (mol%)
N23.783.88
H2S0.800.820.010.05
CO22.432.49 0.06
C181.3083.32
C24.844.960.02
C31.841.870.50
C41.030.969.13
C5+2.931.4782.46
BTX0.240.107.80
Mercaptans0.040.040.08
H2O0.740.07
He0.040.04 99.89
Table 4. Sweeting unit conditions and specifications.
Specification\StreamSweet Gas
to Dehydration
Acid Gas to TGTAcid Gas to SRUWastewater
Temperature (°C)47.0058.91113.80127.60
Pressure (bar)68.595.001.902.30
Flowrate (MMSCFD)16,994.18237.51428.961.16
Composition (mol%)
N24.010.570.040.00
H2S0.006.5032.8927.56
CO20.0184.2766.274.51
C186.196.160.380.02
C25.140.040.000.01
C31.930.420.030.01
C40.980.320.020.01
C5+1.500.940.050.01
BTX0.090.480.260.05
Mercaptans0.040.310.060.03
H2O0.070.000.0067.79
He0.040.000.000.00
Table 5. SRU and TGT conditions and specifications.
Specification\StreamSteamFuelAirSour
Water
Water
Out
Absorber
Top
Sulfur
Temperature (°C)148.0414.9534.9925.00100.0135.00135.00
Pressure (bar)4.513.771.701.011.011.061.43
Flowrate (MMSCFD)7.538.0468.140.58437.34577.56118.43
Composition (mol%)
O2 20.95
N2 79.02 77.64
H2S 0.02
CO2 0.03 10.28
C1 95.00
C2 4.00
C3 1.00
H2O100.00 100.00100.005.28
H2 6.78
S 100.00
Table 6. Dehydration unit conditions and specifications.
Specification\StreamSour WaterDehydrated NG
Temperature (°C)24.9624.08
Pressure (bar)67.5466.81
Flowrate (MMSCFD)1.0016,817.03
Composition (mol%)
N2 4.04
CO2 0.01
C1 86.80
C2 5.12
C3 1.90
C4 0.92
C5+ 1.14
BTX 0.03
H2O100.00
He 0.04
Table 7. NGL recovery unit conditions and specifications.
Specification\StreamNG to LiquefactionNGL
Temperature (°C)36.42123.60
Pressure (bar)66.8332.20
Flowrate (MMSCFD)14,640.59723.79
Composition (mol%)
N24.20
CO20.01
C190.39
C25.331.05
C30.0346.48
C4 23.14
C5+ 28.49
BTX 0.85
He0.04
Table 8. NG liquefaction unit conditions and specifications.
Specification\StreamFrom HeFrom N2LNG
Temperature (°C)−155.30−161.90−148.40
Pressure (bar)3.181.2043.35
Flowrate (MMSCFD)13.511547.5516,487.81
Composition (mol%)
N249.9437.614.20
CO2 0.01
C12.0062.3590.39
C2 0.015.33
C3 0.03
He48.060.030.04
Table 9. HeX and NR unit conditions and specifications.
Specification\StreamCrude HeLNG Product
Temperature (°C)−155.30−161.60
Pressure (bar)3.181.20
Flowrate (MMSCFD)13.5114,931.41
Composition (mol%)
N249.940.70
H2S (ppm) ≤4
CO2 (ppm) ≤59.2
C12.0093.38
C2 5.88
C3 0.03
He48.06
Table 10. Fractionation unit conditions and specifications.
Specification\StreamLPGEthanePropanePentane Plus
Temperature (°C)16.403545130.63
Pressure (bar)32.0027.530.098.30
Flowrate (MMSCFD)1,847.237.094.61170.27
Composition (mol%)
C267.2198.021.61
C320.361.9896.44
C412.35 1.950.34
C5+0.08 97.49
BTX 2.17
Table 11. Regasification plant conditions and specifications.
Specification\StreamLNG out from TankLNG to Customers
Temperature (°C)−160.625
Pressure (bar)3.081
Flowrate (MMSCFD)14,931.4114,931.41
Composition (mol%)
N20.700.70
H2S (ppm)≤4≤4
CO2 (ppm)≤59.2≤59.2
C193.3893.38
C25.885.88
C30.030.03
Table 12. Midpoint to endpoint characterization factors.
Midpoint to the Endpoint CF Human HealthMidpoint Emission ConsideredMidpoint UnitMidpoint Impact CF (Hierarchic)Endpoint UnitEndpoint Impact CF
(Hierarchic)
Global Warming Potential
(GWP)
CO2kg CO2-eq./kg midpoint emission1.00DALY/kg CO2-eq.9.28 × 10-7
CH428.00
N2O265.00
Photochemical ozone formationNOxkg NOx-eq./kg midpoint emission1.00DALY/kg NOx-eq.9.10 × 10-7
Fine particulate matter formationSO2kg PM2.5-eq./kg midpoint emission0.29DALY/kg PM2.5-eq.6.29 × 10-4
NH30.24
NO0.17
NO20.11
SO30.23
PM2.51.00
Table 13. Midpoint impact results from several process units in LNG manufacturing and supply chain.
Emission SourceGlobal Warming
(kg CO2-eq)
Photochemical Ozone Formation
(kg NOx-eq)
Fine Particulate Matter Formation
(kg PM2.5-eq)
Natural gas extraction53,648,395.3478,932.647740.91
Preseparation unit3,630,834.4114,129.751,308,947.10
MDEA Sweetening unit25,414,306,084.39367,511,207.6167,015,269.55
SRU and TGTU units569,820,482.4850,239,730.241,483,250,846.87
Dewatering unit9,591,964,940.34226,246,569.6140,551,701.60
NGL recovery and fractionation units65,316,380.97118,701.7933,094.41
Liquefaction unit21,012,275,442.69469,812,499.2779,849,788.70
LNG loading (export terminal)42,201,635,518.841,043,728,533.51177,395,647.88
LNG shipping742,164,478.681,522,491.68925,655.30
LNG receiving terminal4,933,090,400.29122,400,674.0020,803,647.24
Publisher’s Note: MDPI stays neutral with regard to jurisdictional claims in published maps and institutional affiliations.

