Article

Experimental Characterization of Lithium-Ion Cell Strain Using Laser Sensors

Department of Mechanical and Aerospace Engineering, Politecnico di Torino, Corso duca degli Abruzzi 24, 10129 Torino, Italy
*
Author to whom correspondence should be addressed.
Energies 2021, 14(19), 6281; https://doi.org/10.3390/en14196281
Submission received: 1 July 2021 / Revised: 9 September 2021 / Accepted: 28 September 2021 / Published: 2 October 2021
(This article belongs to the Special Issue Performance Test and Thermo-Mechanical Modeling of Lithium Batteries)

Abstract

:
The characterization of thickness change during operation of LFP/Graphite prismatic batteries is presented in this work. In this regard, current rate dependence, hysteresis behaviour between charge and discharge and correlation with phase changes are deepened. Experimental tests are carried out with a battery testing equipment correlated with optical laser sensors to evaluate swelling. Furthermore, thickness change is computed analytically with a mathematical model based on lattice parameters of the crystal structures of active materials. The results of the model are validated with experimental data. Thickness change is able to capture variations of the internal structure of the battery, referred to as phase change, characteristic of a certain state of charge. Furthermore, phase change shift is a characteristic of battery ageing. Being able to capture these properties with sensors mounted on the external surface the cell is a key feature for improving state of charge and state of health estimation in battery management system.

Graphical Abstract

1. Introduction

Currently, lithium-ion batteries (LIB) are among the most widespread rechargeable energy storage systems, and play a crucial role in a wide field of applications, from micro electronic up to heavy-duty vehicles [1,2,3]. A reliable state of charge (SOC) estimation and the understanding of mechanical characterization of LIB are still discussed arguments among the international research community. The former is needed to optimize battery management and to give a correct estimation of the battery state to the consumer. The latter is involved in the study of battery degradation and damage.
Current LIB technology is based on intercalation materials, this means that lithium ions are inserted and extracted in the active material of positive and negative electrode during battery operation. The intercalation of lithium ions in the host material causes a structural deformation of the crystal structure, which leads to strain and stress in electrodes, and causes mechanical degradation eventually [4,5,6,7]. The extent of electrode deformation was recently measured through in situ technique [8], and can also be sensed macroscopically by measuring the swelling/shrinkage of battery surfaces.
Most of the active materials in LIB expand during insertion and shrink during extraction. The most common active material for negative electrode is graphite, which expands about 13% when fully lithiated [9]; cathode materials expand when lithiated as well, with the exception of LCO, which swells when delithiated because of the repulsion of oxygen layers [9]. As reported by Koyama et al. and Koerver et al. [9,10] the volume strain of popular cathode materials is: 6.5%—lithium iron phosphate (LFP), −1.9%—lithium cobalt oxide (LCO), 7.3%—lithium manganese oxide (LMO), 2 ÷ 6.5%—lithium nickel manganese cobalt oxide (NMC) depending on nickel content, 6%—lithium nickel cobalt aluminium (NCA). These observations explain why batteries swell during charge: lithium ions are extracted from positive and inserted in negative electrode, whose expansion is greater than the contraction of cathode. For the same reason, batteries shrink during discharge. Active materials undergo phase transitions, which means that crystal structure modifies with the extent of intercalated lithium. The mutation of crystal structure is accompanied with the change of volume deformation of the active material itself.
A couple of reviews presented the state-of-art of deformation measurements in LIB [11,12], deepening in situ techniques, such as Bragg optical fibre, digital image correlation (DIC) and curvature measurements.
Macroscopic swelling of LIB can be detected experimentally both as a displacement of the surfaces or as a force exerted on the battery constraints. The force is commonly measured with load cells [13,14,15], on the other hand displacement is measured with different techniques, such as eddy current device [16], Bragg fibre sensor [17], dial gauge [18,19,20,21] and strain gauge [22]. Other authors tried to compute the internal strain directly on electrode via in situ measurements with optical fibre sensor [8,23,24] and digital image correlation (DIC) [25]. This type of measurements is definitely more demanding because of the corrosive environment inside the battery [26].
Some of the works cited above [13,14,15] correlated bulk force measurements with SOC, thanks to the impact of electrochemical transformations of active materials on structural changes of the battery itself. Furthermore, other authors [14,20,22,27] demonstrated the existence of the correlation between strain or force measurements and state of health (SOH). In particular, Willenberg et al. [22] proved that an irreversible swelling is detected in aged battery, probably because of the increasing internal pressure due to solid electrolyte precipitation, as confirmed by Schmitt et al. [28].
However, there is a lack in the literature about swelling characterization of LFP/graphite batteries during charge and discharge at various current rates, as far as the authors know. The thickness change measurements performed on the surface of prismatic LFP/graphite batteries during their operation are presented in this work. The characterization of thickness change at various current rates during charge and discharge is provided as well. Thickness change curves are compared with the respective open circuit (OCV) data to extrapolate the correlation between mechanical deformation and phase transitions in active materials. Finally, a simplified mechanical model able to interpolate the experimental thickness change is presented. The model is based on the lattice parameters of crystal structures of active materials available in literature.

2. Methods

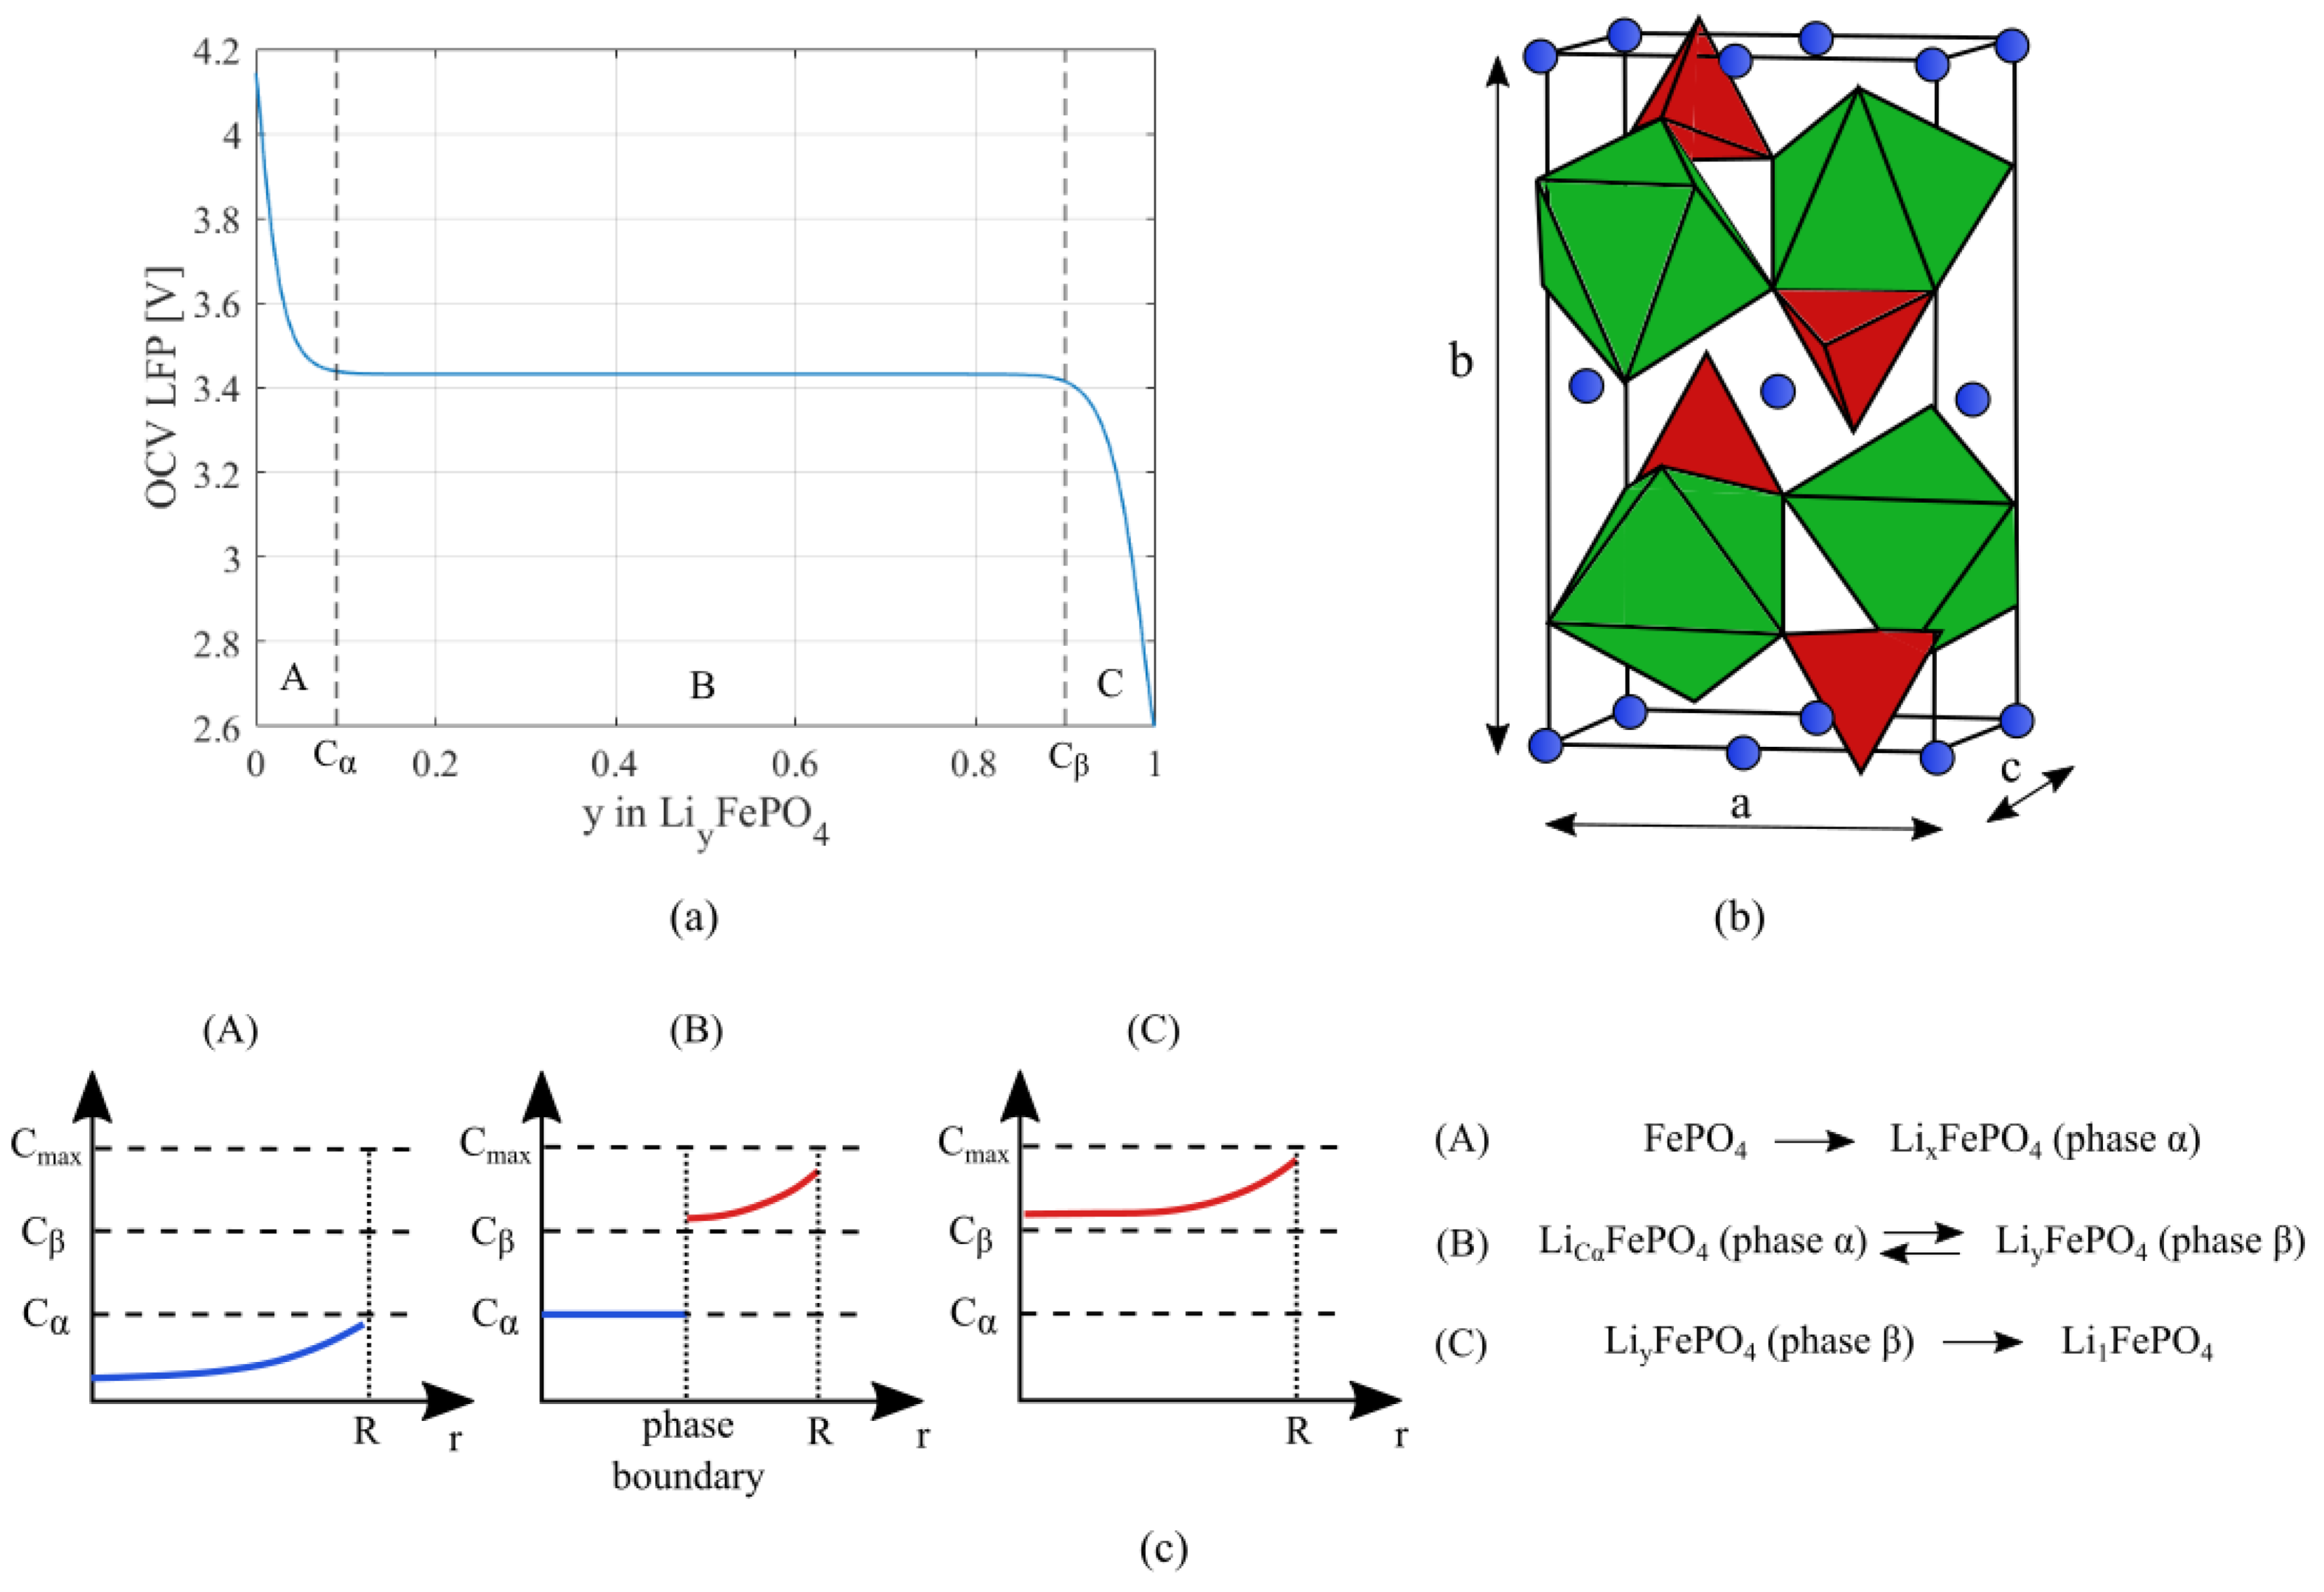
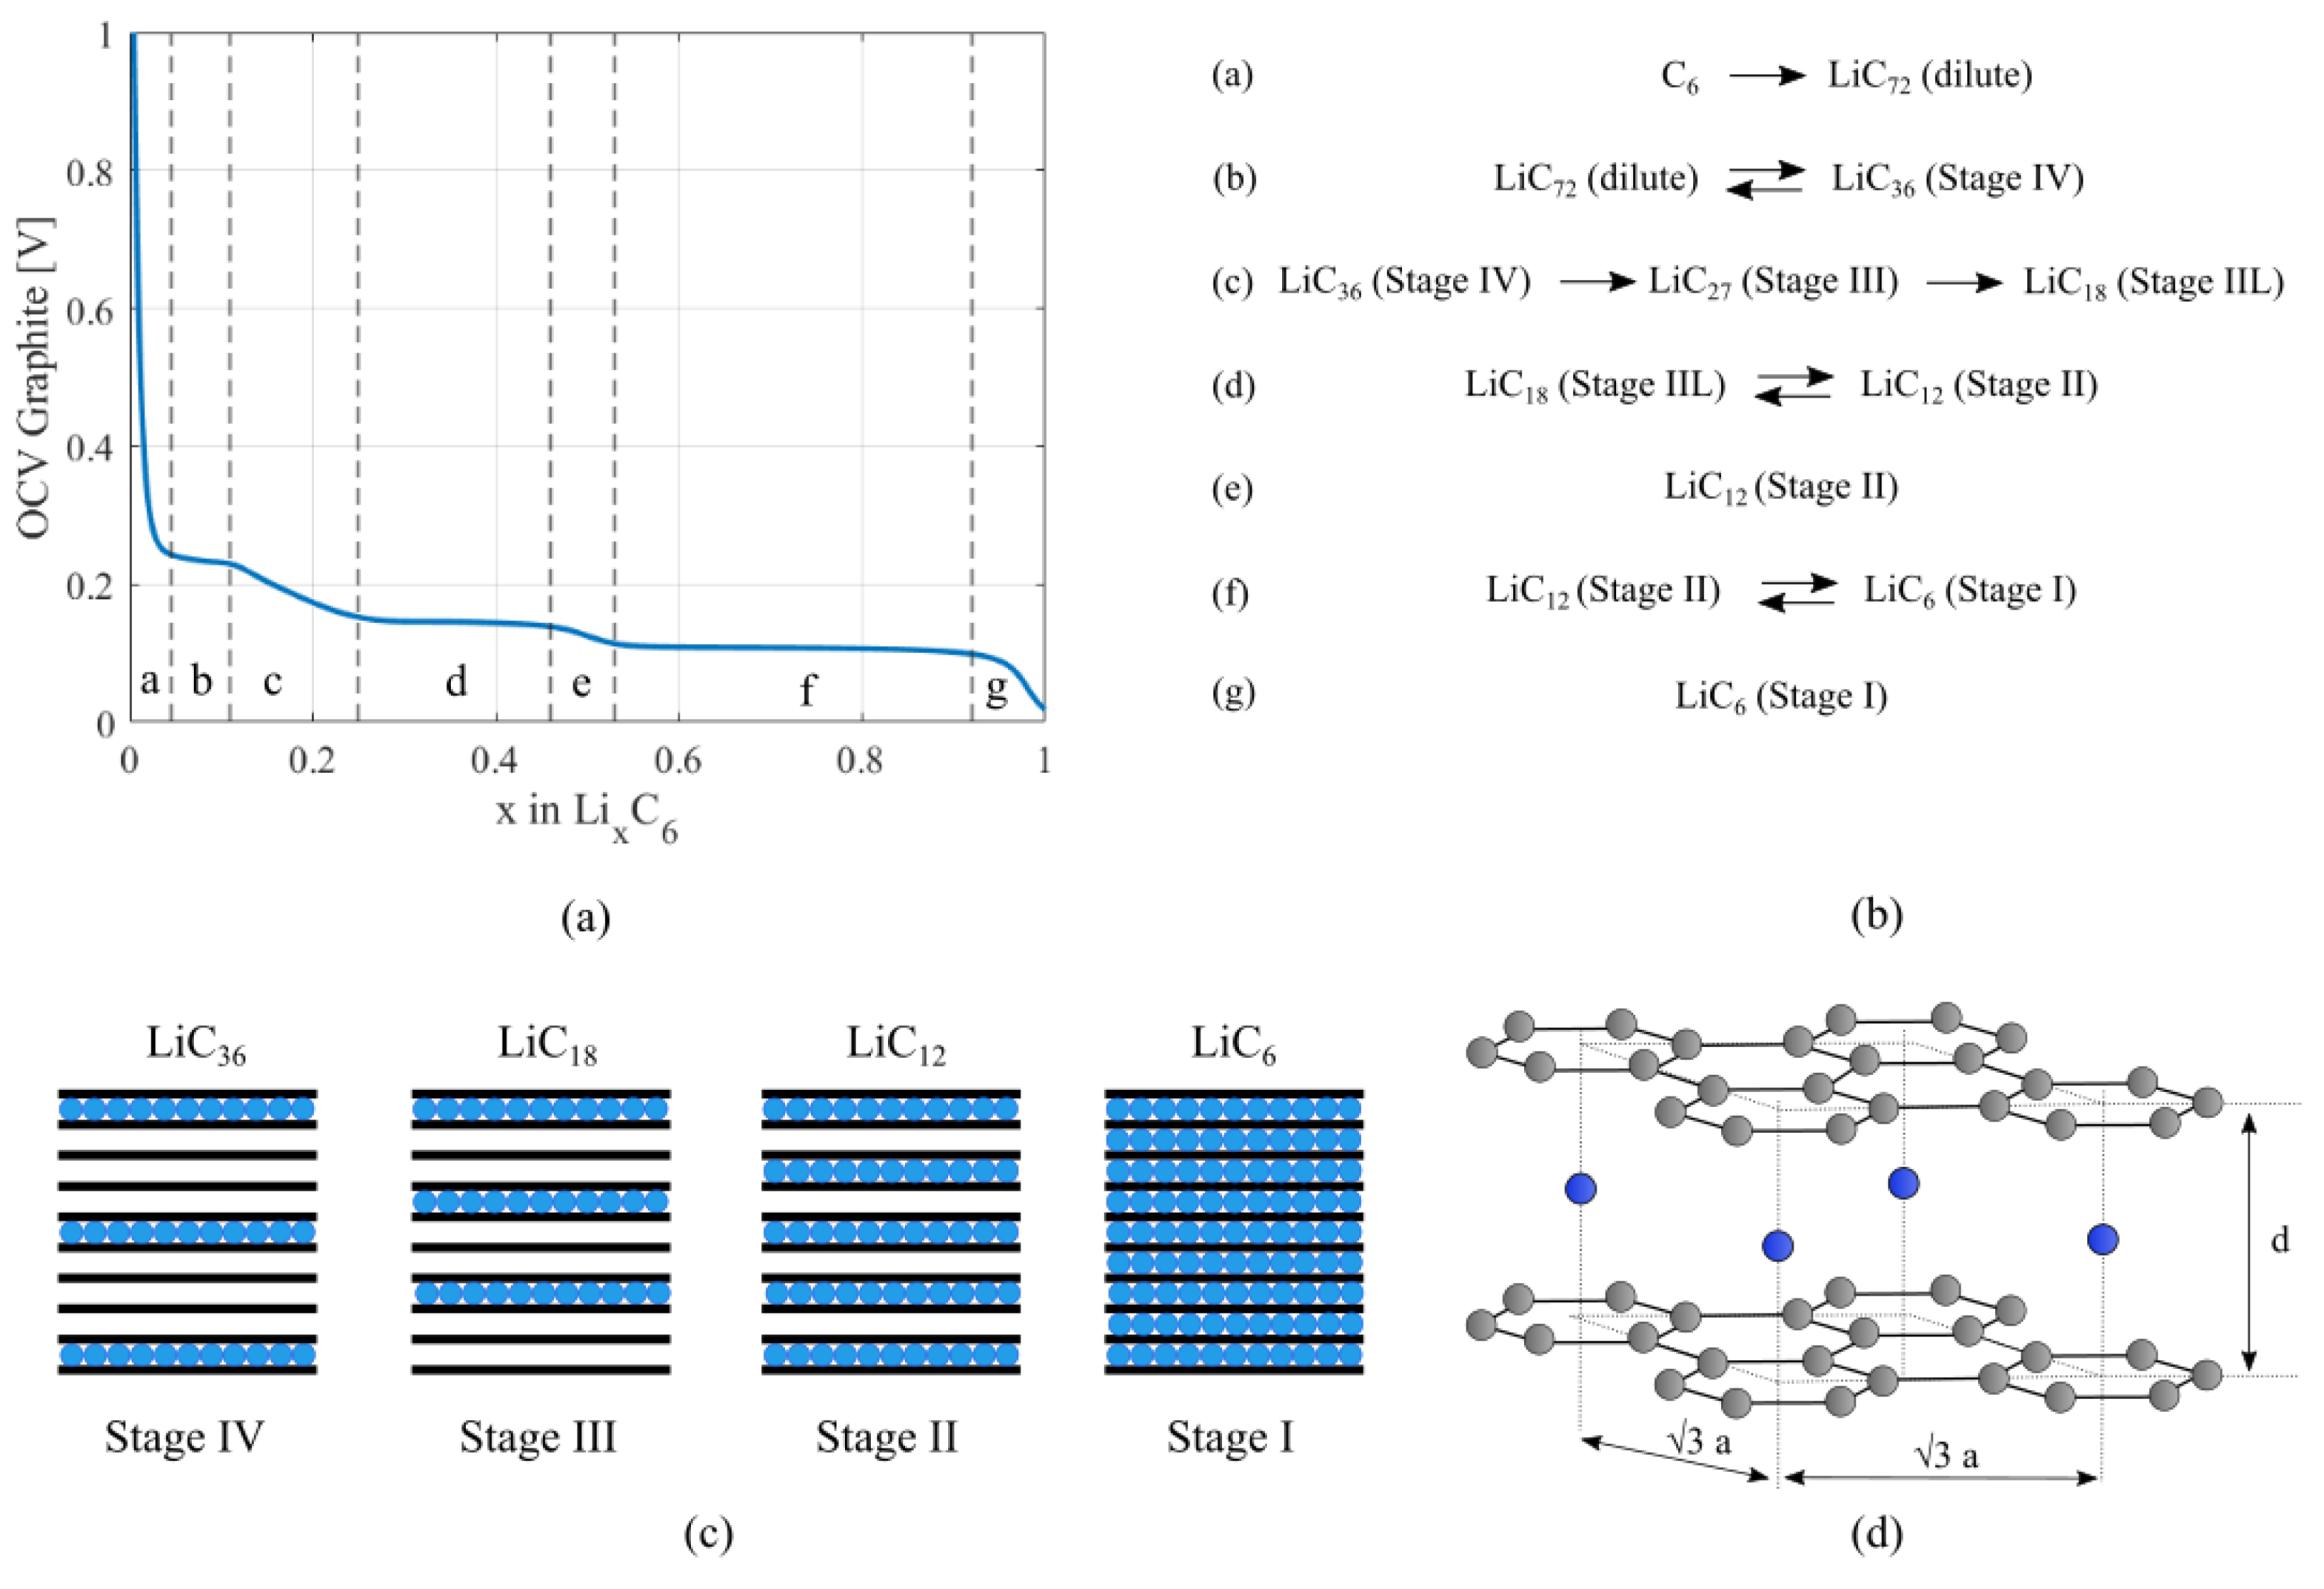
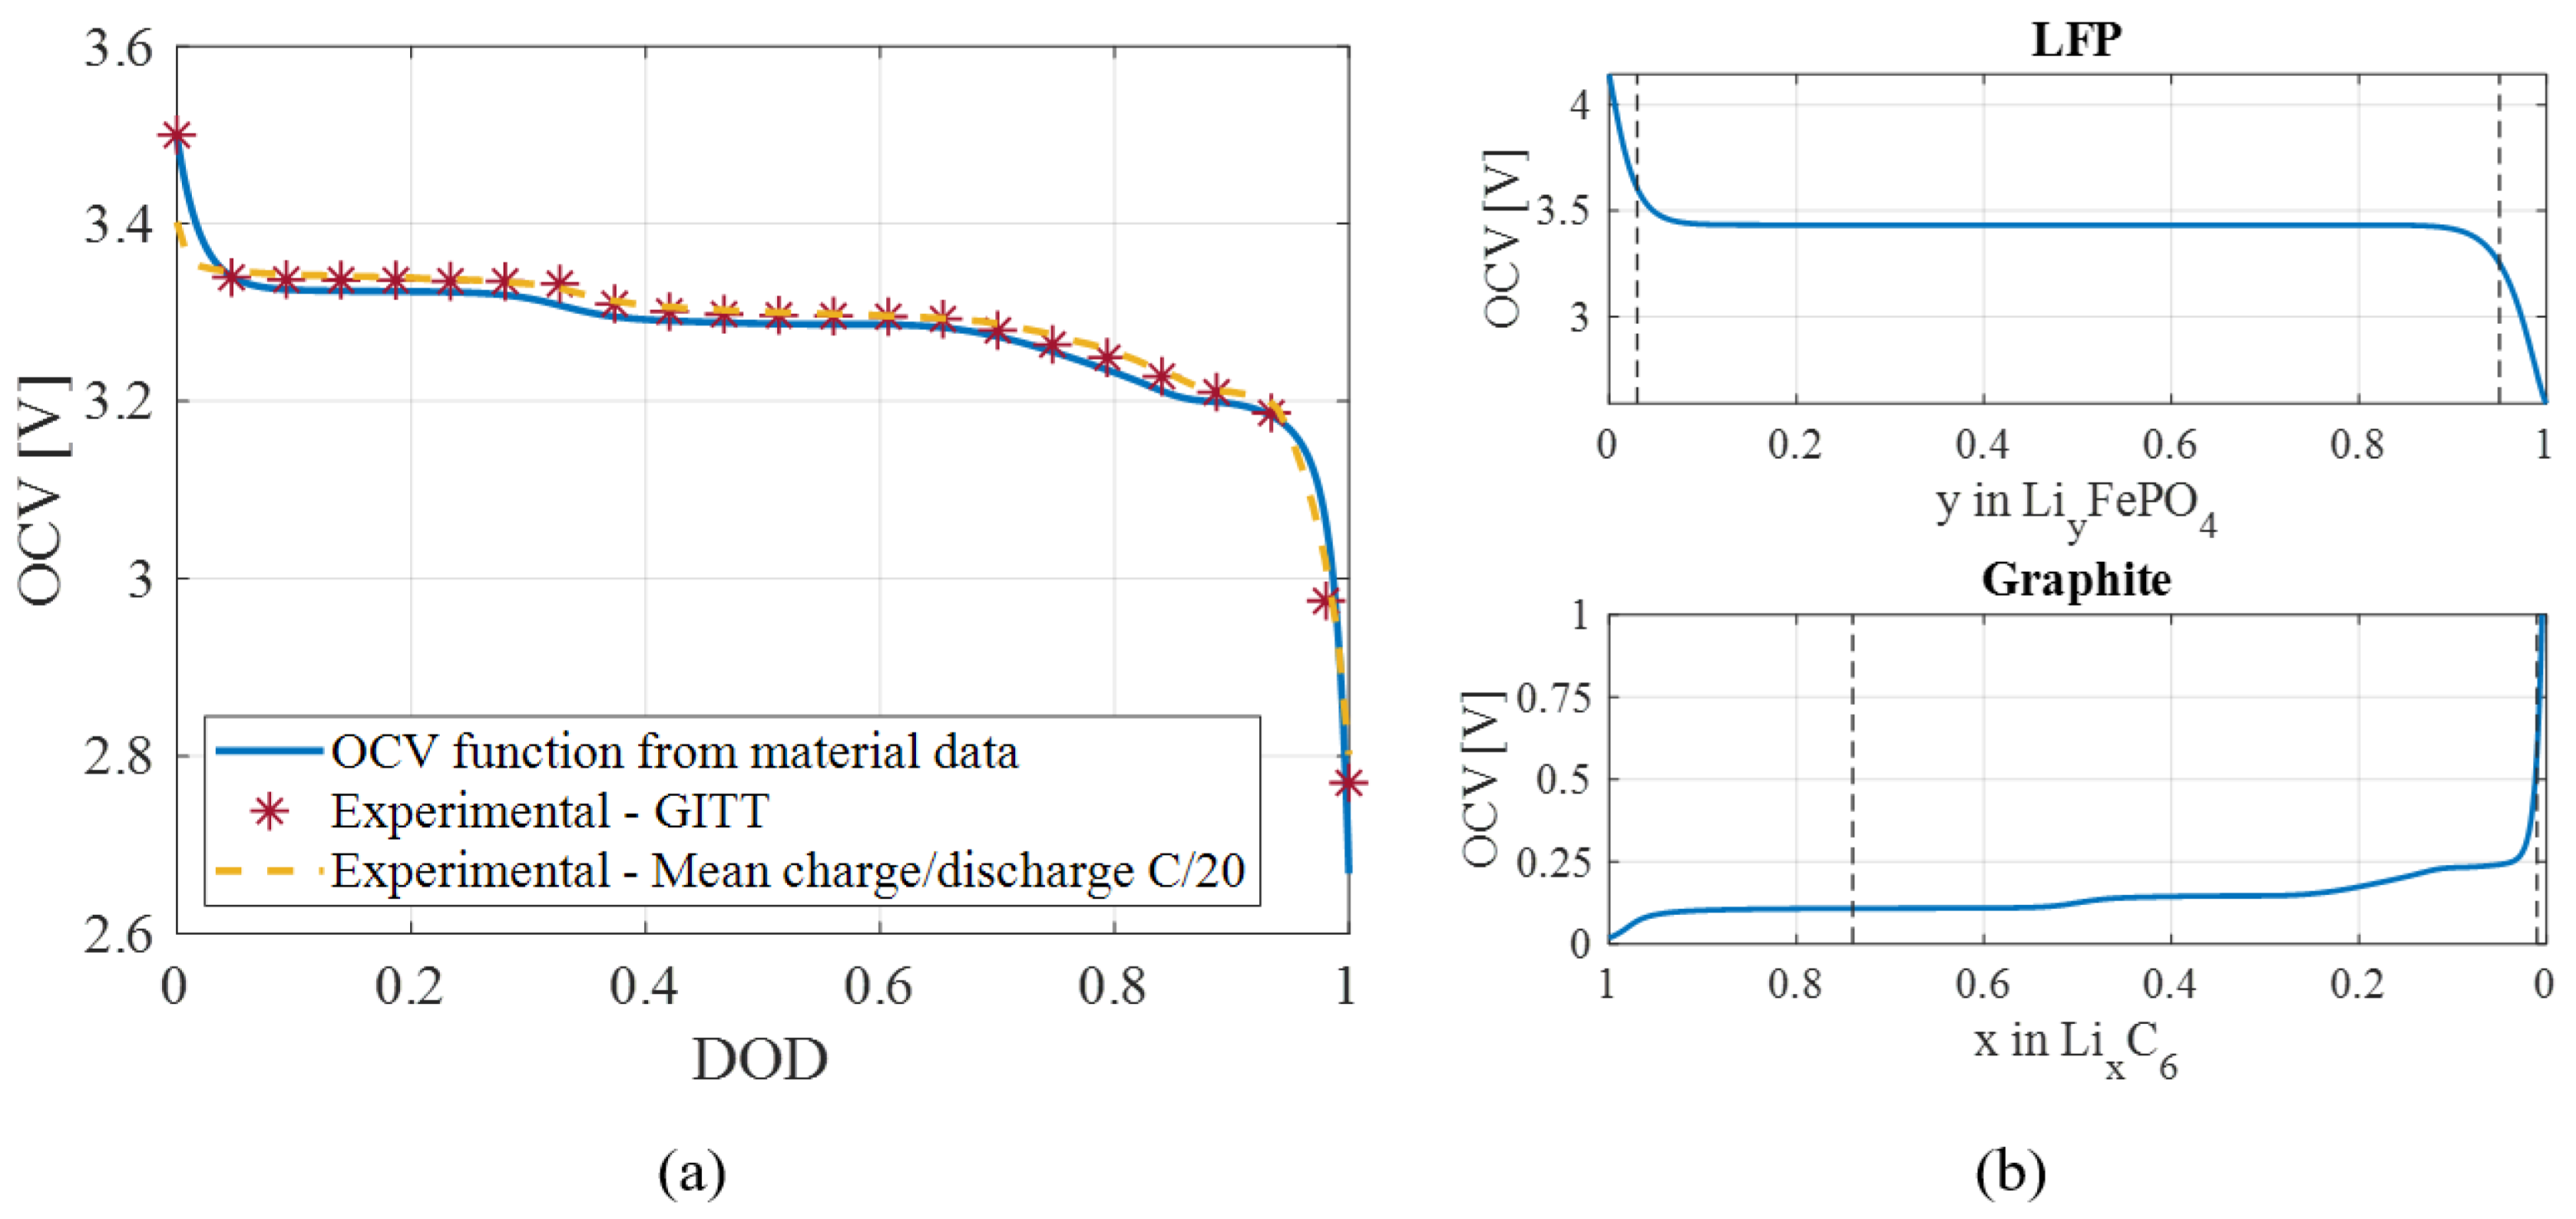
2.1. Crystal Structure of Active Materials

LIBs are characterized by a certain voltage as a function of SOC, referred as open circuit voltage (OCV), when they are in thermodynamic equilibrium. Ideally, OCV can be measured as a function of the depth of discharge (DOD), discharging the cell with an extremely low current rate.
OCV of the battery is computed as the difference between OCV of electrodes, calculated with respect to the metal lithium reference electrode. OCV of single electrodes, reported in Figure 1a from Christensen and Newman [29] for graphite and in Figure 1b from Safari et al. [30] for LFP, gives fundamental information about the electrochemical processes that take place during lithium (de)intercalation.
Active material has a single phase in the stoichiometric range where the OCV curve has a negative slope. On the other hand, there is a mixture of coexisting phases whether the OCV curve is flat [31]. Therefore, graphite has two main phase transitions as two plateaus are present in Figure 1a, and LFP has just one long phase transition according to Figure 2a.
Several graphite intercalation compounds (GICs) are formed as a result of lithium intercalation according to a “staging mechanism”, which means that lithiated graphite changes its structure according to a concentration-dependent manner. Graphite ( C 6 ) is composed by a sequence of graphene layers, as lithium ions enter the host structure, they intercalate between the so-called intercalate layers. GICs are composed by a periodic sequence of intercalate layers separated by carbon layers that does not host any intercalant species, as shown in Figure 1c. The distribution of lithium ions inside graphene layers follows a thermodynamic approach based on the interplay between the energy needed to expand the gap between two graphene layers, and the repulsive interaction between intercalate layers. Initially, lithium ions intercalate in the most favourable carbon layers, leaving a gap between them to avoid interference. The less favourable layers begin to be intercalated as soon as the energy available for intercalation increases, overcoming the repulsive energy, until all the layers are intercalated [32], as sketched in Figure 1c. The number of carbon layers between two intercalate layers is known as stage number of the GIC, referring to Figure 1c.
As resumed in Figure 1b, mainly five GICs form as the lithiation index x goes from 0 to 1. Lithiation index is the stoichiometric coefficient in L i x C 6 , which tells how many moles of lithium ions are stored in graphite structure. A dilute solution takes place at the beginning, since lithium ions are distributed messily in the intercalate layers. Then, a first short transition occurs in range “b” with the coexistence of dilute solution and stage IV compound, corresponding to the first small plateau in Figure 1a. A succession of GICs able to host an increasing amount of lithium ions takes place in range “c”, without the coexistence of any of them since OCV has a negative slope. Actually, the transitions in range “c” are still not completely clear: as lithium diffusion through the plane is impossible, a modified theory was presented by Daumas [32,33], and it is still under debate. Then the main two phase transitions take place in range “d” and “f”. In range “d” there is a mismatch between lithiation (charge) and delithiation (discharge): stage IIL appears just during delithiation, and stage III converts directly in stage II during lithiation, as observed by several authors [33,34,35,36,37]. This asymmetry may be explained with a thermodynamic consideration: a liquid phase is favoured during deintercalation because the ions are removed randomly from the intercalate layers, requiring a minimum structural reorganization. On the other hand, ordered structures are preferred during intercalation to minimize the repulsion between ions, and a liquid phase would require complex structural reorganization [33]. The conversion between stage II and stage I, namely the fully lithiated configuration, occurs in the last plateau.
On the other hand, LFP follows a more straightforward lithiation path. It consists of a long phase transition between the Li-poor ( α ) and Li-rich ( β ) phase, as confirmed by the long plateau in the OCV curve, shown in Figure 2a, that spans for almost the whole SOC window.
At the beginning of lithium insertion LFP forms a single Li-poor phase α . Once the saturation concentration of alpha phase ( C α ) is reached, a new Li-rich phase β forms on the particle surface, characterized by a greater equilibrium concentration C β . The Li-rich phase marks a clear boundary with phase α , referred as moving boundary, since it moves towards the particle core as further lithium is intercalated in the particle. When the whole particle is occupied by the Li-rich phase, diffusion takes place until the saturation (maximum) concentration is reached all over the particle [38,39], as shown in Figure 2c.
Figure 2. OCV of LFP (a) and description of phase transition (c): blue lines refer to Li-poor phase, and red lines refer to Li-rich phase. Crystal structure of L i F e P O 4 correlated with its lattice parameters (b): tetrahedra refer to P O 4 , octahedra to F e O 6 and blue spheres to lithium ions [39].
Energies 14 06281 g002
Each phase is characterized by its own lattice parameters, which characterize the material expansion induced by lithium intercalation. As a consequence, active material expansion is not linear through the whole stoichiometric window, but it is affected by the changes in lattice parameters caused by phase transitions.
The crystal structure of graphite is made by stacked hexagonal planar structures, and lithium ions intercalate between two planes at the centre of the hexagon, as shown in Figure 1d. The lattice parameters of GICs are planar distance “ 3 a ” and distance between two planes “d”, as sketched in Figure 1d. Graphite structure is actually slightly more complicated, the reader is suggested to refer to other works for further details [33]. Then, crystal structure is an hexagonal prism, whose main volume variation is due to inter-planar (d) deformation, as the planar distance experiences slight variations.
On the other hand, LFP has a cubic crystal structure, shown in Figure 2b, which expands almost isotropically as lithium ions are intercalated. The expansion of LFP is linear in the whole stoichiometric window, since just two phases are involved.
Lattice parameters data of graphite and LFP are reported in Table 1. For what concerns graphite, each GIC is characterized by a certain volume fraction as a function of lithiation index x. Furthermore, GICs volume show a dependence on lithium content (x) in turn, which is very weak for the last stages, but not negligible for the early ones [33,35,36,37]. The mean values of lattice volume are reported in Table 1 for each GICs. Then, the equivalent volume as a function of lithiation index is given by the summation of all GICs volume by their volume fraction as a function of x, as shown in Equation (1).
V ( x ) = i = 1 Z V i ˜ ( x ) f i ( x )
where V ( x ) is the equivalent volume, V i ˜ ( x ) and f i ( x ) are the volume and the volume fraction of the i-th GIC as a function of lithiation index x, respectively, and Z is the number of GICs, namely five as shown in Table 1.
Then, volume deformation of graphite as a function of x is computed in Equation (2).
ε v ( x ) = V ( x ) V 0 V 0
The result of Equation (2) is reported in Figure 3a in the typical lithiation window of LIB. Comparison with OCV highlights the relation between volume discontinuity and phase change. Graphite will characterize the shape of the overall swelling/shrinkage curve with the three characteristic areas, identified by solid black lines in Figure 3a.
Then, volume deformation of LFP as a function of its lithiation index y is calculated with Equation (2) directly with the volume V ˜ of L i F e P O 4 , because there is just one transition from initial to final phase. The volume deformation of LFP is shown in Figure 3b.

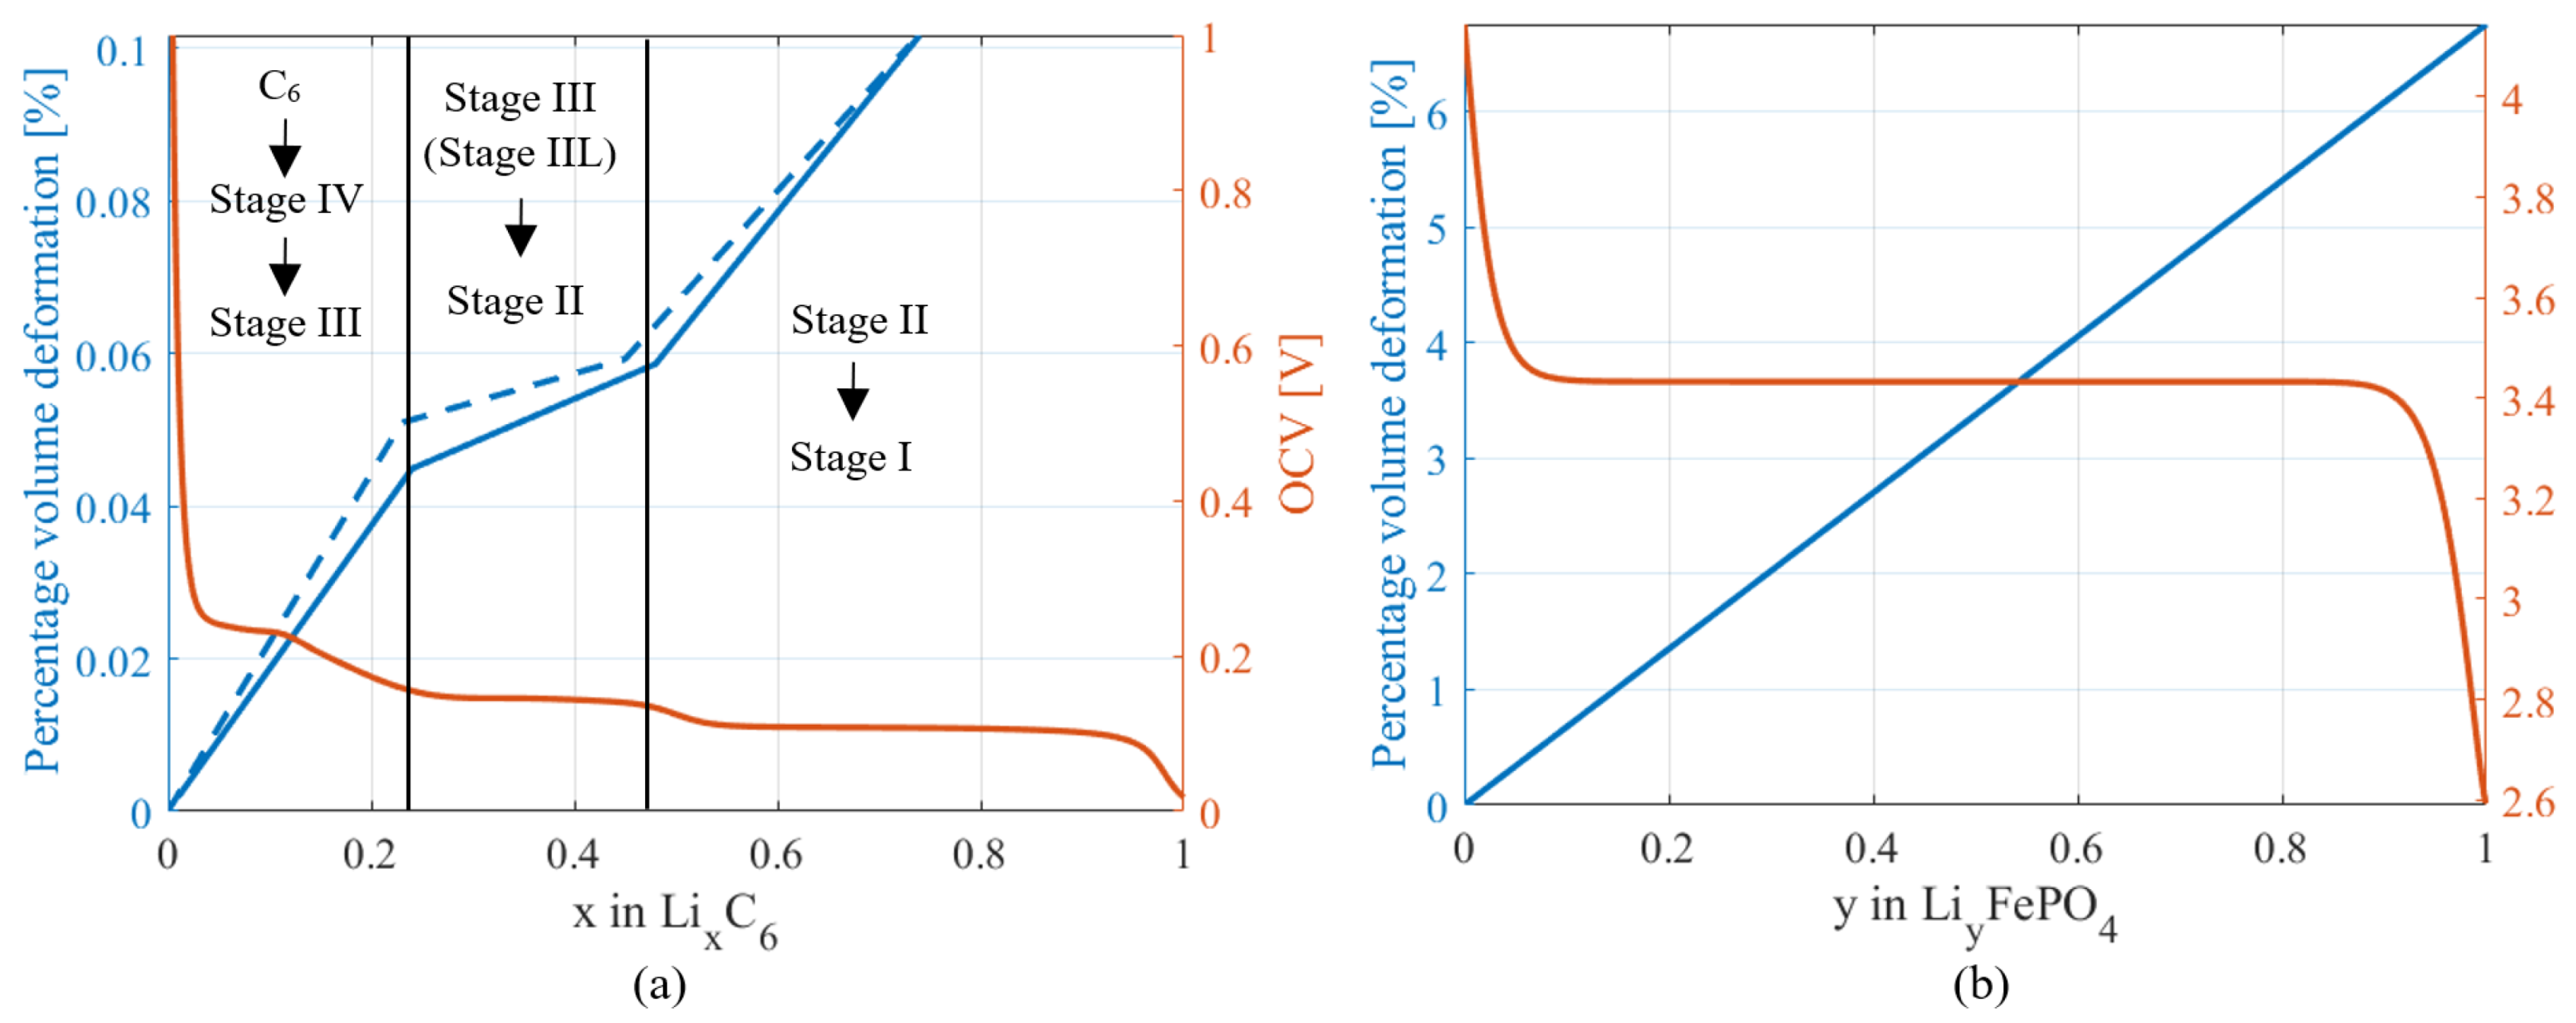
2.2. Mechanical Model

The correlation between micro-structural volume changes of active materials and the swelling/shrinkage of the cell is explained in this section.
Electrodes are made of active material particles, which are responsible of volume changes when (de)lithiated, and other compounds, such as binder, conductive materials and additives, which do not contribute to deformation.
Crystal structure of active materials does not deform isotropically during lithium (de)intercalation: the variations of lattice parameters, which mainly correspond to the three spatial dimensions, are not equal, as reported in Table 1. Nevertheless, it is reasonable to assume that all active material particles are not aligned with the same orientation, but they are randomly distributed during the manufacturing processes. This fact allows to assume an overall isotropic deformation of the electrodes.
Then, the linear deformation coefficient is equal in the three directions under the assumption of isotropic material, and it is computed in Equation (2). Hence, the thickness change of a single electrode layer is expressed as follow in Equation (3).
Δ t i = ε v , i t i ζ i
where Δ t i is the thickness change of a single electrode layer, ε v , i is the percentage volume change of the active material, t i is the nominal thickness of electrode layer and ζ i is the active material volume fraction in the electrode layer. Subscript i stays for positive or negative electrodes.
Referring to Figure 4, batteries consist of a number of stacked elementary cells which allow them to reach the nominal capacity. The elementary cell consists in turn of current collectors, electrodes and a separator. Therefore, the swelling measured on the cell surface is the result of swelling superimposition of each elementary cells, whose deformation is caused by swelling/shrinkage of positive and negative electrodes, as described in Equation (4).
Δ t c = M ε v , P t P ζ P + ε v , N t N ζ N
where the subscripts P and N stay for positive and negative electrode, and M is the number of elementary cells. The total thickness change computed in Equation (4) is the same measured on the external surface of a pouch cell, whose case is really flexible. An additional stiffness needs to be considered in case of prismatic or cylindrical cell, as the metallic case acts as a constraint and mitigates the volume change of the active materials, affecting mechanical stress in electrode [6] as well.

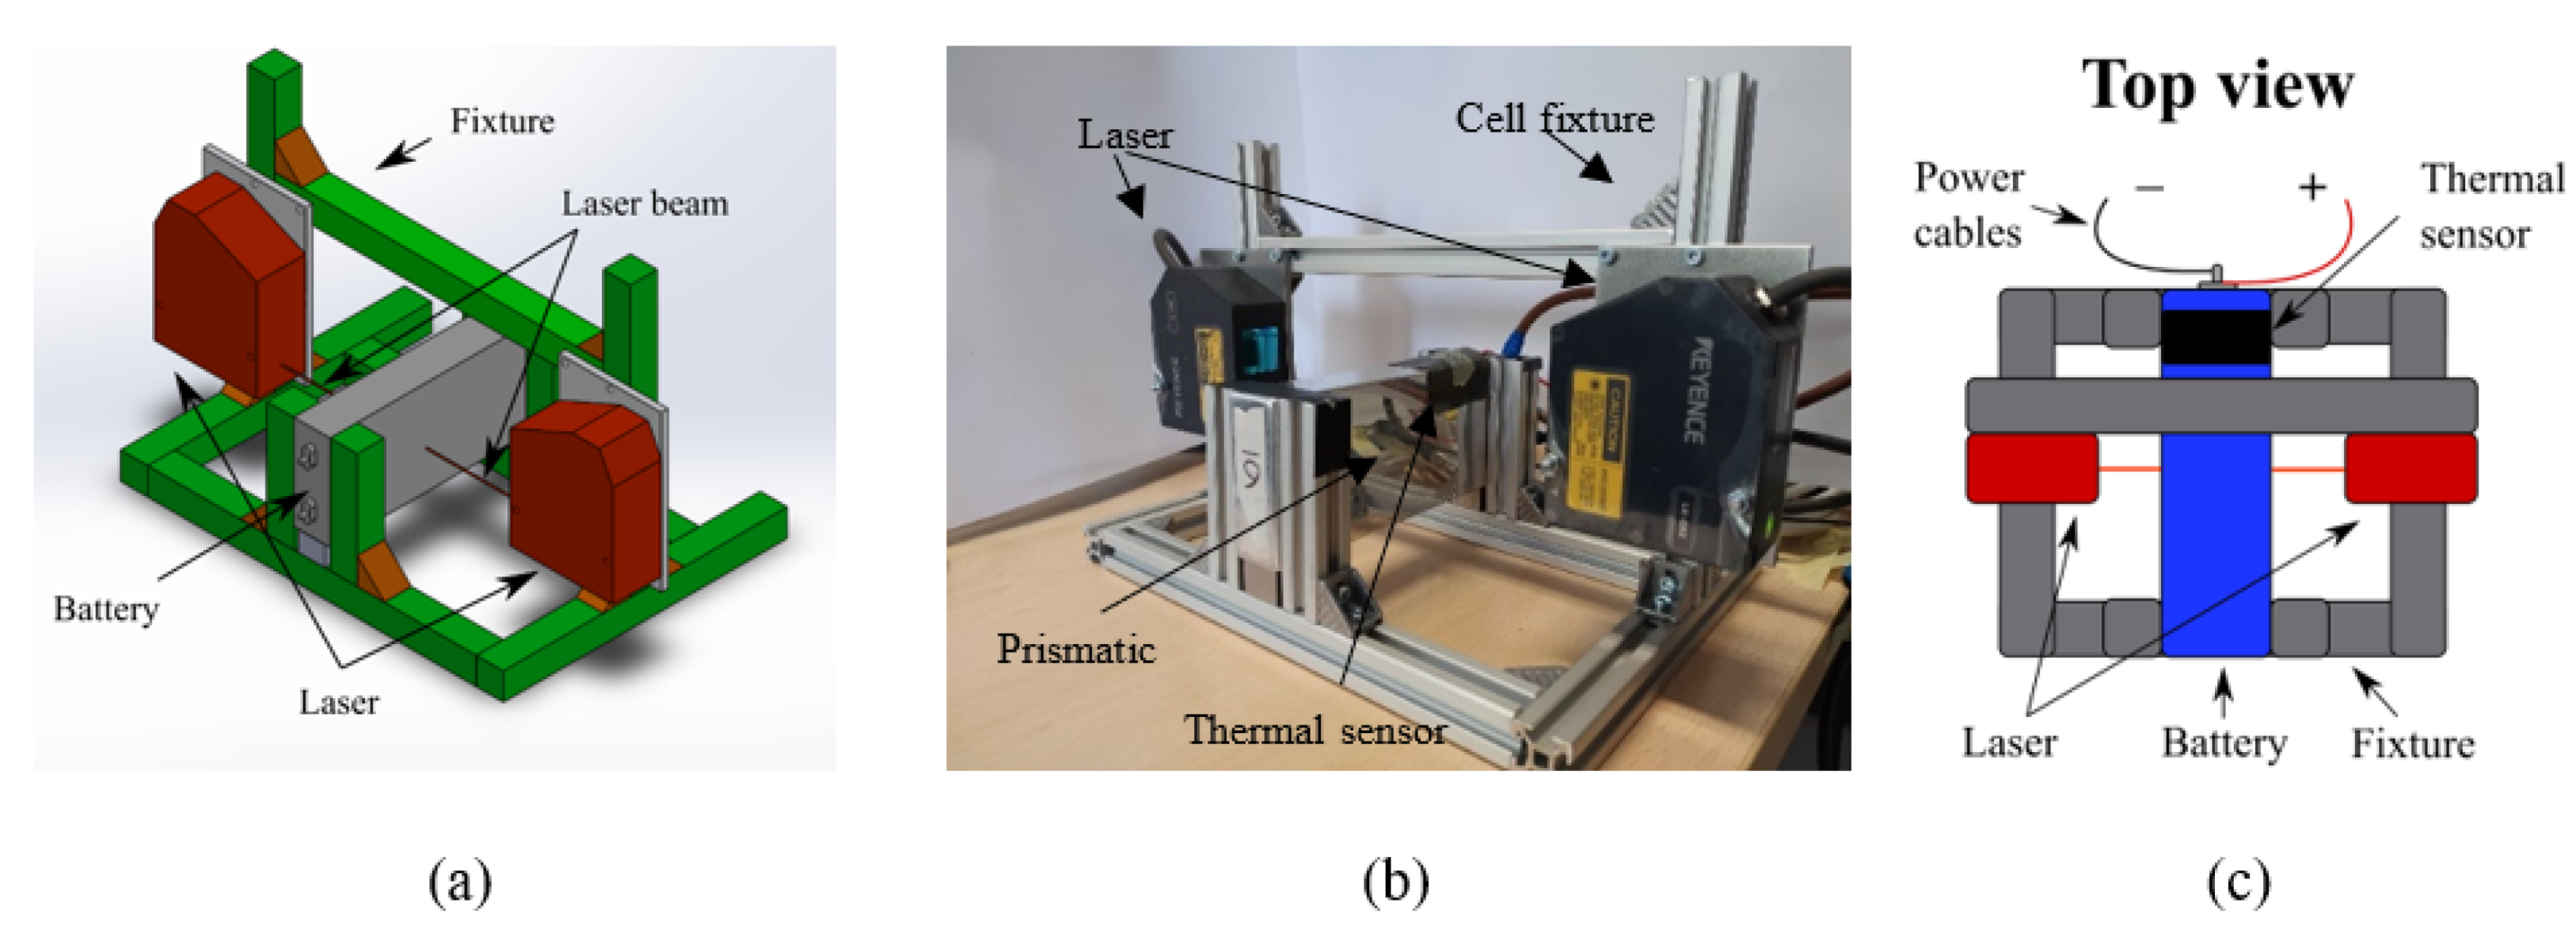
3. Experimental Set-Up

The test bench consists of a power supply “QPX600DP” by Aim-TTi, an electronic load “EL 9080-400” by Elektro-Automatik and a couple of laser sensors “LG-K82” by Keyence mounted on a designed fixture, shown in Figure 5.
The benchmark is controlled in real time by the National Instruments controller “NI PXIe-8840”.
The thickness change measurements are performed with a couple of laser sensors which sense the displacement of the cell case. The sum of the measurements of the couple of sensors gives the amount of thickness change. The sensors have a linearity error of ± 7.5 μ m, which is about 7% of the maximum displacement measured by each sensor in these tests. The sensors are mounted on a dedicated structure, which ensures the perfect perpendicularity between laser beam and cell surface and keeps the cell fixed during the acquisition process, as shown in Figure 5. The position of laser sensors can be tuned by sliding guides, as a consequence, displacement measurements can be performed in every point of the cell surface. Anyway, measurements were carried out just in the central point of the larger surfaces, as shown in Figure 5a. The roughness of the cell surface is low enough to not influence the measurements; however, it does not affect differential thickness.
Initially, the displacement measurements were carried out during charge and discharge with a very low current rate (C/10). The test was repeated three times on the same cell, then the same procedure was carried out on three different cells. Later, the displacement measurements were carried out with higher C-rate, namely C/2, 1C and 2C.
OCV was computed experimentally according to the galvanostatic intermittent titration technique (GITT) and with continuous (dis)charging technique with low current rate. GITT consists in several pulsed discharges at homogeneous SOC intervals, the voltage value measured at the end of the rest period after each pulses is the OCV of that step. The rest period must be long enough to allows the cell to reach the thermodynamic equilibrium after the discharge, identified usually with a potential increase lower than 5 mV/h. A continuous discharge at typically 1C allows to span thorough the SOC window of the cell. Then, OCV is calculated in discrete points with a SOC interval based on the length of the continuous discharge step [40].
Alternatively, OCV was computed with slow current <C/20) (dis)charge, so that the thermodynamic equilibrium is almost not perturbed. The discharge process makes the voltage lower than the actual OCV, vice versa the charge. Then, the actual OCV is computed as the mean between the voltage measured during charge and discharge. The more the current is low, the more the single measurement (in charge or discharge) tends to real OCV.
The temperature issue was studied during tests design, to ensure that the thermal contribution to deformation is negligible as compared to the electrochemical one. Temperature contribution is twofold: cell temperature raised during the test, especially during discharge, as well as ambient temperature slightly changed, even if it was regulated at 20 ° C in laboratory. The rise of cell temperature causes its swelling, on the other hand ambient temperature changes affect the dimensions of the fixture which fixes the cell and holds the laser. Concerning the cell temperature, the cell is made up by several materials, whose thermal expansion coefficients are: aluminium (case and current collector)— 24 × 10 6 K 1 , copper (current collector)— 17 × 10 6 K 1 , LFP (electrode)— 53 × 10 6 K 1 , graphite (electrode)— 3.6 × 10 6 K 1 , polypropylene (separator)— 72 × 10 6 K 1 , plus electrolyte and other additives inside the electrodes. A reasonable thermal expansion coefficient of the whole cell is about 25 ÷ 30 × 10 6 K 1 , considering the thickness of each layer. Then, considering the maximum temperature variation of 13 ° C registered at the end of 2C discharge, and an initial length of 27 mm, it leads to a maximum thickness change caused by temperature of 10.5 μ m, which is about 5% of the total thickness change measured at the end of each test, below the error of the sensor. Concerning ambient temperature, a maximum temperature change of 2 ° C is considered, even if the actual value was lower. Considering half of the structure, ambient temperature change causes an elongation of 6 μ m of the aluminium fixture, which means an error of 6% over the maximum thickness change measured by each sensor. This value is still below the error of the sensor itself. The two contributions cancel each other, as a cell temperature increase causes the cell to swell, and an ambient temperature increase causes the fixture to elongate, then the sensors move away and the measured thickness change is lower than the real one. In the end, it is confirmed that temperature influence on cell thickness change is negligible as compared to the electrochemical phenomena, this fact is even confirmed a posteriori, as the tests with different current rates (and then different cell temperatures) produce the same maximum thickness change.

4. Results and Discussion

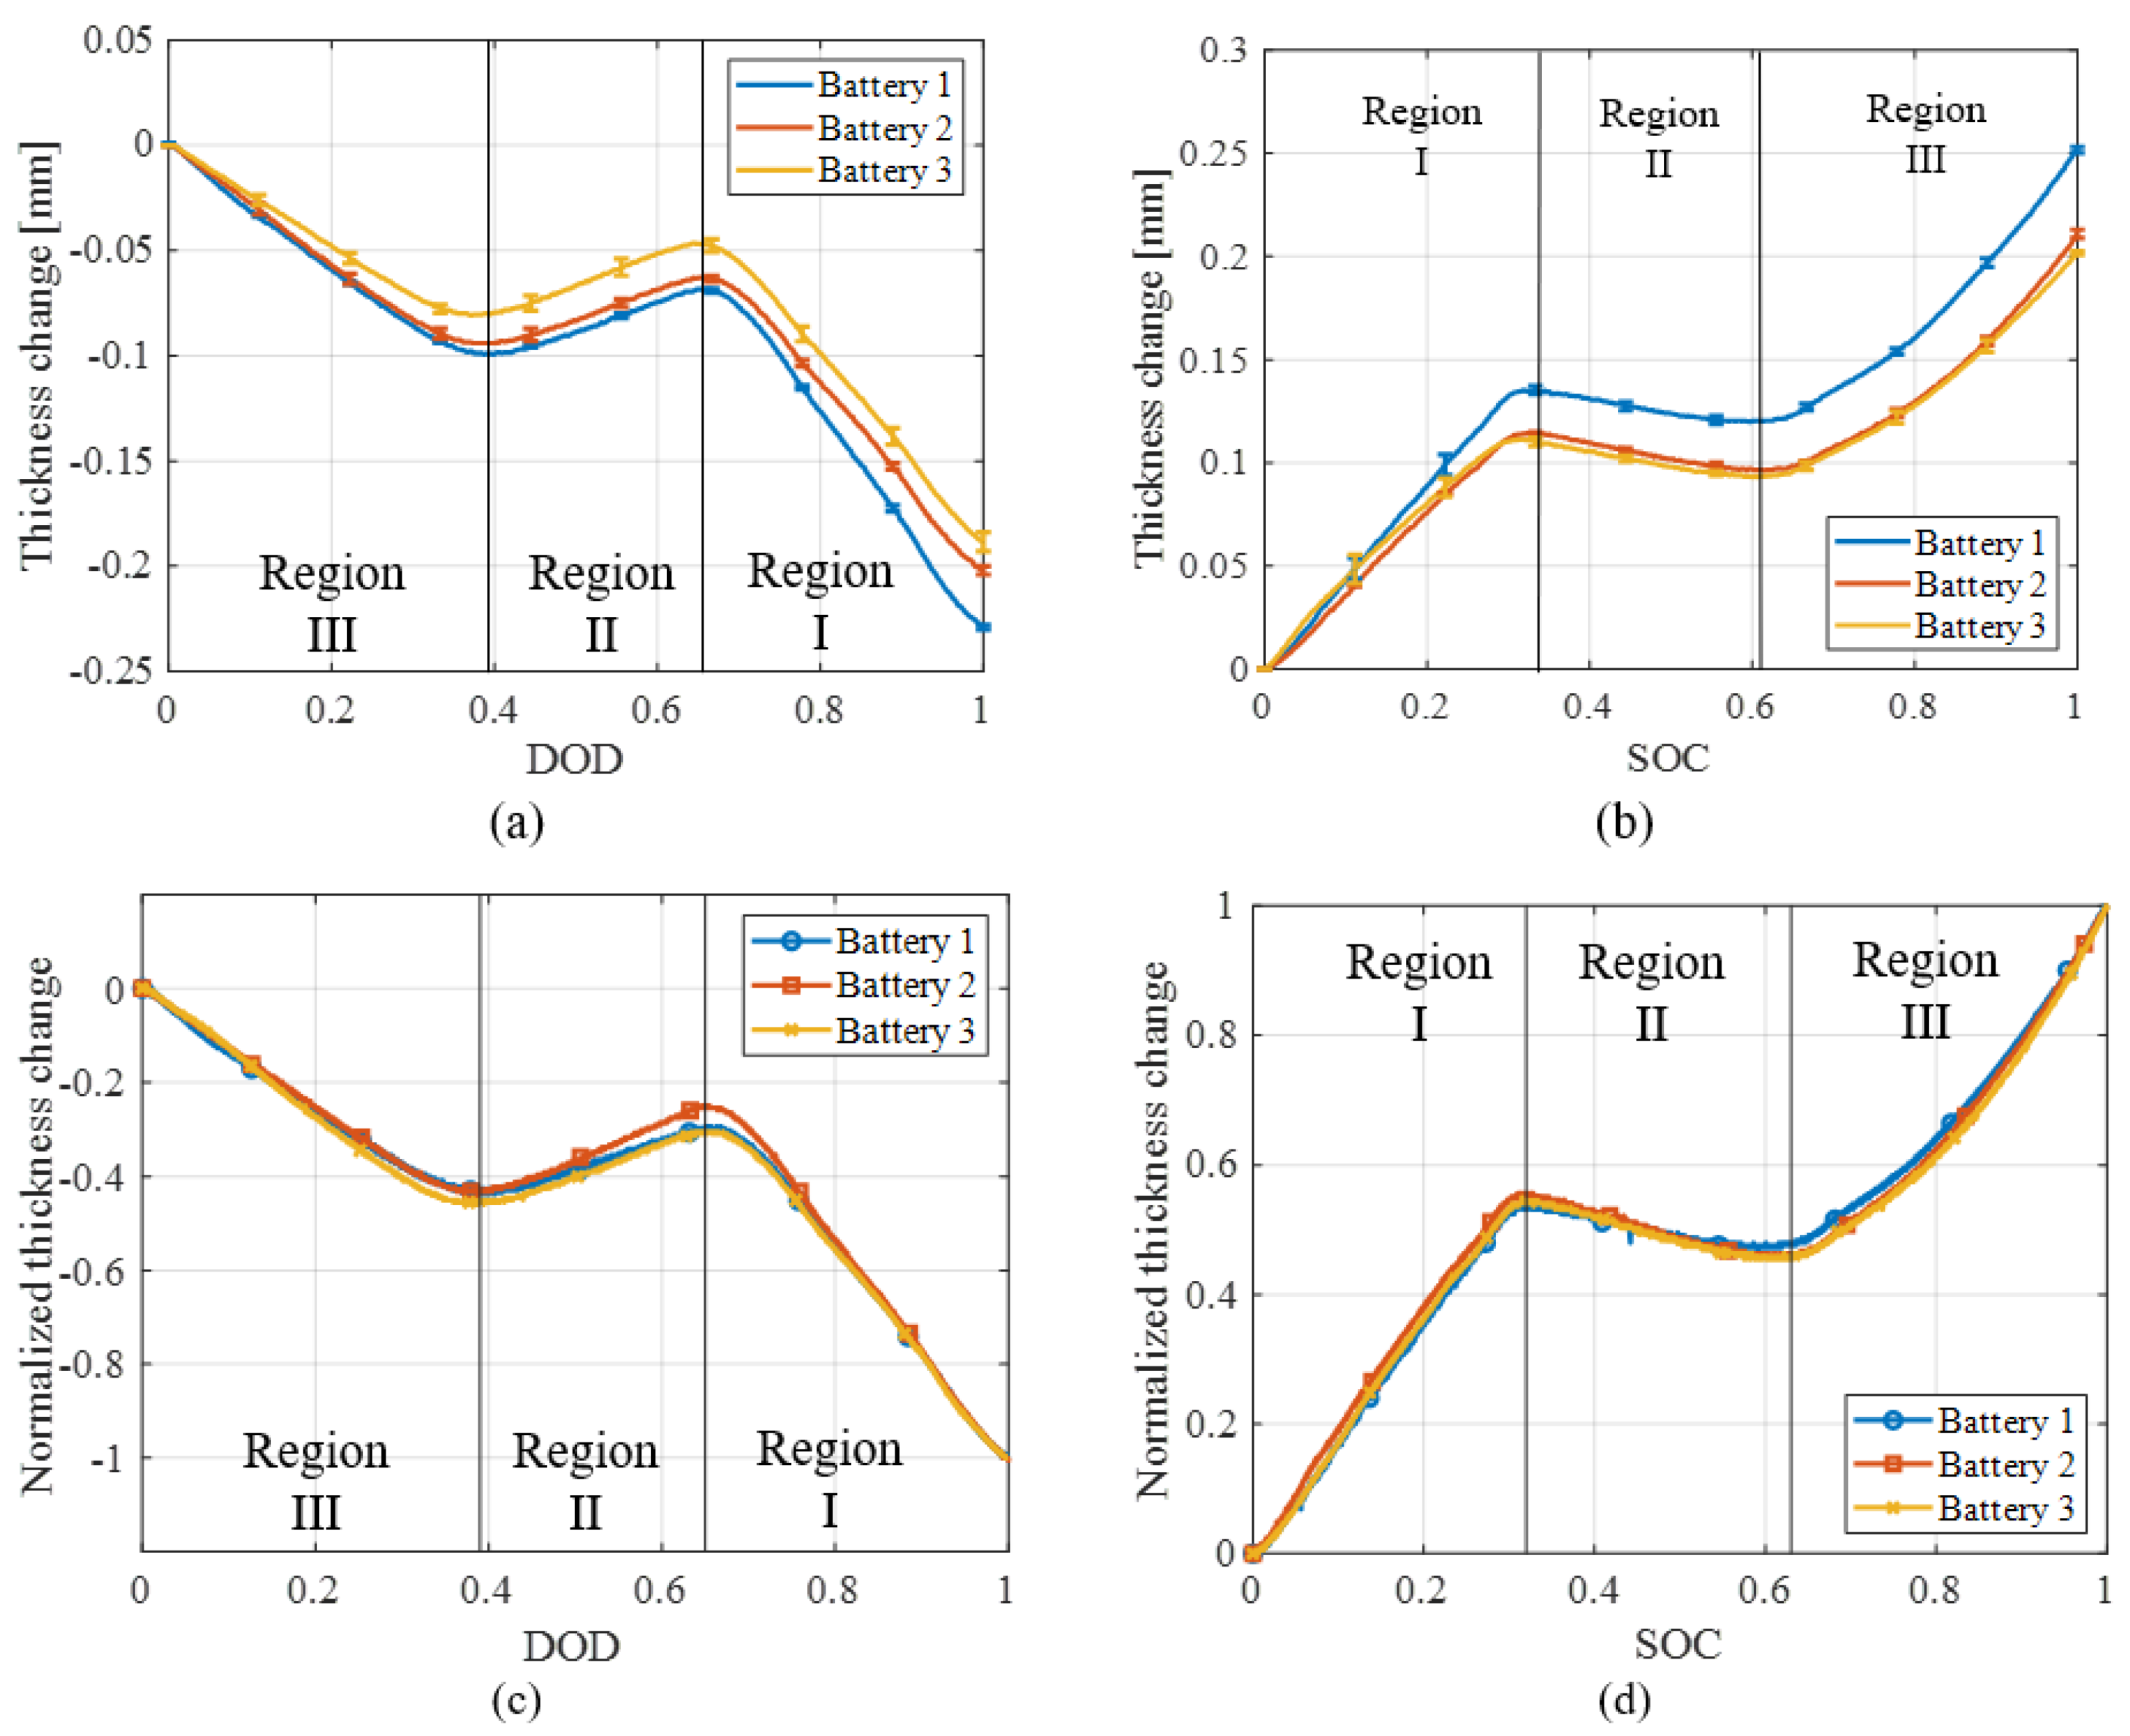
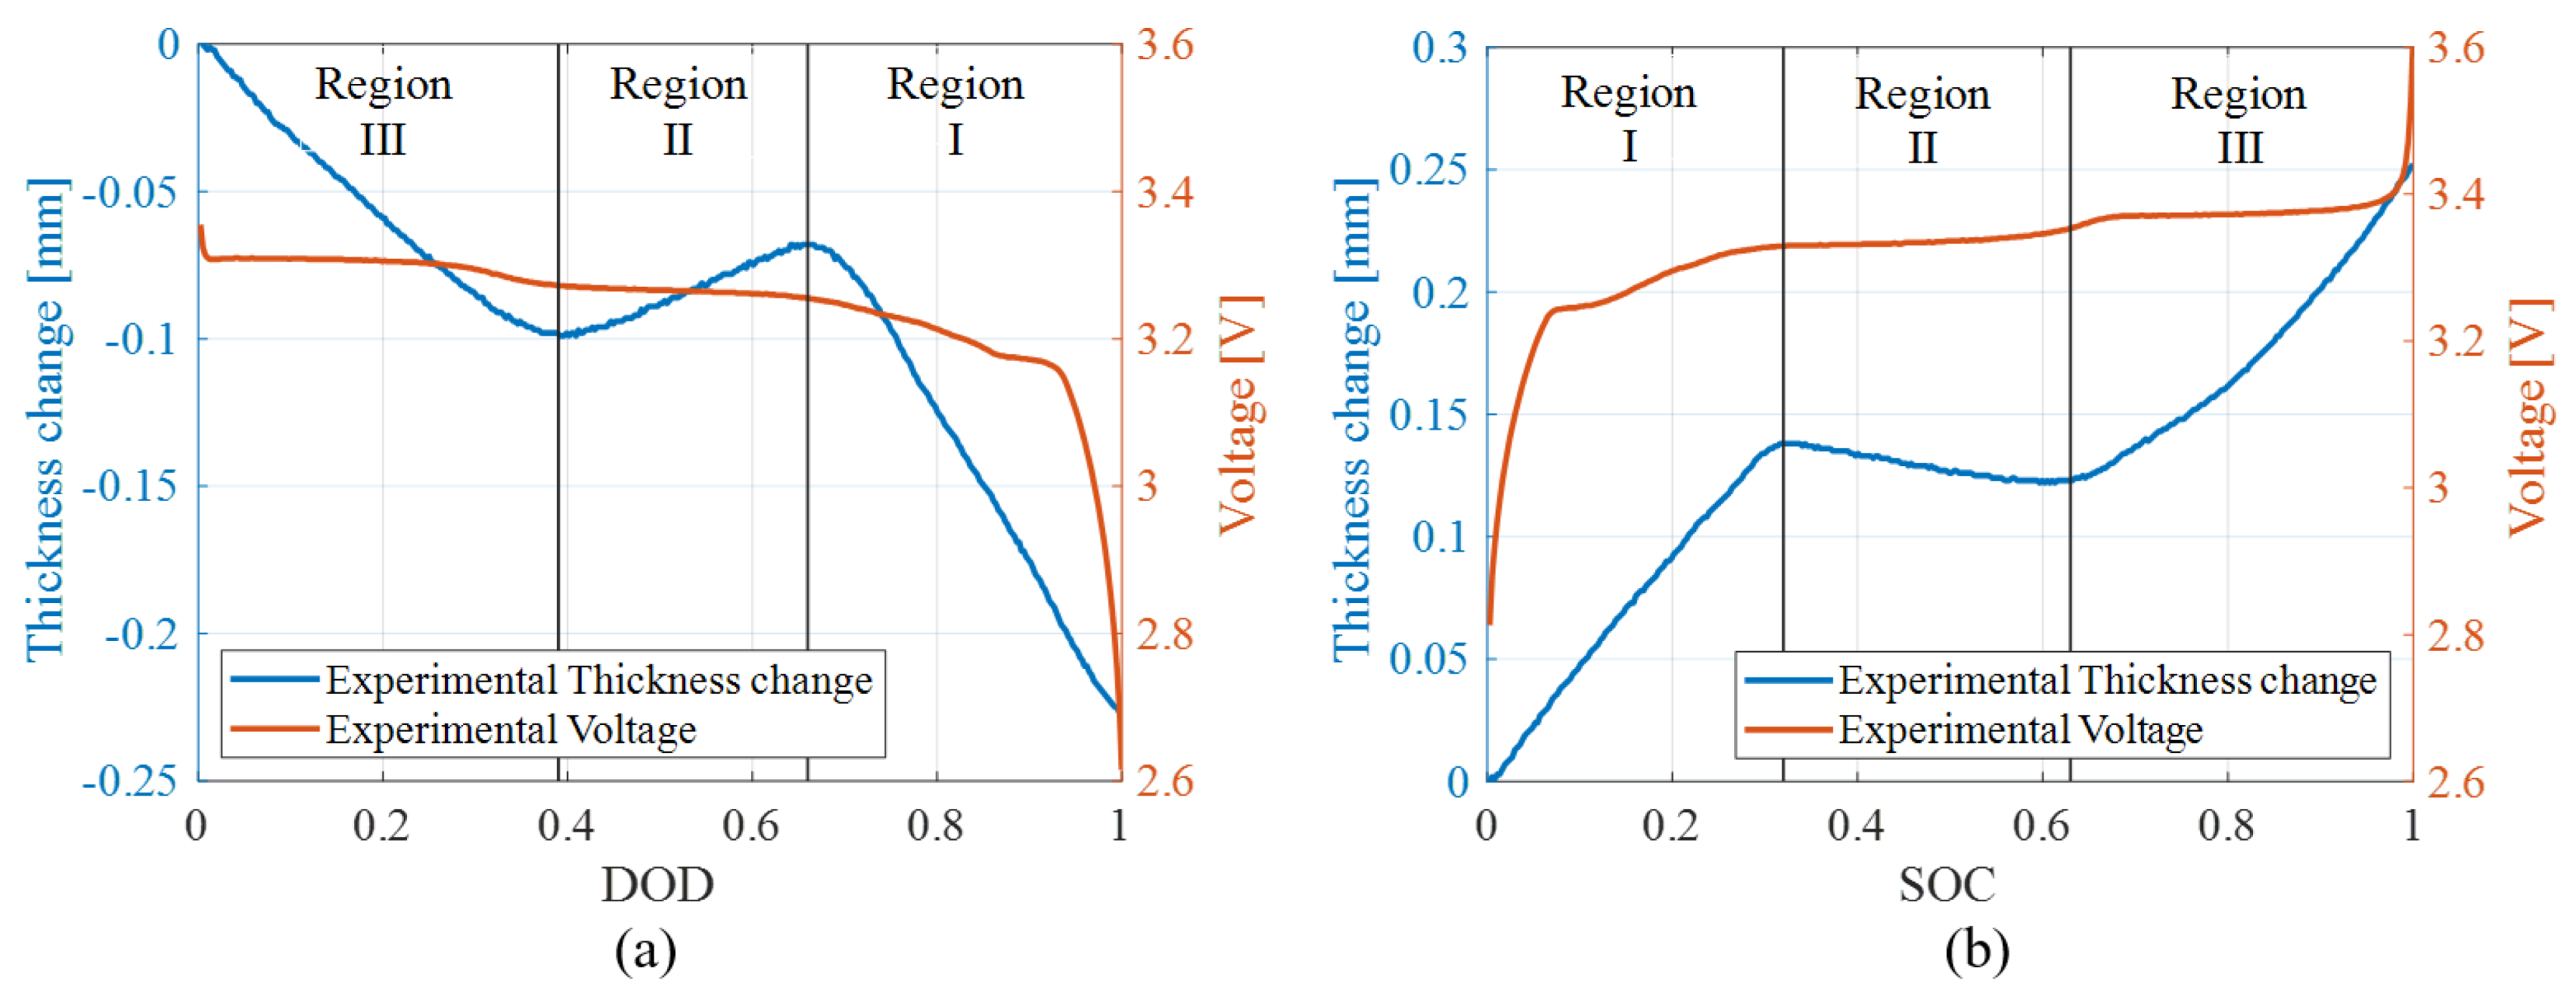
4.1. Swelling Measurements
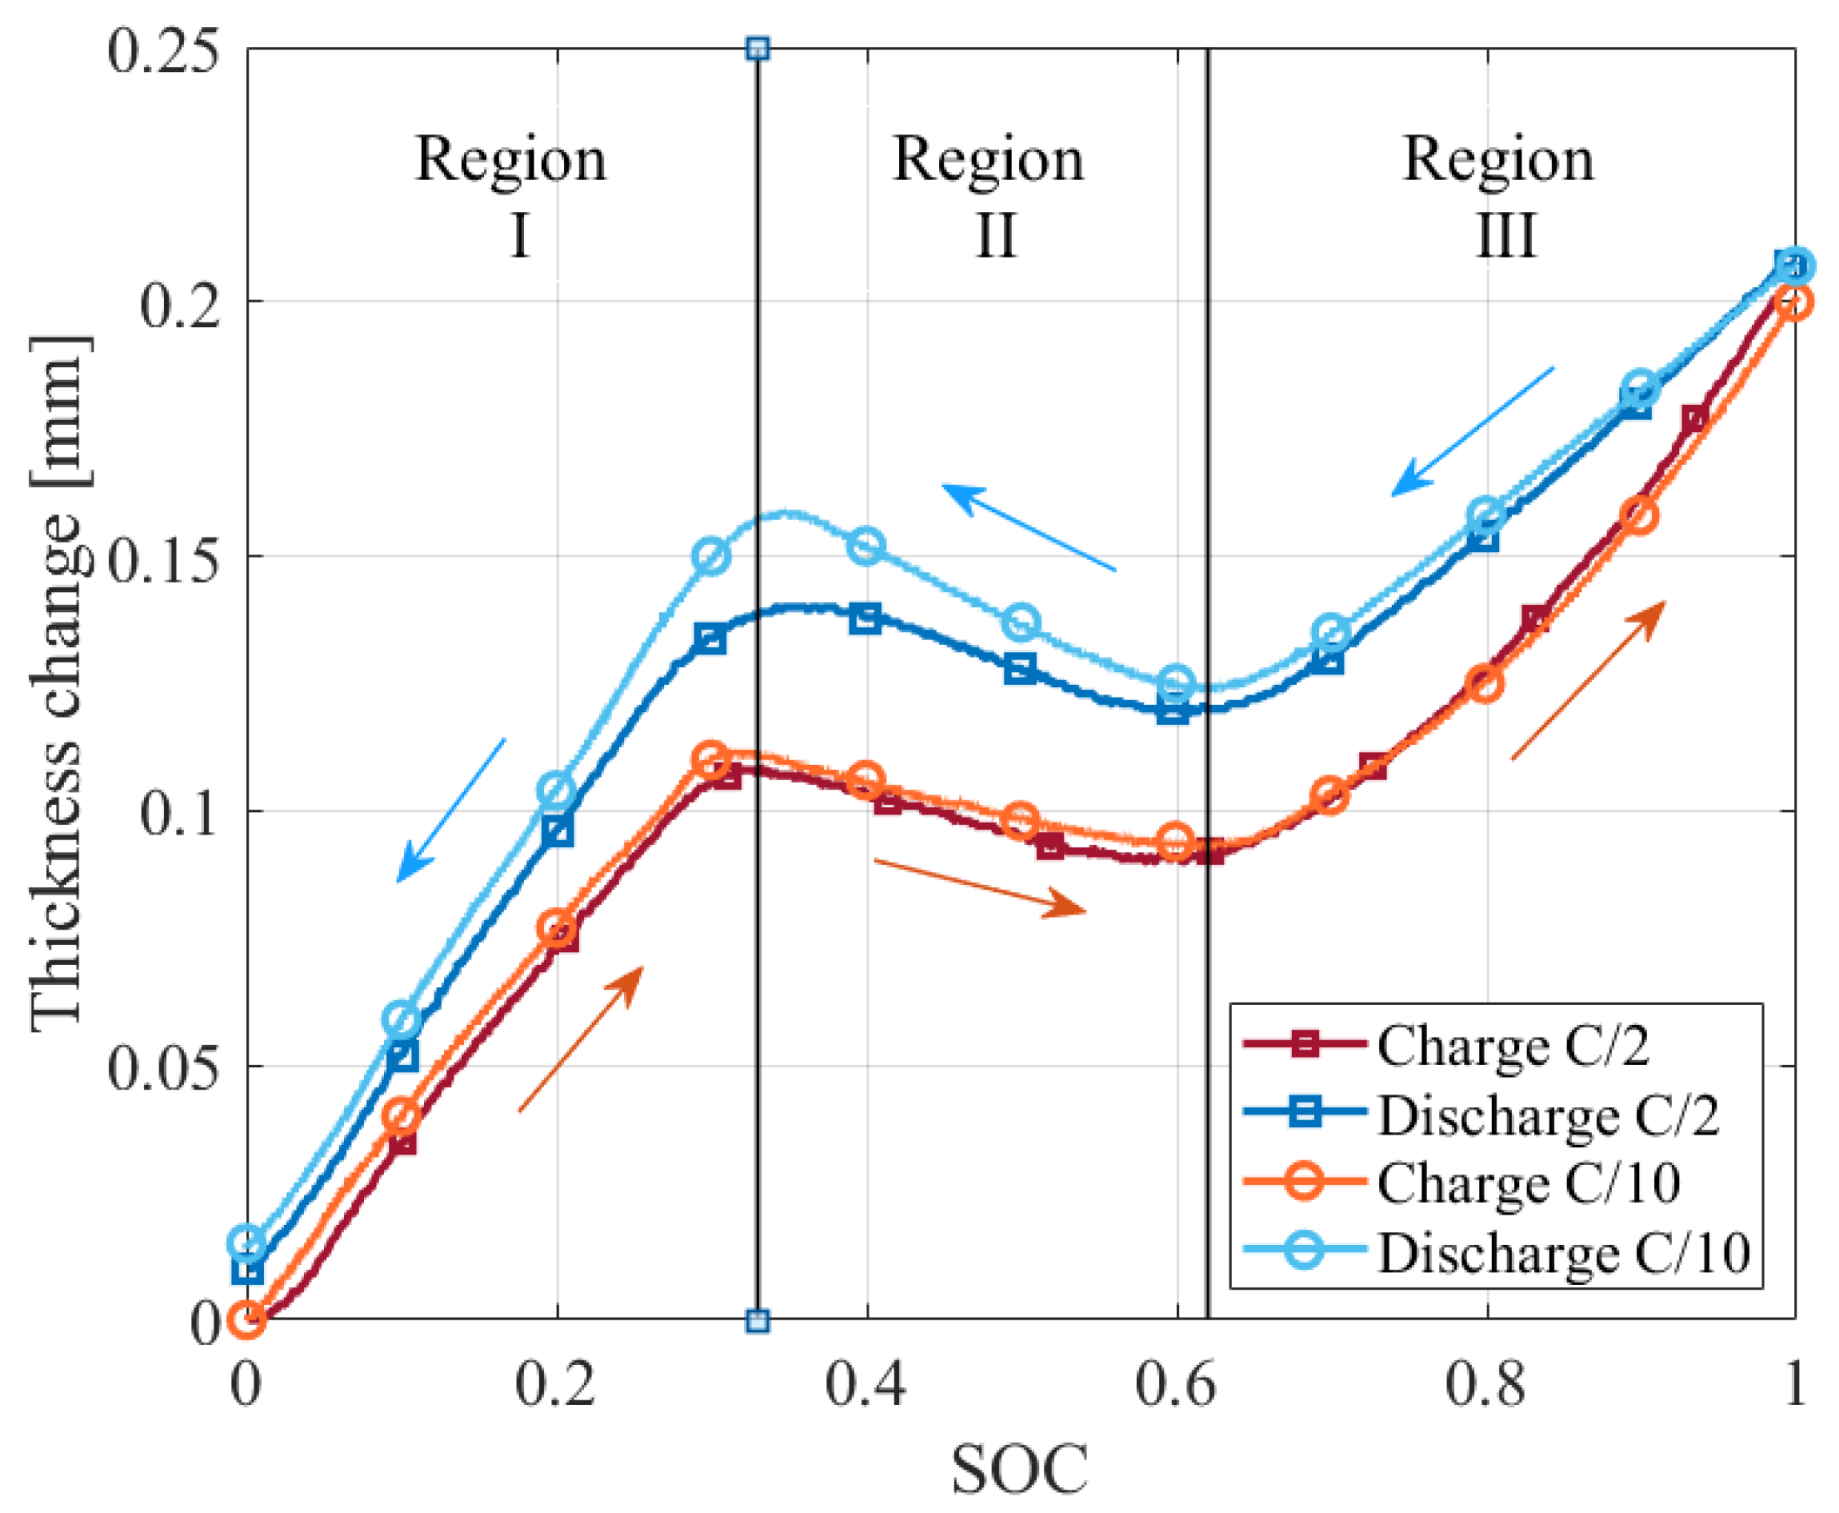
The results of thickness change measurements during discharge and charge at low current rate (C/10) are reported in Figure 6a–d. The tests are performed on three different batteries with the same nominal properties. Slight differences exist from cell to cell, but a good repeatability of the results is achieved.
The results of Figure 6 show that battery swells during charge and shrinks during discharge. This happens because the volume change of a negative electrode, which is lithiated during charge, is larger than that of a positive electrode, which is delithiated meanwhile, according to data in Table 1. So, the swelling of negative is larger than the shrinkage of positive during charge, and vice versa during discharge.
Swelling during charge and shrinkage during discharge are not monotonous: thickness change shows a turnaround in the middle of the test, identifying three marked regions belonging to SOC ranges 0 ÷ 0.33, 0.33 ÷ 0.62, 0.62 ÷ 1, where the thickness varies linearly. These regions reflect the volume change of graphite shown in Figure 3a, where a steep volume change occurs in the first and the last regions, whereas volume is approximately constant in the central region. In this region, the volume change of graphite is lower than LFP, causing the turnarounds shown in Figure 6.
Furthermore, region II shows a hysteresis between charge and discharge, which is the result of a different lithiation path of graphite during lithiation (charge) and delithiation (discharge). Referring to Figure 3a, the greater volume of graphite in discharge causes a larger increase of thickness change in region II, compared to the modest decrease measured in charge. Hysteresis behaviour is deepened in Section 4.1.1.
The thickness change trends presented in Figure 6 show a good agreement with the results obtained on LFP/graphite pouch cell by Mohtat et al. [20] as well as with the internal pressure measurements performed by Schmitt et al. [28]. Furthermore, pressure change inside the cell case is confirmed to be caused by internal volume change, as the thickness trends of Figure 6a,b—caused by volume change of active material—are comparable with pressure change observed by Schmitt et al. [28], both in charge and discharge.
Interestingly, Figure 6c,d show that cell to cell differences in thickness change vanish after normalization. This feature can be crucial in the perspective of a SOC/SOH estimation device based on thickness change measurements, because it allows to overcome the differences due to manufacturing process among cells of the same pack and to develop an unique algorithm.
Thickness change is correlated with voltage at low current rate (C/10) in Figure 7, and the correspondence between voltage plateaus and and thickness change turnarounds is highlighted. Current rate is extremely low in these tests, and allows to distinguish the voltage plateaus, which disappear as the current rate reaches practical operation values. On the other hand, thickness change is still recognizable at a high current rate, and the turnaround points remain unchanged, as shown later in Section 4.1.2.
This feature can be an interesting key point for SOC-estimating algorithms based on swelling measurements. Thickness change measurement gives precise information about the SOC of the battery, conversely to voltage, which is flat for almost the whole SOC window, and it is highly affected by the applied current. Moreover, battery ageing can be estimated by thickness change measurements detecting the points of phase changes, which shift with ageing [41,42,43].

4.1.1. Hysteresis

Thickness change shows a clear hysteresis in region II, as shown in Figure 8. The cause of hysteresis is linked to the different lithiation path of graphite during lithiation (charge) and delithiation (discharge). Indeed, phase IIL was found to appear just during discharge, and a direct transformation from phase III to phase II was observed during charge [33,35,36,37].
The larger volume of phase IIL causes a consistent increase of the thickness change curve in discharge, because LFP is swelling and graphite experiences a slight shrinkage, according to Figure 3a. On the other hand, the direct transition between stage III and stage II which occurs in charge is characterized by a lower volume: in this region, the swelling of graphite is slightly lower than shrinkage of LFP, and a less noticeable turnarounds occurs.
However, charge curve is always below discharge curve, even away from region II, where hysteresis is larger. This behaviour can be explained considering that minimum volume configuration is favourable during charge because ions follow an organized lithiation process occupying the less energetic layers. On the other hand, a disorganized ions distribution occurs during discharge, because they are extracted from carbon layers with a less precise order. This results in extracting ions from several layers at the same time, slowing the shrinkage and causing an higher volume configuration for the same SOC compared to charge, because more layers are occupied for a longer period of time.

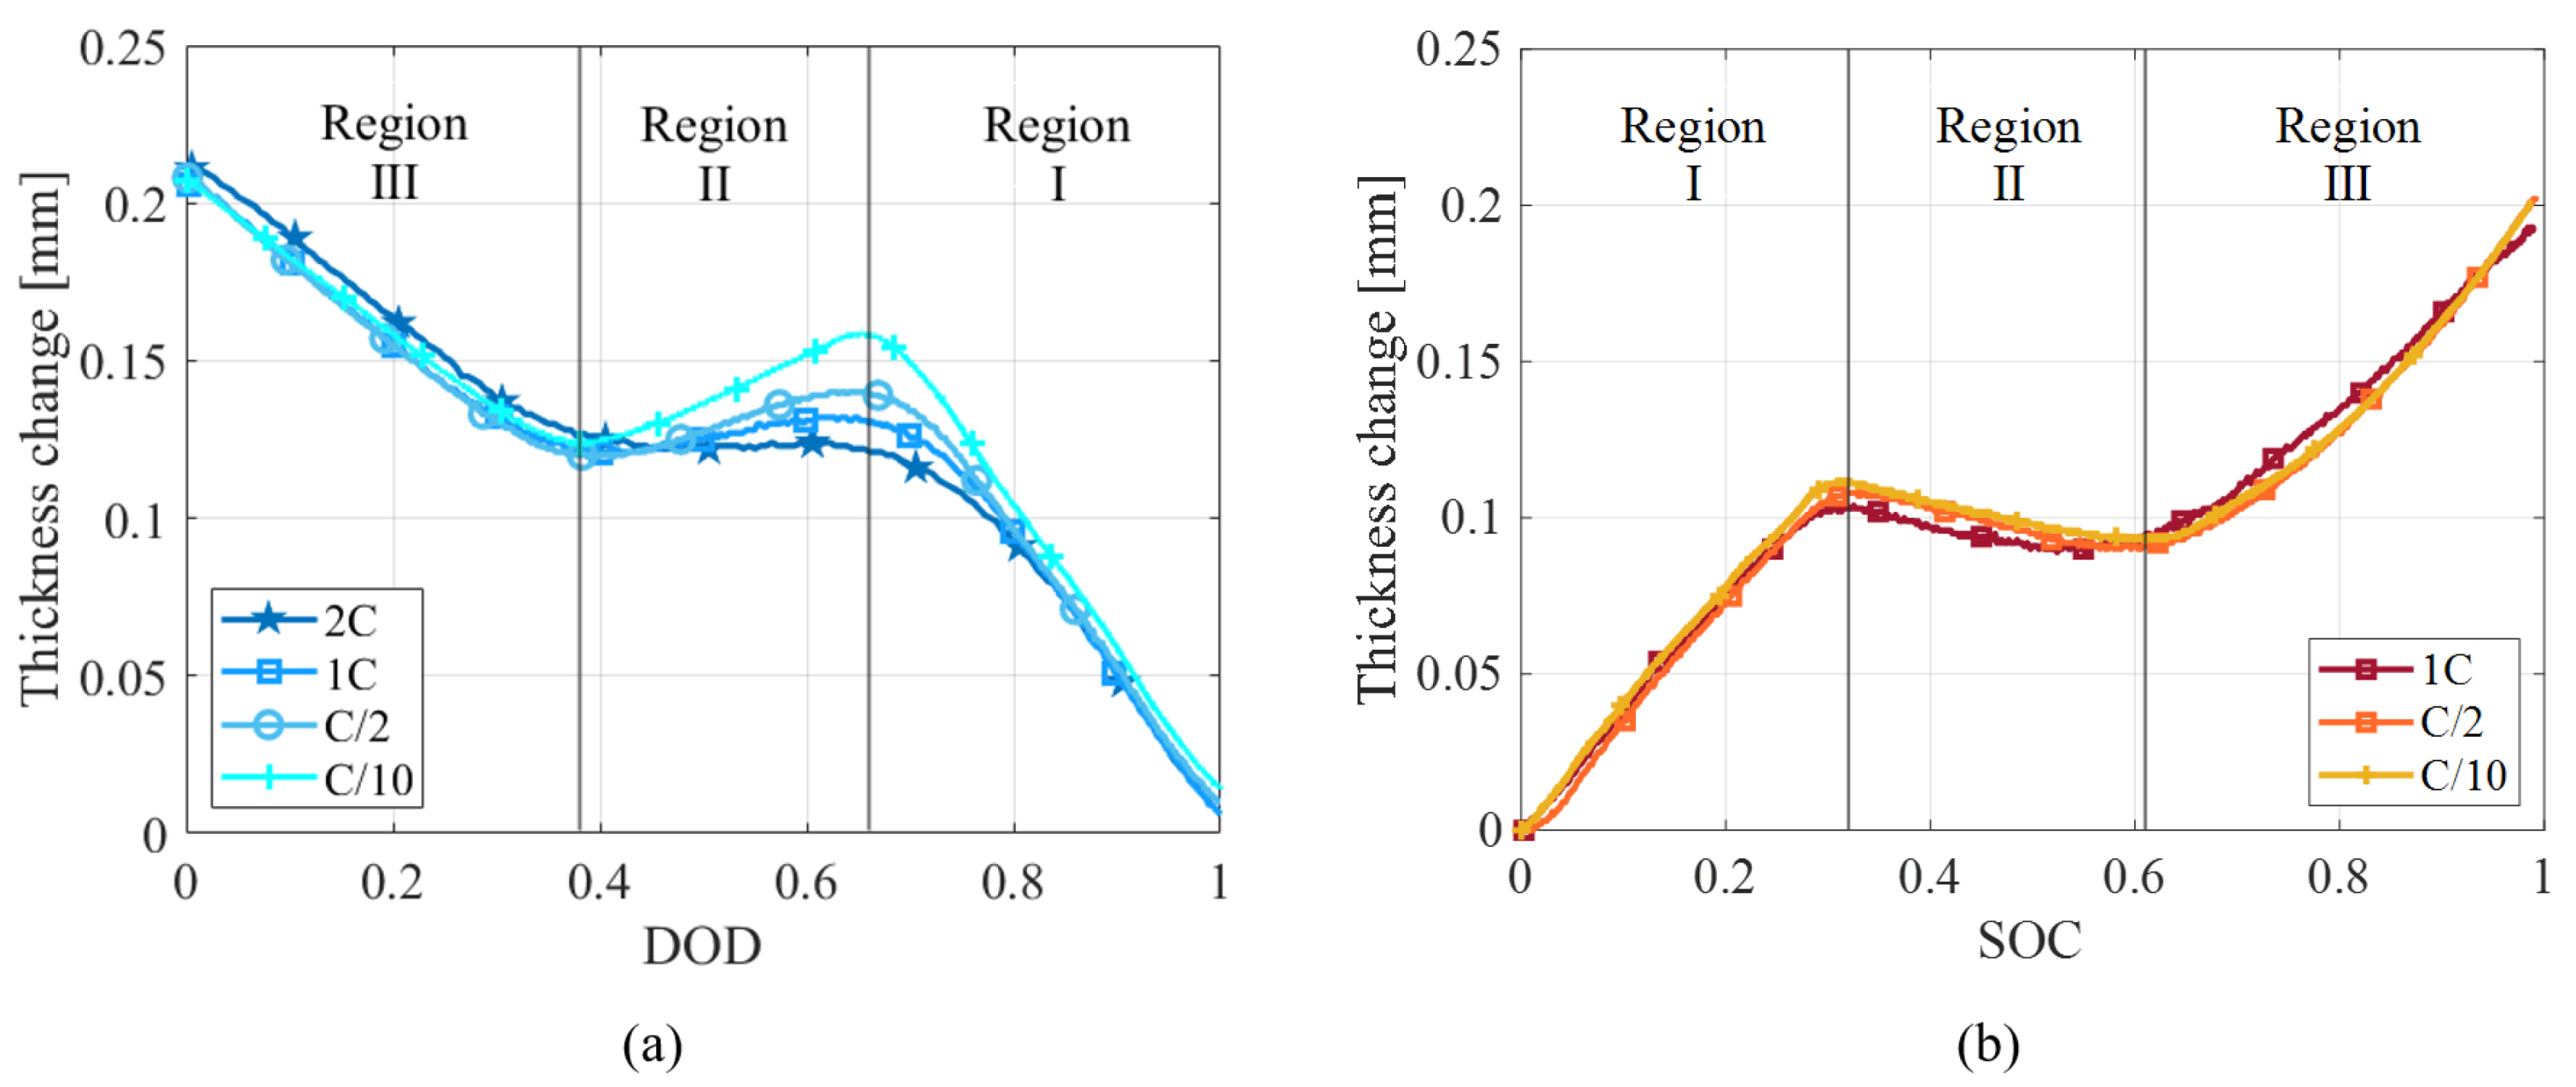
4.1.2. Current Rate Dependence

Current rate has a noticeable influence on thickness change, especially during discharge. On the other hand, current rate does not affect the maximum thickness change, because the amount of lithium ions transferred in a whole charge or discharge is the same, what changes is the speed with which the process takes place.
For what concerns discharge, thickness change—shown in Figure 9a—does not depend on current rate in region I and region III, but it has a strong dependence in region II. This is explained by the gradually disappearing of stage IIL at higher current rate, in good agreement with diffraction analysis [35]. Then, graphite volume decreases as current rate increases—and stage IIL disappears—causing a less sharp upward trend in region II.
Current rate has a lower influence during charge, as shown in Figure 9b.

4.2. Model

The results of the thickness change model of Section 2.2 are presented in this section. Thickness change during charge and discharge is computed analytically starting from lattice parameters of each phase reported in the literature.

4.2.1. Parameters Identification

Active materials for LIB electrodes are characterized by a lithiation window, where the stoichiometric index—“x” for negative electrode and “y” for positive—ranges from 0 to 1. The extremes 0 and 1 correspond to 0% and 100% of stoichiometric lithium ions inserted in the host structure, respectively. Actually, active materials in LIB do not work in the full lithiation window, but their stoichiometric indexes vary from a minimum and a maximum value. The width of lithiation window of positive— ( y m i n , y m a x ) —and negative— ( x m i n , x m a x ) —electrode affects their thickness change, as wider the window, larger the amount of ions stored in active material, and greater the thickness change accordingly.
The limits of stoichiometric windows of graphite and LFP of the batteries tested in this work are computed comparing the measured OCV with the OCV of single electrode reported in the literature and resumed in Table 2.
OCV is measured experimentally with GITT and with charge/discharge at a continuous low current rate (C/20) method; the results are shown in Figure 10a.
Discrete points calculated with GITT and the mean between continuous discharge and charge show a good agreement, which ensures an acceptable reliability of the tests. Then, the difference between OCV functions of graphite and LFP should equal the experimental OCV, once the stoichiometric indexes are tuned correctly. The values of the limits of lithiation window of graphite— x m i n and x m a x —and LFP— y m i n and y m a x —obtained so that the OCV function overlaps the measured one, are reported in Table 2.

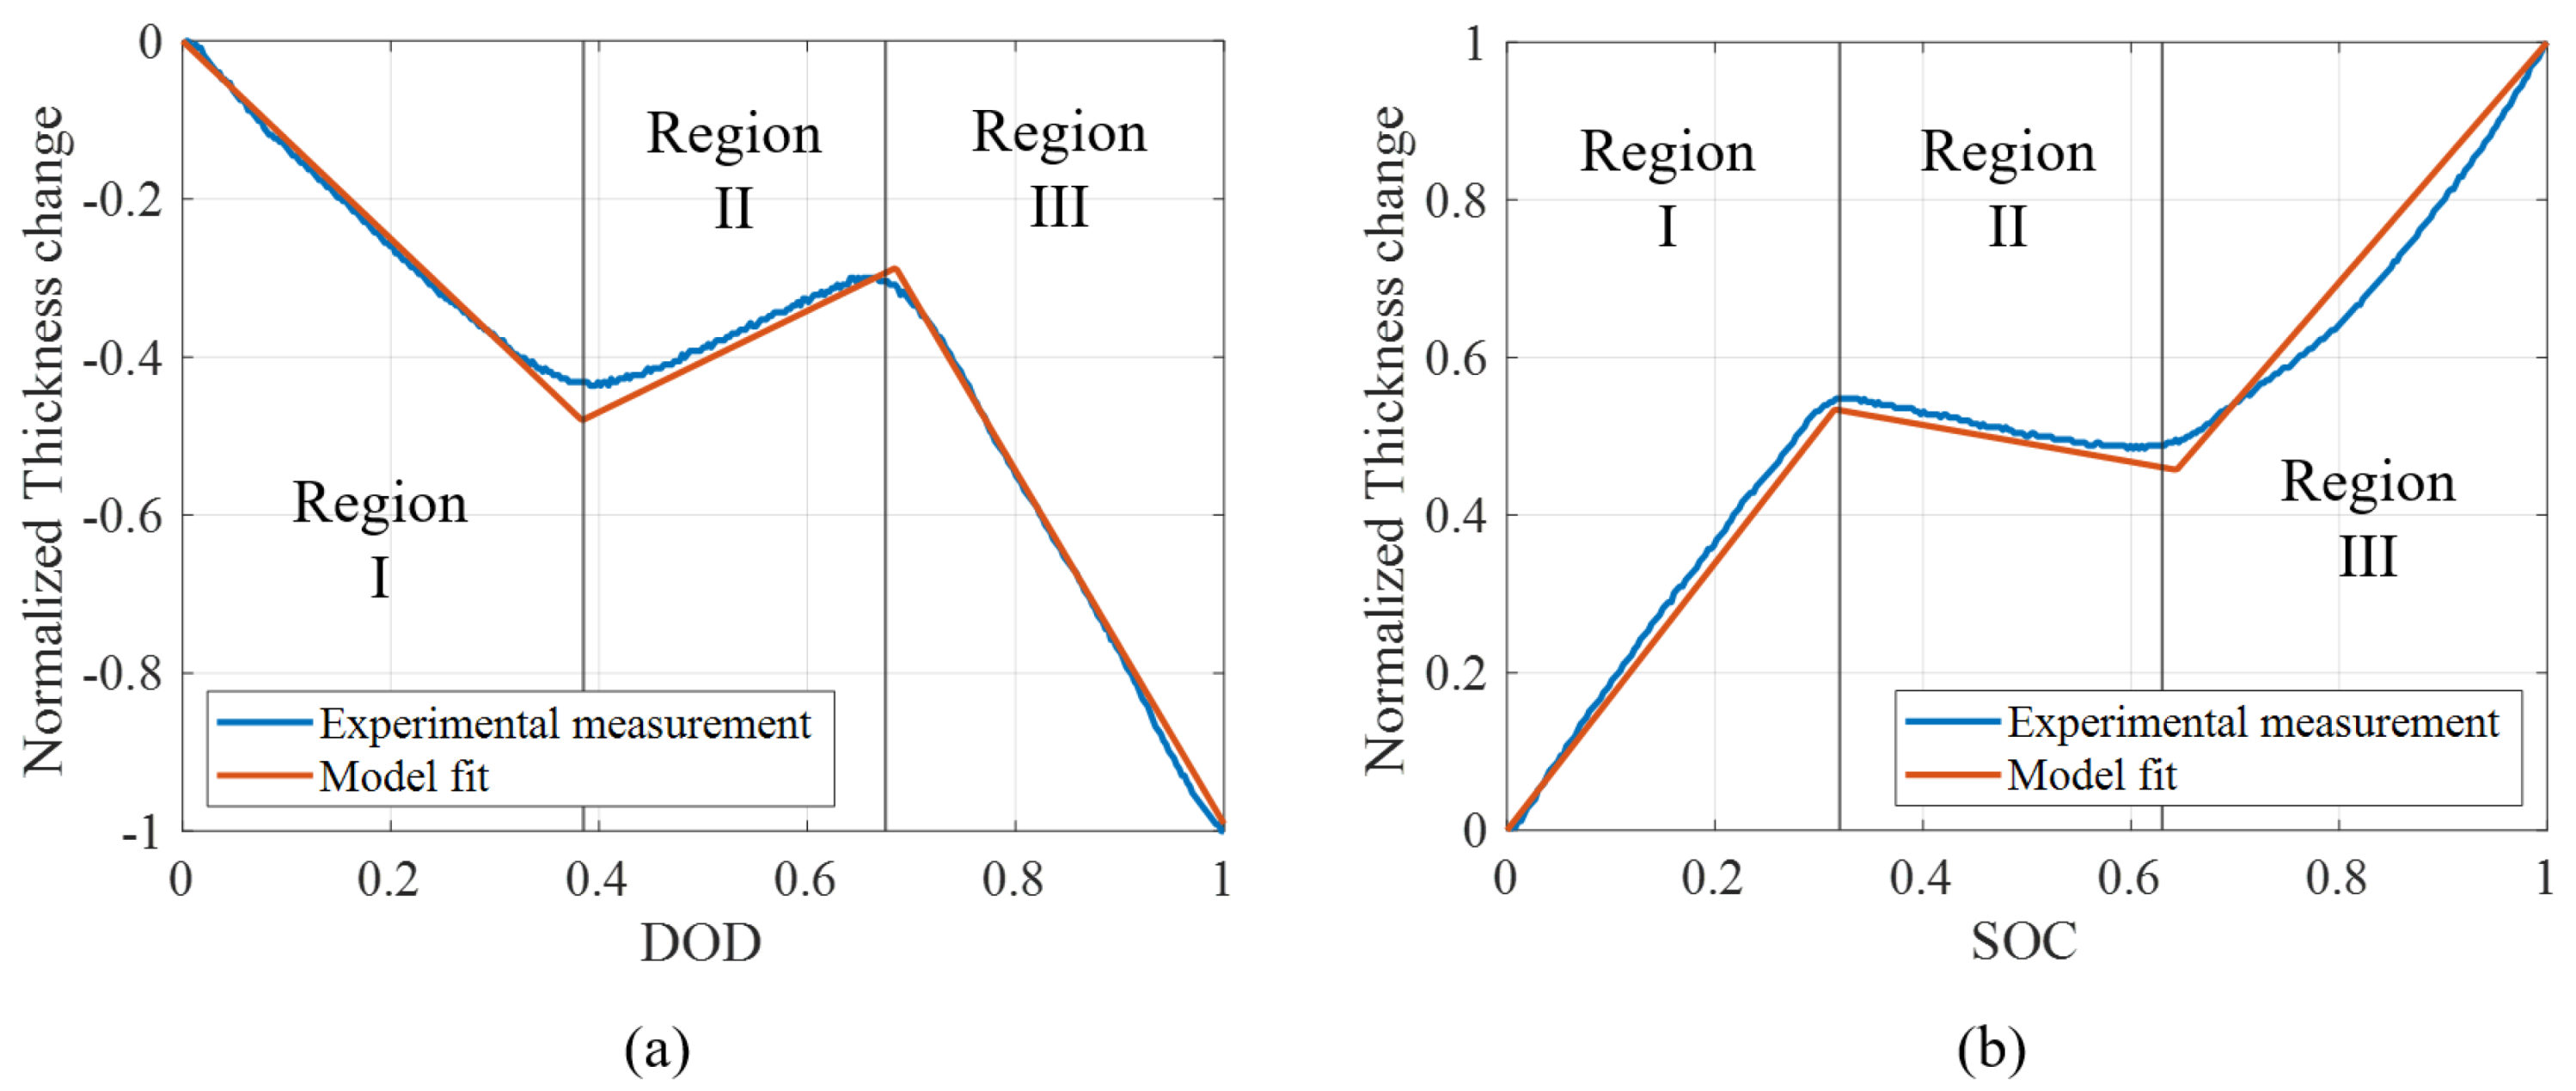
4.2.2. Comparison of Model with Experimental Measurements

The volume change functions in Figure 3 are defined for the whole lithiation window, but electrodes actually work in a restricted window, defined by a couple of coefficient ( x m i n , x m a x and y m i n , y m a x ), as explained in the previous section. Then, volume change functions must be restricted to the lithiation window identified in Section 4.2.1 to be correctly applied to the deformation model of Section 2.2.
The model of Section 2.2, and in particular Equation (4) requires electrode thickness, active material fraction and number of elementary cells, which are unknown since the tested batteries still have not been disassembled. Moreover, case stiffness is not taken into account in Equation (4), then the thickness of external case would be required to compute the nominal thickness change.
Nevertheless, the normalized thickness change is enough to validate experimental measurements with lattice data from the literature, once electrode thickness and active material fraction are estimated correctly.
Then, normalized thickness change Δ t n is computed from Equation (4) as follows:
Δ t n = ε v , P k P + ε v , N k N / Δ t m a x
where k P = t P ζ P and k N = t N ζ N . The coefficients k P and k n adjust how much one electrode shrinks while the other swells, so they give the shape of the displacement curve as a function of SOC, once volume deformations ε v , i are set. The numerator of Equation (5) is normalized with the maximum thickness change, then Δ t n ranges from 0 to 1.
The number of elementary cells M and the stiffness of the case can be neglected in the model as long as the results are normalized. The number of elementary cells is just the proportionality coefficient that allows to get the displacement of the entire elementary cells stack. Conversely, the external case acts as a stiffness and proportionally reduces the aforementioned displacement, without modifying its shape in function of SOC.
Then, k P and k N are estimated with least square method according to Equation (6) to get the proper fit on the n points of experimental curve. If the estimated parameters k P and k N are in agreement with physical data, the model predicts the correct thickness change shape.
d 1 d 2 d N m e a s u r e d = ε v , P 1 ε v , N 1 ε v , P 2 ε v , N 2 ε v , P N ε v , N N k P k N
where d 1 . . . d N are the discrete thickness change measurements as a function of SOC. The estimated coefficients k P and k N are reported in Table 3. Their values are in good agreement with physical electrode thickness and active material fractions measured by other authors [30,44,45,46,47] in LFP/graphite cells.
The result of the fitted model and the experimental measurements are presented in Figure 11.
A good accuracy is obtained: model and normalized experimental curve are overlapped and the positions of turnaround points are consistent. A slight difference is observed just in region III of charge, where the experimental curve follows a parabolic trend.
The good agreement between experimental data and model results ensures the reliability of measurements and crystal structure parameters, which are the starting point for mechanical stress computing in active material—the aim of previous works [4,6,7]—including the phase transition phenomenon.

5. Conclusions

The aim of this work is to characterize the thickness change of LFP/graphite battery during (dis)charge and to predict the normalized measured data with a model based on crystal structure parameters of active materials.
An experimental bench with optical laser sensors was built to accomplish this purpose. Thickness change measurements were performed both in charge and discharge at various current rates.
The results show a clear three-regions curve, due to the volume change features of graphite. A large hysteresis is present, especially in the central region, because of the different lithiation path of graphite in charge and discharge, as phase IIL forms just during discharge. Current rate affects the central region of discharge curve, because of the disappearing of stage IIL at higher current rate. On the other hand, thickness change is unaffected by the current rate in charge. The small differences in thickness change curves of different cells disappear when normalized curves are considered.
A thickness change model based on lattice parameters of active materials microstructure is built up to predict normalized swelling/shrinkage. The good agreement between experimental data and model results confirms the reliability of the measurements and provides a solid starting point for the validation of mechanical stress computation in active materials affected by phase change, which will be dealt in future.
Future works will focus on SOC estimation algorithm based on swelling measurements as well: indeed, they directly tell the amounts of lithium in active materials, and SOC accordingly, without being affected by applied current or relaxation time, as voltage does. Moreover, thickness change measurements can be applied in the estimation of SOH as well, as phase transitions points are affected by ageing.

Author Contributions

The authors contributed equally to this manuscript. All authors have read and agreed to the published version of the manuscript.

Funding

This research received no external funding.

Conflicts of Interest

The authors declare no conflict of interest.

References

  1. Somà, A.; Bruzzese, F.; Mocera, F.; Viglietti, E. Hybridization factor and performance of hybrid electric telehandler vehicle. IEEE Trans. Ind. Appl. 2016, 52, 5130–5138. [Google Scholar] [CrossRef]
  2. Mocera, F.; Vergori, E.; Somà, A. Battery performance analysis for working vehicle applications. IEEE Trans. Ind. Appl. 2019, 56, 644–653. [Google Scholar] [CrossRef]
  3. Mocera, F.; Somà, A. Analysis of a Parallel Hybrid Electric Tractor for Agricultural Applications. Energies 2020, 13, 3055. [Google Scholar] [CrossRef]
  4. Clerici, D.; Mocera, F.; Somà, A. Analytical Solution for Coupled Diffusion Induced Stress Model for Lithium-Ion Battery. Energies 2020, 13, 1717. [Google Scholar] [CrossRef] [Green Version]
  5. Mocera, F.; Somà, A.; Clerici, D. Study of aging mechanisms in lithium-ion batteries for working vehicle applications. In Proceedings of the 2020 Fifteenth International Conference on Ecological Vehicles and Renewable Energies (EVER), Monte-Carlo, Monaco, 10–12 September 2020; pp. 1–8. [Google Scholar]
  6. Clerici, D.; Mocera, F.; Somà, A. Shape Influence of Active Material Micro-Structure on Diffusion and Contact Stress in Lithium-Ion Batteries. Energies 2021, 14, 134. [Google Scholar] [CrossRef]
  7. Clerici, D.; Mocera, F. Micro-scale modeling of Lithium-ion battery. Mater. Sci. Eng. 2021, 1038, 012007. [Google Scholar] [CrossRef]
  8. Vergori, E.; Yu, Y. Monitoring of Li-ion cells with distributed fibre optic sensors. Procedia Struct. Integr. 2019, 24, 233–239. [Google Scholar] [CrossRef]
  9. Koyama, Y.; Chin, T.E.; Rhyner, U.; Holman, R.K.; Hall, S.R.; Chiang, Y.M. Harnessing the actuation potential of solid-state intercalation compounds. Adv. Funct. Mater. 2006, 16, 492–498. [Google Scholar] [CrossRef]
  10. Koerver, R.; Zhang, W.; de Biasi, L.; Schweidler, S.; Kondrakov, A.O.; Kolling, S.; Brezesinski, T.; Hartmann, P.; Zeier, W.G.; Janek, J. Chemo-mechanical expansion of lithium electrode materials–on the route to mechanically optimized all-solid-state batteries. Energy Environ. Sci. 2018, 11, 2142–2158. [Google Scholar] [CrossRef]
  11. Popp, H.; Koller, M.; Jahn, M.; Bergmann, A. Mechanical methods for state determination of Lithium-Ion secondary batteries: A review. J. Energy Storage 2020, 32, 101859. [Google Scholar] [CrossRef]
  12. Cheng, X.; Pecht, M. In situ stress measurement techniques on li-ion battery electrodes: A review. Energies 2017, 10, 591. [Google Scholar] [CrossRef]
  13. Mohan, S.; Kim, Y.; Siegel, J.B.; Samad, N.A.; Stefanopoulou, A.G. A phenomenological model of bulk force in a li-ion battery pack and its application to state of charge estimation. J. Electrochem. Soc. 2014, 161, A2222. [Google Scholar] [CrossRef] [Green Version]
  14. Samad, N.A.; Kim, Y.; Siegel, J.B.; Stefanopoulou, A.G. Battery capacity fading estimation using a force-based incremental capacity analysis. J. Electrochem. Soc. 2016, 163, A1584. [Google Scholar] [CrossRef] [Green Version]
  15. Figueroa-Santos, M.A.; Siegel, J.B.; Stefanopoulou, A.G. Leveraging Cell Expansion Sensing in State of Charge Estimation: Practical Considerations. Energies 2020, 13, 2653. [Google Scholar] [CrossRef]
  16. Plotnikov, Y.; Karp, J.; Knobloch, A.; Kapusta, C.; Lin, D. Eddy current sensor for in situ monitoring of swelling of Li-ion prismatic cells. AIP Conf. Proc. 2015, 1650, 434–442. [Google Scholar]
  17. Peng, J.; Zhou, X.; Jia, S.; Jin, Y.; Xu, S.; Chen, J. High precision strain monitoring for lithium ion batteries based on fiber Bragg grating sensors. J. Power Sources 2019, 433, 226692. [Google Scholar] [CrossRef]
  18. Oh, K.Y.; Siegel, J.B.; Secondo, L.; Kim, S.U.; Samad, N.A.; Qin, J.; Anderson, D.; Garikipati, K.; Knobloch, A.; Epureanu, B.I.; et al. Rate dependence of swelling in lithium-ion cells. J. Power Sources 2014, 267, 197–202. [Google Scholar] [CrossRef]
  19. Bauer, M.; Wachtler, M.; Stöwe, H.; Persson, J.V.; Danzer, M.A. Understanding the dilation and dilation relaxation behavior of graphite-based lithium-ion cells. J. Power Sources 2016, 317, 93–102. [Google Scholar] [CrossRef]
  20. Mohtat, P.; Lee, S.; Siegel, J.B.; Stefanopoulou, A.G. Towards better estimability of electrode-specific state of health: Decoding the cell expansion. J. Power Sources 2019, 427, 101–111. [Google Scholar] [CrossRef]
  21. Mohtat, P.; Lee, S.; Sulzer, V.; Siegel, J.B.; Stefanopoulou, A.G. Differential Expansion and Voltage Model for Li-ion Batteries at Practical Charging Rates. J. Electrochem. Soc. 2020, 167, 110561. [Google Scholar] [CrossRef]
  22. Willenberg, L.K.; Dechent, P.; Fuchs, G.; Sauer, D.U.; Figgemeier, E. High-precision monitoring of volume change of commercial lithium-ion batteries by using strain gauges. Sustainability 2020, 12, 557. [Google Scholar] [CrossRef] [Green Version]
  23. Nascimento, M.; Novais, S.; Ding, M.S.; Ferreira, M.S.; Koch, S.; Passerini, S.; Pinto, J.L. Internal strain and temperature discrimination with optical fiber hybrid sensors in Li-ion batteries. J. Power Sources 2019, 410, 1–9. [Google Scholar] [CrossRef]
  24. Ganguli, A.; Saha, B.; Raghavan, A.; Kiesel, P.; Arakaki, K.; Schuh, A.; Schwartz, J.; Hegyi, A.; Sommer, L.W.; Lochbaum, A.; et al. Embedded fiber-optic sensing for accurate internal monitoring of cell state in advanced battery management systems part 2: Internal cell signals and utility for state estimation. J. Power Sources 2017, 341, 474–482. [Google Scholar] [CrossRef] [Green Version]
  25. Jones, E.; Silberstein, M.; White, S.R.; Sottos, N.R. In situ measurements of strains in composite battery electrodes during electrochemical cycling. Exp. Mech. 2014, 54, 971–985. [Google Scholar] [CrossRef]
  26. Yu, Y.; Vergori, E.; Worwood, D.; Tripathy, Y.; Guo, Y.; Somá, A.; Greenwood, D.; Marco, J. Distributed thermal monitoring of lithium ion batteries with optical fibre sensors. J. Energy Storage 2021, 39, 102560. [Google Scholar] [CrossRef]
  27. Bitzer, B.; Gruhle, A. A new method for detecting lithium plating by measuring the cell thickness. J. Power Sources 2014, 262, 297–302. [Google Scholar] [CrossRef]
  28. Schmitt, J.; Kraft, B.; Schmidt, J.P.; Meir, B.; Elian, K.; Ensling, D.; Keser, G.; Jossen, A. Measurement of gas pressure inside large-format prismatic lithium-ion cells during operation and cycle aging. J. Power Sources 2020, 478, 228661. [Google Scholar] [CrossRef]
  29. Christensen, J.; Newman, J. Stress generation and fracture in lithium insertion materials. J. Solid State Electrochem. 2006, 10, 293–319. [Google Scholar] [CrossRef]
  30. Safari, M.; Delacourt, C. Modeling of a commercial graphite/LiFePO4 cell. J. Electrochem. Soc. 2011, 158, A562. [Google Scholar] [CrossRef]
  31. Bohn, E.; Eckl, T.; Kamlah, M.; McMeeking, R. A model for lithium diffusion and stress generation in an intercalation storage particle with phase change. J. Electrochem. Soc. 2013, 160, A1638. [Google Scholar] [CrossRef]
  32. Asenbauer, J.; Eisenmann, T.; Kuenzel, M.; Kazzazi, A.; Chen, Z.; Bresser, D. The success story of graphite as a lithium-ion anode material–fundamentals, remaining challenges, and recent developments including silicon (oxide) composites. Sustain. Energy Fuels 2020, 4, 5387–5416. [Google Scholar] [CrossRef]
  33. Didier, C.; Pang, W.K.; Guo, Z.; Schmid, S.; Peterson, V.K. Phase Evolution and Intermittent Disorder in Electrochemically Lithiated Graphite Determined Using in Operando Neutron Diffraction. Chem. Mater. 2020, 32, 2518–2531. [Google Scholar] [CrossRef]
  34. Mercer, M.P.; Peng, C.; Soares, C.; Hoster, H.E.; Kramer, D. Voltage hysteresis during lithiation/delithiation of graphite associated with meta-stable carbon stackings. J. Mater. Chem. 2021, 9, 492–504. [Google Scholar] [CrossRef]
  35. Taminato, S.; Yonemura, M.; Shiotani, S.; Kamiyama, T.; Torii, S.; Nagao, M.; Ishikawa, Y.; Mori, K.; Fukunaga, T.; Onodera, Y.; et al. Real-time observations of lithium battery reactions—operando neutron diffraction analysis during practical operation. Sci. Rep. 2016, 6, 28843. [Google Scholar] [CrossRef] [PubMed] [Green Version]
  36. Yao, K.P.; Okasinski, J.S.; Kalaga, K.; Shkrob, I.A.; Abraham, D.P. Quantifying lithium concentration gradients in the graphite electrode of Li-ion cells using operando energy dispersive X-ray diffraction. Energy Environ. Sci. 2019, 12, 656–665. [Google Scholar] [CrossRef] [Green Version]
  37. Senyshyn, A.; Dolotko, O.; Mühlbauer, M.; Nikolowski, K.; Fuess, H.; Ehrenberg, H. Lithium intercalation into graphitic carbons revisited: Experimental evidence for twisted bilayer behavior. J. Electrochem. Soc. 2013, 160, A3198. [Google Scholar] [CrossRef]
  38. Zhou, H. Two-phase transition of Li-intercalation compounds in Li-ion batteries. Mater. Today 2014, 17, 451–463. [Google Scholar]
  39. Padhi, A.K.; Nanjundaswamy, K.S.; Goodenough, J.B. Phospho-olivines as positive-electrode materials for rechargeable lithium batteries. J. Electrochem. Soc. 1997, 144, 1188. [Google Scholar] [CrossRef]
  40. Barai, A.; Uddin, K.; Dubarry, M.; Somerville, L.; McGordon, A.; Jennings, P.; Bloom, I. A comparison of methodologies for the non-invasive characterisation of commercial Li-ion cells. Prog. Energy Combust. Sci. 2019, 72, 1–31. [Google Scholar] [CrossRef]
  41. Fath, J.P.; Dragicevic, D.; Bittel, L.; Nuhic, A.; Sieg, J.; Hahn, S.; Alsheimer, L.; Spier, B.; Wetzel, T. Quantification of aging mechanisms and inhomogeneity in cycled lithium-ion cells by differential voltage analysis. J. Energy Storage 2019, 25, 100813. [Google Scholar] [CrossRef]
  42. Lewerenz, M.; Marongiu, A.; Warnecke, A.; Sauer, D.U. Differential voltage analysis as a tool for analyzing inhomogeneous aging: A case study for LiFePO4| Graphite cylindrical cells. J. Power Sources 2017, 368, 57–67. [Google Scholar] [CrossRef]
  43. Wang, L.; Pan, C.; Liu, L.; Cheng, Y.; Zhao, X. On-board state of health estimation of LiFePO4 battery pack through differential voltage analysis. Appl. Energy 2016, 168, 465–472. [Google Scholar] [CrossRef]
  44. Zheng, H.; Li, J.; Song, X.; Liu, G.; Battaglia, V.S. A comprehensive understanding of electrode thickness effects on the electrochemical performances of Li-ion battery cathodes. Electrochim. Acta 2012, 71, 258–265. [Google Scholar] [CrossRef]
  45. Smith, K.; Wang, C.Y. Power and thermal characterization of a lithium-ion battery pack for hybrid-electric vehicles. J. Power Sources 2006, 160, 662–673. [Google Scholar] [CrossRef]
  46. Zhao, R.; Liu, J.; Ma, F. Cathode Chemistries and Electrode Parameters Affecting the Fast Charging Performance of Li-Ion Batteries. J. Electrochem. Energy Convers. Storage 2020, 17, 021111. [Google Scholar] [CrossRef]
  47. Yagci, M.C.; Behmann, R.; Daubert, V.; Braun, J.A.; Velten, D.; Bessler, W.G. Electrical and Structural Characterization of Large-Format Lithium Iron Phosphate Cells Used in Home-Storage Systems. Energy Technol. 2021, 9, 2000911. [Google Scholar] [CrossRef]
Figure 1. OCV of graphite (a) and description of phase transitions (b). L stays for dilute, which means that ions are distributed in a liquid way within the layers, and not methodically ordered. Configuration of lithium ions (blue circles) inside carbon layers (black lines) for each stage (c). Crystal structure of graphite with stacking configuration of phase I and II correlated with its lattice parameters (d): blue spheres are intercalated lithium ions, grey spheres are carbon atoms.
Energies 14 06281 g001
Figure 3. Blue lines refer to volume variation of crystal structure of graphite (a) and LFP (b) as a function of lithium stoichiometric index. Graphite follows a different path during lithiation (solid line) and delithiation (dashed line), as stage IIL appears just during delithiation. Red lines refer to OCV of graphite (a) and LFP (b) in delithiation.
Energies 14 06281 g003
Figure 4. Internal structure of a prismatic LIB. From the micro-structure of active material, through the elementary cell, to cell level. Negative and positive electrode thickness are, respectively, t n and t p .
Energies 14 06281 g004
Figure 5. Optical measurement system: Conceptualization (a), realization (b) and the top view sketch (c).
Energies 14 06281 g005
Figure 6. Thickness change during C/10 discharge (a) and charge (b) and its normalization (c) and (d), respectively. Solid lines refers to mean value and error bars identify maximum and minimum range of variation of the measurements in (a) and (b).
Energies 14 06281 g006
Figure 7. Thickness change and respective voltage during discharge (a) and charge (b) at C/10.
Energies 14 06281 g007
Figure 8. Hysteresis of thickness change between charge (red shadows) and discharge (blue shadows) at different C rates: dark shadows identify C/2 rate and light shadows identify C/10 rate. Arrows of respective colour show the path direction.
Energies 14 06281 g008
Figure 9. Thickness change during discharge (a) and charge (b) with different current rates.
Energies 14 06281 g009
Figure 10. Identification of stoichiometric limits fitting the OCV function of single electrodes on the experimental OCV of the cell. OCV function and experimental OCV of the cell (a). The OCV function (a) is given by the difference between OCV functions of cathode and anode (b), whose analytical expressions are reported in Table 2.
Energies 14 06281 g010
Figure 11. Comparison between the fitted model and experimental measurements in discharge (a) and charge (b).
Energies 14 06281 g011
Table 1. Lattice parameter of graphite [33] and LFP [39]. In the lithiation index column, the bold number refers to the maximum composition of that phase, and interval refers to the range where that phase exists. Volume deformation ε v ˜ is referred to as the single phase.
MaterialPhaseLithiation IndexLattice Parameters [Å]Volume [Å 3 ]Volume Deformation [%]
Graphite x 3 a d V ˜ = 3 2 3 a 2 d ε v ˜ = V ˜ V 0 V 0
C 6 0.00 (0.00 ÷ 0.16)4.2683.355158.76 ( V 0 )0%
Stage IV/III0.16 (0.00 ÷ 0.42)4.2823.511167.225.33%
Stage IIL0.24 (0.14 ÷ 0.45)4.2823.519167.615.53%
Stage II0.48 (0.24 ÷ 0.80)4.2873.509167.555.57%
Stage I1.00 (0.48 ÷ 1.00)4.3053.706178.4412.4%
LFP yabc V ˜ = a b c ε v = V ˜ V 0 V 0
F e P O 4 0 (0 ÷ 0.9)5.799.824.79272.36 ( V 0 )0%
L i F e P O 4 1 (0.1 ÷ 1)6.0110.334.69291.396.53%
Table 2. Stoichiometric limits which guarantee the best fit between the experimental OCV and the OCV functions of single electrode. OCV function of graphite is by Christensen and Newman [29], and OCV function of LFP is by Safari et al. [30].
MaterialStoichiometric LimitsOCV Function
Graphite x m i n x m a x
0.010.73 0.124 + 1.5 e x p ( 150 x ) + 0.0155 t a n h x 0.105 0.029 0.011 t a n h x 0.124 0.0226 0.102 t a n h x 0.194 0.142 + 0.0347 t a n h x 0.286 0.083 0.0147 t a n h x 0.5 0.034 0.0045 t a n h x 0.9 0.119 0.022 t a n h x 0.98 0.0164 0.035 t a n h x 0.99 0.05
LFP y m i n y m a x
0.030.96 3.4323 0.8428 e x p 80.2493 ( 1 y ) 1.3198 3.2474 e 6 e x p 20.2645 ( 1 y ) 3.8003 + 3.2482 e 6 e x p 20.2646 ( 1 y ) 3.7995
Table 3. Results of least mean square estimation and electrode properties from in situ measurements [30,44,45,46,47].
ElectrodeEstimated Coefficient ( k i )Thickness ( t i )Active Material Fraction ( ζ i )
LFP 31.5 μ m 70 ÷ 76 μ m 0.381 ÷ 0.43
Graphite 36 μ m 50 ÷ 62.6 μ m 0.55 ÷ 0.6
Publisher’s Note: MDPI stays neutral with regard to jurisdictional claims in published maps and institutional affiliations.

