Article

Reduced Scale Laboratory for Training and Research in Condition-Based Maintenance Strategies for Combustion Engine Power Plants and a Novel Method for Monitoring of Inlet and Exhaust Valves

by
Frederico de Oliveira Assuncao
1,2,
Luiz Eduardo Borges-da-Silva
1,
Helcio Francisco Villa-Nova
1,
Erik Leandro Bonaldi
2,
Levy Ely Lacerda Oliveira
2,
Germano Lambert-Torres
2,
Carlos Eduardo Teixeira
2,
Wilson Cesar Sant’Ana
2,*,
Josue Lacerda
2,
Jose Luiz Marques da Silva Junior
3 and
Edenio Gomes da Silva
3
1
Pro-Reitoria de Pesquisa e Pos-Graduacao (PRPPG), Itajuba Federal University, Itajuba 37500-903, MG, Brazil
2
Gnarus Institute, Itajuba 37500-052, MG, Brazil
3
Rio Amazonas Energia S.A. (RAESA), Manaus 69099-899, AM, Brazil
*
Author to whom correspondence should be addressed.
Energies 2021, 14(19), 6298; https://doi.org/10.3390/en14196298
Submission received: 7 August 2021 / Revised: 22 September 2021 / Accepted: 29 September 2021 / Published: 2 October 2021
(This article belongs to the Special Issue Energy Monitoring Technologies)

Abstract

:
This paper presents the practical aspects of development of a reduced scale laboratory and a set of monitoring tools for Internal Combustion Engines used in Thermal Power Plants. The reduced scale laboratory is based on the necessity of researchers to test new sensors and monitoring strategies that, otherwise, are seldom allowed to be installed in real plants without certification. In addition, the reduced scale laboratory allows the flexibility to insert failures on purpose, in order to evaluate the performance of new sensors/strategies in a safe and controlled environment. The paper also presents the development of a set of reduced cost sensors for monitoring in-cylinder pressure, crank angle, and the position of inlet and exhaust valves (without using ultrasound sensors, which may produce noisy readings on engines operating on gas-diesel fuel mode).

Graphical Abstract

1. Introduction

Condition-Based Maintenance (CBM) is based on the continuous monitoring of certain parameters (vibration, temperature, electrical signals, etc.) of an asset in order to evaluate its condition and decide about a maintenance action [1]. CBM techniques are very important, as whenever a failure condition is detected at an incipient stage, the maintenance can be performed at the appropriate time, avoiding breakdowns and the resulting losses [2,3]. Among the many CBM techniques employed in power plants, it can be highlighted the Electrical Signature Analysis (ESA) [1], which has even been used in order to indirectly detect incipient failures in Internal Combustion Engines (ICE) based on the voltages and currents of the synchronous generator attached to its shaft [4]. Although this last application has the least amount of intrusion on the ICE (once the measurements are taken only at the generator), it is clear that the direct measurement of certain parameters at the engine would provide not only a more realistic view of its condition but also additional information to be correlated to the generator parameters.
One of the main obstacles in the development of CBM strategies/equipment for the ICEs in Thermal Power Plants (TPP) is the difficulty of testing of these strategies/equipment while in early stages of development, as the TPPs have strict security policies, that seldom allow non-certificated equipment in their plants. Hence, a reduced scale laboratory, with similar characteristics of the TPP ICEs, would be of great value in order to perform the development of new CBM strategies and hardware equipment, and this is one of the contributions of this paper. In addition, this reduced scale model must allow for the intentional insertion of failures, by the substitution of parts in good condition with damaged (at certain degrees) ones. A great advantage of a reduced scale model with inserted gradual failures is the possibility to offer training on strategies/equipment to the TPP personnel and simulate with them different stages of a failure in a controlled and safe environment. However, although, in a compact size and reduced cost, the reduce order model must present realistic operation and be compatible with commercial monitoring systems.
The most usual commercial monitoring systems for ICEs used by Brazilian TPPs present features, such as the measurement of the cylinder internal pressure [5,6,7] and the measurement of the crank angle [6], which make a requirement for the reduced scale laboratory to give access to the cylinders and to the crankshaft.
Ideally, an off-the-shelf small size single cylinder diesel generator could be considered for the reduced scale model. However, in order to be more realistic in relation to the actual TPP case, where the simultaneous monitoring of more than one cylinder is desirable (as in a healthy ICE, where all cylinders must contribute equally to the movement of the crankshaft), a six cylinder diesel generator (model C90D6B [8] of manufacturer Cummins, Columbus, IN, USA) has been selected. In addition, in case of off-the-shelf generators, there is no access to the internal pressure of the cylinders; hence, an adaptation had to be performed in the cylinder head of the engine in order to install Thompson valves (similar to the ones available at each cylinder of the large ICEs of the TPPs, such as the Wärtsilä 18V46 [9]). Similarly, small size off-the-shelf generators do not have sensors installed at the crankshaft in order to measure the angular velocity nor the crank angle; hence, another adaptation had to be performed in order to install a high resolution encoder. The required adaptations are discussed in detail in Section 2.2.1 and Section 2.2.2.
Another aspect that this paper focus is in the reduction of costs of the monitoring systems. As seen from the above commercial systems, these are all foreign equipment, whose prices are defined in foreign currencies. It is well known that developing countries (such as Brazil) have unstable currencies and weak economies. The Brazilian government, in order to promote technological innovation, provides tax incentives for private companies and encourages partnerships with universities and research institutes [10]. In addition, according to Guedes [10], the private electricity utilities have to invest at least 1% of their net operating revenues into R & D projects. These projects may include import substitution, as long as there is no copyright/patent infringement, and there is an innovative aspect in them. Hence, a new monitoring system, with functionalities similar to (and compatible with) the commercial imported systems has being proposed. The advantages of the new system are: reduced costs and the development of national technology-besides the general gains of these type of equipment, such as the possibility of operation of the ICE with better fuel efficiency, reduction of non-scheduled stops, and increase on the life time of the monitored asset.
According to d’Ambrosio et al. [11], the in-cylinder pressure has been the principal diagnostic tool for ICEs. It is important to notice that the recent literature presents methods for the estimation of the in-cylinder pressure, such as the works of Romani [12], who performed an indirect measurement of the in-cylinder pressure through the measurement of the force transferred through the cylinder head, using a strain washer; Wang et al. [13], who estimated the in-cylinder pressure from a model based on extended Kalman filter using the crankshaft speed); and Valencia-Duque et al. [14], who used a neural network to predict the pressure from crankshaft angular position fluctuations). However, in order to maintain compatibility with the commercial equipment and in order to have more accurate results, the proposed system uses direct measurement of the in-cylinder pressure. Section 2.3.1 presents the detailed project of the proposed in-cylinder pressure sensor, including a microcontrolled-based circuit that enables Wi-Fi transmission of the data to a remote database.
Besides the possibility of use in the estimation of the in-cylinder pressure (in case a direct measurement is not possible), the measurement of the crank angle enables a more precise curve of pressure (which is taken as a function of the angle). From the commercial systems listed below, the MarPrime, MarPrime Ultra, DPI-2, and DPI Type 50 estimate the crank angle. On the other hand, the LEMAG ECI has an option to physically measure the crank angle, which improves precision. Hence, this feature has also been incorporated into the proposed system. Section 2.3.2 presents a system composed by a high resolution encoder, which also includes a microcontrolled-based circuit that enables Wi-Fi transmission of the encoder data to a remote database.
Finally, a third aspect that this paper deals with is regarding the monitoring of the inlet and exhaust valves. The operating dynamics of the inlet and exhaust valves in internal combustion engines are widely discussed and studied for the understanding of the best form and structure strategy and diagnosis for numerous defects associated with construction and wear problems [15]. Other studies investigate the causes of excessive wear, seeking to improve valve designs and their control structures with greater robustness in the composition of their materials and heat treatment methodology, as they are highly demanded components in the operation of combustion cycles [16]. Other lines of investigation have been recently presented by some authors, who propose the control of the opening and closing of the valves independently, i.e., decoupled from the shaft turns, or with partial participation of the shaft, but, above all, the time and duration of opening and closing, where they are conditioned to the analysis of the machine’s performance instantly [17,18]. Others propose a change in the valves displacement, also acting independently, from the smooth trapezium shape to a straight shape with a rectangular pulse, optimizing the mass flow in the inlet and exhaust [19].
The commercial system MarPrime Ultra [5] has an ultrasonic sensor, in order to determine the timings of opening and closing of the inlet and exhaust valves. However, the technique of monitoring the positions of the inlet and exhaust valves using ultrasound has limitations for gas-diesel hybrid systems, or only diesel, where the transducer return signals are confused with injection noise (as presented in Reference [20]). In these cases, the completion of the opening and closing time instants, or even the duration of the opening and closing cycles are inconclusive. In order to achieve the best adjustment of the machine, in the case of gas-diesel models, the specialist needs to switch the machine completely to diesel to perform the measurements, perform the mechanical adjustments and then return the machine to gas mode. In addition to the generation losses, the loss of monitoring fidelity to the exact point of operation is still notable.
This paper proposes a novel approach to monitor the positions of the inlet and exhaust valves. It is based on a potentiometer (or a TPS—Throttle Position Sensor) adapted to the rocker arms of each valve. Section 2.3.3 presents the proposed resistive sensor to be installed at the rocker arm. The experimental results show that the proposed sensor is capable of providing the same information of the ultrasound sensor, without the issue of injection noise.
It is important to note that monitoring of in-cylinder pressure and positioning of the inlet and exhaust valves are also proposed in Reference [21], which aims to improve the control and efficiency of the internal combustion engine considering the reduction and control of consumption, maximum performance, and gas reduction; however, it does not explore the exact diagnosis of the condition of the valves, nor does it diagnose the participation of the valves in the formation of in-cylinder pressure, such as is proposed in this work, in addition to other objectives.
The rest of the paper is organized as follows: Section 2 presents the performed adaptations in the ICE of the reduced scale model (aiming access to internal cylinder pressure) and the proposed reduced costs sensors. Section 3 presents the experimental results obtained with the proposed measurement system installed at the reduced scale laboratory. Finally, Section 4 presents the main conclusions of the work.

2. Materials and Methods

In order to promote training on aspects related with CBM applied to ICE (either with commercial tools or with the tools developed by the research group), a reduced scale laboratory has been developed. It is based on an off-the-shelf diesel generator with some mechanical adaptations, required in order to measure the in-cylinder pressures and the crank angle. The major advantage to have a reduced scale model is the ability to substitute certain engine parts with defective ones, in order to test new CBM strategies and equipment. Section 2.1 presents a general description about an ICE and its pressure curve. Section 2.2 presents the development of the reduced scale model, where, in Section 2.2.1 and Section 2.2.2, the required adaptations to measure the in-cylinder pressures and the crank angle are presented, respectively.
As part of the program of the Brazilian Electricity Regulatory Agency (ANEEL) to develop national technology, the best features of the commercial monitoring systems have been adapted in a reduced cost equipment (described in Section 2.3). The adapted sensors for in-cylinder pressure and crank shaft angle and velocity are presented in detail in Section 2.3.1 and Section 2.3.2, respectively. In addition, Section 2.3.3 presents the resistive position sensor for the monitoring of the rocker arm (in order to measure the opening and closing of the inlet and exhaust valves).

2.1. General Description of an ICE and Its Pressure Curve

Usually, the combustion-based TPPs use maritime engines (usually with the cylinders in “V”). Figure 1 presents the most relevant parts of an ICE with cylinders in “V” (such as the Wärtsilä 18V46): 1—crankshaft; 2—connecting rod; 3—piston; 4 and 5—exhaust and inlet valves, and 6—fuel injection valve.
The operation of the Wärtsilä 18V46 engine can be summarized, according to Reference [22], as:
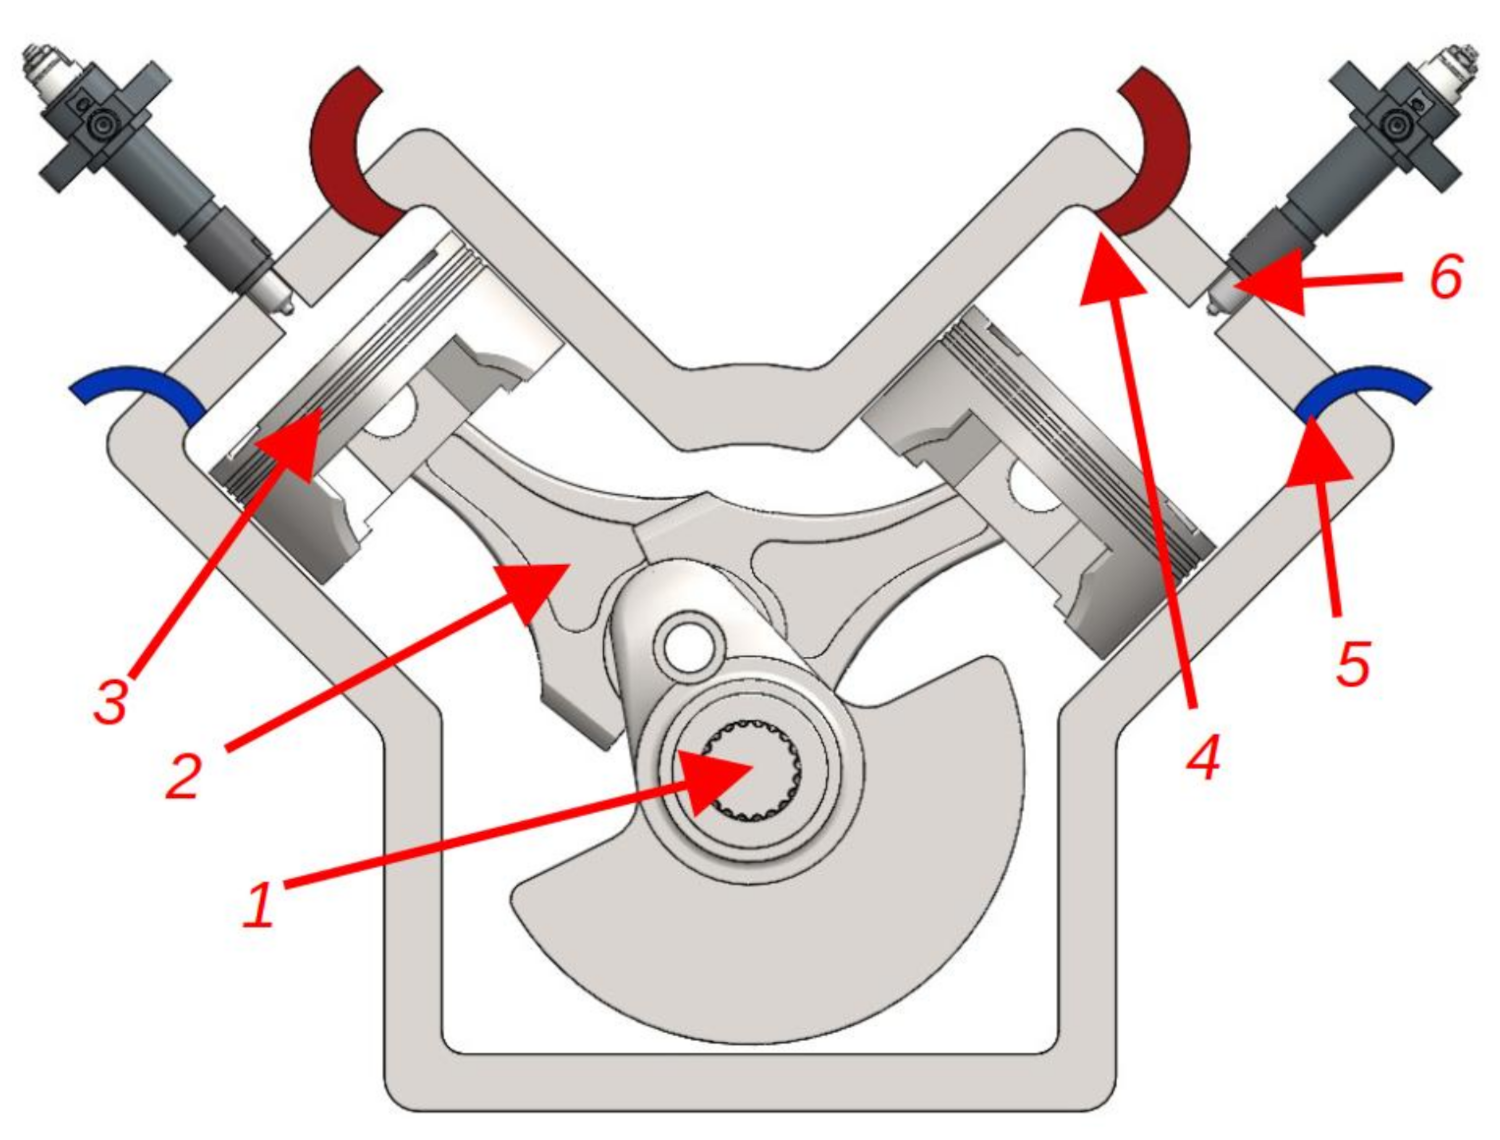
  • The cycle starts with the piston ina motion towards the bottom part of the cylinder and the opening of the inlet valve in order to fill the cylinder with air. Due to the movement of the crankshaft, the pistons operate in alternate motion, and, as soon as it reaches the bottom of the cylinder, it returns towards the top.
  • During motion towards the top, the injection valve releases fuel oil in the cylinder aiming the ignition of the mixture of air and fuel inside the cylinder.
  • As the piston is in upward motion, the compression of the fuel oil produces the combustion of the fuel. The resulting combustion produces a movement of the piston towards the bottom of the cylinder. Whenever the piston starts to move upwards again, the exhaust gas valve releases the hot gases produced in the fuel combustion.
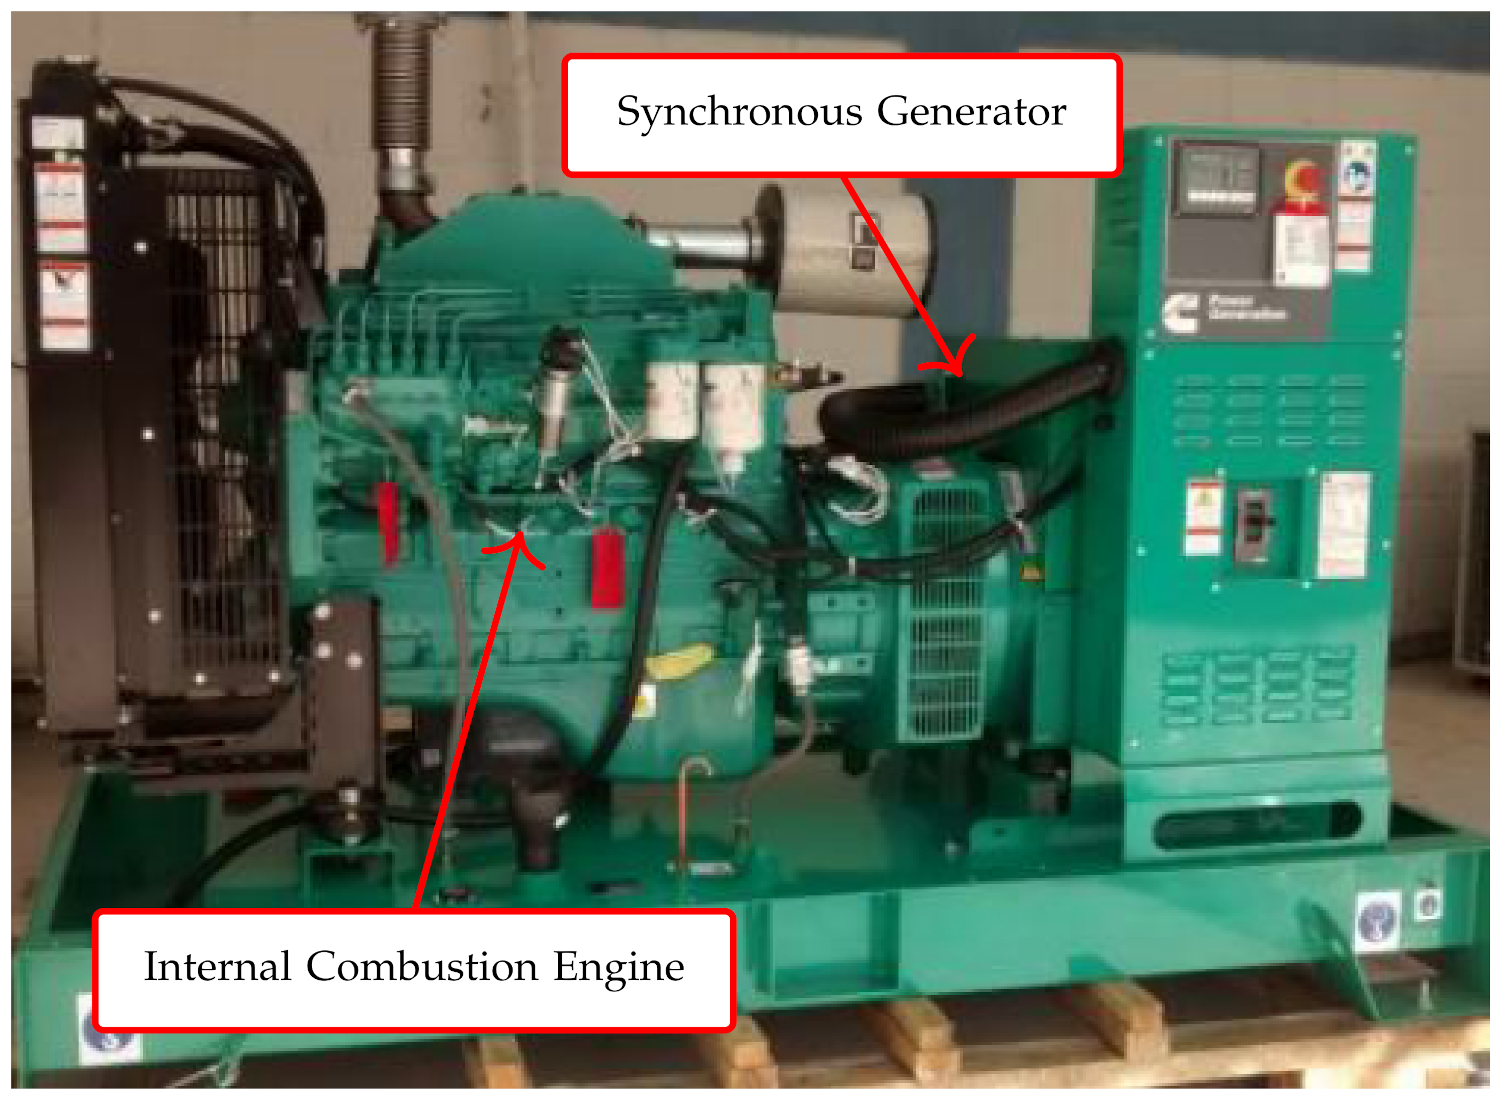
  • The alternating movement of the pistons is transmitted to the crankshaft through the connecting rod. As a synchronous generator is connected to the shaft, electricity is then generated.
In the work of Tunestal [23], the thermodynamic model of an ICE and the derivation of its pressure equation in relation to the crank angle is presented. Here, the modeling is simplified, in order to provide the basics for the interpretation of the pressure curve. Figure 2 presents the crank geometry of an ICE cylinder. The crank angle α is related with the position y of the piston inside the cylinder. The instants of operation of a engine, for a diesel cycle, happen at each 720° rotation of the shaft, where the stages of admission, compression, expansion, and exhaustion take place. At each cycle, the piston travels twice from the limits TDC (Top Dead Center, or the highest position of the piston inside the cylinder) and BDC (Bottom Dead Center, or the lowest position of the piston inside the cylinder). The variation of volume V of the cylinder, in relation the crank angle α can be calculated as Equation (1) [23].
V ( α ) = V c + π B 2 4 l + a ( 1 cos ( α ) ) ( l 2 a 2 sin 2 ( α ) ) 1 / 2 ,
where V c is the clearance volume, B is the cylinder bore diameter, l is the length of the connecting rod, and a is the crank radius.
From the thermodynamic model developed in Reference [23], the variation of pressure in relation to the crank angle ( d p / d α ) can be calculated as Equation (2).
d p d α = ( γ 1 ) k 1 V ( α ) γ p ( α ) d V / d α V ( α ) ,
where γ is a ratio between the specific heats at constant pressure and constant volume. k is a constant of heat gain per crank angle.
The graphical solution of (2) results in the pressure curve of Figure 3. In the figure, some important instants of operation of the ICE are pointed out, which are going to be observed later in the results of Section 3.
  • Instant where the maximum combustion pressure occurs.
  • Descending of the piston.
  • Half-way of descending of the piston.
  • Instant where the piston is at the BDC.
  • The pressure from the exhaust manifold enters into the cylinder as the pressure from the outside is greater than the pressure from the inside.
  • Cylinder pressure rises to equalize with manifold pressure.
  • After the BDC, the piston starts to ascend (which promotes the exhaust gases) and the pressure decreases.
  • Opening of the intake valve.
  • Closing of exhaust valve (intake valve still opened). Cylinder pressure starts to drop until equalize with the manifold pressure at Point 10.
  • Cylinder pressure equalizes with manifold pressure.
  • Closing of the intake valve and increase in pressure.
  • Instant where the piston is at the TDC.

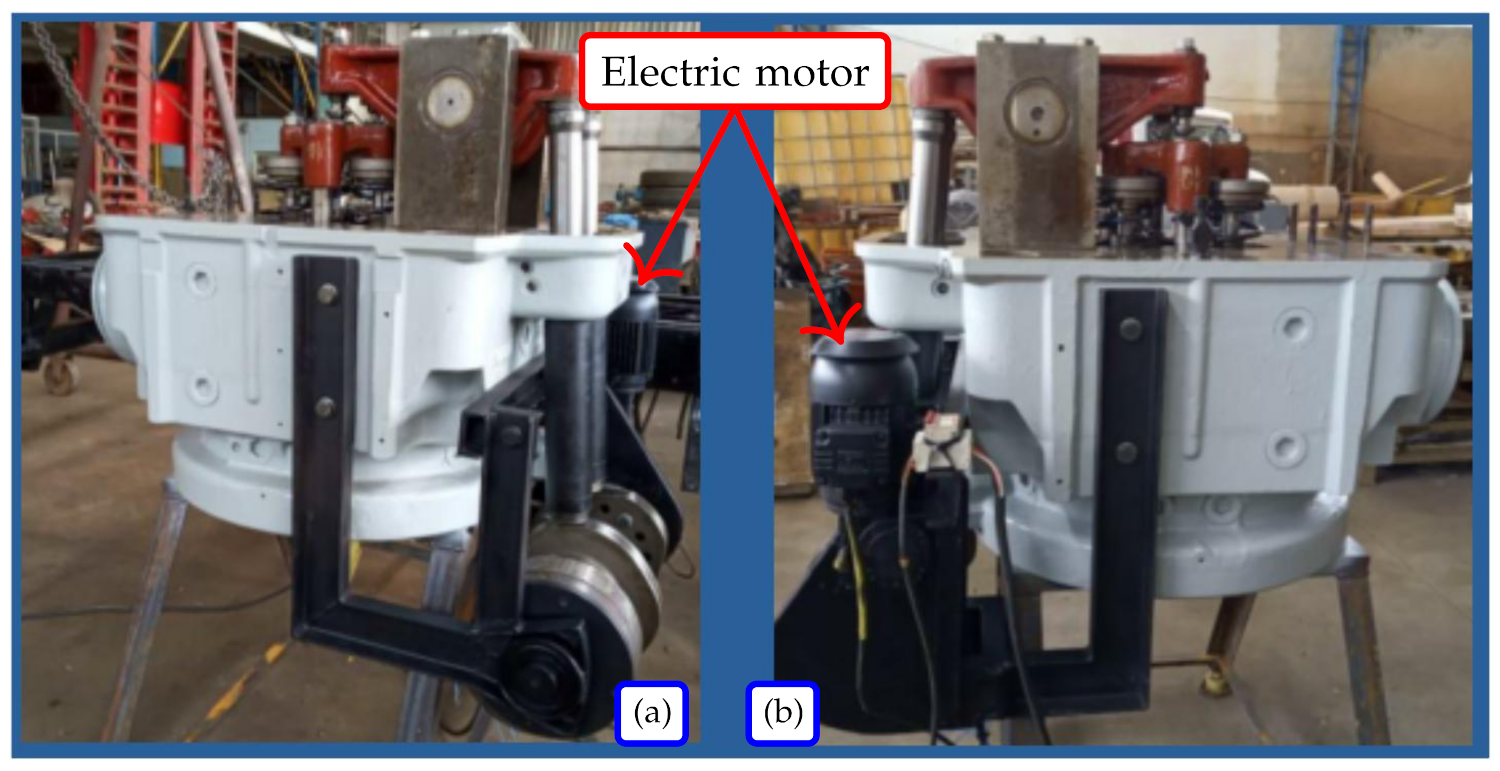
2.2. Reduced Scale Model of ICE-Based Power Generator

Aiming for a smaller size of engine, for the reduced scale laboratory it has been selected a diesel generator (with a truck engine of 6 inline cylinders). Figure 4 presents the diesel generator (of manufacturer Cummins and model C90D6B [8]-rated power of 90 kW/116 kVA; nominal rotation of 1800 rpm). The engine has electronic accelerator, with intercooler and turbo. The whole system is installed in a room with a noise attenuation of 85 dB.

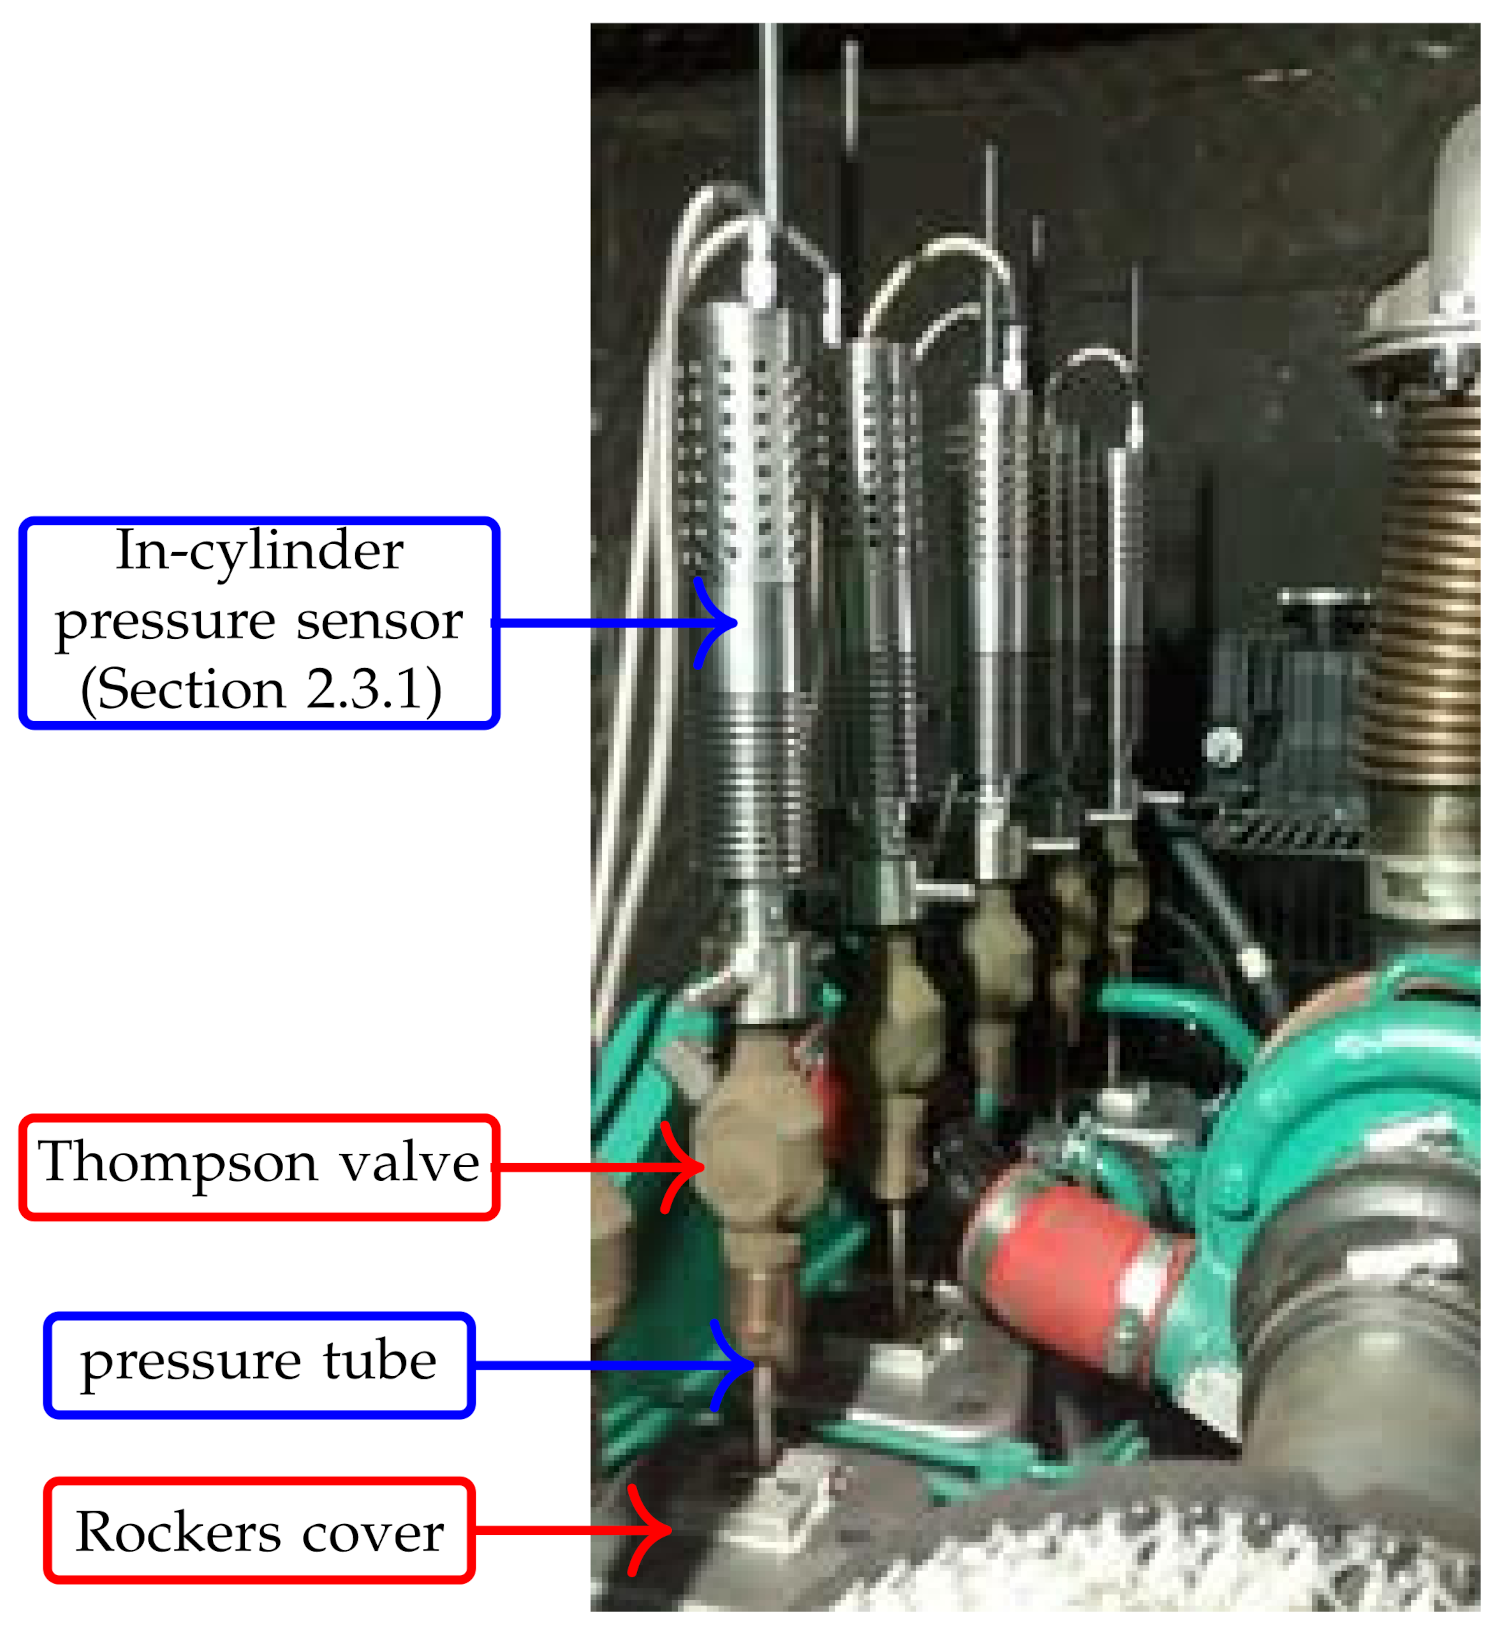
2.2.1. Adaptation of Thompson Valves to the Cylinder Head

Large marine engines, such as the Wärtsilä 18V46 (largely used in the Brazilian combustion TPPs), have Thompson valves already installed in order to measure the in-cylinder pressure. In case of the Cummins C90D6B of the reduced scale laboratory, these valves had to be adapted in the cylinder head. The adopted strategy to install the Thompson valves in the C90D6B ICE has been the creation of a path (one for each of the six cylinders) through the cylinder head using a metallic tube, without allowing leakage from the combustion chamber. Figure 5 presents a photograph of the tube, where the left part (Figure 5a) presents the female thread BSP 3 / 4 where the Thompson valve is inserted, and the right part (Figure 5b) presents the male thread M6 which is inserted at the combustion chamber. Figure 5b also presents an O-ring for sealing against leakages.
For each cylinder, the metallic tube of Figure 5 passes through a vertical hole in the cylinder head, between the intake and exhaust valves rockers, as presented in Figure 6a. Figure 6b presents a more detailed view of one of the cylinder tubes, with the tube passing between the rockers.
Finally, in order to protect the valvetrain (which now has the pressure taps) of the adapted cylinder head, a cover has been installed for each cylinder, leaving exposed only the adapters where the Thompson valves are installed. Figure 7 presents the already finished adaptations on the cylinder head, with the Thompson valves installed on all tubes and the in-cylinder pressure sensors (to be discussed in Section 2.3.1) attached to the valves.

2.2.2. Adaptation of Incremental Encoder to the Crankshaft

In order to be able to implement CBM strategies that requires the crank angle or the crankshaft speed, the reduced scale model must integrate an encoder. Usually, TPPs already have encoders installed at their equipment. In case of the reduced scale laboratory, this feature also had to be adapted on the Cummins C90D6B diesel generator. This diesel generator has an external pulley (in order to transfer motion to the alternator and cooling system) that rotates synchronously with the crankshaft. The solution found has been the adaptation of an extra shaft to the this pulley. Hence, the encoder can be mounted on this extra shaft. Figure 8a presents the 3D concept of the adaptation shaft. Figure 8b presents a photograph of the encoder mounted on the actual shaft, which is attached to the crankshaft pulley.

2.3. Reduced Costs Monitoring System

The proposed reduced costs system for ICE monitoring is composed by an in-cylinder pressure sensor (Section 2.3.1), a high resolution incremental encoder (Section 2.3.2), and a rocker sensor (Section 2.3.3).

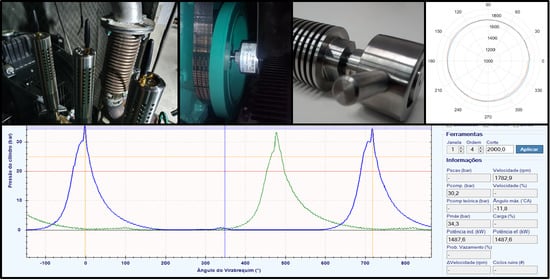
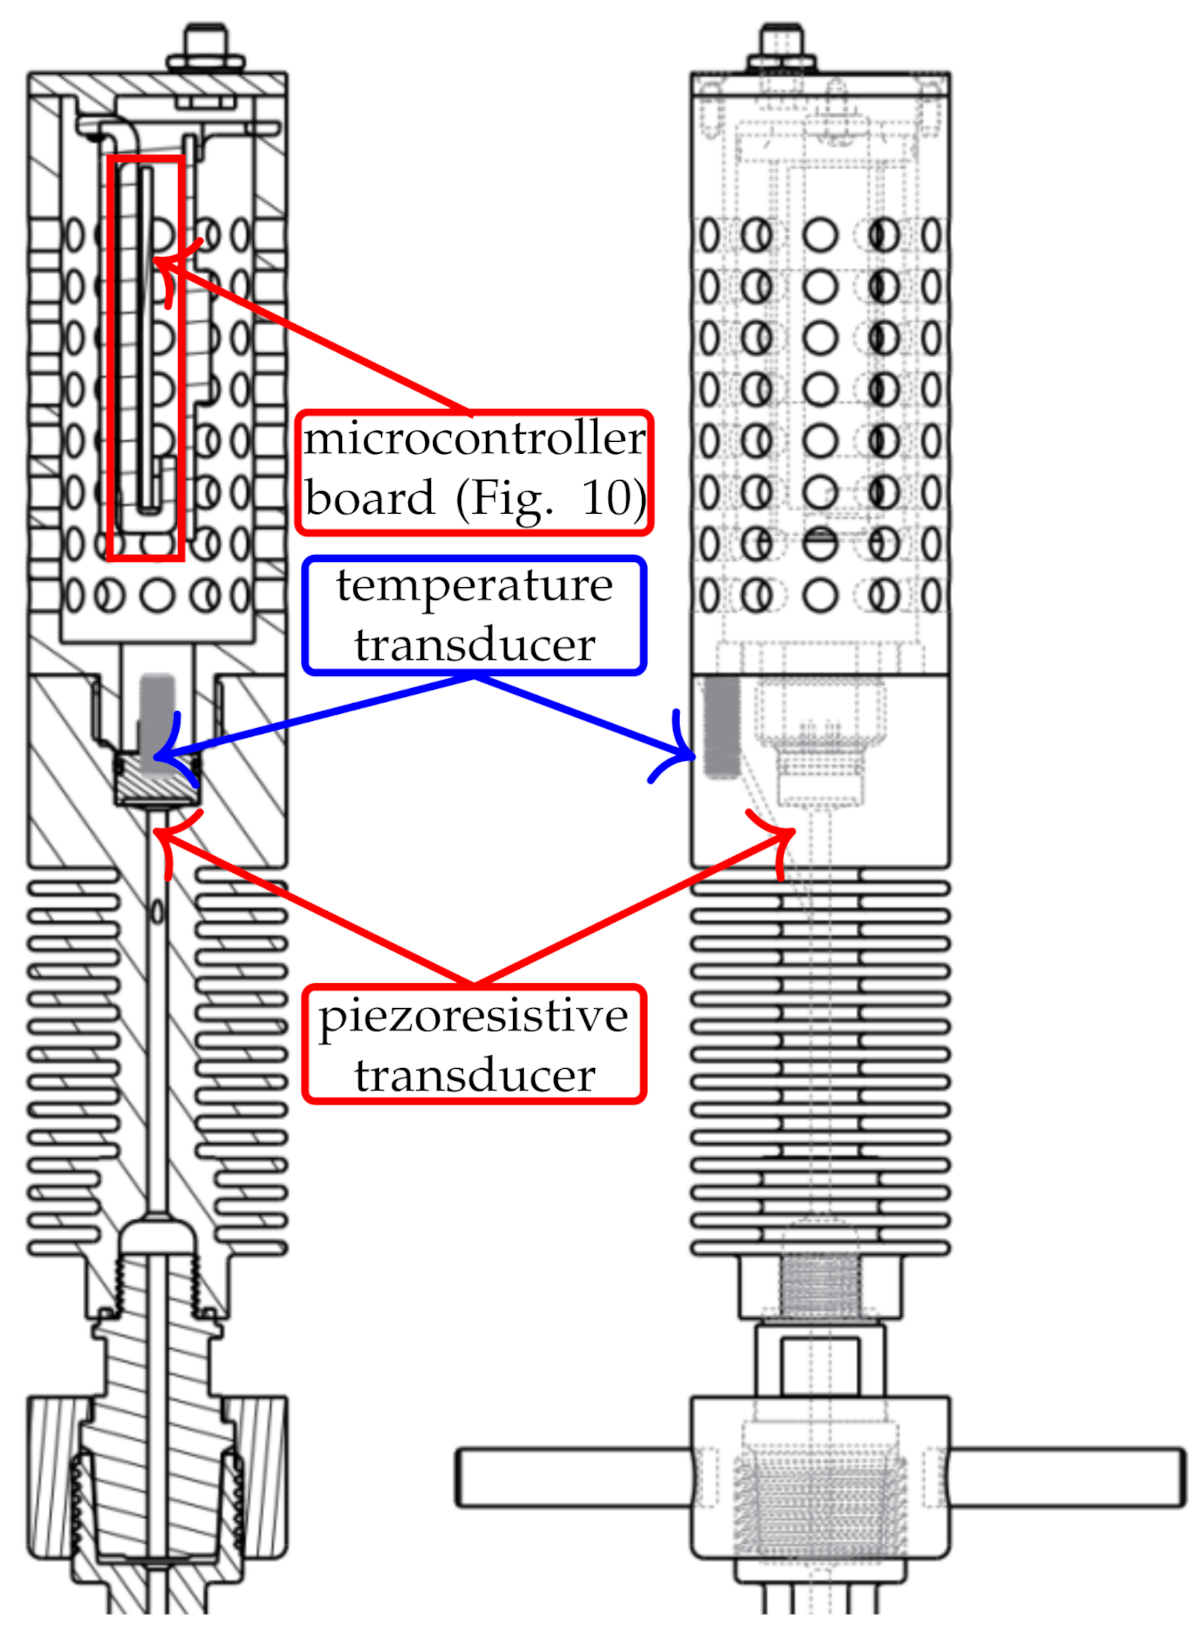
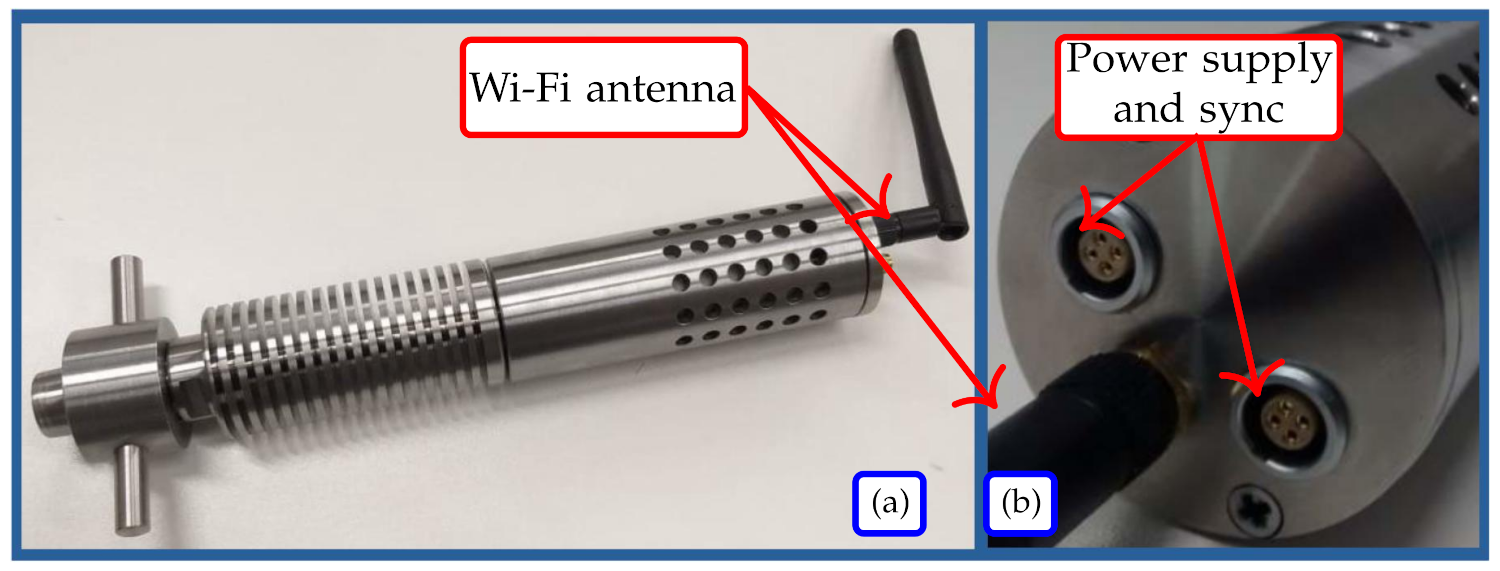
2.3.1. In-Cylinder Pressure Sensor

Although a direct gain of the development of a new in-cylinder pressure sensor is the reduction of costs and the reduction of dependence on foreign technology, the developed product must fit in the same range of applicability of the commercial solutions. According to the data-sheets of the commercial solutions, the MarPrime and MarPrime Ultra [5] have a pressure range from 0 to 300 bar, the LEMAG ECI [6] has a range from 0 to 350 bar, and the DPI [7] has a range from 0 to 250/300 bar. According to the personnel of the TPP partnered in this project, the cylinder working pressure is around 180 bar.
The core part of the sensor is the pressure transducer. A multitude of pressure transducers are well known. Particularly for applications of the in-cylinder pressure of ICEs, the technologies that can be highlighted are: piezoresistive [24], piezoelectric [25], and optical fiber [26]. For this project, a piezoresistive transducer (PA-7L [27], from the manufacturer Keller, Winterthur, Switzerland) has been selected. This sensor has a range from 0 to 200 bar, which is enough for the measurements at the TPP ICE (180 bar) and also for the reduced scale laboratory ICE (whose cylinder pressure is around 35 bar).
In order to dissipate the higher temperature of the combustion chamber to the location of the transducer (and the microcontroller circuits), a metallic housing (in Inox 304) has been developed. Figure 9 presents the conceptual drawing of the sensor housing. The bottom part has a thread to be attached at the Thompson valve. The top part has a connector for a Wi-Fi antenna.
Each of the pressure sensors of proposed system sends the captured data through Wi-Fi communication to a remote computer, running an analysis software. In order to provide the Wi-Fi capability, a microcontroller CC3200 [28] is employed. This microcontroller is based on an ARM Cortex M4 core and has a 4 channel/12 bit analog-to-digital converter (ADC). One of the channels of the ADC receives the data from the pressure transducer and another channel channels receives the data from a temperature transducer (also located inside the sensor housing). The function of the temperature transducer is to provide a compensation for the pressure readings. Figure 10 presents a photograph of the developed board for the CC3200 microcontroller (which is placed at the position indicated in the red rectangle in Figure 9, inside the sensor housing). Figure 10a presents the top layer of the board (with an indication the CC3200 microcontroller and the U.FL connector, to where a pigtail cable connects the Wi-Fi antenna), and Figure 10b presents the bottom layer (with an indication of a micro USB connector to where the microcontroller is programmed).
The readings of all in-cylinder pressure sensors must be synchronized to the same reference. Hence, each in-cylinder pressure sensor receives a sync signal from the encoder of Section 2.3.2. Figure 11a presents a photograph of the proposed in-cylinder pressure sensor. Figure 11b presents a detail of the top part of its metallic housing, where the Wi-Fi antenna is attached and where the power supply and the sync from the encoder are connected.

2.3.2. Angular Velocity and Position

In order to precisely obtain the crank angle, an incremental encoder (model DFS60-TDPA65536 [29]) has been added to the measurement system. Although this encoder has a capability of 65,536 pulses per revolution (which implies in a resolution of 5.4 × 10 3 degrees), in this project, it has been configured to 900 pulses per revolution (resolution of 0.4 degrees). It is important to notice that a resolution of 0.4 degrees is enough for the application and avoids a bottleneck in the Wi-Fi transmission. The output of the encoder is read by a dedicated microcontroller board (the exact same board model of Figure 10, although installed apart from the in-cylinder housings), through its GPIO pins. Then, the microcontroller transmits the crank angle data through Wi-Fi to the remote analysis software. Figure 12 presents the encoder installed on the crankshaft pulley disk.
It is also important to notice that the readings of all in-cylinder pressure sensors (of Section 2.3.1) must be synchronized to the same reference, as the operation of different cylinders can be analyzed together. Hence, the microcontroller board of the encoder sends the sync pulses to all sensors. In order to avoid the receptions at different times, the sync pulses are sent by wires (the white wires seen in Figure 7).

2.3.3. Rocker Arm Sensor

The commercial solutions to monitor the rocker arm are based on ultrasound. It has been observed that, in a hybrid engine (gas and fuel oil), the ability to detect the opening and closing of the valve by ultrasound is compromised due to the noise generated with the entry of high pressure fuel gas [20].
The solution proposed in this paper is the use of a throttle position sensor (TPS), that allows real-time monitoring of all the rocker arm behaviors. These behaviors are, for example, the opening and closing of the valves, opening speed, opening stroke, and dynamics during opening and closing, such as gripping and shaking.
The TPS has the function of determining the angular position of a shaft based on a potentiometer, i.e., its resistance varies, according to the angle. For this project, it has been selected the TPS model 7262, of manufacturer Thompson (Addison, IL, USA).
Unlike the in-cylinder pressure sensor (of Section 2.3.1) and the encoder (of Section 2.3.2), that would fit in both reduced scale laboratory and in the Wärsilä engine of the partnered TPP, the proposed resistive position sensor (due to mechanical specifications) can only be installed at large engines (such as the Wärtsilä 18V46). In order to perform a laboratory test, a 1/18 of cylinder head of a Wärtsilä 18V46 engine has been used. In order to generate motion on its crankshaft (in order to produce the openings and closings of the valves), an electric motor has been adapted (as presented in Figure 13).
Figure 14 presents the resistive sensors installed at each rocker arm of the 1/18 cylinder head.

3. Results and Discussion

The developed sensors have been tested with the reduced scale laboratory. The tests have been performed under different loading conditions (with the use of a variable resistance bank, as shown in Section 3.1). In Section 3.2, the performance of the developed in-cylinder pressure sensor is evaluated in comparison with a commercial system (MarPrime, which is commonly used in TPPs in Brazil). The proposed system has also been evaluated under different failure setups of the reduced scale laboratory (Section 3.3 presents the detection of a failure at the fuel injection of a cylinder).
In addition, the proposed rocker arm sensor has been compared against the conventional ultrasound method, used in the MarPrime Ultra (Section 3.5).

3.1. 96 kW Variable Load

In order to simulate loading levels to the diesel generator of the reduced scale laboratory, a variable resistive load has been used. This load is composed by 8 resistors, of 12 kW each-capaple of producing loading conditions from 12 kW to 96 kW (at increments of 12 kW). The resistors are refrigerated with tap water (at ambient temperature). Figure 15a presents the external part of the variable load (pointing to the inlet valve for the refrigeration water and the electric panel that enables the selection of how many resistances are engaged). Figure 15b presents the internal part of the variable load (where the resistors are immersed in water).

3.2. Comparison between the Proposed In-Cylinder Sensor against a Commercial Solution

With the generator of the reduced scale laboratory motor operating at 50% load (36 kW), the same cylinder of the ICE has been measured with both the MarPrime system and the proposed sensor. Figure 16 presents the MarPrime (Figure 16a) and the proposed (Figure 16b) in-cylinder pressure sensors installed at the reduced scale laboratory.
Figure 17 presents a screen capture of the MarPrime software, displaying the pressure curves of laboratory cylinders at 50% load and no failures inserted. The curve format provides enough details to observe the compression pressure levels, combustion pressure levels, and inlet pressure.
Figure 18 presents the pressure curve obtained with the proposed in-cylinder sensor.
With the proposed sensor, a new set of opportunities are verified, which allows the understanding and analysis of performance and operational failures during the operating cycle. In addition to fidelity to the values found for the same pressure obtained with the commercial sensor, the curve obtained with proposed sensor clearly indicates the operating instants highlighted in Section 2.1 and Figure 3.
Comparing Figure 18 (proposed system) with Figure 17 (commercial system), it can be noted that with the curve provided by the commercial system it is not possible to observe all intervals given the fact that they are average curves for a period of time. With the proposed system, even for the lowest pressures, it is possible to observe moments of pressure change that are directly related to the lag in relation to the TDC. Hence, the maintenance assessment of the engine adjustment conditions can be carried out, which are also performed with reference to the TDC, as well as the performance conditions of the characteristics of the inlet air pressure, exhaust pressure, opening and closing times of the inlet and exhaust valves, and leakage, in addition to a lag between compression and combustion with high resolution and correlation to the efficiency of each combustion cycle.

3.3. Reduced Scale Laboratory with Failure at Fuel Injection of Cylinder 06

Figure 19 presents a simulated failure at the fuel injection of cylinder 06. At this condition, measurements of the in-cylinder pressure have been taken for 50% of capacity of the generator.
This failure represents a potential operating condition due to a problem with the injection nozzle, or even the fuel pump. In order to compare the failure conditions, Figure 20 presents the pressure curve of the cylinder without the failure. It can be observed that both compression and combustion phases take place, as the combustion pressure is higher than the compression. In the figure, the compression pressure P C o m p is the pressure exerted by the piston in the combustion chamber with the air and fuel mixture. In the case of diesel engines, the heat generated with the compression of the air ignites the fuel. In the case of gas or gasoline engines, the compression pressure is lower, as the ignition occurs by electric sparking. The maximum pressure P M a x is the maximum pressure developed in the combustion chamber due to the combustion of the air plus fuel mixture.
Figure 21 presents the pressure curve of the cylinder with the failure. It can be noticed that the combustion phase is absent, as the maximum pressure is equal to the compression pressure. This is due to the fact that, since there is no fuel admitted, combustion will not occur, as only air is being compressed by the piston in the cylinder.

3.4. Failure Detection Using the Proposed Instantaneous Velocity Sensor

In order to validate the proposed instantaneous velocity sensor, tests have been performed for different loading conditions (at no load and at 50% load). In addition, two types of failures have been analyzed: failure of fuel injection at a cylinder (the same type of failure presented in Figure 19) and a loose clearance at the inlet valve of the same cylinder.

3.4.1. Sensibility to Load Variations

Figure 22 and Figure 23 present the instantaneous velocity measured with the proposed sensor at no load (0 kVA) and at 50% load (36 kVA). For both loading conditions, the radius of the circumference linearly indicates the velocity-indicating an even participation of the cylinders at the engine torque. As expected, for higher loads, the velocity tends to decrease (from 1780 rpm at no load to 1757 rpm at 50% load).

3.4.2. Sensibility to Fuel Injection Failure at a Cylinder

Considering a failure of fuel injection at a cylinder (the same type of failure illustrated at Figure 19), Figure 24 presents the instantaneous velocity measured with the proposed sensor at 50% load (36 kVA).
It can be observed that when one of the cylinders is not evenly contributing to the torque, the others have to compensate for that. This results in a region of the curve with a smaller velocity (indicated by the arrow “1” in the Figure 24) and another region with a greater velocity (indicated by the arrow “2”). It can also be observed that, for the case with failure, the circumference is not as circular as the one presented in Figure 23 (without failure, at the same loading condition). It is important to note that, in this paper, only the monitoring system is developed, and any algorithm for detection of the deformation on the circles is outside the scope of the paper.

3.4.3. Sensibility to Loose Clearance at the Air Inlet Valve of a Cylinder

Figure 25 presents a simulated failure of loose clearance at the inlet valve of cylinder 06. This failure is performed with the introduction of a blade between the rocker arm and the valve spring. At this condition, this cylinder receives more air, enhancing its combustion performance in relation to the other cylinders.
Figure 26 presents the instantaneous velocity measured with the proposed sensor at 50% load (36 kVA) at this failure condition of loose clearance of the inlet valve of one of the cylinders.
It can be noticed that, as one of the cylinders has increased combustion performance, the velocity circumference has increased at the point shown by the arrow at Figure 26.

3.5. Position of Inlet and Exhaust Valves

In order to show the limitations of the monitoring the positions of the inlet and exhaust valves using ultrasound, Figure 27 presents a screen capture of the Marprime Ultra software monitoring a Wärtsilä 18V46 engine at a TPP in Brazil, when operating at gas-diesel fuel mode. The blue plot is the obtained in-cylinder pressure, and the red plot is the acoustic emission obtained with the ultrasound sensor. It can be noticed that, due to entry of high pressure fuel gas, the completion of the opening and closing time instants, and the duration of the opening and closing cycles are inconclusive.
In order to test the proposed resistive sensor, the cylinder head of Figure 13 has been used, with both the proposed sensor and the ultrasound sensor installed-in order to perform a comparison. Figure 28 presents the obtained results of the resistive rocker arm sensor, in comparison with an ultrasound sensor, both operating simultaneously.
It can be observed that the position measurements through direct potentiometer gives the same level of information as the indirect ultrasound measurements. It can also be noticed, even at the cylinder head without any fuel, that the ultrasound sensor is significantly noisier than the resistive sensor.
Figure 29, Figure 30 and Figure 31 present the detection of failures at the inlet and exhaust valves using the proposed resistive sensor.
Figure 29 presents the angle variations for the nominal adjustment condition of the inlet valve, whose angular position sensor was set to 0° in the rest position and 6° in the maximum opening condition. It can be noticed that the measured positions are uniform from one cycle to the other. It can also be noticed that the limits coincide with the settings at 0° and 6°.
In order to simulate failures, misadjustments have been intentionally performed at the valve settings. Figure 30 presents the angle variations for the condition where the valve (due to a tight valve clearance) operates with limited stroke. It can be noticed, in the upper rectangle, that the open valve goes only until the limit of 5.5°. It can also be noticed (in the lower rectangle) that the return of the valve produces mechanical vibrations. This condition, for example, could limit the mass flow to the cylinder and, consequently, loss of performance of the internal combustion engine.
Contrarily to the last failure condition, Figure 31 presents the angle variations for the condition where the valve has a loose clearance. It can be noticed that the valve changes its rest position to 0.5° (instead of 0°). This condition could imply a loss of valve sealing, or even delays, in its actuation of the cylinder operating cycle.

3.6. Comparative Summary

Table 1 provides a comparison summary between the proposed system of monitoring against a commercial product (MarPrime Ultra). Both products can monitor the in-cylinder pressure and the inlet and exhaust valves, although, as presented in Figure 27 and Figure 28, the ultrasound sensor for monitoring of the valves used in the MarPrime Ultra might have some noise issues, while the proposed resistive sensor does not. The data acquisitions using the MarPrime system are stored directly at the equipment and must be, later, transferred to a computer for the analysis, while the proposed system transfers the data online via Wi-Fi. As the MarPrime system do not use an encoder, it can only estimate the crank angle, while, with the proposed system, the high resolution encoder provides for a more precise pressure curve. The MarPrime system provides an averaged curve that is the result of of 30 cycles of pressure, which results in a pressure curve without some many details about the operation of the engine (as seen in Figure 17), while the cycle-to-cycle evaluation of the proposed system allows for much more details on the operational conditions (as seen in Figure 18). The in-cylinder pressure sensor of the MarPrime system does not allow repair of its internal components in case of a failure, while the proposed system does. Finally, the proposed system, being produced locally in Brazil, reduces the dependency on foreign technology and promotes local development. This last factor also implies in the reduction of costs for the local market, as imported systems are subjected to currency variations and elevated taxes on imports. A MarPrime Ultra system was acquired in March 2019 for 8800 USD (without considering import taxes). With the import taxes (which, in Brazil, sum up to 100%), the amount paid almost doubles. The proposed system is expected to be commercialized in the Brazilian market for 30,000 BRL (which is equivalent to 5690 USD, considering the exchange rate of September 2021).

4. Conclusions

This paper has presented the development of a reduced scale laboratory, that enables researchers to develop and test new monitoring equipment/strategies in a safe and controlled environment, where the failures can be inserted on purpose by means of replacing parts or intentional maladjustment of settings.
The paper has also presented the development of a set of reduced cost monitoring sensors, for in-cylinder pressure, crank angle, and crankshaft angular velocity, and it also has proposed a novel approach for monitoring the position of inlet and exhaust valves. Conventionally, this measurement is performed using ultrasound sensors (which may be prone to noise contamination when the engine operates in gas-diesel fuel mode).
The proposed inlet and exhaust valve position measurement system used a resistive sensor attached to the rocker arm of the valve. This approach enabled a direct and accurate way of tracking the opening and closing, as well as the state of the valve stroke extensions and their dynamics in every instant of cylinder operation. This measurement synchronized by the motor shaft allowed systematically predictive monitoring of failures, such as excessive slacks, jams, carbonization of the valve seat, and loss of adjustments.
The paper followed a practical approach on the making of the reduced scale laboratory and the sensors.
It is important to notice that, although it may seem contradictory that a country that historically had high penetration of renewable sources in its energy mix is, in the last two/three decades, heavily investing in generation using fossil fuels (the historical, political, and economical particularities of the Brazilian energy market is presented in Reference [30]), due to its continental dimensions, investments in technology for monitoring combustion engine power plants are economically justified and, more importantly, provide for less technological dependence on foreign equipment.
In addition, although not verified in the experiments, it is believed that the proposed monitoring equipment allows a better adjustment of the operational point of the combustion engine, which, consequently, lowers the emissions of pollutants in the atmosphere. The best operating condition of the engine corresponds to the admission of the correct amount of air and fuel for an efficient burning, within the demand of engine power and physical characteristics of the chamber. The occurrence of advances or delays in fuel injection, or inadequate quantities, result in incomplete combustion and increased generation of polluting gases. All of these are believed to be important secondary gains of the proposed sensors, although a study on this subject is left for future work.

Author Contributions

Conceptualization, F.d.O.A., H.F.V.-N., L.E.B.-d.-S., E.L.B., J.L., J.L.M.d.S.J., and E.G.d.S.; Investigation, F.d.O.A., L.E.B.-d.-S., H.F.V.-N., E.L.B., L.E.L.O., C.E.T., J.L., J.L.M.d.S.J., and E.G.d.S.; Methodology and Software, F.d.O.A., L.E.B.-d.-S., E.L.B., L.E.L.O., G.L.-T., and C.E.T.; Writing, F.d.O.A. and W.C.S. All authors have read and agreed to the published version of the manuscript.

Funding

This research received no external funding.

Institutional Review Board Statement

Not applicable.

Informed Consent Statement

Not applicable.

Acknowledgments

The authors would like to thank RAESA and the following Brazilian Research Agencies: CNPq, CAPES, and ANEEL R & D for the support of this project.

Conflicts of Interest

The authors declare no conflict of interest.

Abbreviations

The following abbreviations are used in this manuscript:
ADCAnalog-to-Digital Converter
ANEELAgência Nacional de Energia Elétrica (Brazilian Electricity Regulatory Agency)
BDCBottom Dead Center
CBMCondition-Based Maintenance
ESAElectrical Signature Analysis
FRAFrequency Response Analysis
GDGas-Diesel (GD)
GPIOGeneral Purpose Input/Output
HFOHeavy Fuel Oil
ICEInternal Combustion Engine
TDCTop Dead Center
TPPThermal Power Plants
TPSThrottle Position Sensor

References

  1. Salomon, C.P.; Ferreira, C.; Sant’Ana, W.C.; Lambert-Torres, G.; Borges da Silva, L.E.; Bonaldi, E.L.; de Oliveira, L.E.d.L.; Torres, B.S. A Study of Fault Diagnosis Based on Electrical Signature Analysis for Synchronous Generators Predictive Maintenance in Bulk Electric Systems. Energies 2019, 12, 1506. [Google Scholar] [CrossRef] [Green Version]
  2. Ribeiro, L.C.; Bonaldi, E.L.; de Oliveira, L.E.L.; Borges da Silva, L.E.; Salomon, C.P.; Santana, W.C.; Borges da Silva, J.G.; Lambert-Torres, G. Equipment for Predictive Maintenance in Hydrogenerators. AASRI Procedia 2014, 7, 75–80. [Google Scholar] [CrossRef]
  3. Sant’Ana, W.C.; Lambert-Torres, G.; Borges da Silva, L.E.; Bonaldi, E.L.; de Lacerda de Oliveira, L.E.; Salomon, C.P.; Borges da Silva, J.G. Influence of rotor position on the repeatability of frequency response analysis measurements on rotating machines and a statistical approach for more meaningful diagnostics. Electr. Power Syst. Res. 2016, 133, 71–78. [Google Scholar] [CrossRef]
  4. Mendonca, P.; Bonaldi, E.; de Oliveira, L.; Lambert-Torres, G.; da Silva, J.B.; da Silva, L.B.; Salomon, C.; Santana, W.; Shinohara, A. Detection and modelling of incipient failures in internal combustion engine driven generators using Electrical Signature Analysis. Electr. Power Syst. Res. 2017, 149, 30–45. [Google Scholar] [CrossRef]
  5. Maridis GmbH. MarPrime Technical Data; Maridis GmbH: Rostock, Germany, 2015. [Google Scholar]
  6. Chris-Marine, A.B. LEMAG ECI Product Sheet; Chris-Marine AB: Malmö, Sweden, 2019. [Google Scholar]
  7. Friedrich Leutert GmbH & Co. KG. Digital Pressure Indicator DPI Data Sheet; Friedrich Leutert GmbH & Co. KG: Adendorf, Germany, 2019. [Google Scholar]
  8. Cummins Power Generation. Grupos Geradores Diesel-Catalog 5001120; Cummins Power Generation: Columbus, IN, USA, 2016. [Google Scholar]
  9. Wärtsilä Corporation. Wärtsilä 46 Technology Review; Wärtsilä Corporation: Helsinki, Finland, 2008. [Google Scholar]
  10. Guedes, C.F.B. An Overview of the Network for Research and Development (R&D) on Public Policy of the Brazilian Electricity Sector; The George Washington University—Minerva Program; Spring: Washington, DC, USA, 2011. [Google Scholar]
  11. d’Ambrosio, S.; Ferrari, A.; Galleani, L. In-cylinder pressure-based direct techniques and time frequency analysis for combustion diagnostics in IC engines. Energy Convers. Manag. 2015, 99, 299–312. [Google Scholar] [CrossRef]
  12. Romani, L.; Bianchini, A.; Vichi, G.; Bellissima, A.; Ferrara, G. Experimental Assessment of a Methodology for the Indirect in-Cylinder Pressure Evaluation in Four-Stroke Internal Combustion Engines. Energies 2018, 11, 1982. [Google Scholar] [CrossRef] [Green Version]
  13. Wang, Q.; Sun, T.; Lyu, Z.; Gao, D. A Virtual In-Cylinder Pressure Sensor Based on EKF and Frequency-Amplitude-Modulation Fourier-Series Method. Sensors 2019, 19, 3122. [Google Scholar] [CrossRef] [PubMed] [Green Version]
  14. Valencia-Duque, A.F.; Cardenas-Pena, D.A.; Alvarez-Meza, A.M.; Orozco-Gutierrez, A.A.; Quintero-Riaza, H.F. Tdnn-Based Engine In-Cylinder Pressure Estimation from Shaft Velocity Spectral Representation. Sensors 2021, 21, 2186. [Google Scholar] [CrossRef] [PubMed]
  15. Lewis, R. Wear of Diesel Engine Inlet Valves and Seats. Ph.D. Thesis, University of Sheffield, Sheffield, UK, 2000. [Google Scholar]
  16. Vardar, N.; Ekerim, A. Investigation of exhaust valve failure in heavy-duty diesel engine. Gazi Univ. J. Sci. 2010, 23, 493–499. [Google Scholar]
  17. Basbous, T.; Younes, R.; Ilinca, A.; Perron, J. Fuel consumption evaluation of an optimized new hybrid pneumatic–combustion vehicle engine on several driving cycles. Int. J. Engine Res. 2012, 13, 253–273. [Google Scholar] [CrossRef]
  18. Balmelli, M.; Zsiga, N.; Merotto, L.; Soltic, P. Effect of the Intake Valve Lift and Closing Angle on Part Load Efficiency of a Spark Ignition Engine. Energies 2020, 13, 1682. [Google Scholar] [CrossRef] [Green Version]
  19. Yin, S. Volumetric Efficiency Modeling of a Four Stroke IC Engine. Master’s Thesis, Colorado State University, Fort Collins, CO, USA, 2017. [Google Scholar]
  20. Bonaldi, E.L.; de Souza, S.F.; de Souza Lima, D.; da Costa Lacerda, J.; da Silva, L.E.B.; de Oliveira, L.E.d.L.; de Oliveira Assuncao, F.; Santos, C.A.; Teixeira, C.E.; Campos, M.M.; et al. Monitoring System of Power Operation Condition of Internal Combustion Engines. In Proceedings of the 13th Latin-American Congress On Electricity Generation and Transmission—CLAGTEE 2019, Santiago, Chile, 20–23 October 2019. [Google Scholar]
  21. Behre, L.; Mercorelli, P. Sensing of the Engine Cylinder Valves Motion. Proceedings 2017, 1, 26. [Google Scholar] [CrossRef] [Green Version]
  22. Boas, F.M.V.; da Silva, L.E.B.; Villa-Nova, H.F.; Bonaldi, E.L.; Oliveira, L.E.L.; Lambert-Torres, G.; de Oliveira Assuncao, F.; de Almeida Costa, C.I.; Campos, M.M.; Sant’Ana, W.C.; et al. Condition Monitoring of Internal Combustion Engines in Thermal Power Plants based on Control Charts and Adapted Nelson Rules. Energies 2021, 14, 4924. [Google Scholar] [CrossRef]
  23. Tunestal, P. TDC offset estimation from motored cylinder pressure data based on heat release shaping. Oil Gas Sci. Technol.- D’IFP Energies Nouv. 2011, 66, 705–716. [Google Scholar] [CrossRef] [Green Version]
  24. Kurtz, A.; Kane, A.; Goodman, S.; Landmann, W.; Geras, L.; Ned, A. High Accuracy Piezoresistive Internal Combustion Engine Transducers; Automotive Testing Expo: Messe Stuttgart, Germany, 2004. [Google Scholar]
  25. Bąkowski, A.; Radziszewski, L.; Žmindák, M. Dynamic pressure measurement and uncertainty analysis using a piezoelectric transducer for a combustion engine. Appl. Mech. Mater. 2016, 827, 77–82. [Google Scholar]
  26. Wlodarczyk, M.T. Fiber optic-based in-cylinder pressure sensor for advanced engine control and monitoring. Combust. Engines 2012, 151, 3–8. [Google Scholar] [CrossRef]
  27. KELLER AG. Series 7L Piezoresistive OEM Pressure Transducers with High Stability in a Compact Design—Edition 01/2021; KELLER AG: Winterthur, Switzerland, 2021. [Google Scholar]
  28. Texas Instruments. CC3200 SimpleLink Wi-Fi and Internet-of-Things Solution, a Single-Chip Wireless MCU-SWAS032F; Texas Instruments: Dallas, TX, USA, 2015. [Google Scholar]
  29. SICK AG. DFS60-TDPA65536 Product Satasheet; SICK AG: Waldkirch, Germany, 2021. [Google Scholar]
  30. Santos, A.Q.O.; da Silva, A.R.; Ledesma, J.J.G.; de Almeida, A.B.; Cavallari, M.R.; Junior, O.H.A. Electricity Market in Brazil: A Critical Review on the Ongoing Reform. Energies 2021, 14, 2873. [Google Scholar] [CrossRef]
Figure 1. Representation of combustion engine with cylinders in “V” (such as the Wärtsilä 18V46). From [22].
Energies 14 06298 g001
Figure 2. Crank geometry of a cylinder. Developed from [23].
Energies 14 06298 g002
Figure 3. Variation of in-cylinder pressure in relation to the crank angle.
Energies 14 06298 g003
Figure 4. Unmodified diesel generator of the reduced scale laboratory.
Energies 14 06298 g004
Figure 5. Adaptation tube for in-cylinder pressure measurement—(a) zoom on the BSP 3 / 4 thread (where the Thompson valve is inserted)—(b) tube with male M6 thread (which is inserted at the combustion chamber).
Energies 14 06298 g005
Figure 6. In-cylinder pressure tubes installed at the cylinder head—(a) general view—(b) zoom of one of the cylinder tubes.
Energies 14 06298 g006
Figure 7. In-cylinder pressure sensors attached to the Thompson valves.
Energies 14 06298 g007
Figure 8. Adaptation of the encoder to the crankshaft pulley—(a) 3D concept of the adapter—(b) actual photograph.
Energies 14 06298 g008
Figure 9. Conceptual drawing of the sensor housing.
Energies 14 06298 g009
Figure 10. Microcontroller board (Wi-Fi, analog, and GPIOs)—(a) top layer—(b) bottom layer.
Energies 14 06298 g010
Figure 11. Proposed In-Cylinder pressure sensor with Wi-Fi connectivity—(a) general view—(b) zoom of the top part of the sensor.
Energies 14 06298 g011
Figure 12. Encoder installed on the crankshaft pulley disk.
Energies 14 06298 g012
Figure 13. 1/18 of Wärtsilä 18v46 Cylinder Head with adapted electric motor at the crankshaft—(a) left view—(b) right view.
Energies 14 06298 g013
Figure 14. Resistive sensors installed at the rocker arms.
Energies 14 06298 g014
Figure 15. Variable load—(a) general view—(b) resistors immersed in water.
Energies 14 06298 g015
Figure 16. In-cylinder pressure sensors installed at the reduced scale laboratory—(a) commercial system—(b) proposed system.
Energies 14 06298 g016
Figure 17. In-cylinder pressure curves obtained with the MarPrime software at 50% load (36 kVA).
Energies 14 06298 g017
Figure 18. In-cylinder pressure curve obtained with the proposed sensor at 50% load (36 kVA).
Energies 14 06298 g018
Figure 19. Simulated failure at the fuel injection of Cylinder 06.
Energies 14 06298 g019
Figure 20. In-cylinder pressure curve obtained with the proposed sensor at 50% load (36 kVA) without failures.
Energies 14 06298 g020
Figure 21. In-cylinder pressure curve obtained with the proposed sensor at 50% load (36 kVA) with fuel injection failure.
Energies 14 06298 g021
Figure 22. Instantaneous velocity measured with the proposed sensor—No Load-No Failures.
Energies 14 06298 g022
Figure 23. Instantaneous velocity measured with the proposed sensor—50% Load-No Failures.
Energies 14 06298 g023
Figure 24. Instantaneous velocity measured with the proposed sensor—50% Load-Fuel Injection Failure.
Energies 14 06298 g024
Figure 25. Simulated failure of loose clearance at the inlet valve of Cylinder 06.
Energies 14 06298 g025
Figure 26. Instantaneous velocity measured with the proposed sensor—50% Load-Loose Clearance of Inlet Valve Failure.
Energies 14 06298 g026
Figure 27. Ultrasound noise at valves monitoring-screen capture of the Marprime Ultra software.
Energies 14 06298 g027
Figure 28. Comparison between Ultrasound and proposed Rocker Arm sensor based on Potentiometer.
Energies 14 06298 g028
Figure 29. Inlet valve position, measured with the proposed resistive sensor—nominal valve adjustment.
Energies 14 06298 g029
Figure 30. Inlet valve position, measured with the proposed resistive sensor—Tight Valve Clearance.
Energies 14 06298 g030
Figure 31. Inlet valve position, measured with the proposed resistive sensor—Loose Valve Clearance.
Energies 14 06298 g031
Table 1. Comparison of features between the proposed system and the a commercial system.
FeatureMarPrime UltraProposed System
In-cylinder pressure
Inlet and Exhaust valves
Immunity to noise on the valve measurements
Online acquisition
Synchronism with crank angle
Cycle-to-cycle evaluation
Possibility of repair in the pressure sensor
Brazilian national product
Price at the Brazilian market *80,000 BRL (≈ 15,140 USD)30,000 BRL (≈ 5690 USD)
* The price at the Brazilian market includes the import taxes, which almost doubles the international retail price of 8800 USD.
Publisher’s Note: MDPI stays neutral with regard to jurisdictional claims in published maps and institutional affiliations.

