Abstract
To fulfill the consumption demand of low-cost fuel ethanol, an advanced process for feedstock fermentation and bioethanol extraction was required. This study proposed a process of combined continuous solid-state distillation and vapor permeation to extract ethanol from fermented sweet sorghum bagasse on the basis of advanced solid-state fermentation technology. Ethanol undergoes only one phase transition separation in the whole process, which drastically reduces energy consumption compared to the repeating phase transitions that occur in conventional bioethanol production. The mass balance and energy consumption of combining processes were simulated overall. A techno-economic evaluation was conducted on the flowsheet. Costs and profit of fuel ethanol produced by one phase transition separation bioethanol-producing technology were comprehensively calculated. The results of the present study show that the proposed process is an energy efficient and cost-effective alternative to conventional bioethanol production.
1. Introduction
Fuel ethanol is the most commonly used substitute for fossil fuel in the field of transportation, with a worldwide production capacity of 98.2 billion liters in 2020 and growing gradually [1,2]. Fuel ethanol can be blended with gasoline at 5~15% without any engine modification [3]. In the context of achieving ‘zero carbon emissions’ globally, bio-production of fuel ethanol was attracting considerable attention, because it can absorb carbon dioxide during plant growth and reduce greenhouse gas emissions during combustion [4,5,6].
Starch crops are currently the main biomass feedstock for bioethanol production. Liquefaction and pasting before alcoholic fermentation increased the energy and water consumption [7,8]. Even using sugar-based feedstock, for example sweet sorghum or sugar cane via liquid fermentation, much energy consumption for squeezing juice from crops is required [9,10]. The treatment of waste water with a large amount of biochemical oxygen demand is likewise a serious issue for liquid fermentation [11].
Solid-state fermentation is superior to liquid fermentation in that it can convert fermentable sugars into ethanol without juicing and additional water input. Along with the energy and water saving, the ethanol conversion rate is also increased in solid-state fermentation. However, low moisture in solid-state fermentation leads to inefficient mass and heat transfer. Advanced solid-state fermentation (ASSF) technology overcomes the above disadvantages with a specially designed rotary drum reactor to improve mass and heat transfer. The ethanol yield could reach 91% of the theoretical yield by ASSF with proprietary yeast on sweet sorghum stalks [12,13,14].
The availability of efficient ethanol enrichment technology is the key factor for reducing bioethanol cost as the enrichment process requires at least 60% of total energy consumption of ethanol production [13,15]. Conventionally, the recovery of ethanol from fermentation broth is accomplished by rectification operation. Ethanol-water azeotrope can be obtained at the condenser outlet at the top of the rectification column. Extractive distillation technology is usually utilized to continue enhancing ethanol concentration to fuel grade [16]. Rectification has the advantages of high ethanol recovery, but increases the production energy consumption and ethanol cost due to repeated phase transition during operation [15,17].
Previously, a continuous solid-state distillation (CSSD) technology for ethanol extraction was reported [18]. The combination of ASSF reactor and CSSD column can produce an ethanol-water vapor mixture from fermented sweet sorghum bagasse (FSSB) continuously [19]. Owing to the stripping effect of solid-state distillation, a stable vapor flow containing about 25 wt% ethanol can be obtained overhead the CSSD column, which has much higher ethanol content than liquid fermentation broth [18,20]. Membrane separation such as vapor permeation (VP) as an alternative to rectification in ethanol recovery is less energy intensive, but the industrial application cost is slightly higher [21,22,23]. VP can not only utilize the energy of the CSSD column outlet vapor, but also greatly reduce the required membrane area compared with liquid fermentation. Moreover, the reasonable layout could enable the vapor to keep its phase state until reaching product concentration [24].
Therefore, this study will focus on the feasibility of the combination of high-efficiency ethanol enrichment technology and sweet sorghum solid-state fermentation to further extend the ASSF advantages in energy saving and wastewater reduction. It is expected to achieve only one phase transition during stripping in entire ethanol conversion process from FSSB to fuel grade product. The approach can minimize the cost and energy consumption of bioethanol production. A techno-economic evaluation was conducted based on simulation results and existing ASSF demonstration plant information to predict the prospect of industrial application of one phase transition separation (OPTS) technology.
2. Materials and Methods
2.1. Materials
2.1.1. Raw Material
Sweet sorghum is a high photosynthetic efficient C4 crop with sugar-rich stalks. It is widely cultivated as a non-grain plant for bioethanol production in China and especially suitable for solid-state fermentation [25,26].
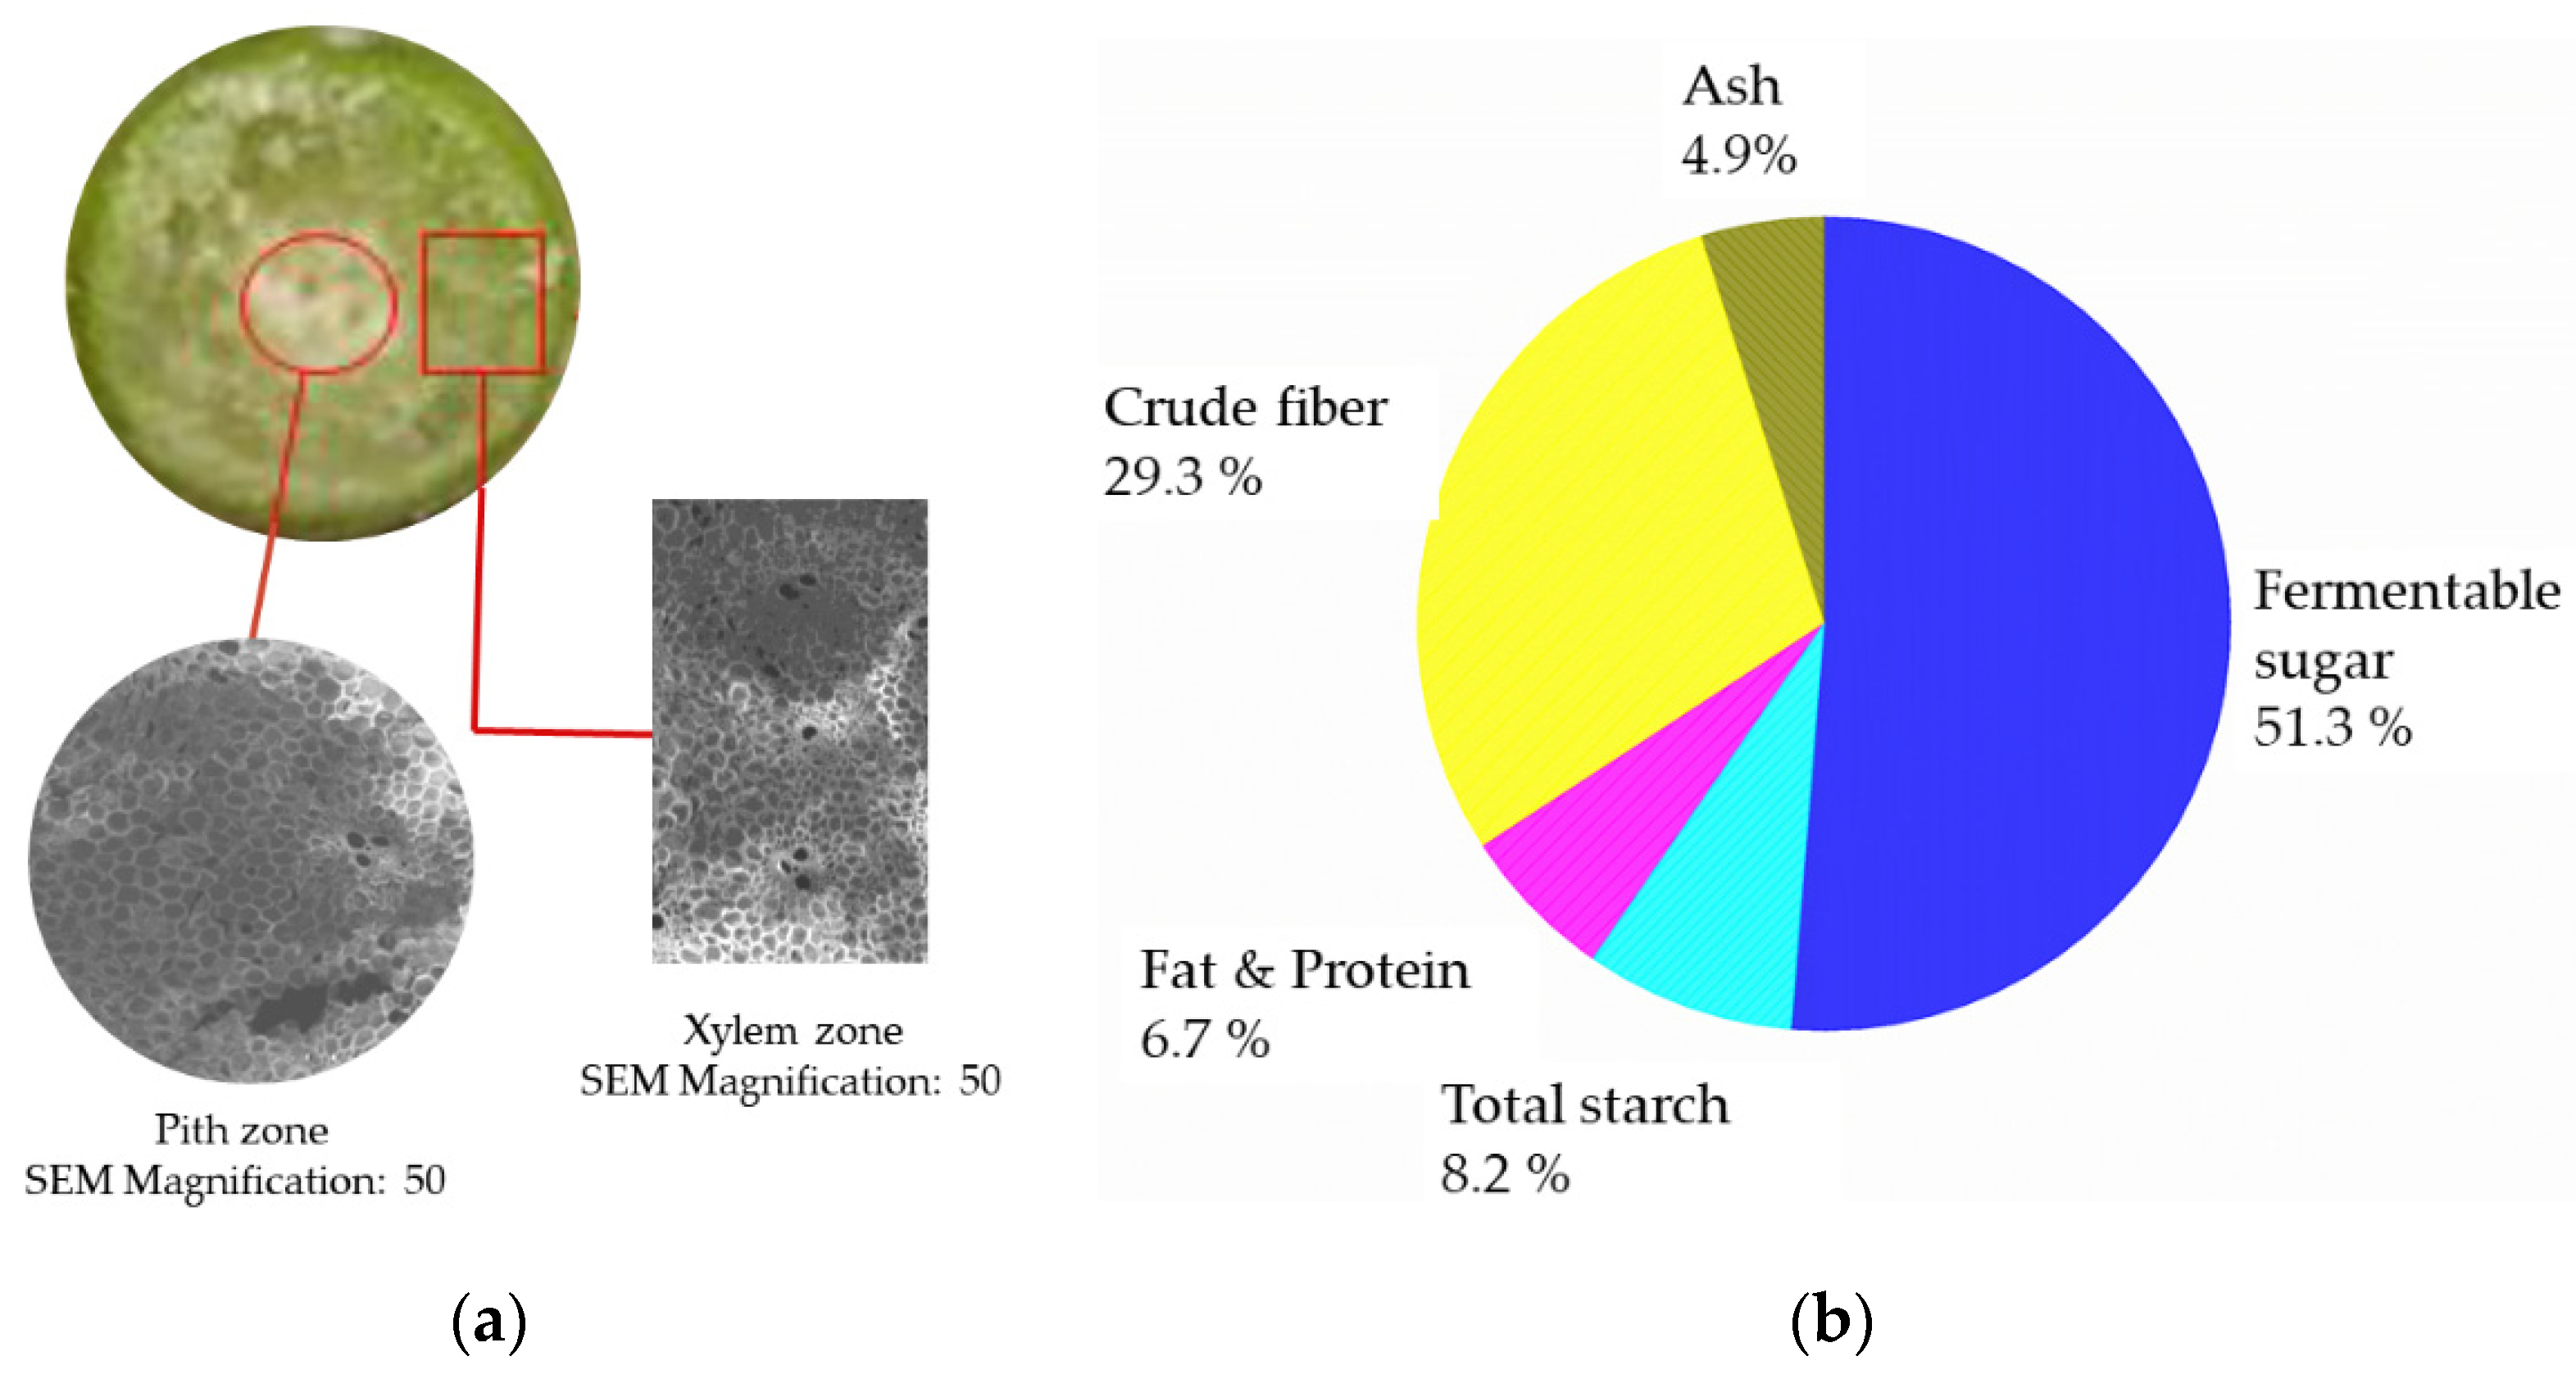
The structure of sweet sorghum stalks can be divided into two zones of pith and xylem, as displayed in Figure 1a. It can be seen that the xylem has compact and flexible fibers, while the pith has relatively loose fibers [27]. Both xylem and pith are composed of parenchyma cells and scattered vascular bundles, which provide the solid substrate for yeast growth. Sweet sorghum stalks without stem bark and leaves were pulverized into particles before fermentation. According to the cumulative component analysis of our lab on sweet sorghum stalks of different varieties, the average moisture content of stalks is 71.1 wt%. Fermentable sugar accounts for 51.3 wt% and crude fiber accounts for 29.3 wt% of dry weight [28,29]. The rest is composed of total starch, fat, protein and ash, as shown in Figure 1b. These data are the initial inputs of the simulation.
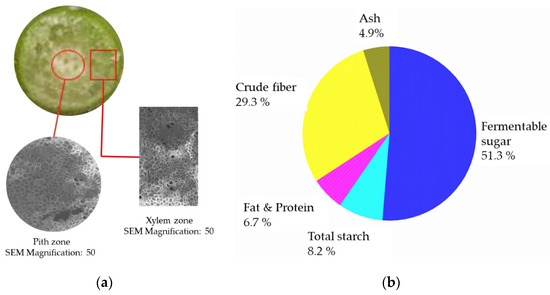
Figure 1.
Structure and composition of sweet sorghum stalks. (a) Cross section of stalk and SEM image of pith and xylem zones. (b) Composition of sweet sorghum stalks. (The results are expressed as percentage of dry weight).
In this study, only fermentable sugars were used as feedstock without considering the possibility that starch and fiber in sweet sorghum stalks could also be converted into sugar through saccharification and hydrolysis [17]. Total fermentable sugar content varies slightly for different sweet sorghum varieties. The sugar loss during long-term silage storage could also reduce ethanol yielding, which was discussed in Section 3.3.
2.1.2. Yeast Culture
The yeast used for fermentation are Saccharomyces cerevisiae TSH1 deposited in the China General Microbiological Culture Collection Center (Accession number: CGMCC 1949). It was identified that the yeast was suitable for solid-state fermentation due to its tolerance to low moisture [30,31].
THS1 yeast was initially inoculated in a yeast-peptone-dextrose (YPD) medium to prepare the seed culture. Corn starch was mixed with water in a reactor with an agitator and a heating jacket at a ratio of 1:5, pasting at 80 °C and pH 5.5 for 2 h. Then glucoamylase was utilized to convert starch to maltose at 55 °C and pH 4.5. The maltose was diluted to the concentration of 3 wt%, which was used as a medium for the yeast culture. The yeast was scale-up cultured twice to 108 viable cells per milliliter and prepared as seed liquid for solid-state fermentation.
2.2. Processes Description
2.2.1. Advanced Solid-State Fermentation
Sweet sorghum stalks were pulverized into particles of 1–2 mm in diameter and 5–20 mm in length. Different dosages of preservative were sprayed on pulverized stalks according to different storage periods. The prepared raw material was stored in the silage cellar until it was used. The feedstock was transferred to a rotary drum fermenter via a screw conveyor. The cultured seed liquid was injected into the screw conveyor and fully mixed with the feedstock during the transportation.
The rotary drum fermenter is 550 m3 in volume with a 62% loading rate, rotating at a speed of 0.2 rpm. Fermentable sugars in the solid substrate are fully consumed by yeast under the action of the rotary drum and internal feeding plate, and the reaction heat is synchronously dissipated. The fermenter inclines down 4.7° moving the feedstock forward to the output at 2.3 m/h [32]. According to previous research results, the average glucose metabolism rate of the TSH1 strain under the conditions of the continuous rotary drum and 20 °C was 2.65 × 10⁻³ min−1, which means that 91% of fermentable sugars can be converted into ethanol during a 24 h fermentation period [27].
ASSF is advanced in that it solves the problems of discontinuity and uncontrollability of conventional solid-state fermentation. The problem of heat accumulation in solid-state fermentation process due to the absence of free water was improved by the rotary drum and inner feeding plate. Mass transfer efficiency and ethanol conversion rate of solid-state fermentation were also enhanced. Currently, several sweet sorghum ethanol demonstration plants based on ASSF technology are operating in Inner Mongolia and Shandong Province, China.
2.2.2. Continuous Solid-State Distillation
The CSSD process is mainly carried out in a rotary column. The CSSD column is 2.6 m in diameter and 3 m in height. The column is composed of three layers of trays and each tray height is 700 mm [18]. The FSSB from the ASSF fermenter outlet was loaded from the top of the column by a screw conveyor and discharged from the bottom after preheating and ethanol stripping. The motor with a reducer at the bottom of CSSD column drives the blades on a rotating shaft to push the feedstock downward. The rotating speed of the shaft is 4 rph to match the discharge speed of the ASSF fermenter. The saturated steam passed through the trays and counter-current contacted with FSSB to extract ethanol in it. Consequently, continuous vapor with stable ethanol concentration flows out the top of the CSSD column, while the vinasse discharges from the bottom. The vinasse can be further processed to become high quality cattle feed [33]. The ethanol concentration of the outlet vapor was calculated according to the method provided in the literature [18].
2.2.3. Dual Vapor Permeation
VP has been commercially applied in the separation of azeotropic mixtures for 30 years [34]. The commonly used membrane material for high ethanol concentration vapor separation is NaA zeolite [23,35]. With price drop and performance improvement, the hollow-fiber zeolite membrane modules have been successfully equipped for 10,000 tons per year of bioethanol plant [36].
Considering the hydrophilicity of zeolite membrane, a large membrane area might be required for the vapor out of CSSD column. In addition, the costs of zeolite membrane are much higher than organic membrane, which is unacceptable for a cost-effective ethanol production process. The feasibility of replacing rectification with a commercial PDMS and PVDF composite hydrophobic membrane to enrich the CSSD outlet vapor to more than 70 wt% ethanol concentration has been verified [24].
In VP separation, the driving force is produced by vacuum pressure on the downstream. When the vapor passes through the membrane, the temperature is adjusted by a vacuum compressor and heat exchangers to prevent vapor condensation during the permeating process. Generally, the VP system should contain PDMS/PVDF and NaA zeolite vapor permeation modules, a three-stage vacuum compressor with inter-stage coolers, vacuum pumps and heat exchangers. The final ethanol concentration at the NaA membrane downstream is 99.5 wt%, conforming to fuel ethanol specification.
2.2.4. One Phase Transition Separation
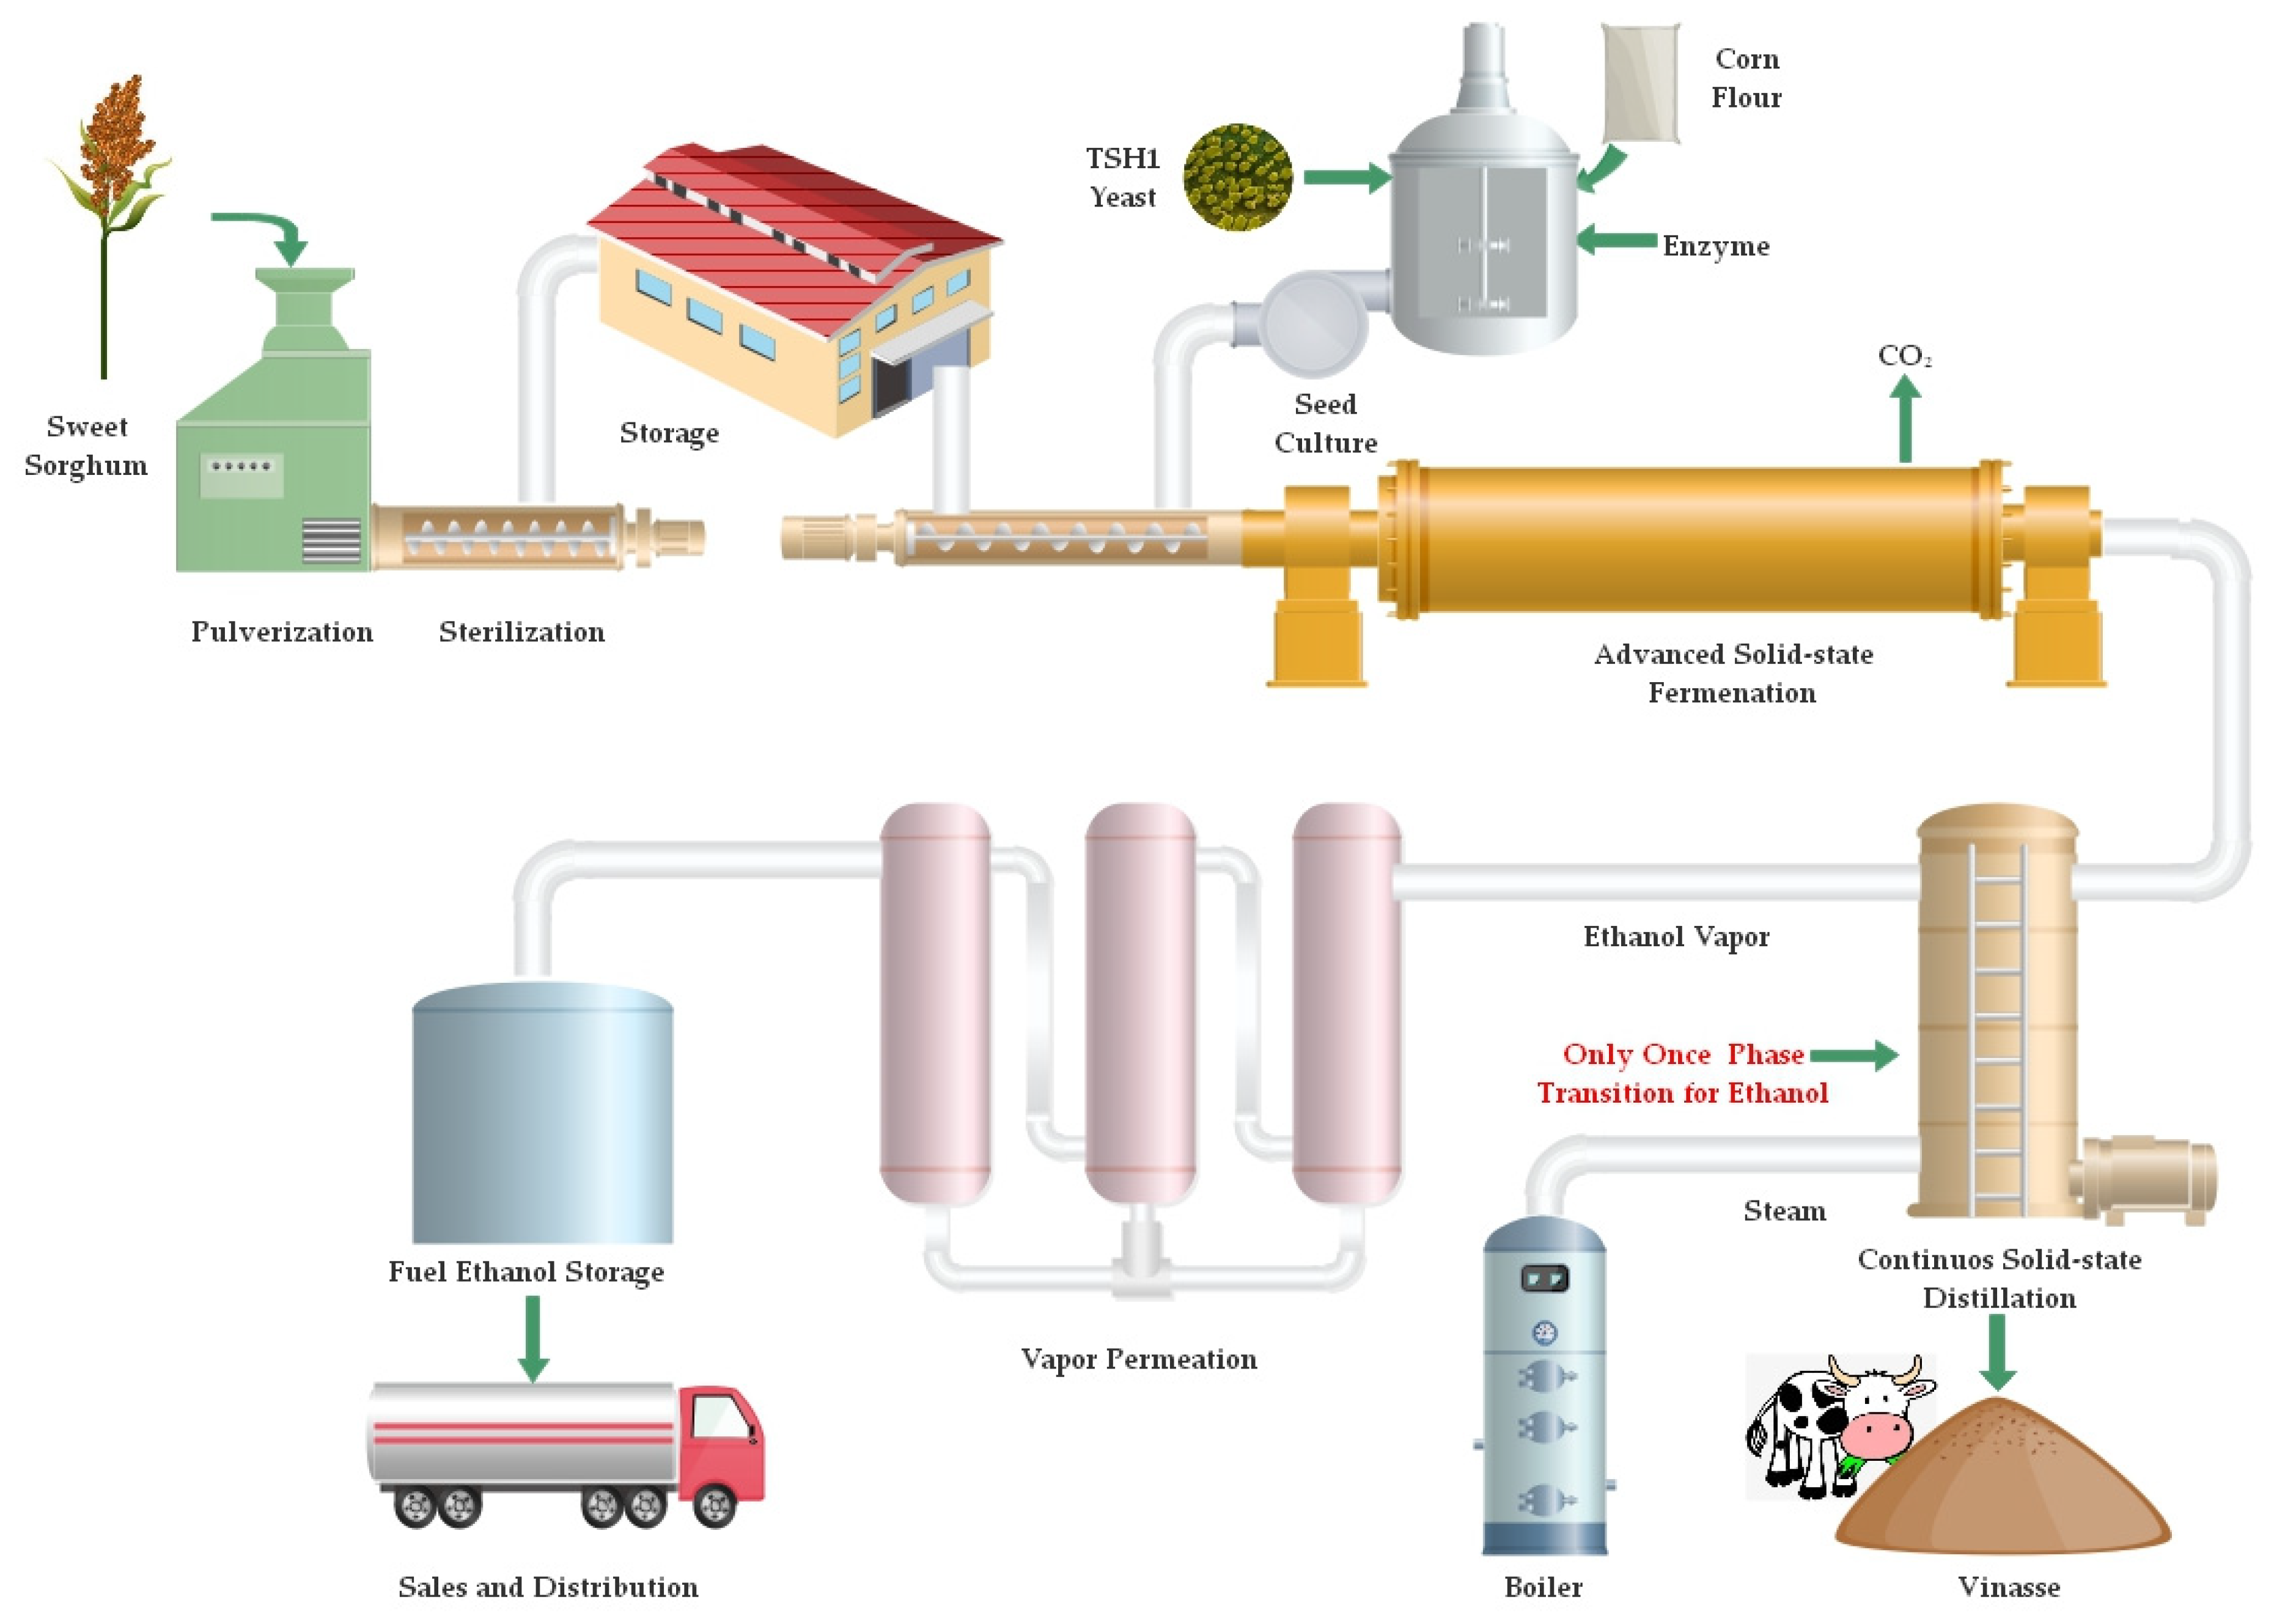
Figure 2 displays the processing diagram of bioethanol production with OPTS technology integrating ASSF, CSSD and dual VP operations [12,18,24]. Fermentable sugars kept in solid substrate are converted into ethanol in an ASSF bioreactor and extracted by steam in the CSSD column. After flowing out of the column, the ethanol vapor is enriched by VP membrane modules to fuel grade without phase transition.
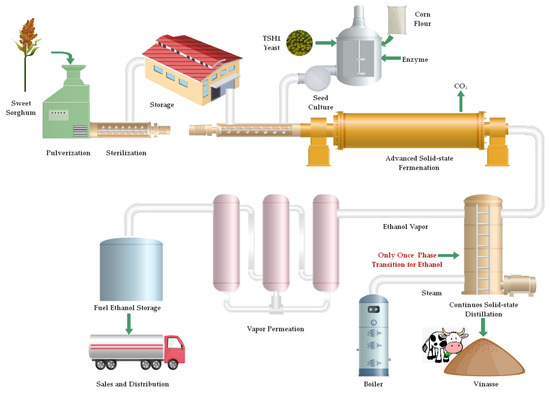
Figure 2.
One phase transition separation processing flow diagram.
For the liquid fermentation of sweet sorghum juice, however, the broth requires at least three phase transitions to produce fuel ethanol, whether by rectification, pervaporation, or vapor stripping approaches [17,37], not to mention the energy consumption of juice squeezing. When the starch crops are used as raw materials, pasting and saccharification are needed before fermentation; thus, more phase transitions bring about more energy consumption. Therefore, the OPTS fuel ethanol production process has obvious advantages in energy and cost saving. It is advisable to upgrade existing ASSF sweet sorghum ethanol plants to further reduce the cost of fuel ethanol by using OPTS technology.
2.3. Simulation Methods
Steady-state calculation and a portion of equipment costs presented herein were performed by the chemical process simulation program Aspen Plus V8.6 (Bedford, Massachusetts, USA). The NRTL-RK thermodynamic model was utilized to determine binary interaction parameters of ethanol and water. The physical property data of sweet sorghum stalks were obtained from the biomass physical property database established in previous literature [38]. The unit operation modules used in the simulation include the reactor, heat exchanger, separator, compressor, and pumps. An Excel spreadsheet linked to the built-in workbook in the simulator was used to calculate membrane modules. Membrane performance parameters including total flux and separation factor were obtained from reference [24].
2.4. Process Economics
2.4.1. Purchased Equipment Cost
All costs were calculated in US dollars. The prices of ASSF fermenters and CSSD columns were taken from an existing demonstration plant built in Shandong, China in 2017. Purchased equipment costs (PEC) of this equipment were updated to the latest prices using a coefficient, which is determined by comparing ‘MySteel Price Index of China (MySPIC)’ of low alloy steel plates in the base year with their price in 2021 [39]. The adjustment of the prices from the base year to 2021 was conducted using Equation (1):
Costs of the VP membrane module were calculated based on the required membrane area unit price. The membrane area unit price included housing, framework, and installation. Equipment for the seed culture unit was integrated supplied, and included a saccharification tank, a set of twice scale-up culture tanks, a liquid storage tank, control system, and pipeline. The sweet sorghum stalks pretreatment unit included a pulverizer, disinfection mixer, bins, forklifts, screw conveyor, etc. All non-standard equipment prices adopt the latest quotation provided by vendors.
The costs of setting equipment, including compressors, pumps, and heat exchangers were derived from the Aspen economic analysis program. A Chinese basis template was selected as the price calculation option with further correction according to the price of similar existing equipment.
2.4.2. Fixed Capital Investment
Fixed capital investment includes two parts of direct plant costs (DPC) and indirect plant costs (IPC). DPC was calculated on the basis of PEC, including the costs of piping, instrumentation, electrical, civil engineering, equipment installation, and some other costs of firefighting, HVAC, transportation, and safety facilities. IPC was calculated based on DPC, including the costs of construction management, temporary facility fee, design, engineering, and testing service. Intangible asset costs include patent and process package contractor’s fee. These costs together with current funds constitute the total investment during the construction period, as shown in Table 1. The listed proportion was estimated according to the investment proportion of existing demonstration plants.

Table 1.
The composition of estimated total construction investment.
3. Results and Discussion
3.1. Processes Analysis
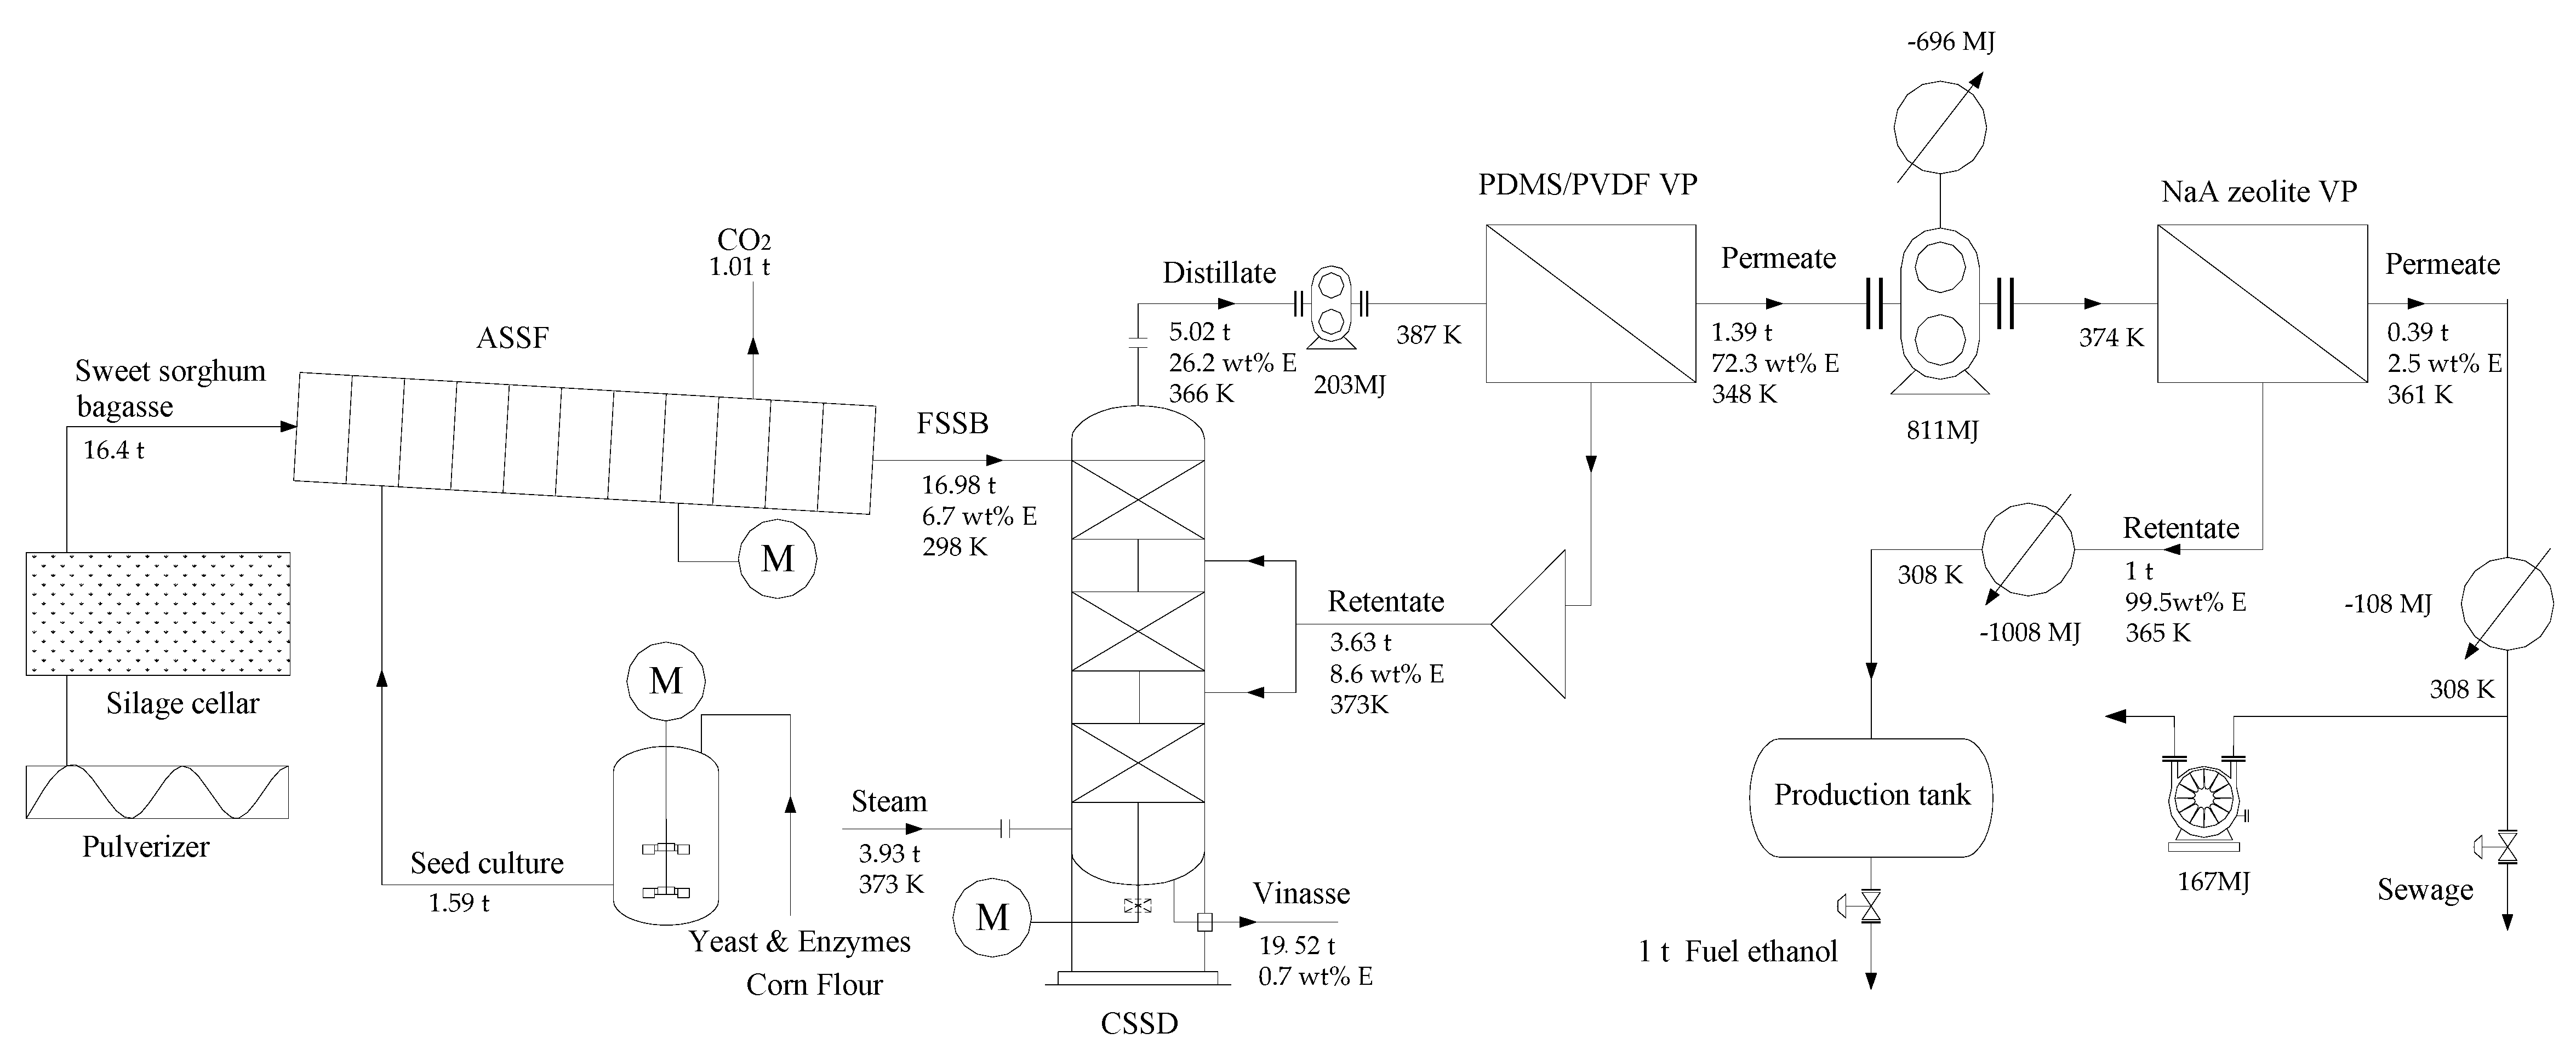
The simulated flowsheet of OPTS bioethanol production based on the yield of 1 ton fuel ethanol is displayed in Figure 3. An amount of 16.4 tons of pulverizing sweet sorghum stalks containing 14.7 wt% fermentable sugars were blended with 1.59 tons of seed culture in the ASSF rotary drum for 24 h. The sugar-ethanol conversion rate was 91% of the theoretical rate during the ASSF process, accompanied by the discharging of 1.01 tons of carbon dioxide. A total of 16.98 tons of FSSB were fed into the CSSD column after fermentation. The boiler steam was used to extract ethanol from the FSSB. The distilled vapor contained 26.2 wt% ethanol, which can be enriched to 72.3 wt% by hydrophobic VP membrane separation. At the same time, 3.36 tons of retentate vapor were recovered as the secondary heat source of the CSSD column. A three-stage vacuum compressor unit was used to deliver the permeate stream and maintain the transmembrane driving force. The compressor unit was equipped with an inter-stage cooler to control the vapor temperature and to prevent the vapor condensate during compression. The vapor permeating through the PDMS/PVDF membrane was delivered to the NaA zeolite VP module. A vacuum pump was used to maintain the vacuum degree at 2 kPaA at downstream. The retentate stream of the hydrophilic membrane was accomplished as fuel grade ethanol products. The mass balance of the whole process is shown in Table 2.
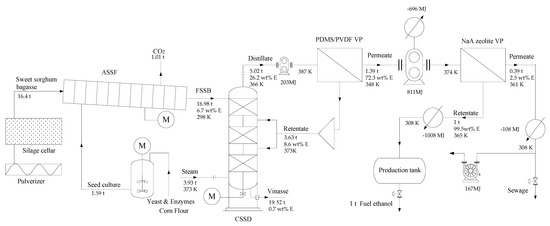
Figure 3.
Flowsheets of one phase transition bioethanol separation process.

Table 2.
Mass balance of OPTS bioethanol process based on 1 ton product.
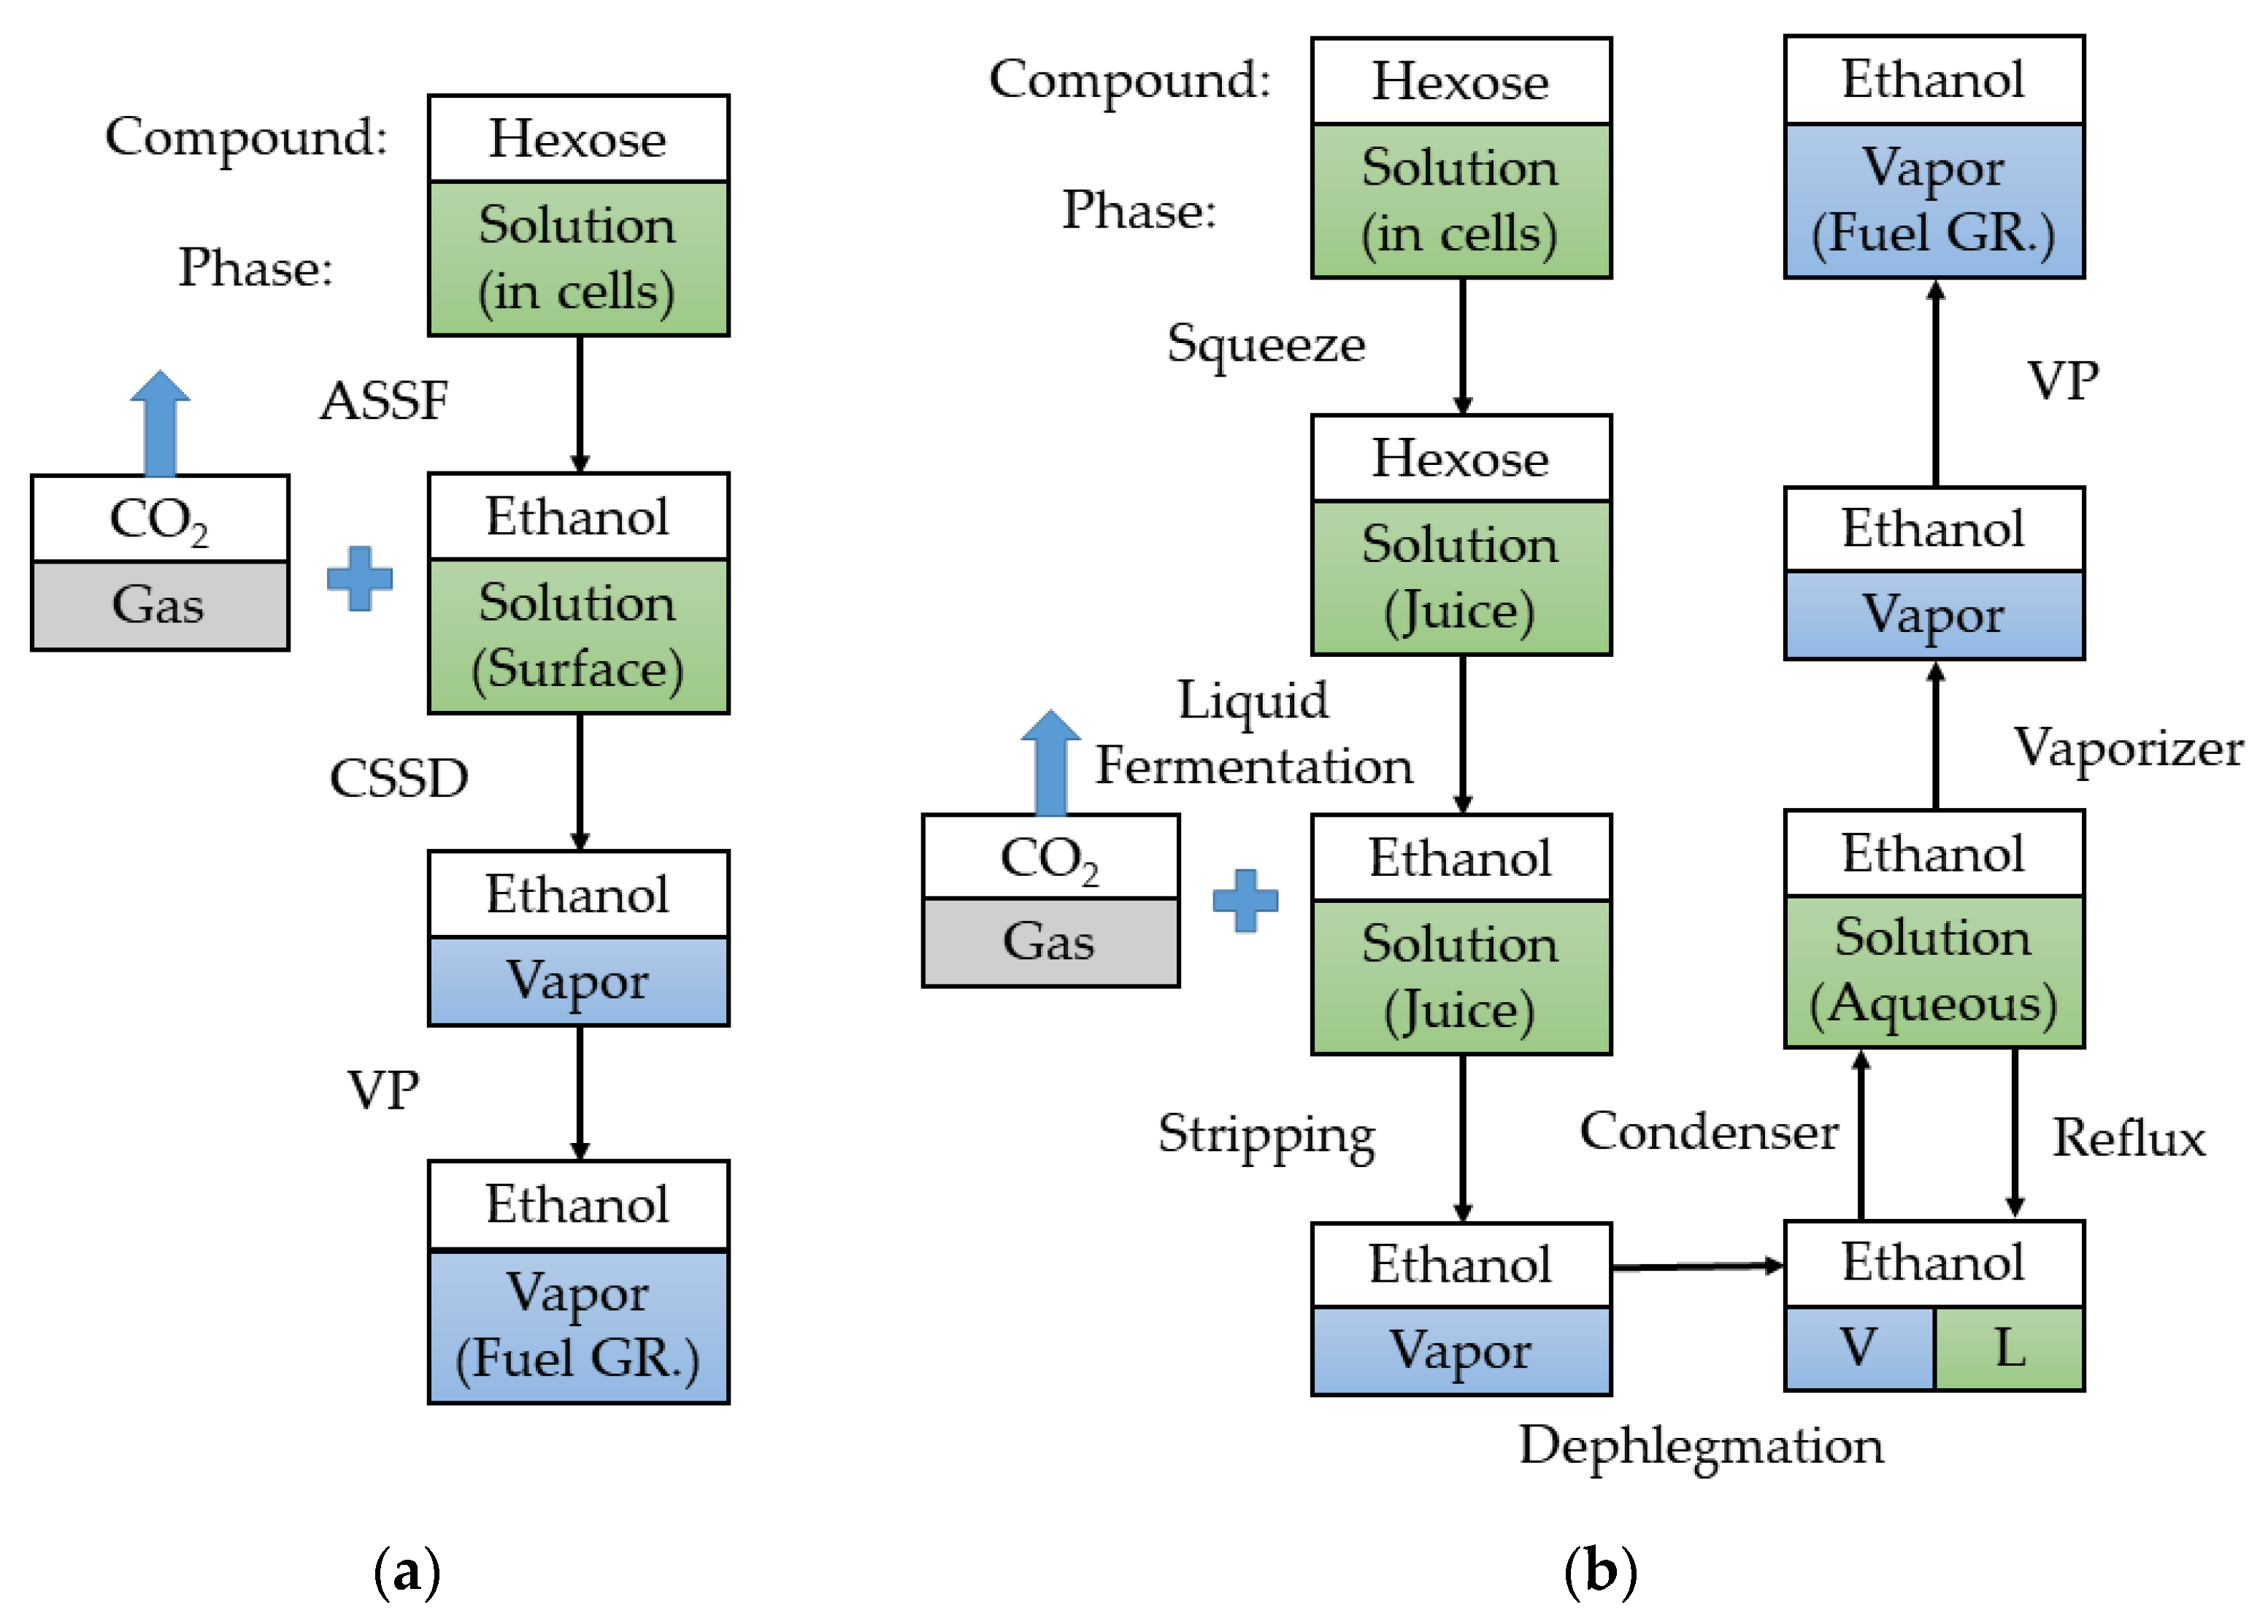
The mass transfer roadmap of OPTS bioethanol production is shown in Figure 4a. The fermentable sugars in sweet sorghum plant cells move to a solid substrate surface, driven by the concentration gradient of sugar. The yeast growing on the particle surface consumes hexose to ethanol and carbon dioxide under anaerobic conditions. The ethanol dissolves into a dispersed liquid phase on the particle’s surface. There is no bulk liquid phase but only a liquid membrane on moist substrates due to the absence of free water. Solid-state fermentation is completed when the sugar concentration gradient vanishes. In the CSSD column, ethanol in the liquid membrane is extracted by stripping steam, which is the only one phase transition in the whole process. Then, distilled vapor permeates through the dense membrane and enriches to fuel grade under the chemical potential gradient.
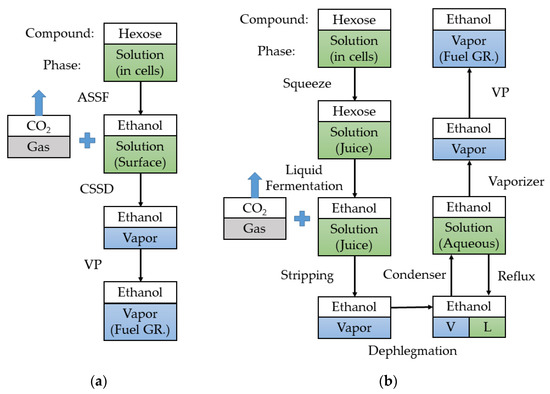
Figure 4.
Mass transfer roadmap of solid-state fermentation and liquid fermentation for fuel grade bioethanol production (a) OPTS process. (b) Liquid fermentation combined with membrane-assisted vapor stripping process.
In contrast, the process of liquid fermentation combined with the membrane-assisted vapor stripping process is shown in Figure 4b [37,40]. Firstly, fermentable sugars in sweet sorghum plant cells are squeezed into the juice, inevitably requiring more energy consumption and more sugar loss than ASSF. The hexose is digested by yeast to ethanol in the broth and carbon dioxide. The low ethanol concentration broth can be enriched to fuel ethanol by a hybrid vapor stripping–vapor permeation process, which is proved to be more energy efficient than distillation approaches [37]. The ethanol in the broth is stripped by steam and then fed into a dephlegmator column, enriching up to an azeotrope. An overhead condenser is used to provide the reflux flow for vapor-liquid contact on the column trays. The ethanol needs to be vaporized again as a feed flow of VP zeolite membrane. There are at least three phase transitions occurring in the whole process, even without considering repeated phase changes in dephlegmator. In addition, the OPTS process also saves energy consumption for squeezing and preservation. Generally speaking, OPTS has notable advantages in energy saving compared with liquid fermentation.
The energy input and output of each process were displayed in Table 3 according to simulation results. Compared with the conventional fuel ethanol production, OPTS technology consumes more electric energy, but much less steam and cooling water consumption [16], assuming that CSSD processes were configured with a natural gas boiler. The average prices of industrial natural gas and electricity in China refer to the latest online data [41]. 1 MJ electrical energy is equivalent to 2.5 MJ steam energy on an assumed 90% boiler efficiency. Although the quality and price of electrical energy are higher, the savings on the cost of steam of the proposed process are sufficient to cover the power consumption costs, not to mention the cost savings of cooling water.

Table 3.
Energy input and output of OPTS bioethanol process based on 1 ton product.
3.2. Techno-Economic Evaluation
3.2.1. Construction Investment Estimation
The following economic analysis is based on a plant of 10,000 tons of fuel ethanol capacity per year with an annual operation of 8000 h. In order to avoid excessive sugar loss and deterioration on sweet sorghum stalks, the pretreatment process should be completed within 30 days after harvest. Equipment capacity of the stalks pretreatment unit is calculated as 360 h. The total construction investment was assumed to be self-owned funds, without considering the repayment of bank loans and interest.
According to the volume of the ASSF reactor, it can be calculated that the daily processing capacity of each fermenter was about 100 tons. So, a total of 5 fermenters are required to fulfil annual production capacity. The corresponding CSSD columns were also 5 sets. Prices of VP modules were calculated by membrane area. Unit prices of PDMS/PVDF membrane and NaA zeolite membrane were provided by membrane manufacturers. The steam produced by the boiler was used for both CSSD and starch saccharification for the yeast culture, so the capacity of the boiler was determined as 10 t/h. Other regular equipment, such as heat exchangers, vessels, pumps, compressors, and vacuum pumps, are calculated based on simulated capacity. The PEC for the process units is given in Table 4. The fixed capital investment, intangible asset costs, and total construction investment determined, as Table 1 shows, are 8.53 M, 2.56 M and 9.22 M, respectively.

Table 4.
Purchased Equipment costs for OPTS bioethanol process.
3.2.2. Operating Income
The income source of this project includes the sale of fuel ethanol and vinasse as cattle feed. The pricing rule of fuel ethanol in China is the regular gasoline price multiplied by 0.911 conversion coefficient. The current price of regular gasoline and the corresponding fuel ethanol price were checked online [41]. The vanasse discharged from the CSSD column contained 83% moisture, which needed to be further dried to 50% water content as a by-product. When one ton of fuel ethanol is produced, 6.64 tons of finished cattle feed can be obtained. The operating income is listed in Table 5. The products and raw materials are calculated at the price excluding tax.

Table 5.
Operating income of OPTS 10,000 tons fuel ethanol per year project.
3.2.3. Total Cost Expenses
Total cost expenses include operating costs, depreciation and amortization, and maintenance expenses. Operating costs are composed of raw material costs, utility costs, and labor costs. The consumption of raw materials and utilities was calculated according to the simulation results. Fresh water consumption is used for boiler and seed liquid preparation.
Depreciation is calculated according to Equation (2),
where VO is the original value of FCI and VR is expected net residual value of FCI. YD is the service life. It is assumed that the service life of the membrane is 5 years and that of the other equipment is 10 years. The residual value rate is 10%. The recovered FCI is counted into operating income shown in Table 5. The IAC will be amortized by 10 years and the maintenance costs are considered by 5% of FCI. The total costs are 10.32 M as calculated in Table 6.

Table 6.
Total cost expenses of OPTS 10,000 tons fuel ethanol per year project.
3.2.4. Financial Evaluation
As shown in Table 7, it can be calculated that the production of 10,000 tons of fuel ethanol can make 3.63 M profit per year. This indicates that the OPTS plant has cost and energy advantages over existing ASSF demonstration plants and other sweet sorghum bioethanol plants [12,42]. Income tax is calculated at 25% of total annual profit in China. Equation (3) is used to determine the discounted payback period (DPP) of FCI [43].
where i indicates the discount rate, which is assumed as 10%. CI and CO represent the annual cash inflow and cash outflow, respectively. When the discount rate in Equation (3) is set as an unknown value, the internal rate of return of the project can be calculated. The calculated internal rate of return before and after tax are 37% and 26%, respectively, which are much higher than the industry average internal rate of return. The calculated dynamic recovery period before and after tax are 4.08 and 5.35 years, respectively, indicating that the project has promising prospects.

Table 7.
Financial evaluation index of OPTS 10,000 tons fuel ethanol per year project.
3.3. Sensitivity Analysis
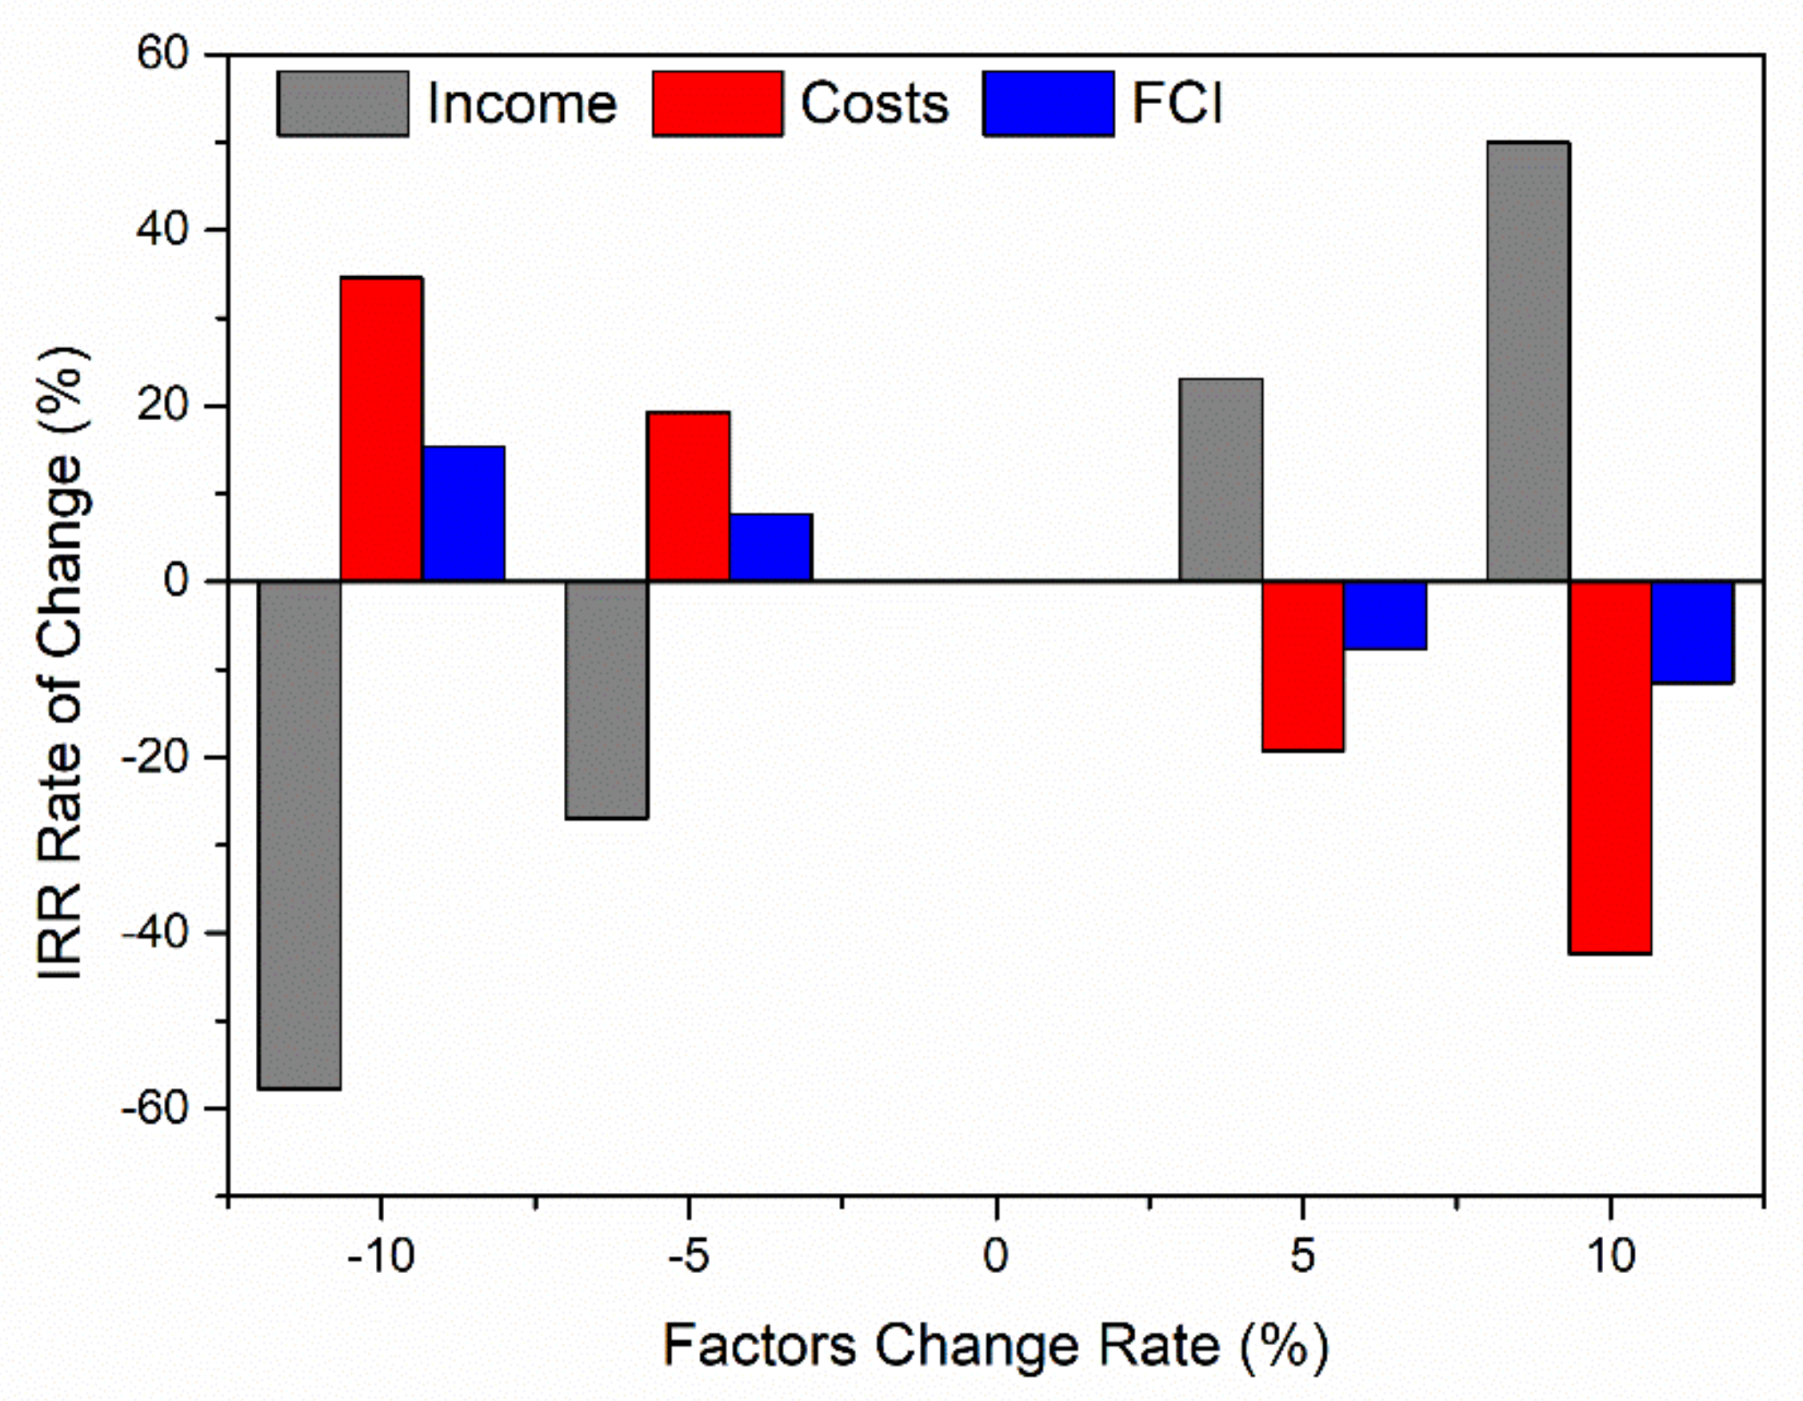
Figure 5 shows the sensitivity analysis results of a OPTS project of 10,000 tons of fuel ethanol per year. The most important factor influencing IRR is project income, followed by operating costs, and then FCI. When project income decreased by 10%, IRR decreased by 58%; and when project income increased by 10%, IRR increased by 50%. When the operating costs increased by 10%, IRR decreased by 42%, while when the operating costs decreased by 10%, IRR increased by 35%. When the FCI increased by 10%, IRR decreased by 12%, while when FCI decreased by 10%, IRR increased by 15%.
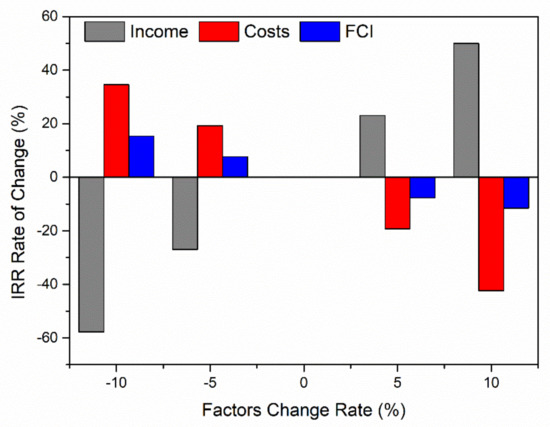
Figure 5.
Result of sensitivity analysis.
The price of ethanol and feed affects the project income the most. The feed price is relatively stable, while the fuel ethanol price is directly linked to the price of gasoline. The gasoline price is determined by international oil prices. When international oil prices fluctuate largely, the project will face risks. However, even if gasoline price is reduced by 15%, the project can still make a profit indicating that it has a certain risk-absorbing capacity. On the other hand, the difference of sugar content in biomass feedstock and the excessive sugar loss caused by a poor storage environment could also affect the ethanol yielding and project income. When sugar content in sweet sorghum stalks decreases by 30% to less than 10 wt%, the project income will be reduced by 22% and no longer be profitable.
Operating costs are mainly determined by raw material prices and utilities costs. Since sweet sorghum is an agricultural product, its purchased price is normally protected by the Chinese government. So, the best approach to reduce operating costs is to further reduce energy consumption. The improvement of hydrophobic membrane performance is the focus to reduce energy consumption. High-silica ZSM-5 zeolites incorporated into a PDMS membrane was proven to be effective for separating alcohol–water mixtures [44]. Assuming that the separation factor could be increased to 5.2 with remaining permeate flux, about 15% of the electrical energy can be saved. Even if the high-performance membrane increases the FCI by the same proportion, according to the sensitivity analysis results, the profit of the project will also be enhanced to a certain extent. Therefore, the development of a high-performance hydrophobic membrane is the trend of OPTS process optimization.
4. Conclusions
By combining ASSF, CSSD and VP technology, it is possible to achieve only one phase change in the whole conversion process from sweet sorghum to fuel-grade ethanol. The energy input and output ratio of the OPTS process is 1:3.6, indicating that the process is energy-efficient. The construction investment of 10,000 tons capacity of OPTS fuel ethanol plant and the total annual profit were calculated as 9.22 M USD and 3.63 M USD, respectively. The dynamic payback period after tax is 5.35 years. The result of techno-economic analysis verifies that the energy saving reduces the production cost of fuel ethanol, also predicts that the proposed technology can be applied on an industrial scale. It is expected to improve the performance of the VP membrane to further reduce energy consumption, which could further enhance the advancement of OPTS technology.
Author Contributions
Conceptualization, H.L. (Hongshen Li) and S.L.; investigation, H.L. (Hongshen Li); methodology, H.L. (Hongshen Li); formal analysis, H.L. (Hongshen Li); validation, H.L. (Hongrui Liu); writing—original draft preparation, H.L. (Hongshen Li); writing—review, H.L. (Hongrui Liu) and S.L.; funding acquisition, S.L.; project administration, H.L. (Hongrui Liu). All authors have read and agreed to the published version of the manuscript.
Funding
This research was supported by the National Key R&D Program of China (2016YFE0108500).
Data Availability Statement
The data presented in this study are available on request from the corresponding author.
Conflicts of Interest
The authors declare no conflict of interest.
References
- Eder, L.V.; Provornaya, I.V.; Filimonova, I.V.; Kozhevin, V.D.; Komarova, A.V. World energy market in the conditions of low oil prices, the role of renewable energy sources. In Proceedings of the 5th International Conference on Energy and Environment Research, Prague, Czech Republic, 23–27 July 2018; Volume 153, pp. 112–117. [Google Scholar]
- Fuel Ethanol Production Worldwide in 2020. 2021. Available online: https://www.statista.com/statistics/281606/ethanol-production-in-selected-countries/ (accessed on 27 August 2021).
- Agarwal, A.K. Biofuels (alcohols and biodiesel) applications as fuels for internal combustion engines. Prog. Energy Combust. Sci. 2007, 33, 233–271. [Google Scholar] [CrossRef]
- Hoekman, S.K.; Broch, A. Environmental implications of higher ethanol production and use in the US: A literature review. Part II—Biodiversity, land use change, GHG emissions, and sustainability. Renew. Sust. Energ. Rev. 2018, 81, 3159–3177. [Google Scholar] [CrossRef]
- Jiao, J.L.; Li, J.J.; Bai, Y. Ethanol as a vehicle fuel in China: A review from the perspectives of raw material resource, vehicle, and infrastructure. J. Clean. Prod. 2018, 180, 832–845. [Google Scholar] [CrossRef]
- Sadeghinezhad, E.; Kazi, S.N.; Badarudin, A.; Togun, H.; Zubir, M.N.M.; Oon, C.S.; Gharehkhani, S. Sustainability and environmental impact of ethanol as a biofuel. Rev. Chem. Eng. 2014, 30, 51–72. [Google Scholar] [CrossRef]
- Baeyens, J.; Kang, Q.; Appels, L.; Dewil, R.; Lv, Y.Q.; Tan, T.W. Challenges and opportunities in improving the production of bio-ethanol. Prog. Energy Combust. Sci. 2015, 47, 60–88. [Google Scholar] [CrossRef]
- Jansson, C.; Westerbergh, A.; Zhang, J.M.; Hu, X.W.; Sun, C.X. Cassava, a potential biofuel crop in (the) People’s Republic of China. Appl. Energy 2009, 86, S95–S99. [Google Scholar] [CrossRef]
- Calvino, M.; Messing, J. Sweet sorghum as a model system for bioenergy crops. Curr. Opin. Biotechnol. 2012, 23, 323–329. [Google Scholar] [CrossRef]
- Laopaiboon, L.; Nuanpeng, S.; Srinophakun, P.; Klanrit, P.; Laopaiboon, P. Ethanol production from sweet sorghum juice using very high gravity technology: Effects of carbon and nitrogen supplementations. Bioresour. Technol. 2009, 100, 4176–4182. [Google Scholar] [CrossRef]
- Rahman, S.; Sabnis, M.; Kuusisto, L.M.; Sattler, M.; Chen, V. Models for organics removal from vinasse from ethanol production. Clean Technol. Environ. Policy 2018, 20, 803–812. [Google Scholar] [CrossRef]
- Li, S.Z.; Li, G.M.; Zhang, L.; Zhou, Z.X.; Han, B.; Hou, W.H.; Wang, J.B.; Li, T.C. A demonstration study of ethanol production from sweet sorghum stems with advanced solid state fermentation technology. Appl. Energy 2013, 102, 260–265. [Google Scholar] [CrossRef]
- Tian, Y.; Li, S.; Zhao, L.; Meng, H.; Huo, L. Life Cycle Assessment on Fuel Ethanol Producing from Sweet Sorghum Stalks. Trans. Chin. Soc. Agric. Mach. 2011, 42, 132–137. [Google Scholar]
- Zhang, L.; Zu, X.; Fu, J.; Li, J.; Li, S. A novel combined ethanol and power model of microgrid driven by sweet sorghum stalks using ASSF. In Renewable Energy Integration with Mini/Microgrid; Yan, J., Zhai, Y., Wijayatunga, P., Mohamed, A.M., Campana, P.E., Eds.; Elsevier Science BV: Amsterdam, The Netherlands, 2016; Volume 103, pp. 244–249. [Google Scholar]
- Mei, X.; Liu, R.; Cao, W. Energy consumption analysis on pilot-scale plant of fuel ethanol production from sweet sorghum stalk by solid state fermentation. Trans. Chin. Soc. Agric. Eng. 2012, 28, 194–198. [Google Scholar]
- Ebrahimiaqda, E.; Ogden, K.L. Simulation and Cost Analysis of Distillation and Purification Step in Production of Anhydrous Ethanol from Sweet Sorghum. ACS Sustain. Chem. Eng. 2017, 5, 6854–6862. [Google Scholar] [CrossRef]
- Zentou, H.; Abidin, Z.Z.; Yunus, R.; Biak, D.R.A.; Korelskiy, D. Overview of Alternative Ethanol Removal Techniques for Enhancing Bioethanol Recovery from Fermentation Broth. Processes 2019, 7, 458. [Google Scholar] [CrossRef] [Green Version]
- Li, H.S.; Li, S.Z. Optimization of Continuous Solid-State Distillation Process for Cost-Effective Bioethanol Production. Energies 2020, 13, 854. [Google Scholar] [CrossRef] [Green Version]
- Li, S.; Li, G. Continuous Solid-State Separation Device and Process for Producing Fuel Ethanol. U.S. Patent 10239806, 26 March 2019. [Google Scholar]
- Phukoetphim, N.; Chanutit, P.; Laopaiboon, P.; Laopaiboon, L. Improvement of Bioethanol Production from Sweet Sorghum Juice under Very High Gravity Fermentation: Effect of Nitrogen, Osmoprotectant, and Aeration. Energies 2019, 12, 3620. [Google Scholar] [CrossRef] [Green Version]
- Li, H.; Li, S. Advances in research and application of vapor permeation for biofuel ethanol production. Chem. Ind. Eng. Prog. 2020, 39, 1620–1631. [Google Scholar]
- Gozan, M.; Setiawan, M.S.; Lischer, K. Purification Simulation With Vapor Permeation and Distillation-Adsorption In Bioethanol Plant. Makara J. Technol. 2017, 21, 43–48. [Google Scholar] [CrossRef] [Green Version]
- Vane, L.M. Review: Membrane materials for the removal of water from industrial solvents by pervaporation and vapor permeation. J. Chem. Technol. Biotechnol. 2019, 94, 343–365. [Google Scholar] [CrossRef] [PubMed]
- Li, H.; Liu, H.; Li, Y.; Nan, J.; Shi, C.; Li, S. Combined Vapor Permeation and Continuous Solid-State Distillation for Energy-Efficient Bioethanol Production. Energies 2021, 14, 2266. [Google Scholar] [CrossRef]
- Jiang, D.; Hao, M.M.; Fu, J.Y.; Liu, K.; Yan, X.X. Potential bioethanol production from sweet sorghum on marginal land in China. J. Clean. Prod. 2019, 220, 225–234. [Google Scholar] [CrossRef]
- Zabed, H.; Sahu, J.N.; Suely, A.; Boyce, A.N.; Faruq, G. Bioethanol production from renewable sources: Current perspectives and technological progress. Renew. Sust. Energ. Rev. 2017, 71, 475–501. [Google Scholar] [CrossRef]
- Mao, Y.; Li, J.; Li, S.; Chang, S.; Zhao, G. The mass transfer of sugar in sweet sorghum stalks for solid-state fermentation process. Fuel 2015, 144, 90–95. [Google Scholar] [CrossRef]
- Li, H.; Han, X.; Liu, H.; Hao, J.; Jiang, W.; Li, S. Silage Fermentation on Sweet Sorghum Whole Plant for Fen-Flavor Baijiu. Foods 2021, 10, 1477. [Google Scholar] [CrossRef]
- Han, B.; Fan, G.; Li, S.; Wang, L.; Li, T. Comparison of ethanol production from different sugar feedstocks by solid state fermentation with two yeast strains. Trans. Chin. Soc. Agric. Eng. 2012, 28, 201–206. [Google Scholar]
- Du, R.; Yan, J.; Feng, Q.; Li, P.; Zhang, L.; Chang, S.; Li, S. A Novel Wild-Type Saccharomyces cerevisiae Strain TSH1 in Scaling-Up of Solid-State Fermentation of Ethanol from Sweet Sorghum Stalks. PLoS ONE 2014, 9, e94480. [Google Scholar] [CrossRef] [PubMed]
- Fu, X.; Li, P.; Zhang, L.; Li, S. RNA-Seq-based transcriptomic analysis of Saccharomyces cerevisiae during solid-state fermentation of crushed sweet sorghum stalks. Process Biochem. 2018, 68, 53–63. [Google Scholar] [CrossRef]
- Li, H.; Li, S.; Cao, B. Design of supporting system on rotary drum bioreactor for solid-state fermentation and finite element analysis. Trans. Chin. Soc. Agric. Eng. 2019, 35, 141–147. [Google Scholar]
- Yerradoddi, R.R.; Khan, A.A.; Mallampalli, S.R.; Devulapalli, R.; Kodukula, P.; Blummel, M. Effect of protein and energy levels in sweet sorghum bagasse leaf residue-based diets on the performance of growing Deccani lambs. Trop. Anim. Health Prod. 2015, 47, 743–749. [Google Scholar] [CrossRef] [PubMed]
- Sander, U.; Janssen, H. Industrial application of vapor permeation. J. Membr. Sci. 1991, 61, 113–129. [Google Scholar] [CrossRef]
- Khalid, A.; Aslam, M.; Qyyum, M.A.; Faisal, A.; Khan, A.L.; Ahmed, F.; Lee, M.; Kim, J.; Jang, N.; Chang, I.S.; et al. Membrane separation processes for dehydration of bioethanol from fermentation broths: Recent developments, challenges, and prospects. Renew. Sust. Energ. Rev. 2019, 105, 427–443. [Google Scholar] [CrossRef]
- Makertihartha, I.G.B.N.; Dharmawijaya, P.T.; Wenten, I.G. Recent Advances on Bioethanol Dehydration using Zeolite Membrane. In International Conference on Energy Sciences; Waris, A., Shin, B., Kondo, M., Buys, Y.F., Irwanto, D., Pramuditya, S., Eds.; IOP Publishing Ltd.: Bristol, UK, 2017; Volume 877. [Google Scholar]
- Vane, L.M.; Alvarez, F.R. Effect of membrane and process characteristics on cost and energy usage for separating alcohol-water mixtures using a hybrid vapor stripping-vapor permeation process. J. Chem. Technol. Biotechnol. 2015, 90, 1380–1390. [Google Scholar] [CrossRef]
- Han, B.; Wang, L.; Li, S.; Wang, E.; Zhang, L.; Li, T. Ethanol production from sweet sorghum stalks by advanced solid state fermentation (ASSF) technology. Sheng Wu Gong Cheng Xue Bao Chin. J. Biotechnol. 2010, 26, 966–973. [Google Scholar]
- MySteel Price Index of China. 2021. Available online: https://www.mysteel.com/ (accessed on 27 August 2021).
- Laopaiboon, L.; Thanonkeo, P.; Jaisil, P.; Laopaiboon, P. Ethanol production from sweet sorghum juice in batch and fed-batch fermentations by Saccharomyces cerevisiae. World J. Microbiol. Biotechnol. 2007, 23, 1497–1501. [Google Scholar] [CrossRef]
- Retail Energy Price Data. 2021. Available online: https://www.globalpetrolprices.com/ (accessed on 27 August 2021).
- Yang, X.L.; Li, M.; Liu, H.H.; Ren, L.T.; Xie, G.H. Technical Feasibility and Comprehensive Sustainability Assessment of Sweet Sorghum for Bioethanol Production in China. Sustainability 2018, 10, 731. [Google Scholar] [CrossRef] [Green Version]
- Beal, C.M.; Gerber, L.N.; Sills, D.L.; Huntley, M.E.; Machesky, S.C.; Walsh, M.J.; Tester, J.W.; Archibald, I.; Granados, J.; Greene, C.H. Algal biofuel production for fuels and feed in a 100-ha facility: A comprehensive techno-economic analysis and life cycle assessment. Algal Res. Biomass Biofuels Bioprod. 2015, 10, 266–279. [Google Scholar] [CrossRef] [Green Version]
- Liu, J.; Chen, J.X.; Zhan, X.; Fang, M.Q.; Wang, T.; Li, J.D. Preparation and characterization of ZSM-5/PDMS hybrid pervaporation membranes: Laboratory results and pilot-scale performance. Sep. Purif. Technol. 2015, 150, 257–267. [Google Scholar] [CrossRef]
Publisher’s Note: MDPI stays neutral with regard to jurisdictional claims in published maps and institutional affiliations. |
© 2021 by the authors. Licensee MDPI, Basel, Switzerland. This article is an open access article distributed under the terms and conditions of the Creative Commons Attribution (CC BY) license (https://creativecommons.org/licenses/by/4.0/).

