Article

Simulation Analysis of Daylight Characteristics and Cooling Load Based on Performance Test of Covering Materials Used in Smart Farms

1
Korea Conformity Laboratories (KCL), Energy Division, Seoul 06711, Korea
2
Korea Conformity Laboratories (KCL), Energy Division, Jincheon 27876, Korea
3
Department of Architectural Engineering, Sejong University, Seoul 05006, Korea
4
Department of Computer Science, Yonsei University, Seoul 03722, Korea
*
Author to whom correspondence should be addressed.
Energies 2021, 14(19), 6331; https://doi.org/10.3390/en14196331
Submission received: 16 August 2021 / Revised: 27 September 2021 / Accepted: 30 September 2021 / Published: 4 October 2021

Abstract

:
In this study, seven of the most commonly applied covering materials in smart farms are selected as the representative samples for analysis, namely, glass, soft film (polyethylene, PE), soft film (polyolefin, PO), rigid plastic film (ethylene tetra fluoro ethylene, ETFE), rigid plastic sheet (poly methyl methacrylate, PMMA), rigid plastic sheet (polycarbonate, PC double layer), and woven film. For each covering material, visible light transmittance and reflectivity, solar radiation transmittance and reflectivity, thickness, solar heat gain coefficient, and the coefficient of heat transmission are measured according to the test methods in the Korean Industrial Standards (KS) to derive input data for the respective materials. In addition, using the optical and thermal input data as derived above, simulations are performed on the cooling load and daylight characteristics of smart farms to derive basic reference data for the selection of adequate covering materials for the design. Based on the analysis result of the daylight characteristics for each covering material, for a shading rate of 60%, the average values of indoor illuminance were 19,879 lux, 20,012 lux, 19,393 lux, 19,555 lux, 16,560 lux, 16,228 lux, and 11,173 lux for glass, PE film, PO film, ETFE, woven film, PMMA, and PC double layer, respectively, between 6 a.m. and 8 p.m., which correspond to the hours when daylight enters indoor spaces. Considering the target light intensity for strawberry growth at 10,000–40,000 lux, the above results confirm that all the sample covering materials had an indoor illuminance level above the lower limit range of the target light intensity. For the cooling load evaluation, the PC double layer had the lowest value of 482.8 W/m2, and PO film had the highest value of 633.8 W/m2. The difference between the cooling loads of the PC double layer and the PO film is 151 W/m2, which amounts to 23.8%, thus indicating that the selected covering material significantly impacts the cooling load. The cooling load exhibited a pattern similar to that of the coefficient of heat transmission and solar heat gain coefficient, which are key influencing factors for most of the sample materials. However, for PMMA, the cooling load was low because it had a higher coefficient of heat transmission than other materials, but its solar heat gain coefficient was relatively low. Another possible reason for the difference is that the solar heat gain coefficient impacts the cooling load. When the cooling set temperature was controlled from Case 1-1 to Case 1-2, the cooling load decreased by 10.7% on average. In addition, when the cooling set temperature changed from Case 1-1 to Case 1-3, the cooling load decreased by 26.1% on average. For cooling set temperature control, maintaining the temperature around the lower temperature range of the optimal growth temperature of the plants increases the yield, but it also incurs increased cooling load and cost. In terms of cost only, while maintaining the cooling temperature for 24 h at 30 °C, which is the upper limit of the optimal growth temperature, would be advantageous, it will lead to a deterioration of the quality and reductions in yield. Therefore, as follow-up studies for further investigation of the findings of this research, there is the need for an evaluation of the yield and quality with respect to the range of cooling set temperatures. When the internal shading rate was increased to 40% (Case 2-2) with reference to Case 2-1, which was a greenhouse without the application of internal shading, the cooling load decreased by 27.4% on average. Furthermore, when the internal shading rate increased to 50% (Case 2-3) with reference to Case 2-1, the cooling load decreased by 29.3% on average. When the internal shading rate increased to 60% (Case 2-4), the cooling load decreased by 31.5% on average.

Graphical Abstract

1. Introduction

Background and Study Objectives

The projected growth of the global market in the smart farm sector is expected to be approximately USD 4.08 billion in 2022, indicating an annual average growth rate of 16.4% since 2016. The reported outlook for the domestic market is also for growth of USD 3.7 billion in 2017 and USD 4.9 billion in 2022, predicting an annual average growth rate at 5% for the period [1]. The area allotted to smart farms accounts for 1258 ha of the total protected horticulture area of 64,528 ha, corresponding to about 1.9% [2]. The Korean government has selected the smart farm as one of the top 10 key areas for National Research and Development (R&D), and has invested heavily to support increased smart farm penetration, such as selecting smart farms as priority projects, and providing funding support, R&D, and education. However, unlike the rapid pace of growth in the smart farm industry, the calculation of cooling load in the smart farm design still depends on the values of past empirical data obtained from previous design cases, rather than quantitative estimation using a certified energy analysis program.
In contrast, the insulation standard and design requirements of buildings have not remained at previous standards, but have continuously evolved to become more stringent owing to the implementation of the government-driven energy saving policy in 2008. Since then, the required value of the coefficient of heat transmission was increased by 64% and 62% for exterior walls and windows/doors, respectively. For greenhouses, no standards have been established for insulation performance or for cooling load estimation. According to the Collection of Case Studies on Heat Loss in Agriculture Facilities, which was published by the Rural Development Administration of Korea, the heat loss measured by a thermo-graphic camera was 31%, 29%, 24%, 15%, and 1% for sidewalls, front and rear walls, floors, roof surfaces, and gaps in thermal curtains, respectively [3].
Therefore, improving the insulation performance of a greenhouse structure and covering material is the most practically adoptable solution among the element technologies for cooling in a greenhouse under development, and will result in operational cost savings on farms. In addition, in the greenhouse design phase, the selection of the covering material is a critical factor when calculating the heating and cooling loads. Furthermore, the load estimation result affects the selection of other equipment, such as heat pumps and thermal storage tanks.
There are optimal indoor temperature standards for plant growth specific to different plant types, such as paprika, cucumber, and tomato, and maintaining the optimal level of light saturation and light compensation improves the quality and increases the yield. Thus, the selection of covering materials in the greenhouse design phase is instrumental in terms of both energy saving and the setting of an optimal indoor environment [4]. The Ministry of Agriculture, Foods and Rural Affairs conducts annual investigations in the area of greenhouse covering materials as a part of the “Current Status of Greenhouse Vegetable Farming and Yield” project, and according to the data, the area ratio for each covering material is as follows (based on 2018 greenhouse vegetables—excluding greenhouse floriculture): 0.63% for glass, 77% for soft film (PE), 8.22% for EVA, 6.57% for PVC, 4.64% for PO, 0.37% for others, 0.24% woven film, 1.31% for rigid plastic film (PET), 0.19% for ETFE, 0.14% for others, 0.28% for rigid plastic sheet (PVC), 0.15% for PC, and 0.01% and 0.2% for others [5].
There have been numerous studies on the analysis of daylight distribution and cooling load for greenhouse buildings.
Young-ha Choi et al. evaluated the effect of a temperature drop using the treatment method, and determined the applicability of the proposed methods in real farmhouses with a combination of pre-installed fans, solar shade, and a fog system depending on mechanical or evaporation-based cooling methods [6]. The average maximum daily temperature dropped by 1.3 °C with the combined use of the fan and shade compared to the use of the fan only, and when the fog system was incorporated, the temperature decreased by 4.5–4.8 °C.
To develop a highly efficient heating energy-saving package technology suitable for glass greenhouses, Jin-kyung Kwon et al. applied a combination of a groundwater heat pump, an aluminum-coated and multi-layered insulating curtain for glass greenhouses, nutrient solution media, and a local heating system to a Venlo-type glass-covered greenhouse for paprika cultivation. Then, the energy consumption and crop growth were comparatively analyzed against the control greenhouse with a diesel hot water boiler and conventional insulating curtain. The fuel consumption values of the experimental greenhouse with the energy saving heating package and the control greenhouse with a conventional heating system were measured as follows: for each 40,469 m2, the control greenhouse with a conventional heating system consumed 14,071 L of diesel and 364 kWh of electric power, whereas the experimental greenhouse consumed 35,083 kWh. This indicates that compared with the control greenhouse, the energy saving rate was 87% based on the greenhouse heating cost [7].
Young-hyun Kim et al. developed a simulation model for two types of single-span greenhouse of direct solar radiation and diffuse solar radiation using the climate data of the two regions of Seoul and Jeonju, and they investigated the effect of seasonal transmittance on the greenhouse. The calculated transmittance of the diffuse solar radiation in the single-span glass-covered greenhouse was 60.4%, achieving a constant value regardless of the orientation. In addition, in the case of direct solar radiation in the winter season, the transmittance was 67–69% for the east–west orientation, and 51–55% for the south–north orientation, having a transmittance that was around 14–16% higher for the east–west orientation. For the transmittance of direct solar radiation in the summer season, the values were higher in the south–north orientation than the east–west orientation [8].
Harjunowibowo et al. used Design Builder for the greenhouse design, and performed the greenhouse energy simulation process with different materials, such as polyethylene, polycarbonate, and an opaque PVC sheet. The reduction in the heat loss with the polycarbonate wall was around 38–54% for the polyethylene facade [9].
The research by J. Xu was conducted in a greenhouse located in Shanghai, and the results show that by employing a shade to block solar radiation and an evaporative cooling pad, the indoor temperature was lowered by 2–3 °C compared to the ambient temperature [10]. The application of the evaporative cooling fan and fan system in the greenhouse located in a sub-tropical area was not as efficient as in a dry climate region, but it still had advantages in terms of their energy saving and simplicity as a control method.
Another study by Issam M. Ali Aljubury used groundwater with an indirect–direct evaporative cooling unit (IDEC) for cooling in a greenhouse located in Baghdad, Iraq. The evaporative cooling unit comprised an indirect evaporative cooling heat exchanger and three cooling pads, and it was designed and fabricated as a direct evaporative cooling system. With the use of groundwater in IDEC, the efficiency increased to 108%. The greenhouse temperature was reduced by 12.1–21.6 °C compared to the ambient temperature, and the relative humidity increased from 8% to 62% [11].
Lucas McCartney proposed a natural ventilation-augmented cooling (NVAC) greenhouse, which is a naturally ventilated greenhouse with improvements implemented through a combination of natural ventilation and a non-conventional mist system. In terms of the cooling performance of the NVAC greenhouse, the temperature dropped by 1.9–12.6 °C and the relative humidity increased by 1.4–31.2% depending on the environmental conditions. The NVAC greenhouse did not use a fan, but it generated air flow at 0.38 m/s, and the average turbulence intensity in the greenhouse was increased to 0.32 from 0.19 under natural ventilation conditions [12].
The study by Jong-gil Jun et al. developed a hybrid heat pump heating system that can utilize geothermal and solar heat selectively or in combination. To perform field tests, the developed system was installed in a controlled horticulture facility to examine the heating performance, and the results obtained were as follows: average heating energy of 111,347 kcal/h (129,473 W), average power consumption of 32,749 kcal/h (38,080 W), and average COP for heating at 3.4 [13].
In this study, the visible light transmittance and reflectivity, solar radiation transmittance and reflectivity, thickness, solar heat gain coefficient, and coefficient of heat transmission were analyzed for seven covering materials, namely, glass, soft film (PE), soft film (PO), rigid plastic film (ETFE), rigid plastic sheet (PMMA), rigid plastic sheet (PC double layer), and woven film. The equipment used in the research comprised a Fourier transform infrared spectrometer (FT-IR), which enabled the measurements of surface radiation and the solar heat gain coefficient of the covering material (single and composite), and a solar simulator. The distinct contribution of this research is that to achieve improved accuracy in the simulation results, the transmittance, reflectivity, coefficient of heat transmission and thickness, etc., which are key influencing factors, were measured according to the test methods in the Korean Industrial Standards (KS) to derive input data for each covering material, whereas most of the existing works performed simulation analysis using the input data from manufacturers or the previous literature. Next, based on the derived optical and thermal input data obtained for each covering material, the cooling load and daylight characteristics of smart farms were simulated to obtain basic reference information for selecting covering materials in the design of greenhouses.
The flow chart of this study is presented in Figure 1 below.

2. Theory

2.1. Types of Covering Materials for Smart Farms

In the “Current Status of Greenhouse Vegetable Farming and Yield” by the Ministry of Agriculture, Foods and Rural Affairs, greenhouse covering materials were classified into four types: soft film, rigid plastic film, glass, and rigid plastic sheet [5].
This study performed optical and heat performance tests on seven different covering materials, namely soft film (PE), soft film (PO), rigid plastic film (ETFE), rigid plastic sheet (PMMA), rigid plastic sheet (PC double layer), and woven film, as shown in Table 1. An investigation of the inherent characteristics of respective covering materials was performed with reference to the manufacturers’ product data.

2.2. Test Standards and Methods for Single-Component Covering Material

Because there is no Korean standard available for evaluating the optical and thermal properties of a covering material made with a single material, to calculate the reflectivity, transmittance, absorbance and heat resistance, solar heat gain coefficient, and coefficient of heat transmission for each covering material, the related standards KS L 2514, KS L 2016 and KS L 2525 were reviewed, as shown in Table 2.
KS L 2514 discusses the test methods for obtaining measurements of visible light transmittance and reflectance and the radiation rate of room-temperature thermal radiation, such as solar radiation transmittance, reflectance and absorbance, as well as the calculation methods of the solar heat gain coefficient for flat glass [14]. Meanwhile, KS L 2525 focuses on the calculation methods of thermal resistance and a construction-related coefficient of heat transmission for flat glass [15].
The basic equations used to estimate the visible light transmittance ( τ v ) and visible light reflectivity ( ρ v ), solar-radiation transmittance ( τ c ), and reflectivity ( ρ c ) from KSL 2514 are as follows.
τ v = λ D λ · V λ · τ 1 , n λ λ D λ · V λ
ρ v = λ D λ · V λ · ρ 1 , n λ λ D λ · V λ
where
D λ is spectral distribution of CIE daylight D 65
V λ is standard invisibility of CIE brightness
In λ , the wavelength range (380~780 nm) values in Section 4 are used
τ 1 , n λ ,   ρ 1 , n λ is the spectral transmittance and spectral reflectance of a structure composed of n glass plates
τ c = λ E λ · Δ λ · τ 1 , n λ λ E λ · Δ λ
            ρ v = λ E λ · Δ λ · ρ 1 , n λ λ E λ · Δ λ  
where
E λ is the standard spectrum distribution of the relative value of direct solar radiation.
In Δ λ , using the wavelength range (300~2100 nm) from Section 4  τ 1 , n λ ,   ρ 1 , n λ is the spectral transmittance and te spectral reflectivity of an n-layered glass plate structure.
Test methods for the coefficient of heat transmission of KS L 2016 were reviewed to evaluate the heat performance of the covering material with a single component. The testing standard KS L 2016 specifies films for shielding solar heat to improve the indoor cooling and heating effects by attaching the film to the window glass of the greenhouse, and films for preventing glass-shattering to reduce the shattering and falling of window glass following collisions, earthquakes, and explosions.
The basic equation specified in KS L 2016 for the coefficient of heat transmission is as follows [16]:
K W m 2 K = 1 1 4.9 ε o + 16.3 + 1 5.4 ε i + 4.1 + 0.005  
where ε i , ε o is obtained by section c of the KS L 2016(6.3.4).
To measure longwave radiation (%), flat glass with a thickness of 3 mm is cut into a tester with a set size, washed, and specimens are made via the attachment of a piece of film of the same size as the cut glass. Then, the radiation of the indoor-side surface ( ε i ) and outdoor-side surface ( ε o ) was measured according to the method prescribed in Section 3 of KS L 2514. The test method for the coefficient of heat transmission in KS L2525 was reviewed for the evaluation of the heat performance of the covering material made with a single component of glass material. In KS L 2525, the methods used to calculate the thermal resistance of flat glass and the coefficient of heat transmission required for calculating heat when installing flat glass on the external window of a building are specified, and the basic equation is presented as follows. KS L 2525 is a Korean industrial standard prepared based on using ISO 10292-Glass in a building.
R = N 1 h s + M d m Λ m  
where
h s is the thermal conductance of the cavity space
N is the number of the cavity space
M is the number of glass plates
d m is the thickness of the glass plate or the thickness of the intermediate membrane in laminated glass
Λ m is the thermal conductivity of the glass plate or the thermal conductivity of the intermediate membrane in laminated glass

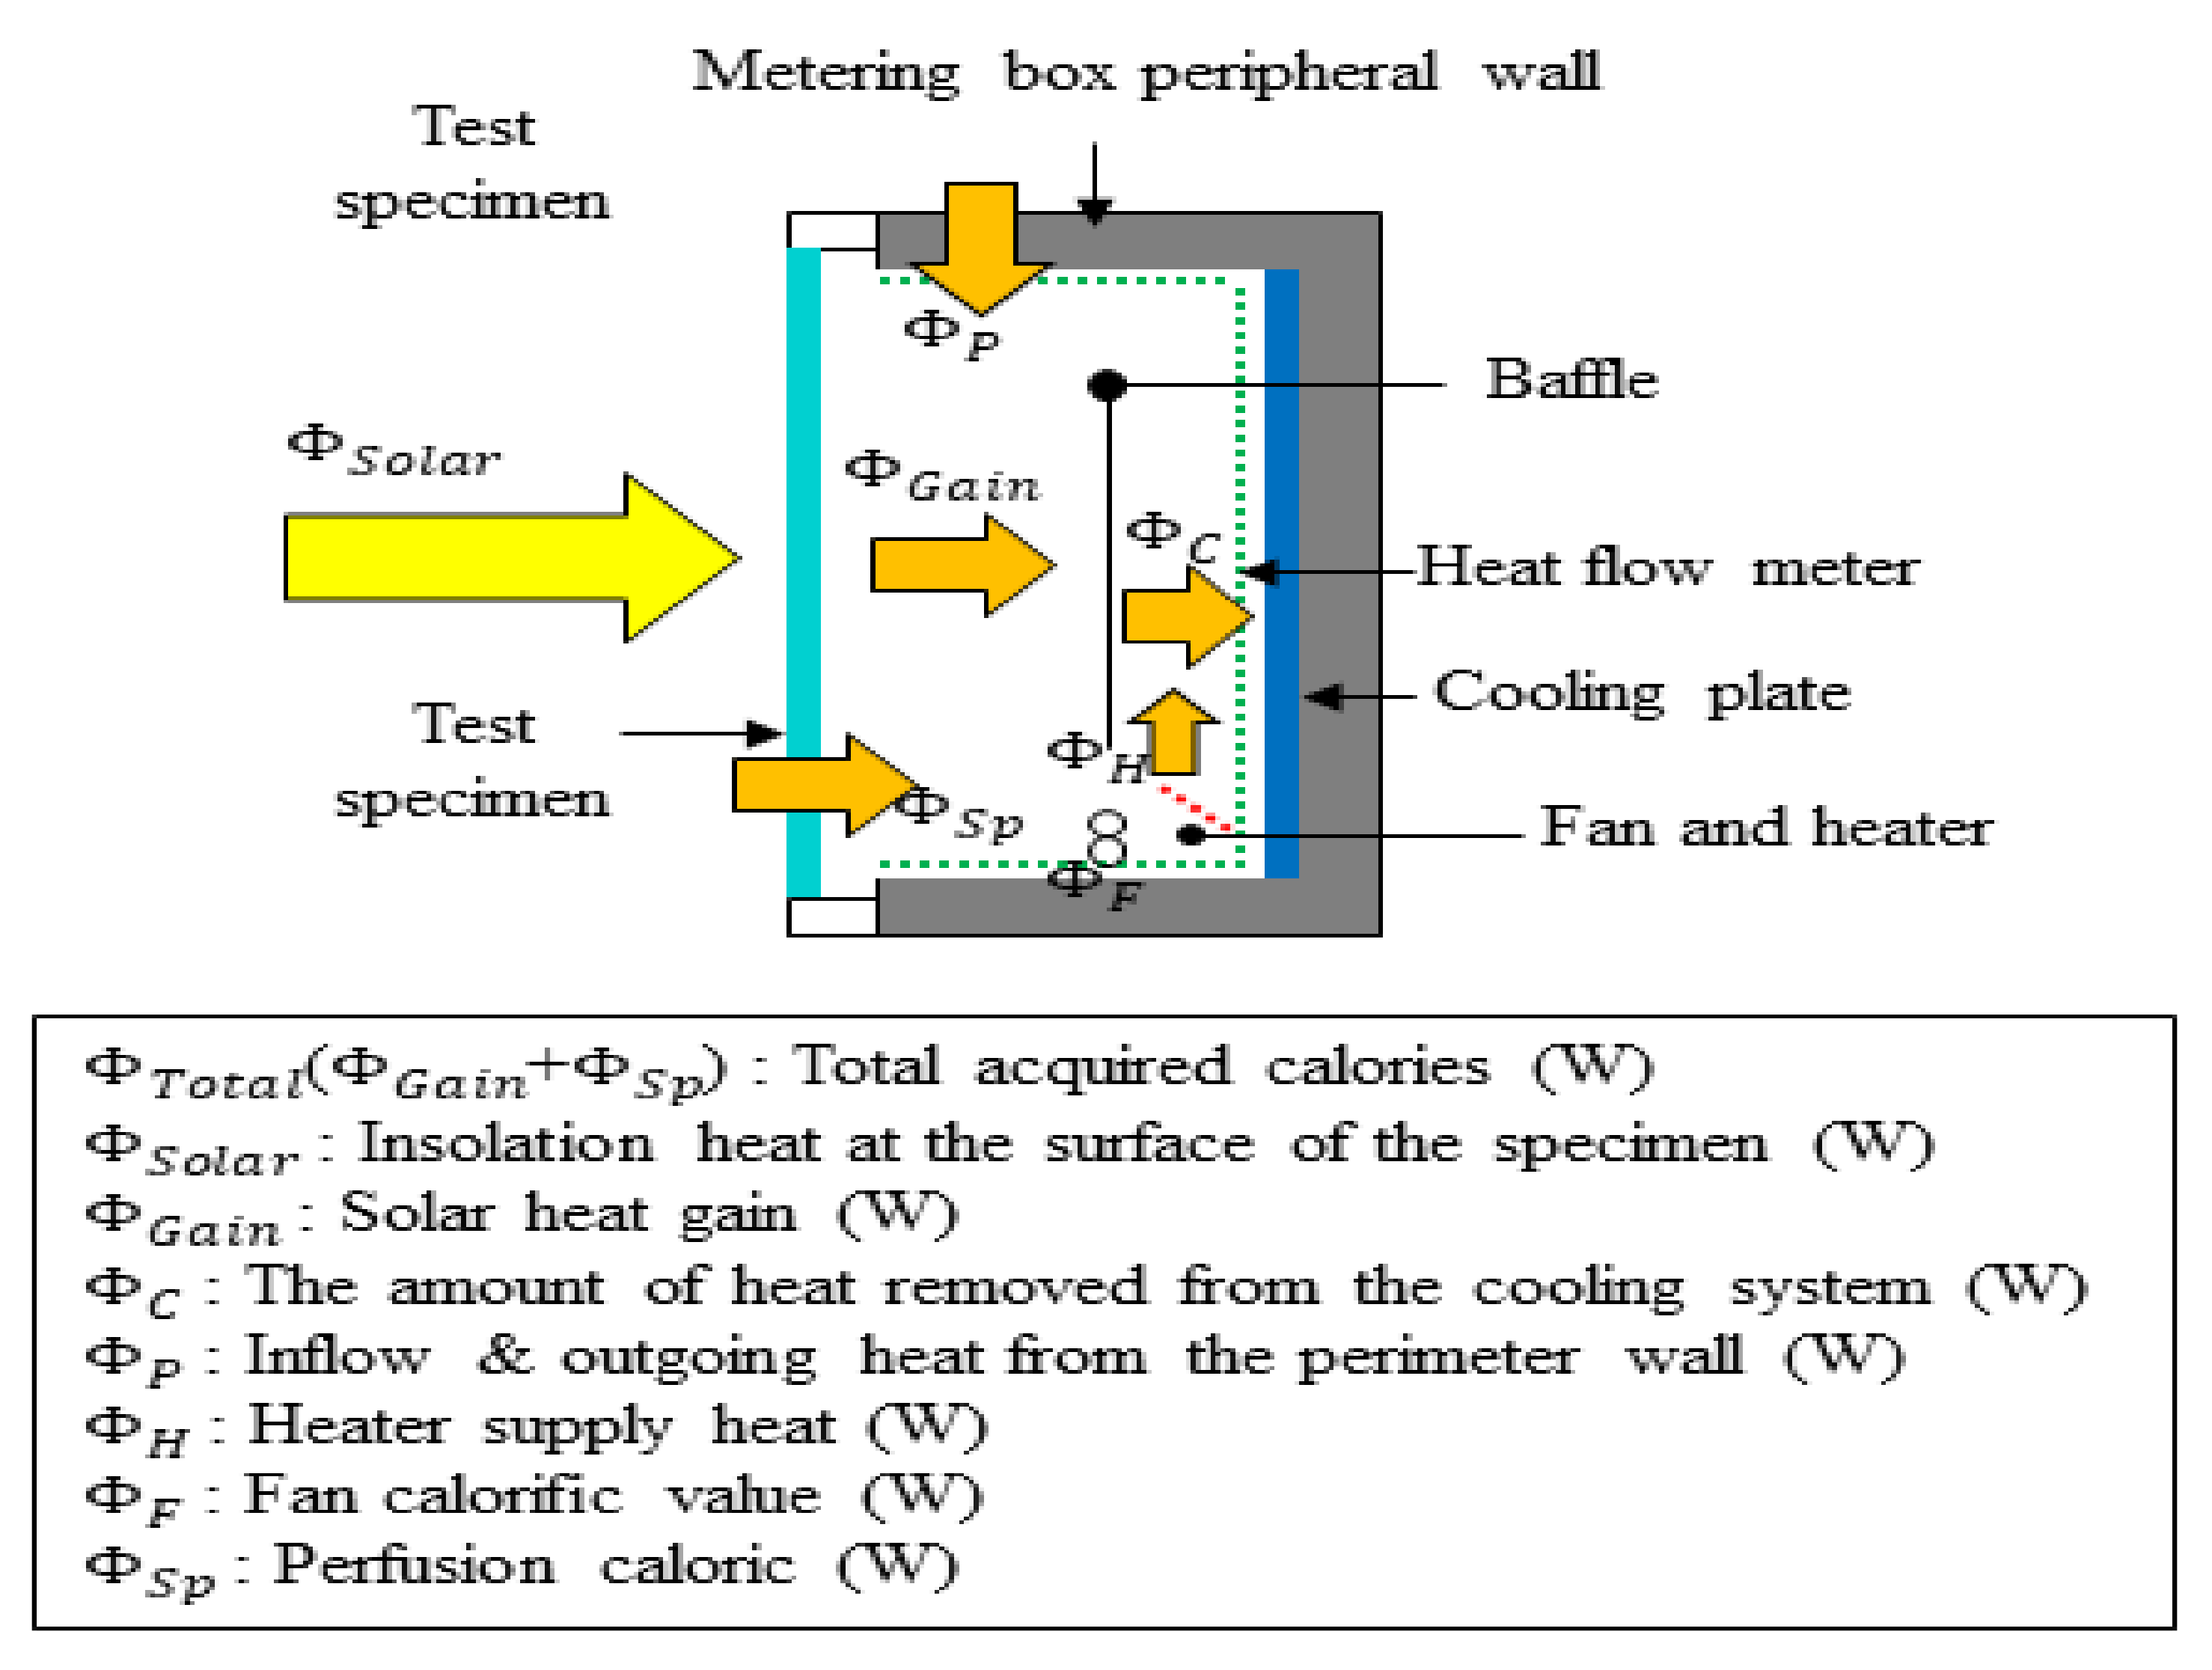
2.3. Test Standard and Methods of Composite Covering Material

Because there is no Korean standard for evaluating the optical and thermal properties of a covering material made with composite materials or single materials, to calculate the reflectivity, transmittance, absorbance and heat resistance, solar heat gain coefficient, and coefficient of heat transmission for each covering material, KS L 2514, KS L 9107, and KS L 9016 were reviewed.
The method used to calculate the daylight performance in KS L 2514 is the same as that for the covering material made with a single component, and to select the evaluation method of the solar heat gain coefficient and the coefficient of heat transmission for each covering material, the relevant standard, i.e., KS L 9107, was reviewed
With respect to KS L 9107, the method used to calculate the solar heat gain coefficient for functional windows and blinds used to control incoming solar heat, windows, and doors attached with shading devices such as screens and a semi-transparent panel, windows, and glass installed with films for window glass [17].
In KS L 9107, the solar heat gain coefficient ( τ s ) is the ratio of the total acquired calories ( Φ s o l a r ) of solar light incident to the surface, and the solar heat gain ( Φ g a i n ), which is the energy transmitted indoors after passing the specimen, as shown in Figure 2.
The solar heat gain coefficient ( τ s ) is calculated by the following equation.
S H G C = τ s = Φ t o t a l Φ s p Φ s o l a r = Φ g a i n Φ s o l a k  
where
τ s is solar heat gain coefficient
Φ t o t a l is total calories obtained (W)
Φ g a i n is the total calories of solar heat acquisition (W)
Φ s p is the transmitted calories (W)
Φ s o l a r is the incidental calories on the surface of the specimen (W)
The test methods for the coefficient of heat transmission in KS L 9106 were reviewed to evaluate the heat performance of a covering material made of composite materials.
KS L 9106 specifies a standard for the mineral wool plate insulation material used as a finishing material on the interior and exterior of a building for the purposes of insulation, fire prevention, etc. The thermal resistance, which is the reciprocal of the coefficient of heat transmission, is measured using KS F 2277 or a test device with an equivalent level of precision at an average temperature (25 ± 5 ° C ) [18].
The basic equation of thermal resistance or coefficient of heat transmission in KS F 2277 is as follows (KS F 2277 was prepared based on ISO 8990-Thermal insulation):
R K = θ H A θ C A Q N A  
U = 1 / R  
where
R K is thermal resistance ( m 2 · K / W )
U is coefficient of heat transmission [ W / m 2 · K ]
Q N is the calories transmitted indoors after passing the specimen (W)
θ H A is air temperature in the metering box ( ° C )
θ C A is air temperature in the climatic chamber ( ° C )
A is heating surface area of the specimen ( m 2 )

2.4. International Standards of Greenhouse Design

The status of greenhouse design standards was investigated to understand greenhouse environmental management technologies, such as mechanical equipment, shading, and ventilation systems, including covering material, to determine the method used to calculate the energy consumption.
The design standards and guidelines for major countries were reviewed and the results are listed in Table 3.
First, numerous countries, including the Netherlands and Japan, which are leading countries in horticulture facilities, employ greenhouse design standards that consider the conditions of each county; in addition, they update their standards annually. The American Society of Agricultural Engineers (ASABE) in the American military classified the EP460 on the form and structure of greenhouses and EP 406 on the heating and ventilation of cooling and heating systems [19,20].
ASABE EP406 presents the cooling methods using shading, ventilation, and evaporative cooling (pad, fan, fog).
ASHRAE (American Society of Heating, Refrigerating, and Air-Conditioning Engineers) Handbook Chapter 24 also recommends shading, ventilation, and evaporative cooling only because of the cost of mechanical cooling (heat pump, refrigerator, and so on) [21].
NGMA (National Greenhouse Manufacturers Association) for greenhouse design is subdivided into curtain systems/electrical designs/glazing/ventilation and cooling, but for cooling methods, NGMA recommends only ventilation and evaporative cooling, as well as ASABE and ASHRAE [22].
Overseas design standards provide guidance about the general information pertaining to greenhouse shape, size, structure, environment, etc., which are necessary to design and construct a greenhouse. Owing to the high cost, the information about cooling methods (heat pump, refrigerator, and so on) is limited.
In addition, the method used to calculate the cooling and heating load varies by country.

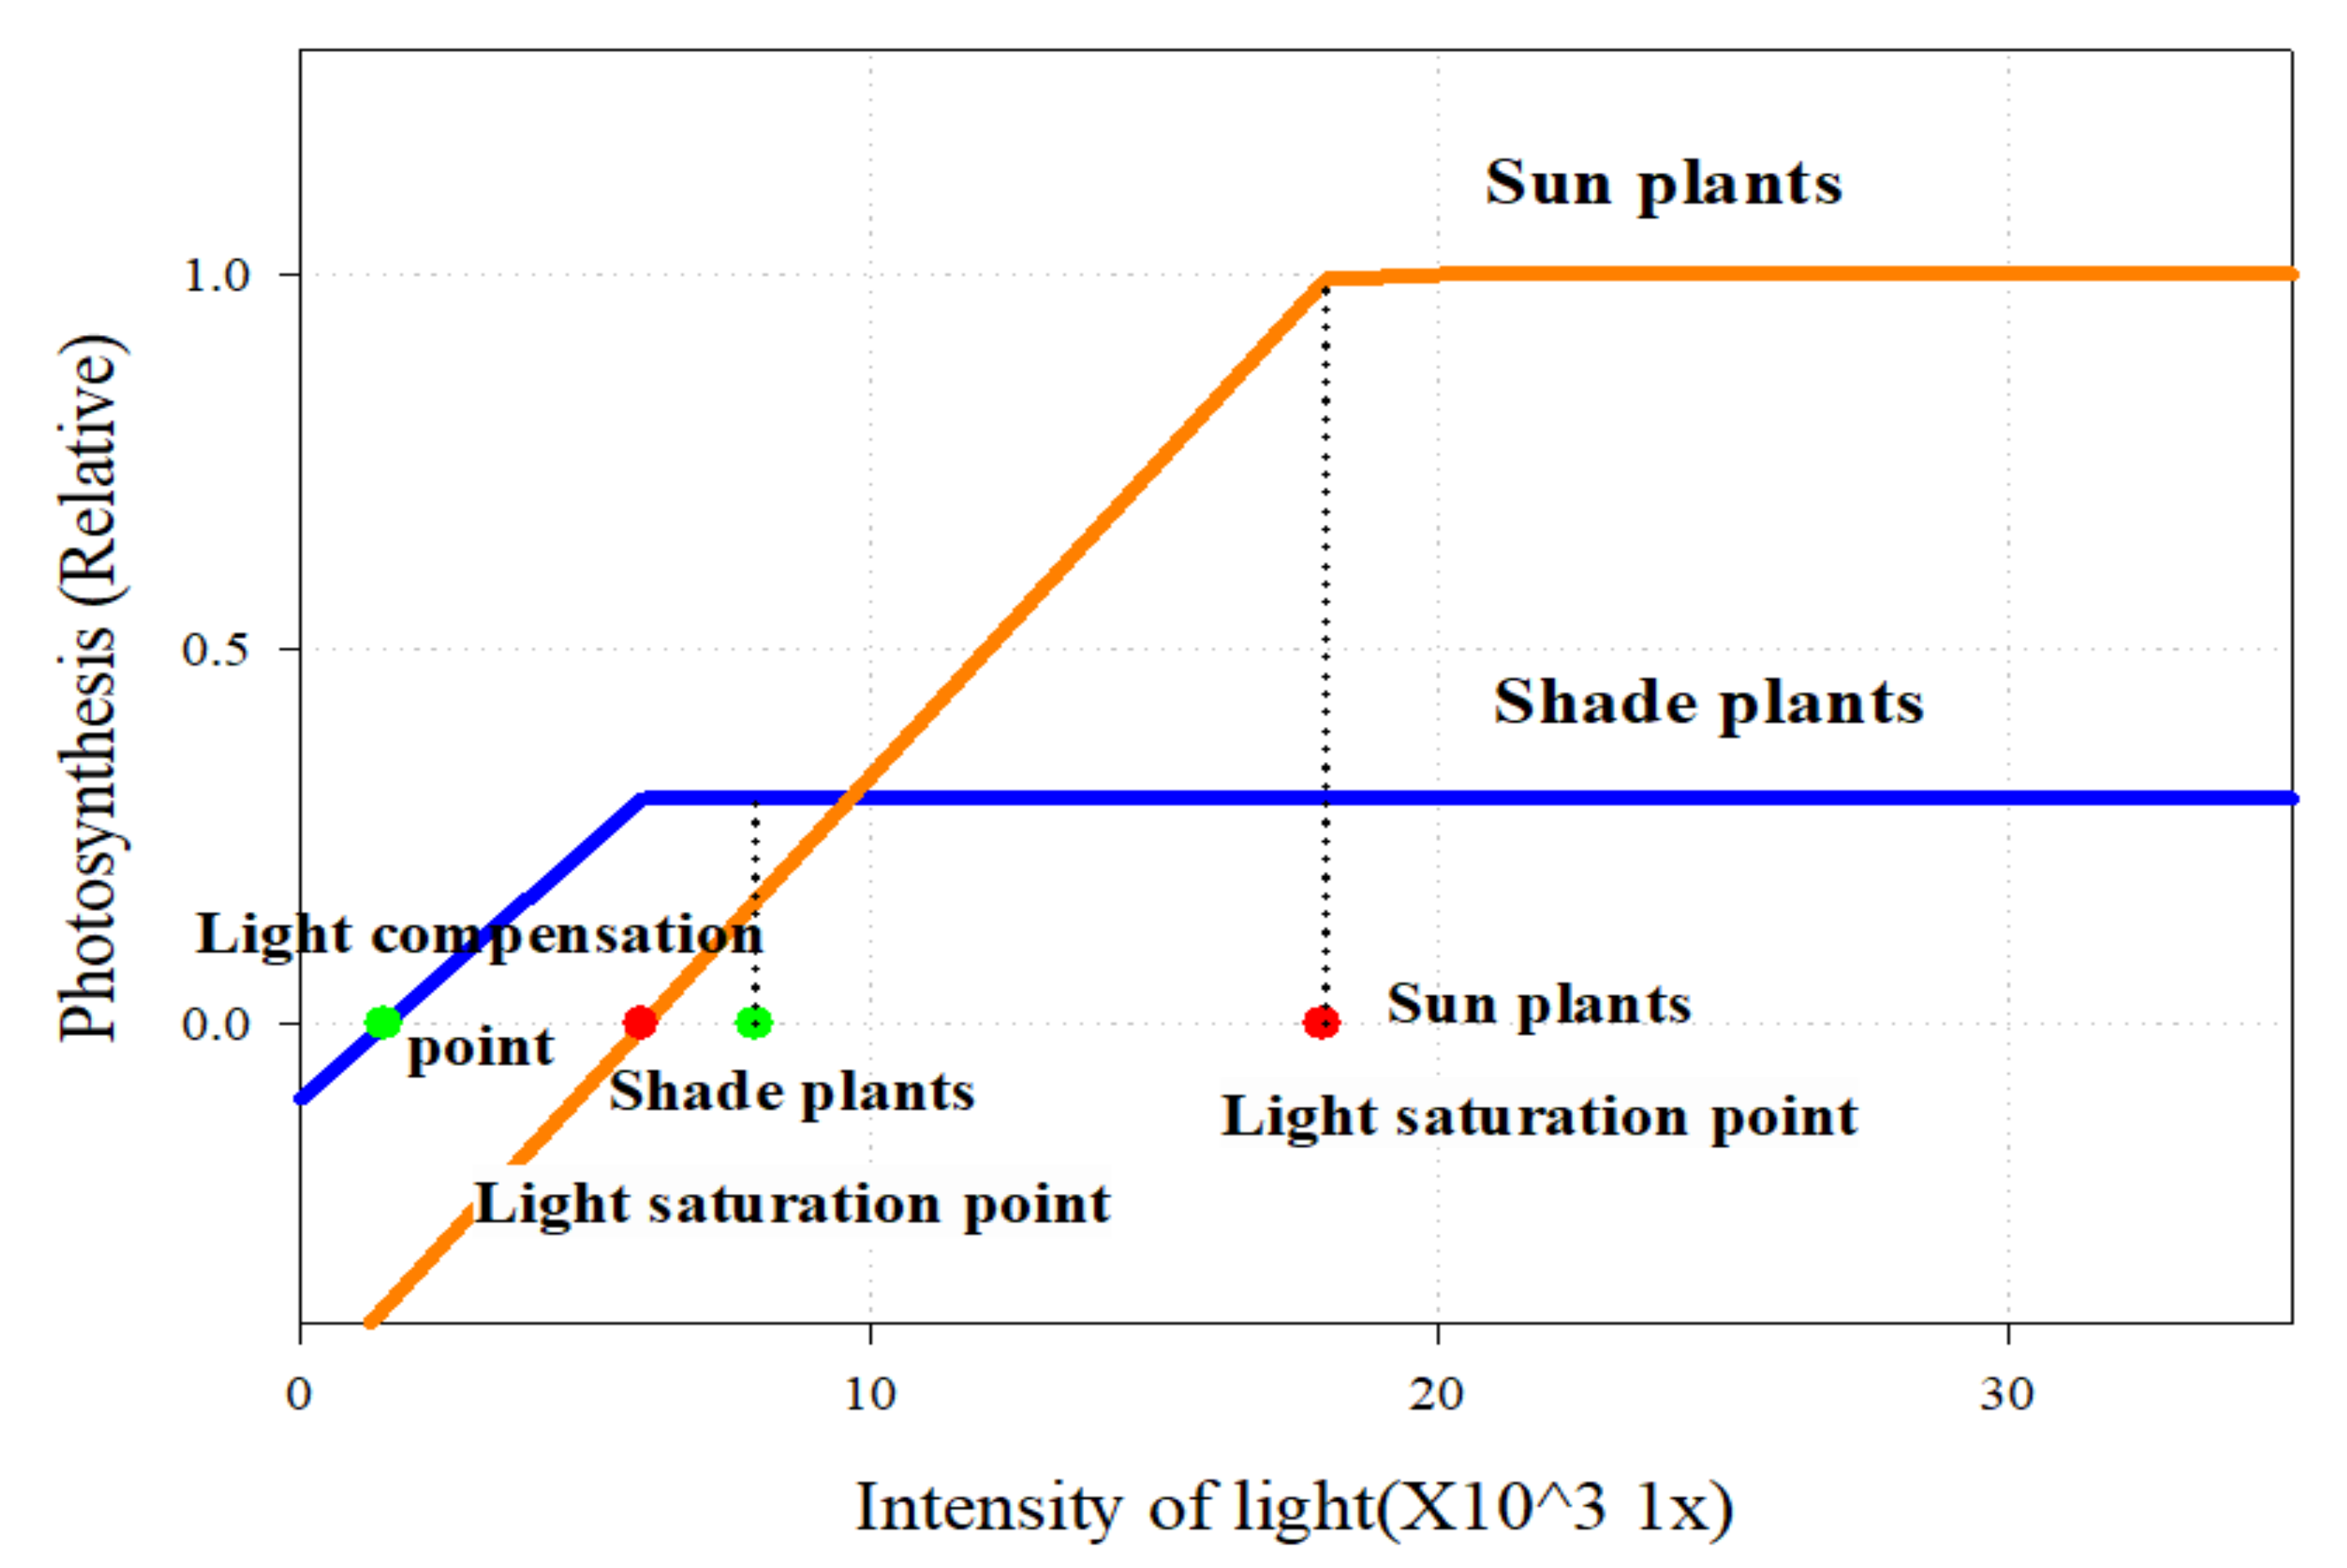
2.5. Light Saturation and Light Compensation Level

For crop cultivation in smart farms, the photovoltaic environment affects the photosynthesis of crops, and is a key factor that determines the growth and quantity of the crops. Crops absorb carbon dioxide in the dark as the radiation intensity increases. The emission of carbon dioxide by breathing and the absorption of carbon dioxide by photosynthesis become equal at a specific intensity of radiation, i.e., the light compensation level.
If the radiation intensity increases beyond the light compensation level, the amount of photosynthesis increases proportionally, and when a certain amount of light is reached, the amount of photosynthesis no longer increases, indicating light saturation.
Up to the light saturation level, crop cultivation increases along with photosynthesis as the illumination level increases. This indicates that when designing greenhouses, it is necessary to verify the covering material and the shading screen for each crop based on the light saturation and light compensation level of each crop.
The graphs of the light saturation level and light compensation point for both shade plants and sun plants are shown in Figure 3.

2.6. Overview of Simulation Program and Algorithm for Light Environment Analysis

The cooling load analysis program used in this study is EnergyPlus 8.9, which enables text-based inputs and selection, and which uses the same engine as the EnergyPlus^ BLAST and DOE-2 programs. In addition, it can be linked with google Sketchup, and is a program that calculates the building load using numerical analysis based on energy balance algorithms. The daylight simulation program used in this study was also EnergyPlus, from the U.S. Energy Department.
The analysis was performed by placing a total of 64 light sensors on a floor with the area of 1008 m2. Although there have been studies that report the limitations of Splitflux, one of the two major algorithms for daylight analysis in EnergyPlus, is related to the high luminance near windows, and is that the difference between the predicted value and measured value increases as the measurement position moves further from the window. However, it is still the most commonly used daylight analysis algorithm for the radiosity method. In light environment analysis, the method enables calculation by dividing the light into direct components—externally reflected components and internally reflected components.

3. Research Methodology

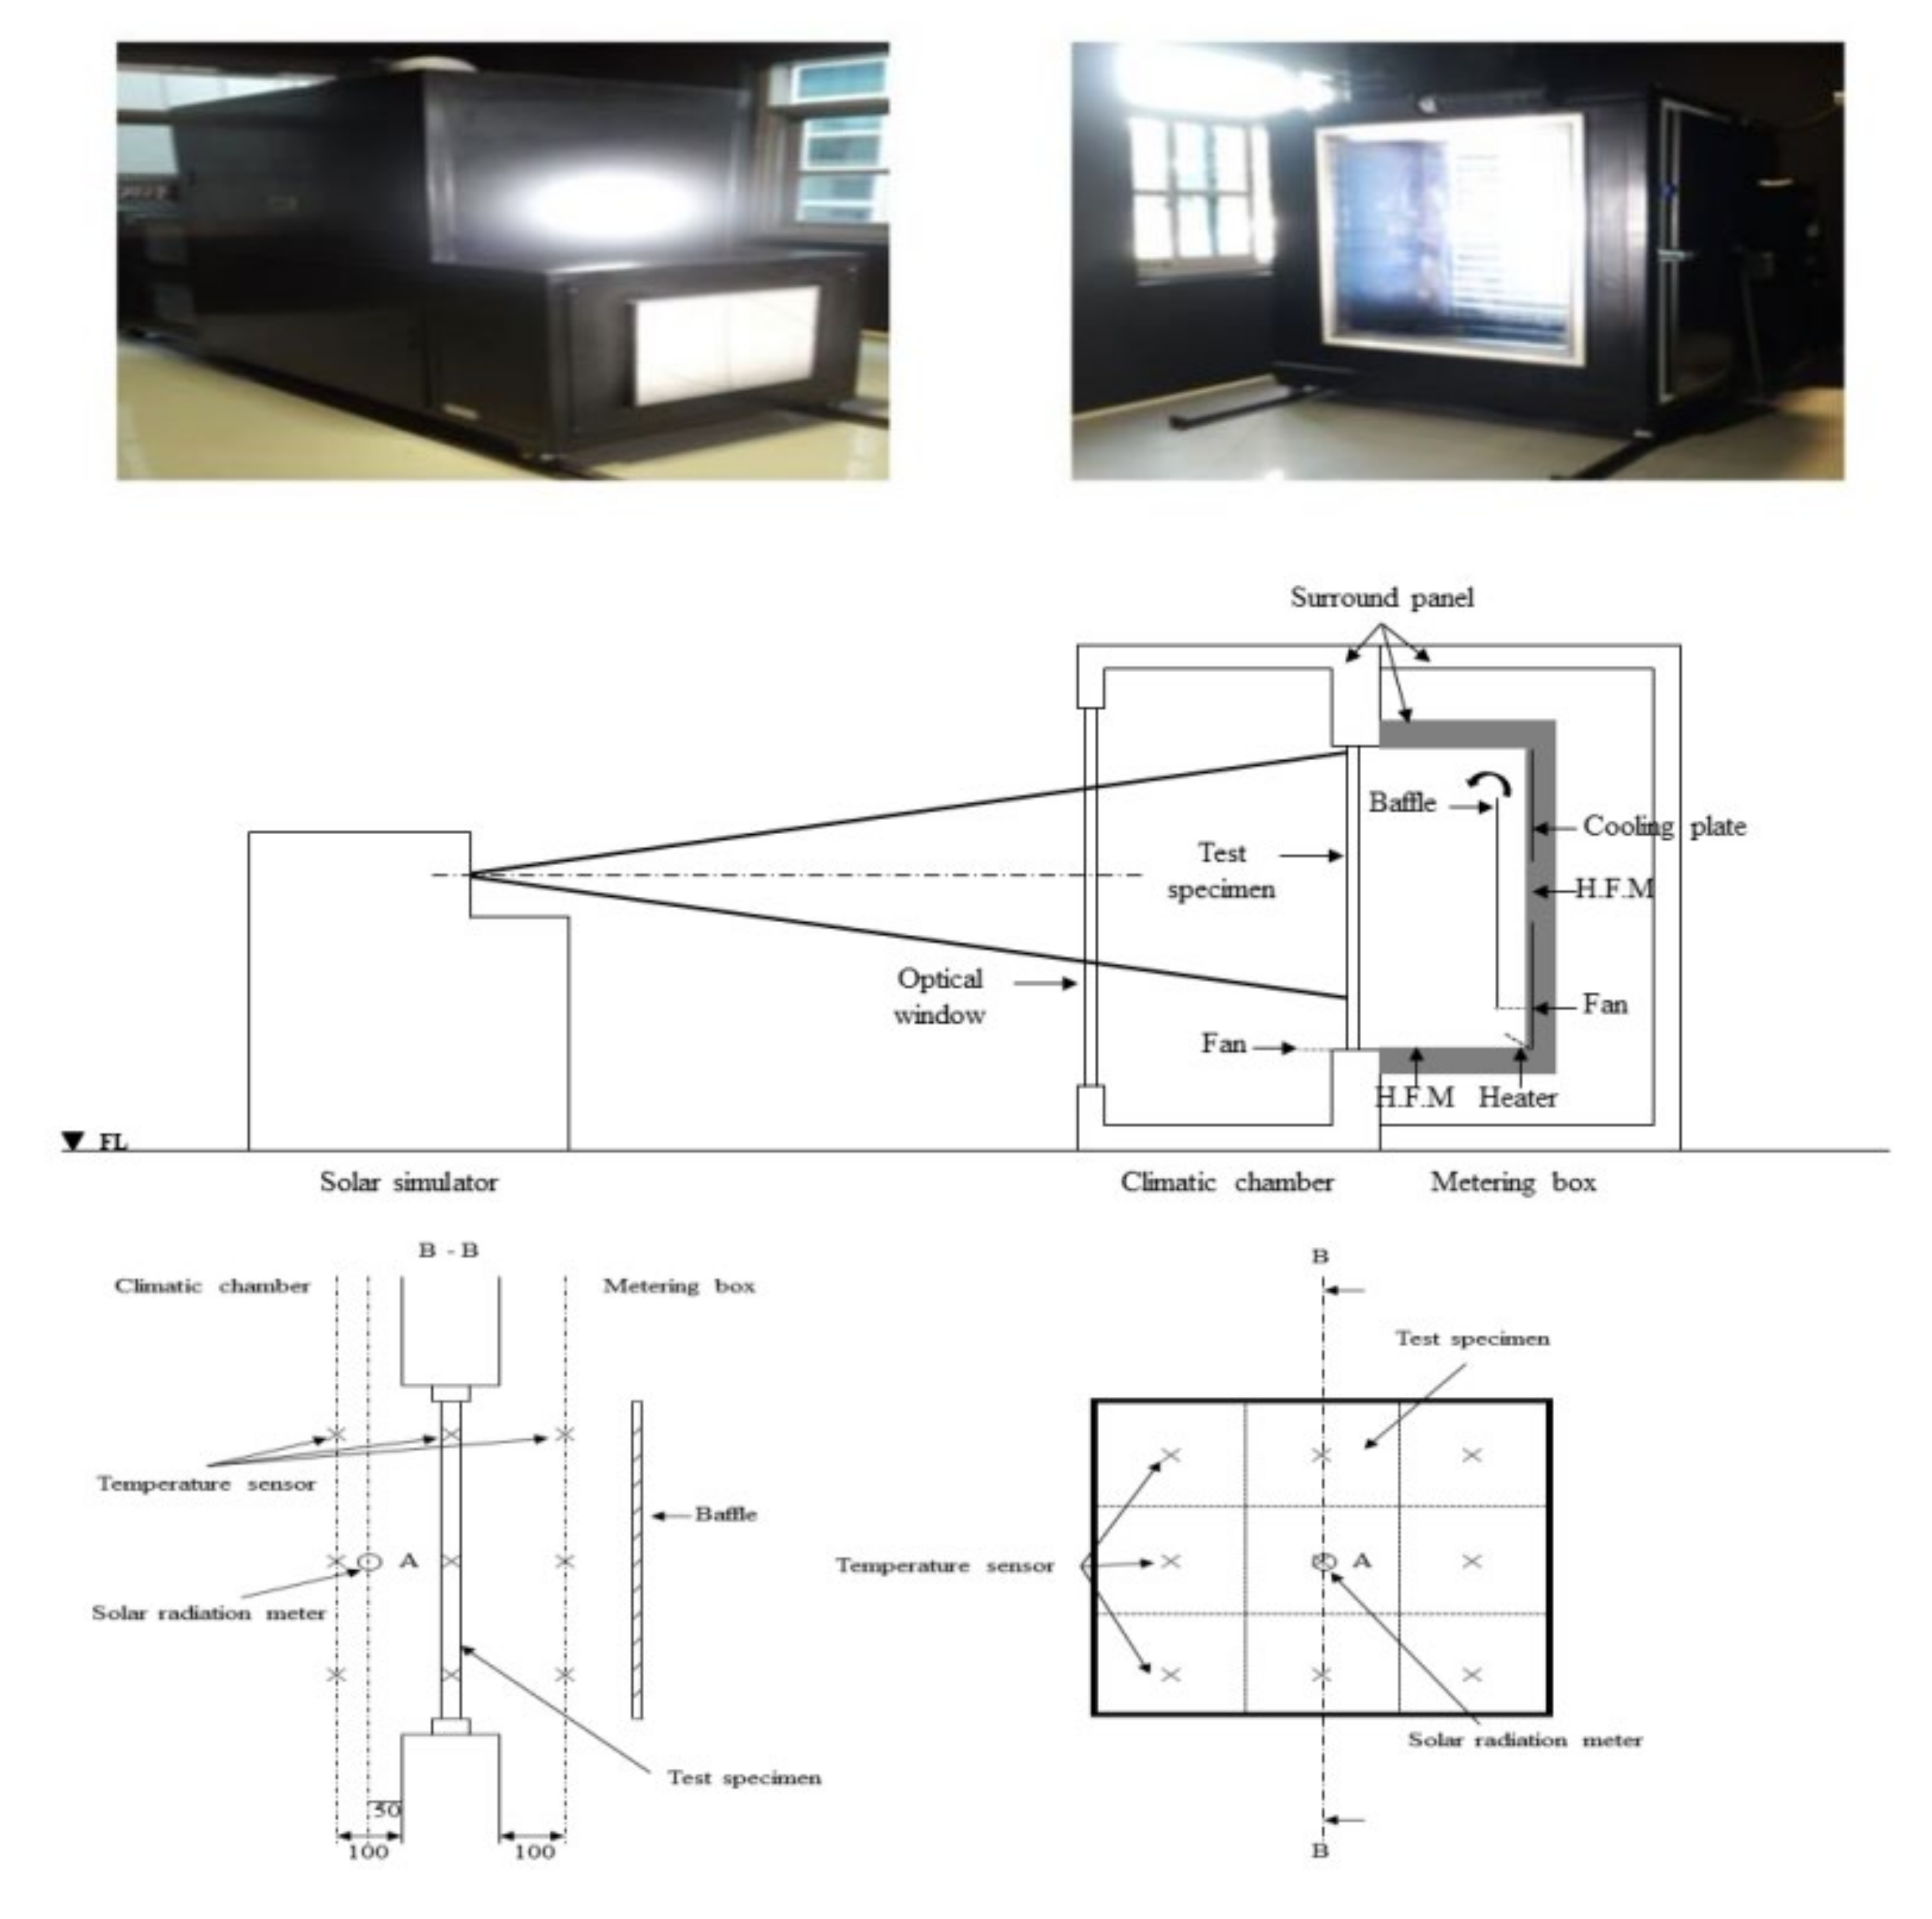
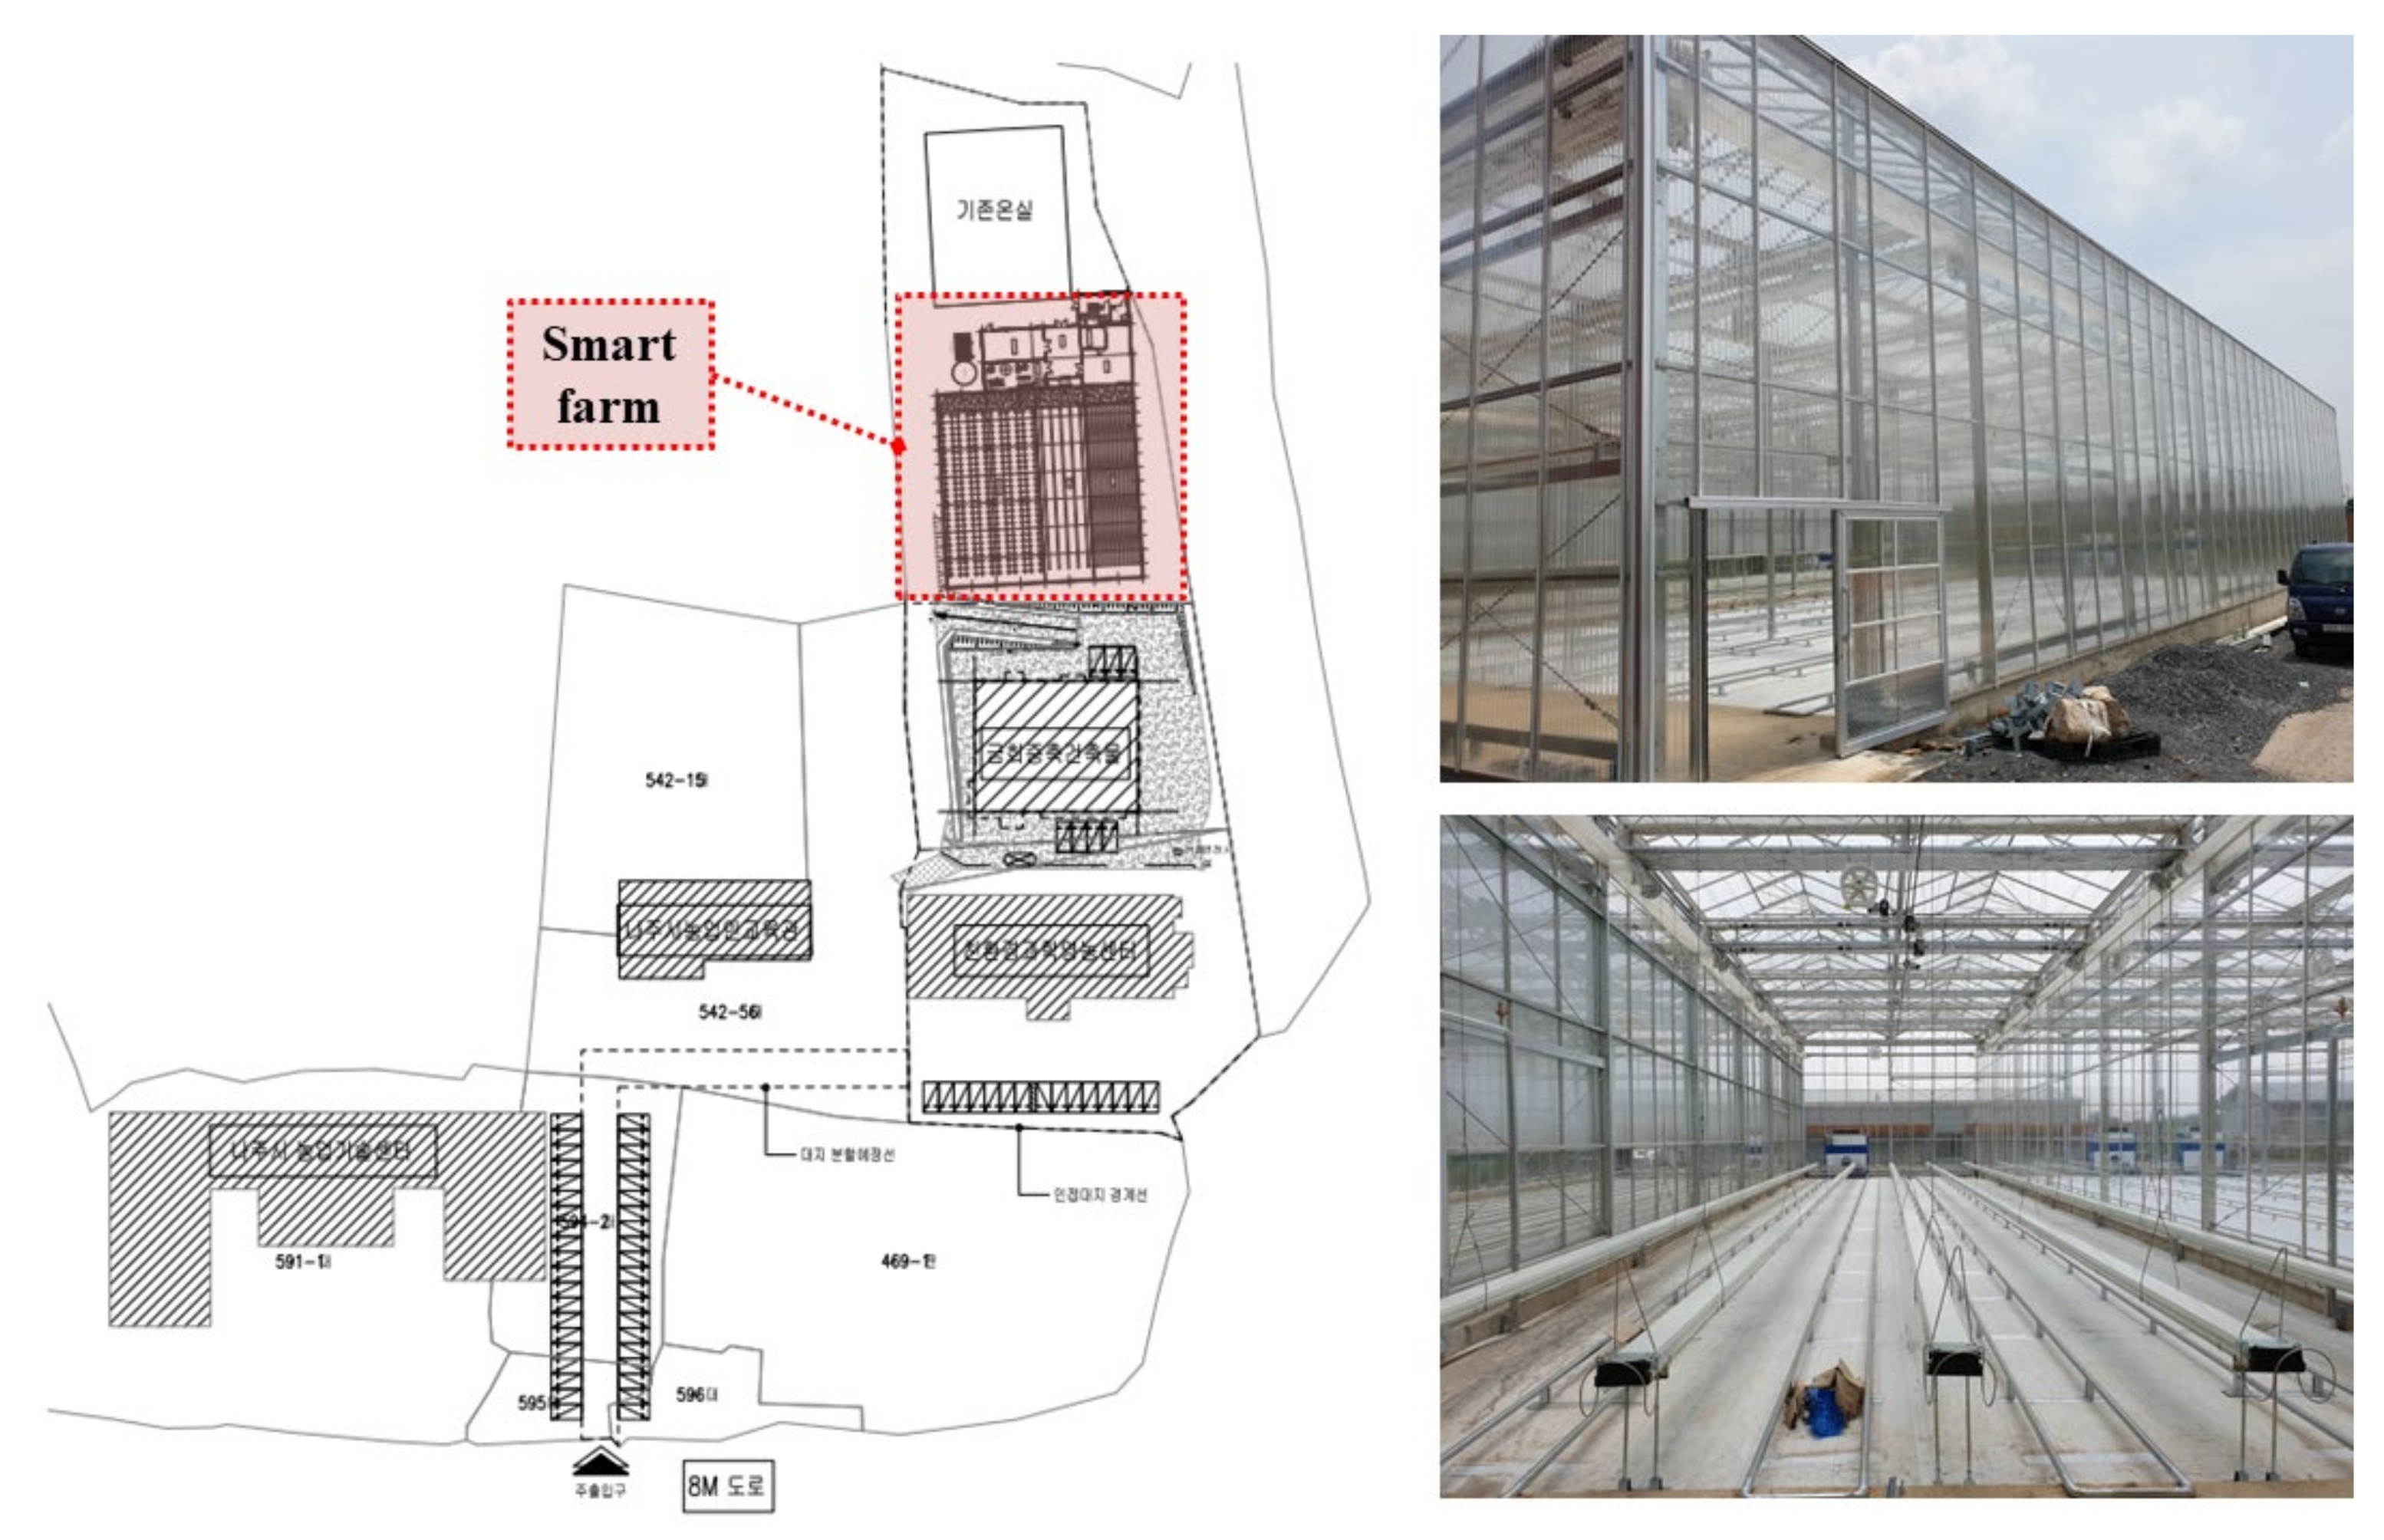
3.1. Experimental Setup

Experimental setup is shown in Figure 4.
The thickness of the covering materials in the test was measured using Vernier calipers according to KS L 2012:2013 and KS M ISO 4593:2002. One point on the inner side more than 15 mm away from the edge is measured with a micrometer with a scale of 0.01 mm, as specified in KS B 5202, or a measuring instrument with an equivalent or superior level of precision [23].
To evaluate the visible light transmittance, as shown in Figure 5, a testing device or equipment is required to evaluate the light characteristics of the covering materials. FT-IR was used, enabling the measurement of the surface radiation of covering materials, and the measurement range was 0.001 to 1.5%. The optical performance of the seven different covering materials described above was evaluated using the following equipment.
The solar heat gain coefficient was obtained using the solar heat gain through a window or a door, derived by measuring the isolation heat perpendicular to the specimen surface and the solar heat gain transmitted indoors after passing through the specimen. It was determined by the solar heat gain transmitted indoors through the specimen owing to the difference between the indoor and outdoor temperatures. The artificial light source for the solar simulator was a Xenon vapor lamp, emitting stable light, and showing a continuous spectrum from UV to visible and IR.
In particular, the light spectrum from UV to visible light is very similar to natural light, and with an air mass filter and fly-eye lens, this artificial light source can be made to closely mimic natural light. With four 7-kW Xenon lamps, the artificial solar system can generate insolation heat above 1000 W/m2 in a solar radiation area of 1500 mm × 1500 mm. The standard deviation of the light source distribution was within ±5.0%, and the effective radiation area was 108%. The maximum incident angle from the specimen surface was set to 10°.
The climatic chamber simulates outdoor environmental conditions. The temperature was maintained at 30 ± 1 °C in summer and 0 ± 1 °C in winter, showing a uniform distribution. According to the standard test method of KC L 2514, the structure was as follows. For the light entrance, clear glass with a transmittance of 90% or more was used, and the opening area of the specimen was over 1500 mm × 1500 mm. We included a perimeter wall that had an insulated structure with a thermal resistance above 4.0 (m2∙K)/W. The fan allows an outdoor surface heat conductivity of 15 W/m2∙K in summer and 20 W/m2∙K in winter, enabling it to simultaneously maintain a constant airflow on the specimen’s surface and control the wind speed.
The metering box simulated the indoor environmental conditions. The temperature was maintained at 25 ± 1 °C in summer and 20 ± 1 °C in winter, showing uniform distribution. According to the standard test method of KS L 2514, the structure was as follows. The opening area of the specimen was over 1500 mm × 1500 mm, and the perimeter wall had an insulated structure with a thermal resistance over 4.0 (m2∙K)/W, with heat flux sensors installed on four sides and with a black matted finish. The fan allows an outdoor surface heat conductivity of 9 W/m2∙K, simultaneously enabling a constant airflow on the specimen surface and maintaining the wind speed. The diagram and photos of the testing equipment are shown in Figure 6.
To operate the testing equipment, a solar radiation meter was used according to the first grade measurement using a horizontal solar radiation meter in KS B ISO 9060. The types of equipment that can be used to measure the insolation include a fixed solar radiation meter, which was installed in the front of the specimen, and a portable solar radiation meter, which can be moved around for measurement. Measurement of the solar radiation intensity was performed on the horizontal plane at the center of the specimen’s surface in the climatic chamber. The light source of the solar simulator should be installed such that the light is incident in the perpendicular direction. With respect to the temperature sensor, the air temperature was measured with a separation distance of 100 mm from the attachment frame; the specimen was divided into nine equal parts, and T-type thermocouples were attached to a total of 18 points in the middle area of each divided part. To set the fan wind speed, the surface heat conductivity value of the standard specimen was required. To perform measurements using the temperature sensor for the surface heat conductivity of a standard specimen, the standard specimen was divided into nine equal parts and the temperature sensors were attached to the center of each part. The sensors were placed at nine points on the surface of the specimen’s climatic chamber and the surface of the metering box, and the surface temperature was taken as the average value of the nine measured points.
In order to derive the coefficient of heat transmission, the thermal conductivity of the specimen was first measured, as shown in Figure 4 (using the thermal conductivity tester presented in Figure 7). Then, the coefficient of heat transmission was calculated using the calculation formula discussed above.

3.2. Simulation Modeling

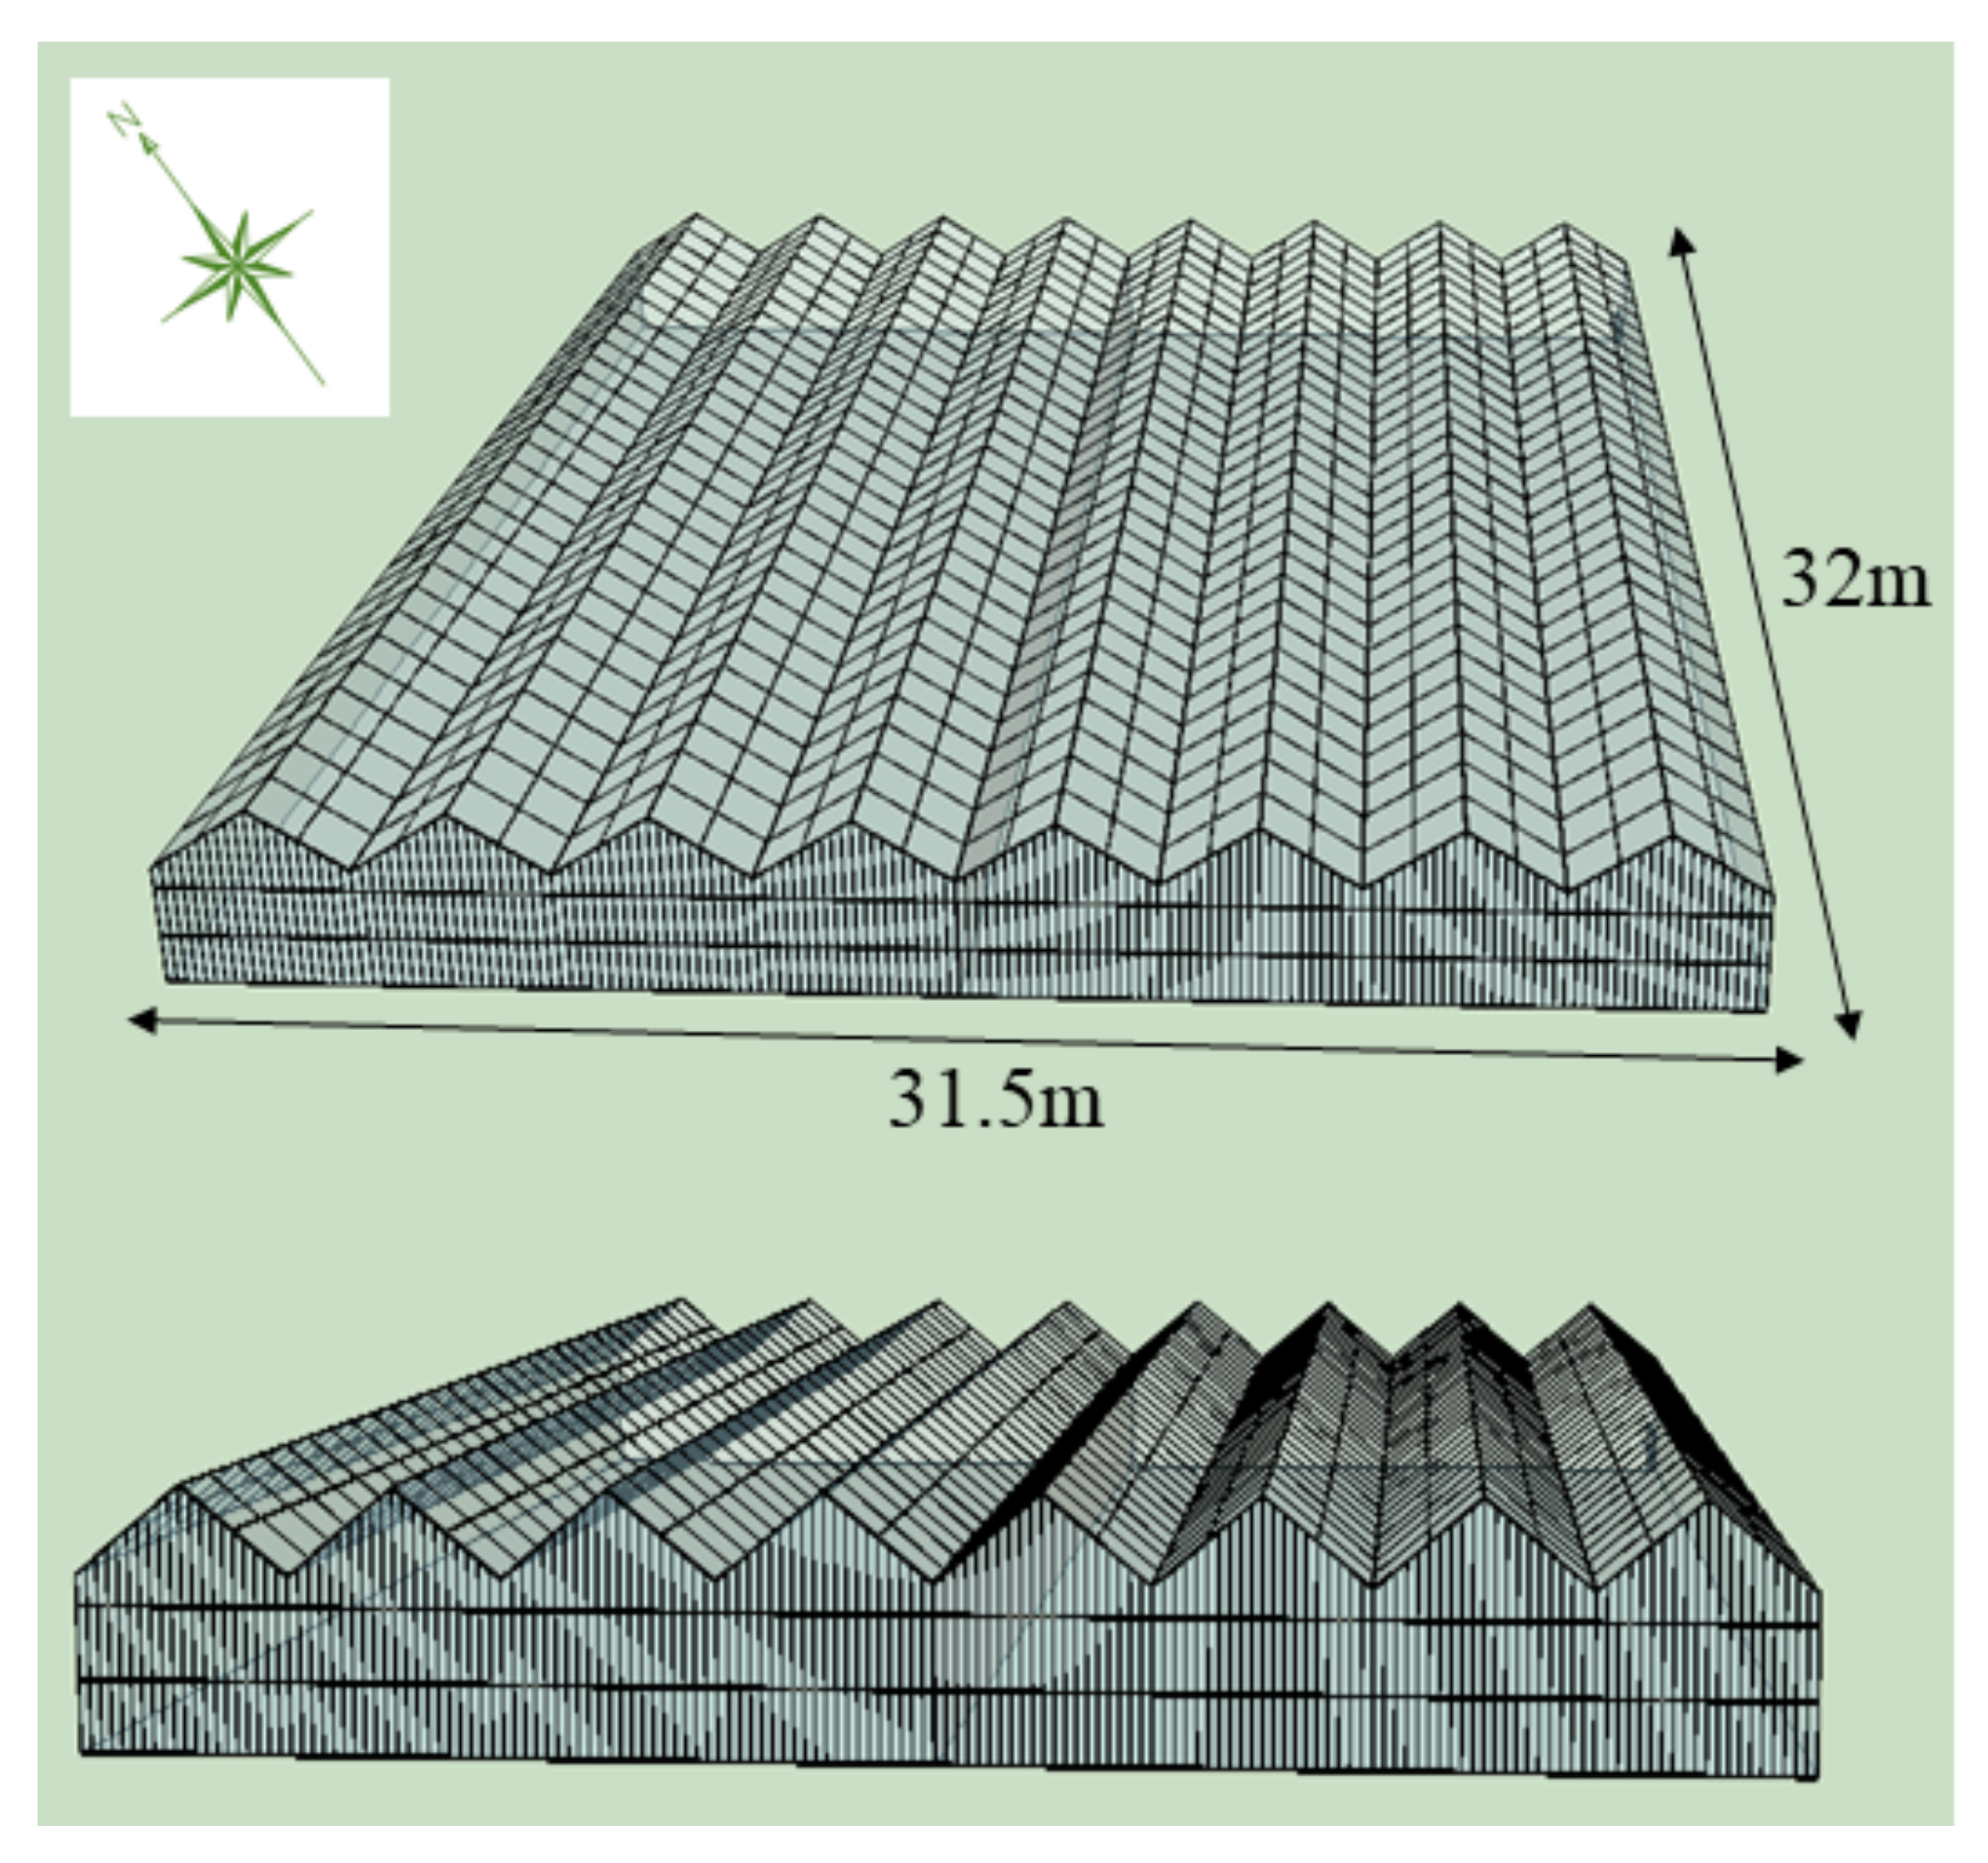
3.2.1. Overview of the Study Building

In Figure 8 and Figure 9, the layout and floor plan for the target greenhouse used for the analysis of cooling load and daylight characteristics are presented. The study site was located in Deoksan-ri, Wanggok-myeon, Naju-si, Jeollanam-do, which is a model greenhouse that provides educational experience of a smart farm at the Naju Agricultural Technology Center. Its area is 1008 m2, and the greenhouse used was an eight-multi-span glass-covered greenhouse used for cultivating strawberry plants, as shown in Table 4. Apart from the cultivation room, the remainder of the greenhouse consisted of a lobby, an equipment room, a machine room, a service area, and a cold storage space. The experimental smart farm had a width of 31.5 m, a length of 32 m, and a height of 6 m, and was arranged at 124° to the northwest. As shown in Figure 10, the cooling load was calculated using EnergyPlus V8.9 after three-dimensional (3D) modeling based on the design drawings and actual measurements of the target greenhouse. For shading, an internal shading rate was applied, and when EnergyPlus was used, the transmittance and reflectivity values were input using WindowMaterial: Shade.

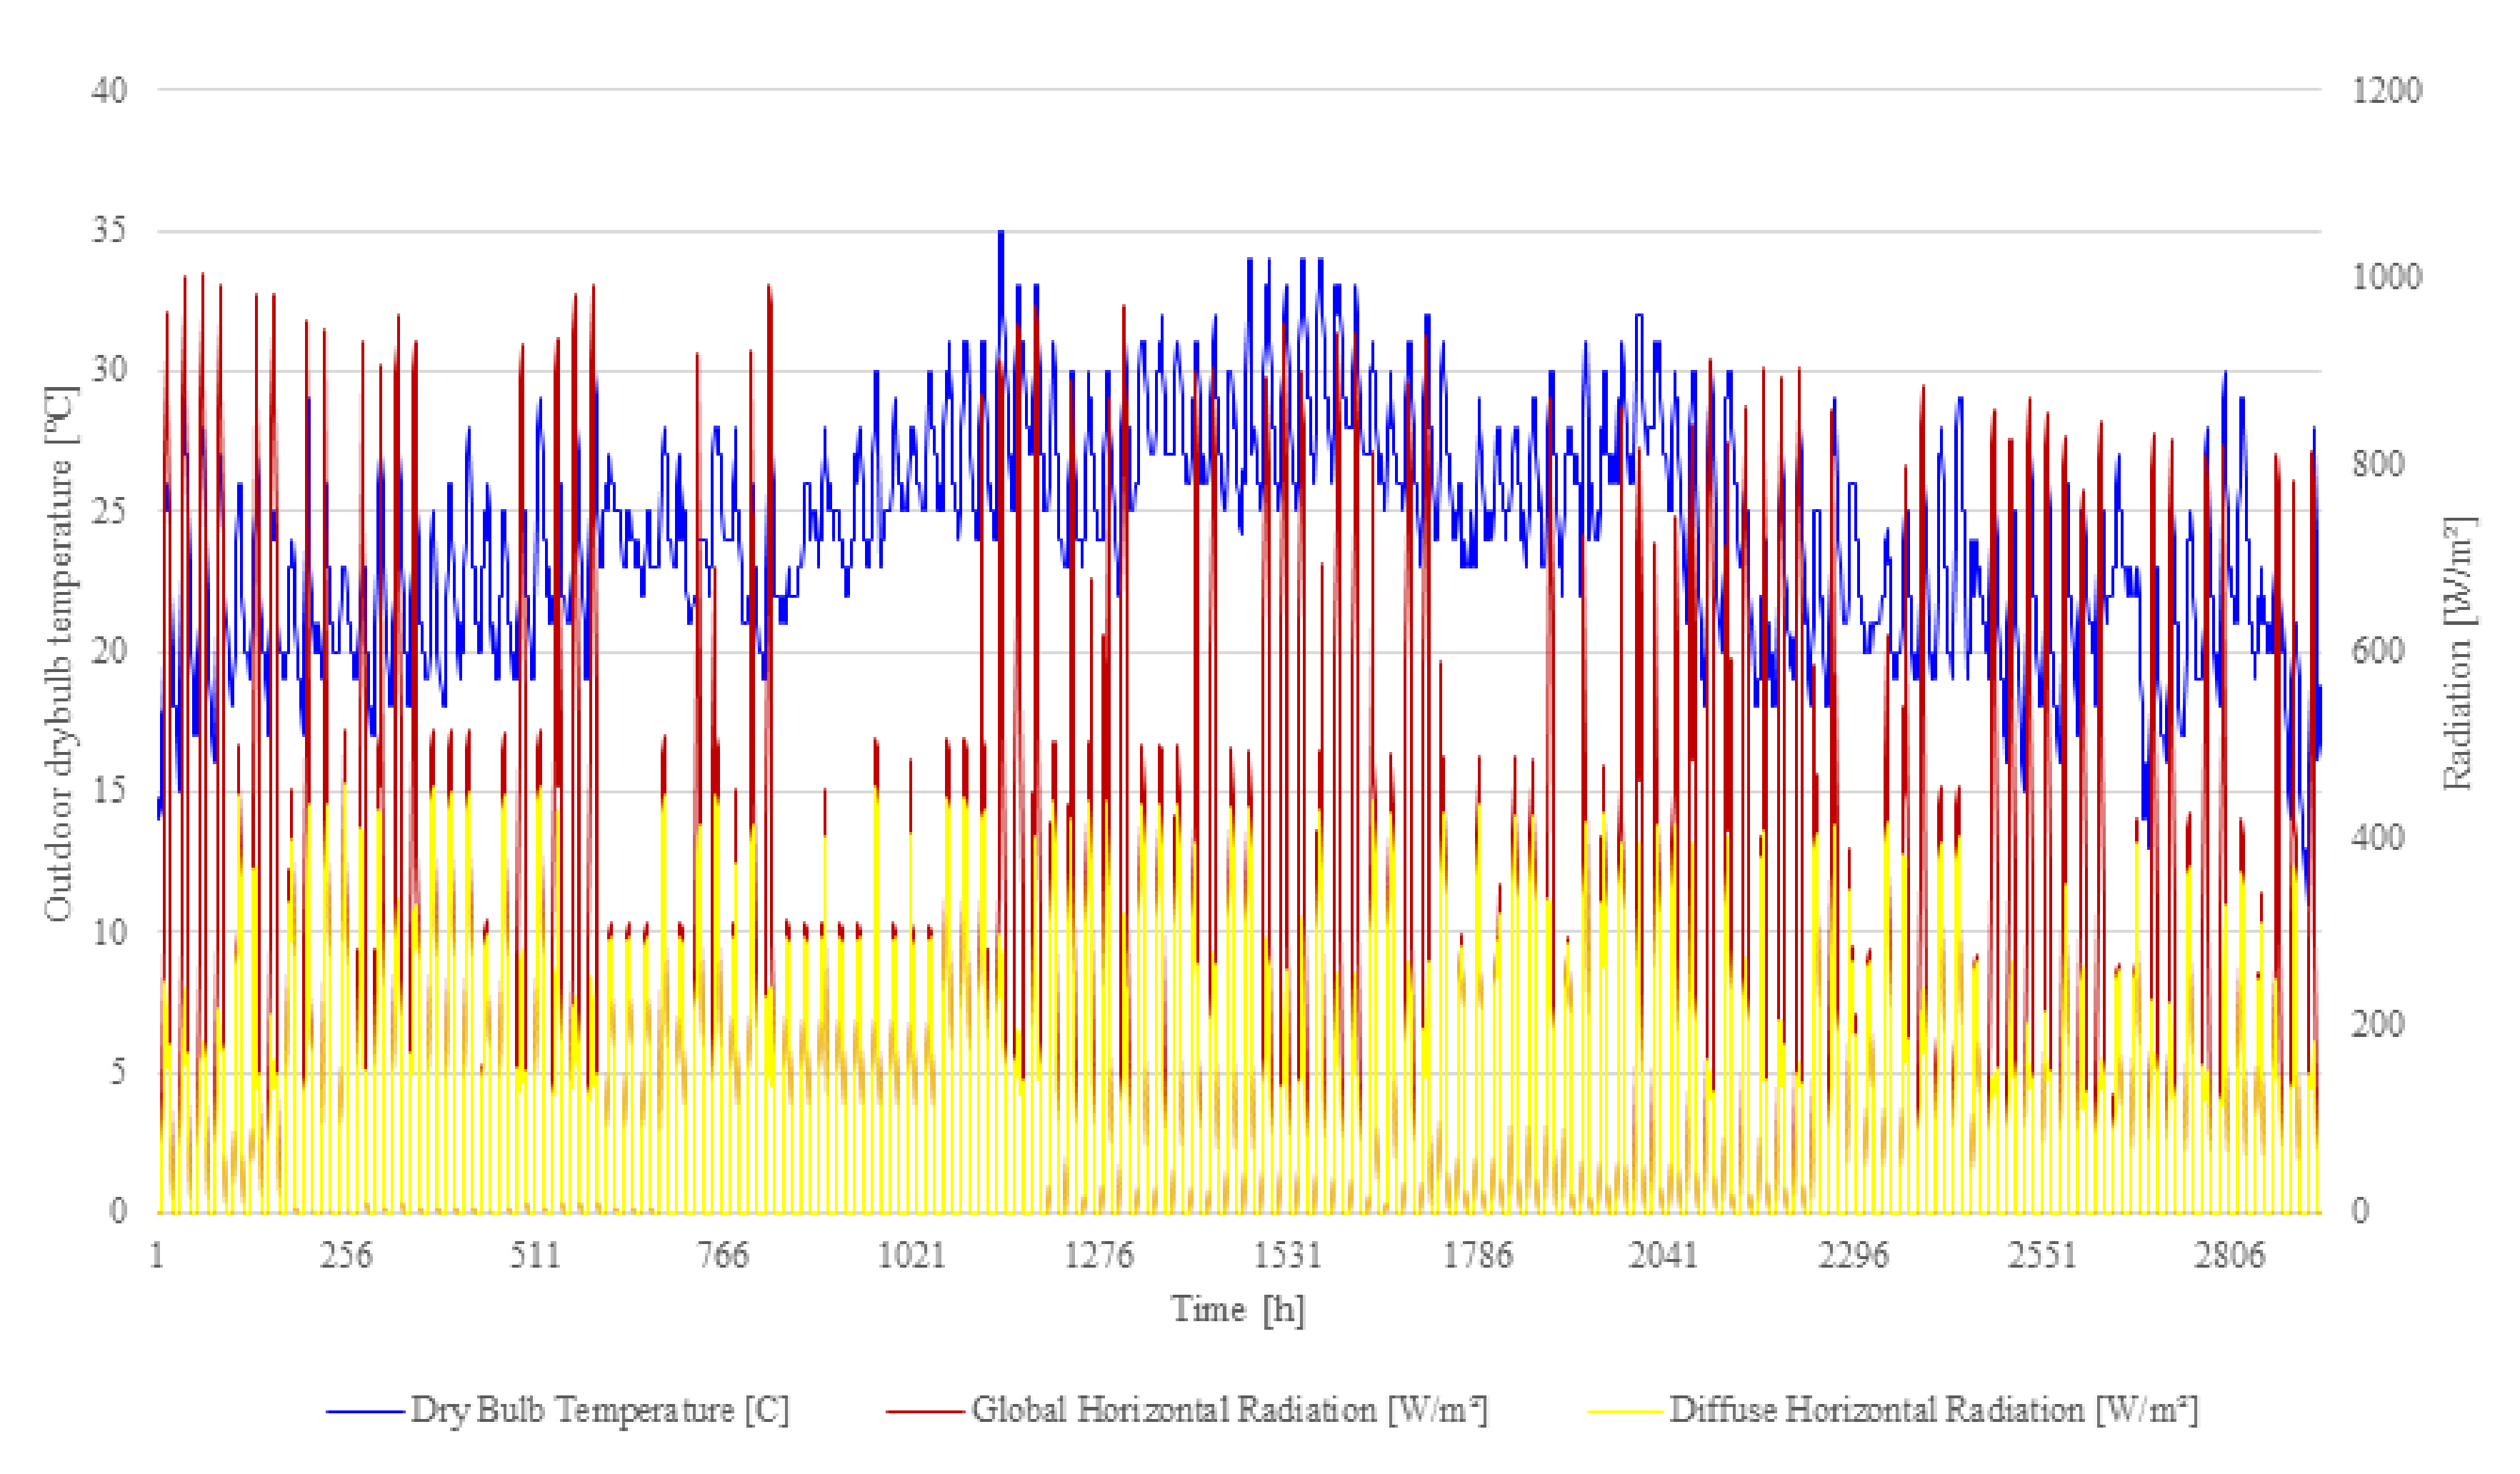
3.2.2. Simulation Conditions

The location of the meteorological measuring station of the Passive House Institute Korea used for the cooling load calculation and daylight characteristics simulation is Muan, Jeollanam-do, and the insolation, temperature, relative humidity, and illuminance data from 2009–2018 were used. The simulation cooling period was from June to September, and the maximum temperature was 35 °C; the maximum insolation was 1005 W/m2, and the maximum exterior illuminance was 125,696 lux, as shown in Figure 11 [24].

3.2.3. Simulation Variables

The input data used for the simulation of analyzing cooling load and daylight distribution characteristics are listed in Table 5, and the results obtained from the standard test methods were used for each covering material. The control variables of the smart farm are outlined in Table 6, and for the scenarios of Case 1-1 ~ Case 1-3 for cooling set temperature control, the temperature range was set to 18–23 °C for the daytime, while for the nighttime, 10–12 °C was set for 17:00–22:00 and 9 °C for 22:00–08:00, according to the Guidelines on Smart Greenhouse Environmental Control. In addition, in the scenarios of Case 2-1 to Case 2-4, the shading rates were set as variables from 0% (without the application of internal shading) to 40%, 50%, and 60% [4].
For the cultivation of strawberries, the target intensity of light is considered to be 10,000–40,000 lux with a light saturation point at 40,000–45,000 lux. The analysis of daylight characteristics is needed when the cooling load is reduced but still satisfies both the target intensity of light and the light saturation point conditions.

4. Results and Discussion

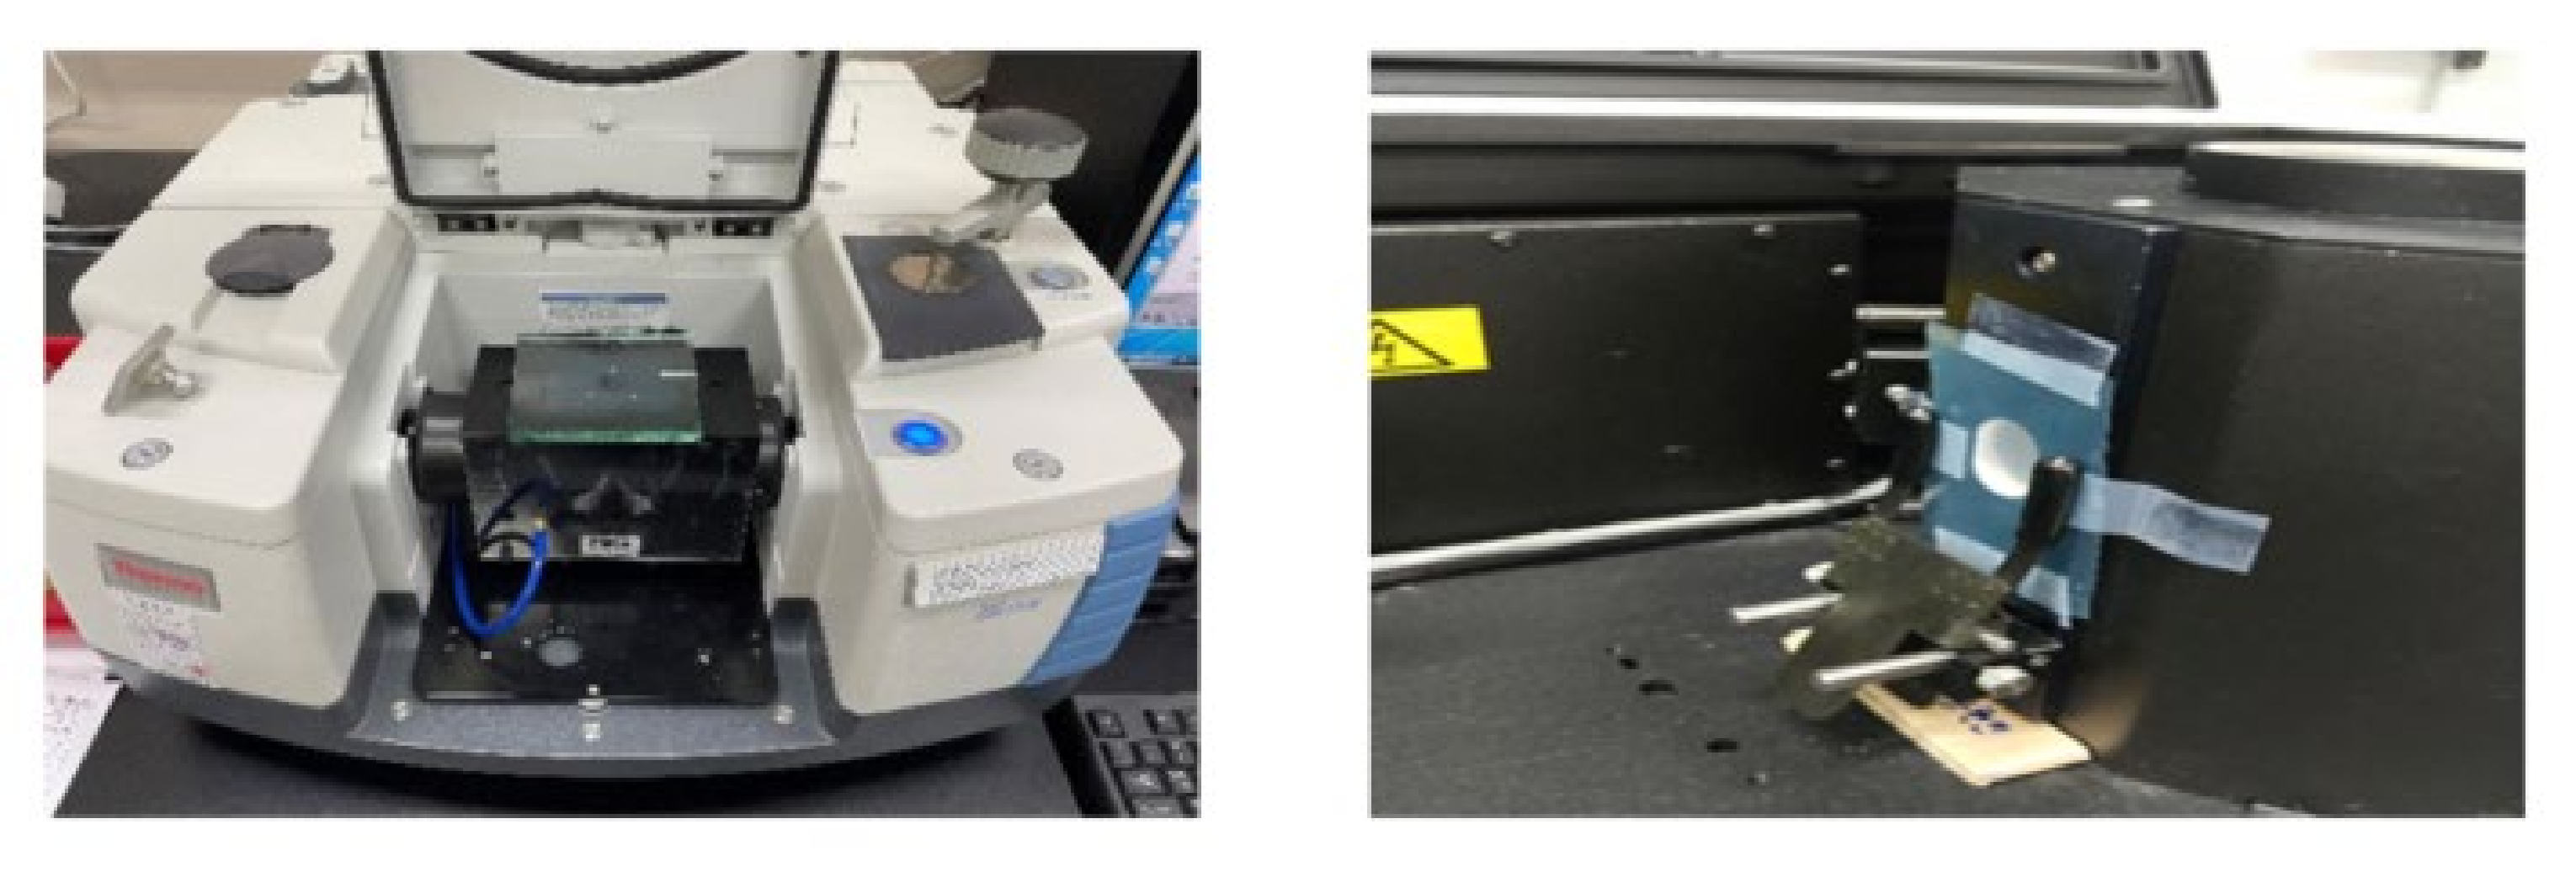
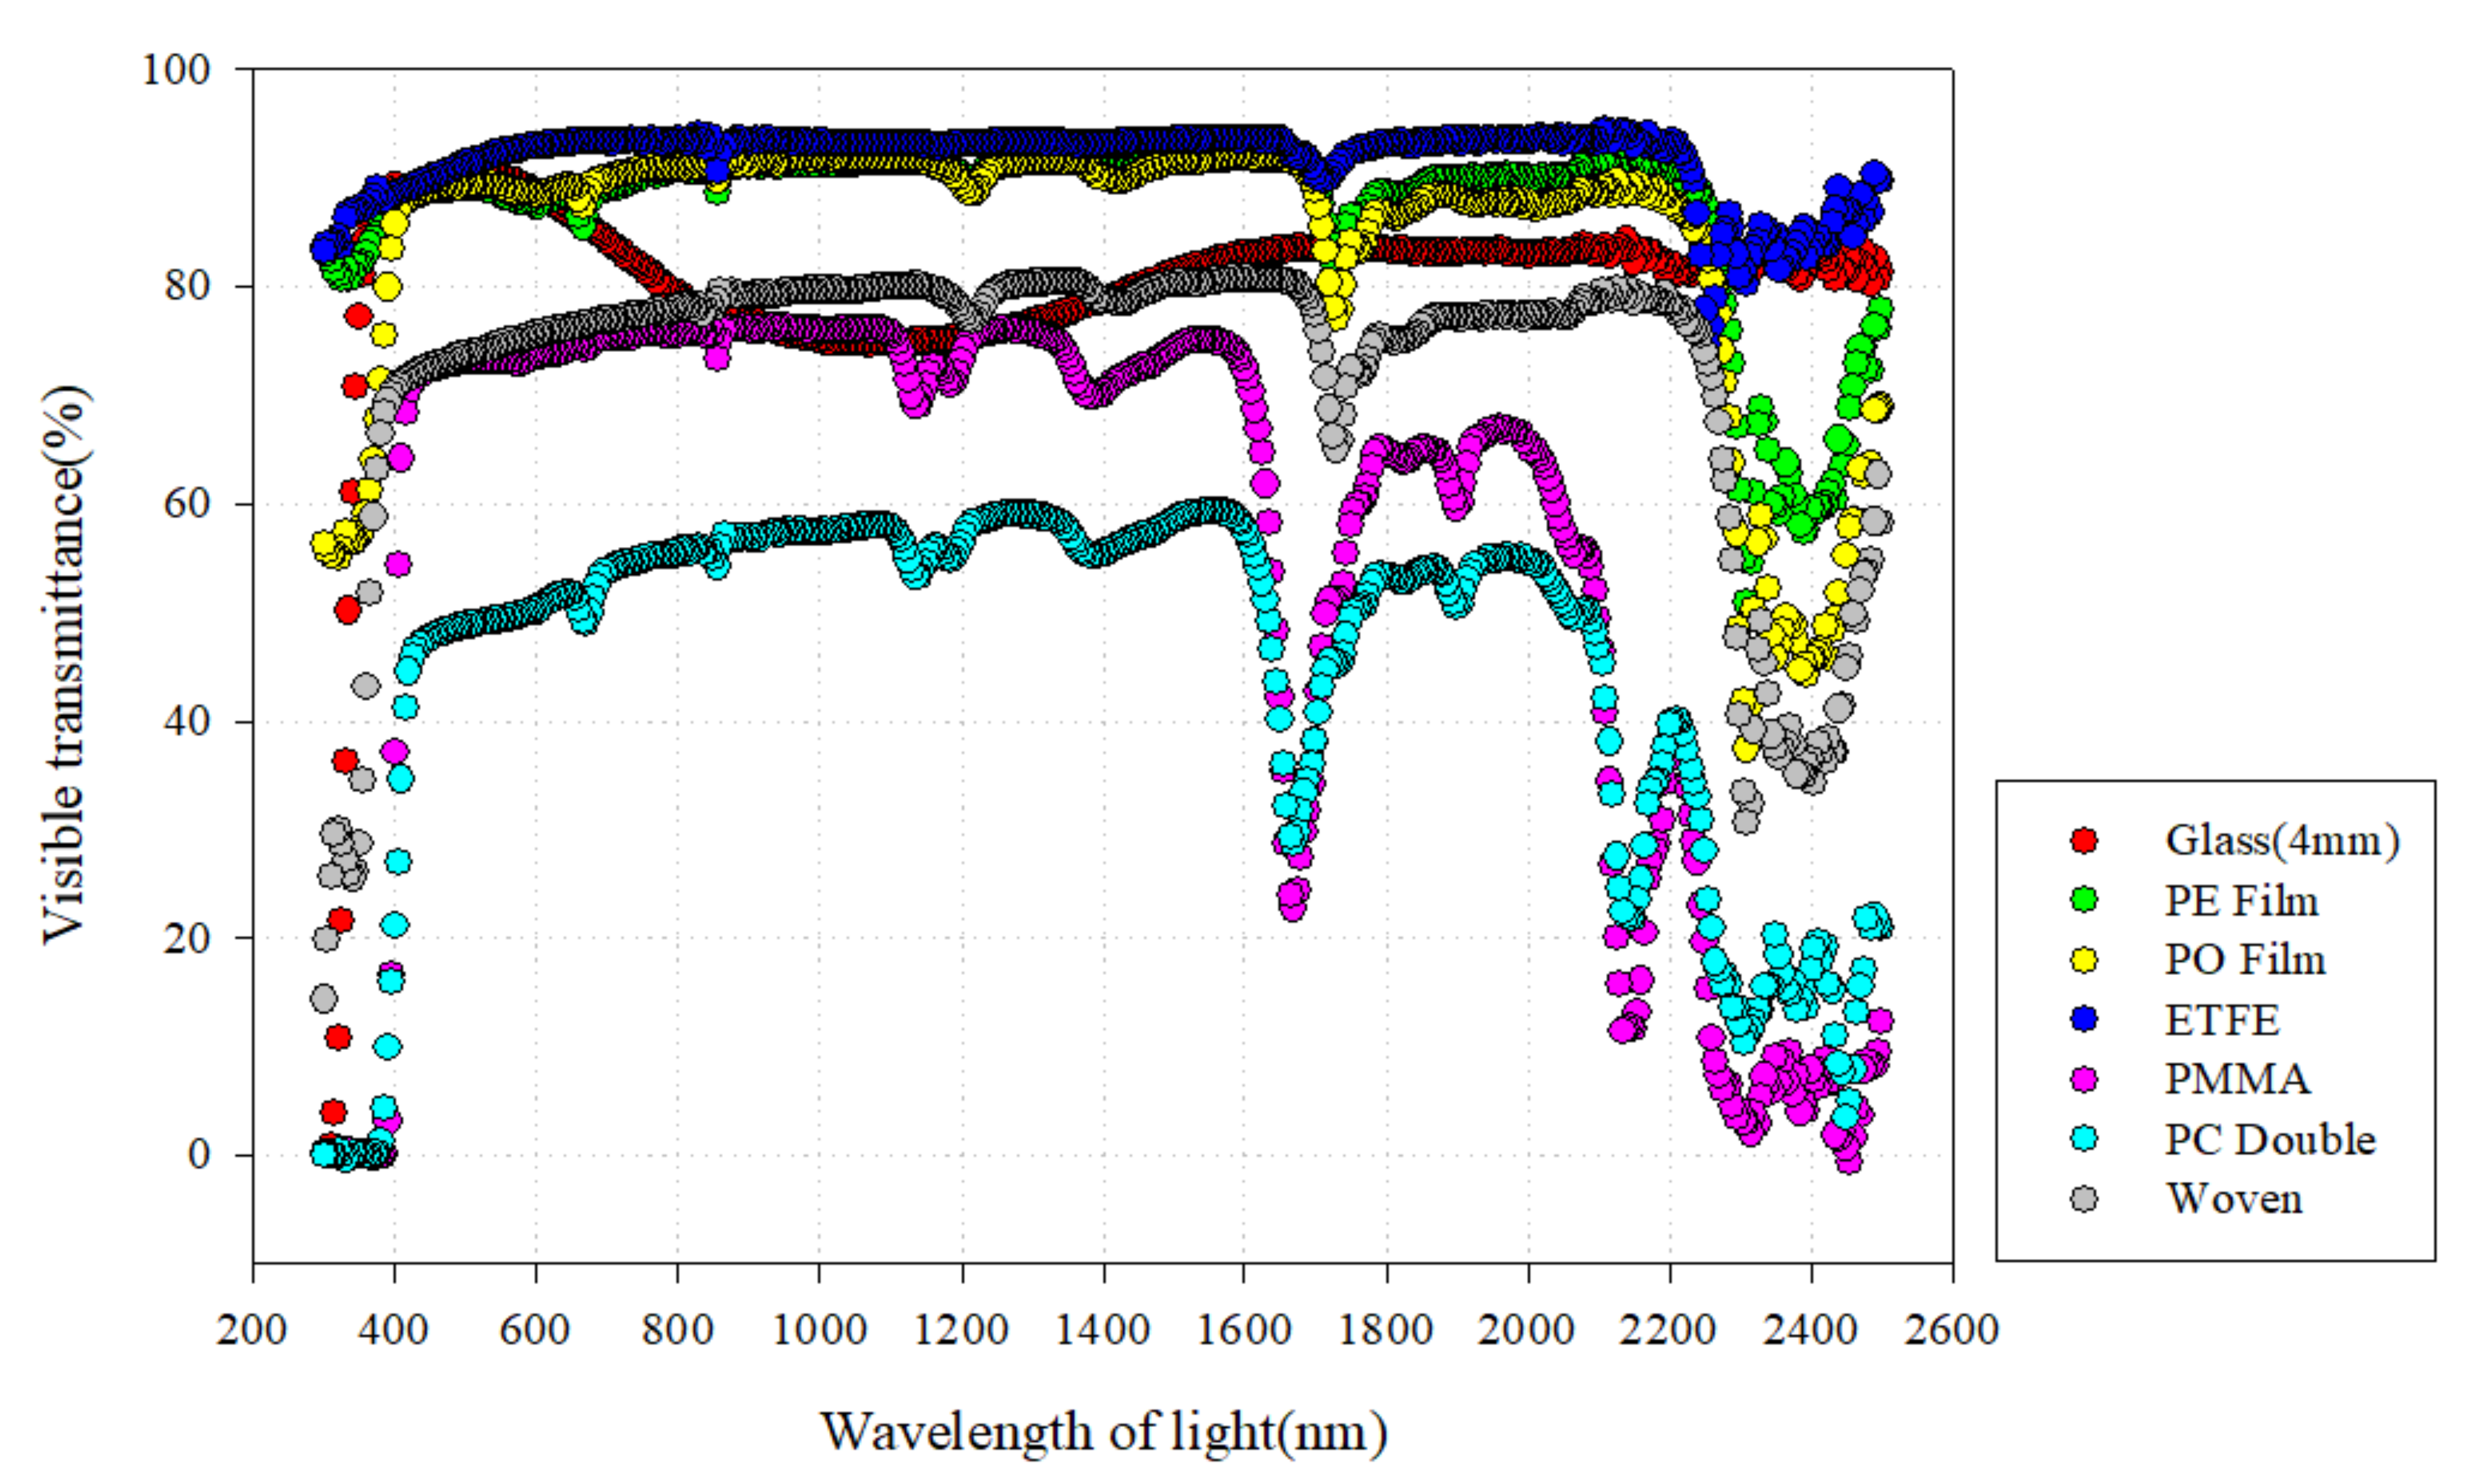
4.1. Result of Transmittance and Reflectivity Test Obtained by Covering Material

The results of the visible transmittance, visible reflectivity, solar radiation transmittance, solar radiation reflectivity and thickness tests are shown in Table 7 to examine the daylight performance of seven samples, and triplicate tests of visible transmittance and visible reflectivity were conducted for wavelengths of light ranging from 300 nm to 2500 nm; the values are presented in Figure 12 and Figure 13, respectively.
First, in the case of glass, the maximum value of the visible transmittance was 90.33% with the wavelength of light at 510 nm, and the minimum value of the transmittance was 0.13% with the wavelength of light at 300 mm. The mean value of transmittance was 80.33%, and the variance was 102.30. The maximum value of the visible reflectivity was 9.14% with the wavelength of light at 860 nm, and the minimum value of the reflectivity was 3.57% with the wavelength of light at 2485 mm. The mean value of the reflectivity was 87.4%, and the variance was 0.85.
For the PE film, the maximum value of the transmittance was 91.87% with the wavelength of light at 1600 nm, and the minimum value of the transmittance was 50.89% with the wavelength of light at 2310 mm. The mean value of the transmittance was 87.13%, and the variance was 66.55. The maximum value of the visible reflectivity was 12.31% with the wavelength of light at 2500 nm, and the minimum value of the reflectivity was 1.61% with the wavelength of light at 2450 mm. The mean value of reflectivity was 7.86%, and the variance was 2.43.
In the case of the PO film, the maximum value of transmittance was 92.05% with the wavelength of light at 1605 nm, and the minimum value of transmittance was 37.37% with the wavelength of light at 2310 mm. The mean value of transmittance was 84.44%, and the variance was 161.26. The maximum value of the visible reflectivity was 11.21% with the wavelength of light at 420 nm, and the minimum value of reflectivity was 1.41% with the wavelength of light at 2450 mm. The mean value of reflectivity was 7.63%, and the variance was 2.11.
In the case of the ETFE film, the maximum value of the transmittance was 94.44% with the wavelength of light at 2110 nm, and the minimum value of transmittance was 74.54% with the wavelength of light at 2255 mm. The mean value of transmittance was 91.58%, and the variance was 11.43. The maximum value of visible reflectivity was 12.05% with the wavelength of light at 340 nm, and the minimum value of reflectivity was −0.01% with the wavelength of light at 2480 mm. The mean value of the reflectivity was 6.10%, and the variance was 2.92.
In the case of PMMA, the maximum value of the transmittance was 76.31% with the wavelength of light at 940 nm, and the minimum value of the transmittance was −0.13% with the wavelength of light at 940 nm. The mean value of the transmittance was 55.85%, and the variance was 698.56. The maximum value of the visible reflectivity was 43.54% with the wavelength of light at 850 nm, and the minimum value of the reflectivity was 3.81% with the wavelength of light at 370 mm. The mean value of reflectivity was 19.36%, and the variance was 58.80.
In the case of the PC double layer, the maximum value of the transmittance was 59.25% with the wavelength of light at 1550 nm, and the minimum value of transmittance was −0.32% with the wavelength of light at 330 nm. The mean value of the transmittance was 45.05%, and the variance was 282.42. The maximum value of the visible reflectivity was 38.05% with the wavelength of light at 400 nm, and the minimum value of reflectivity was 3.48% with the wavelength of light at 2450 mm. The mean value of the reflectivity was 18.74%, and the variance was 55.75.
In the case of woven film, the maximum value of the transmittance was 80.74% with the wavelength of light at 1600 nm, and the minimum value of the transmittance was 14.32% with the wavelength of light at 300 nm. The mean value of the transmittance was 72.12%, and the variance was 186.26. The maximum value of the visible reflectivity was 29.25% with the wavelength of light at 400 nm, and the minimum value of reflectivity was 6.16% with the wavelength of light at 2410 mm. The mean value of the reflectivity was 17.91%, and the variance was 23.76.

4.2. Result of Coefficient of Heat Transmission Test by Covering Material

Table 8 lists the three time measurements of coefficient of heat transmission, which are used to determine the heat performance of the seven samples. It can be seen that the coefficient of heat transmission of PMMA is the highest at 6.03 ( W / m 2 · K ), and that of the PC double layer is the lowest at 3.70 ( W / m 2 · K ). Simulations of the cooling load and daylight distribution were performed using the above daylight performance test results and thermal performance test data.

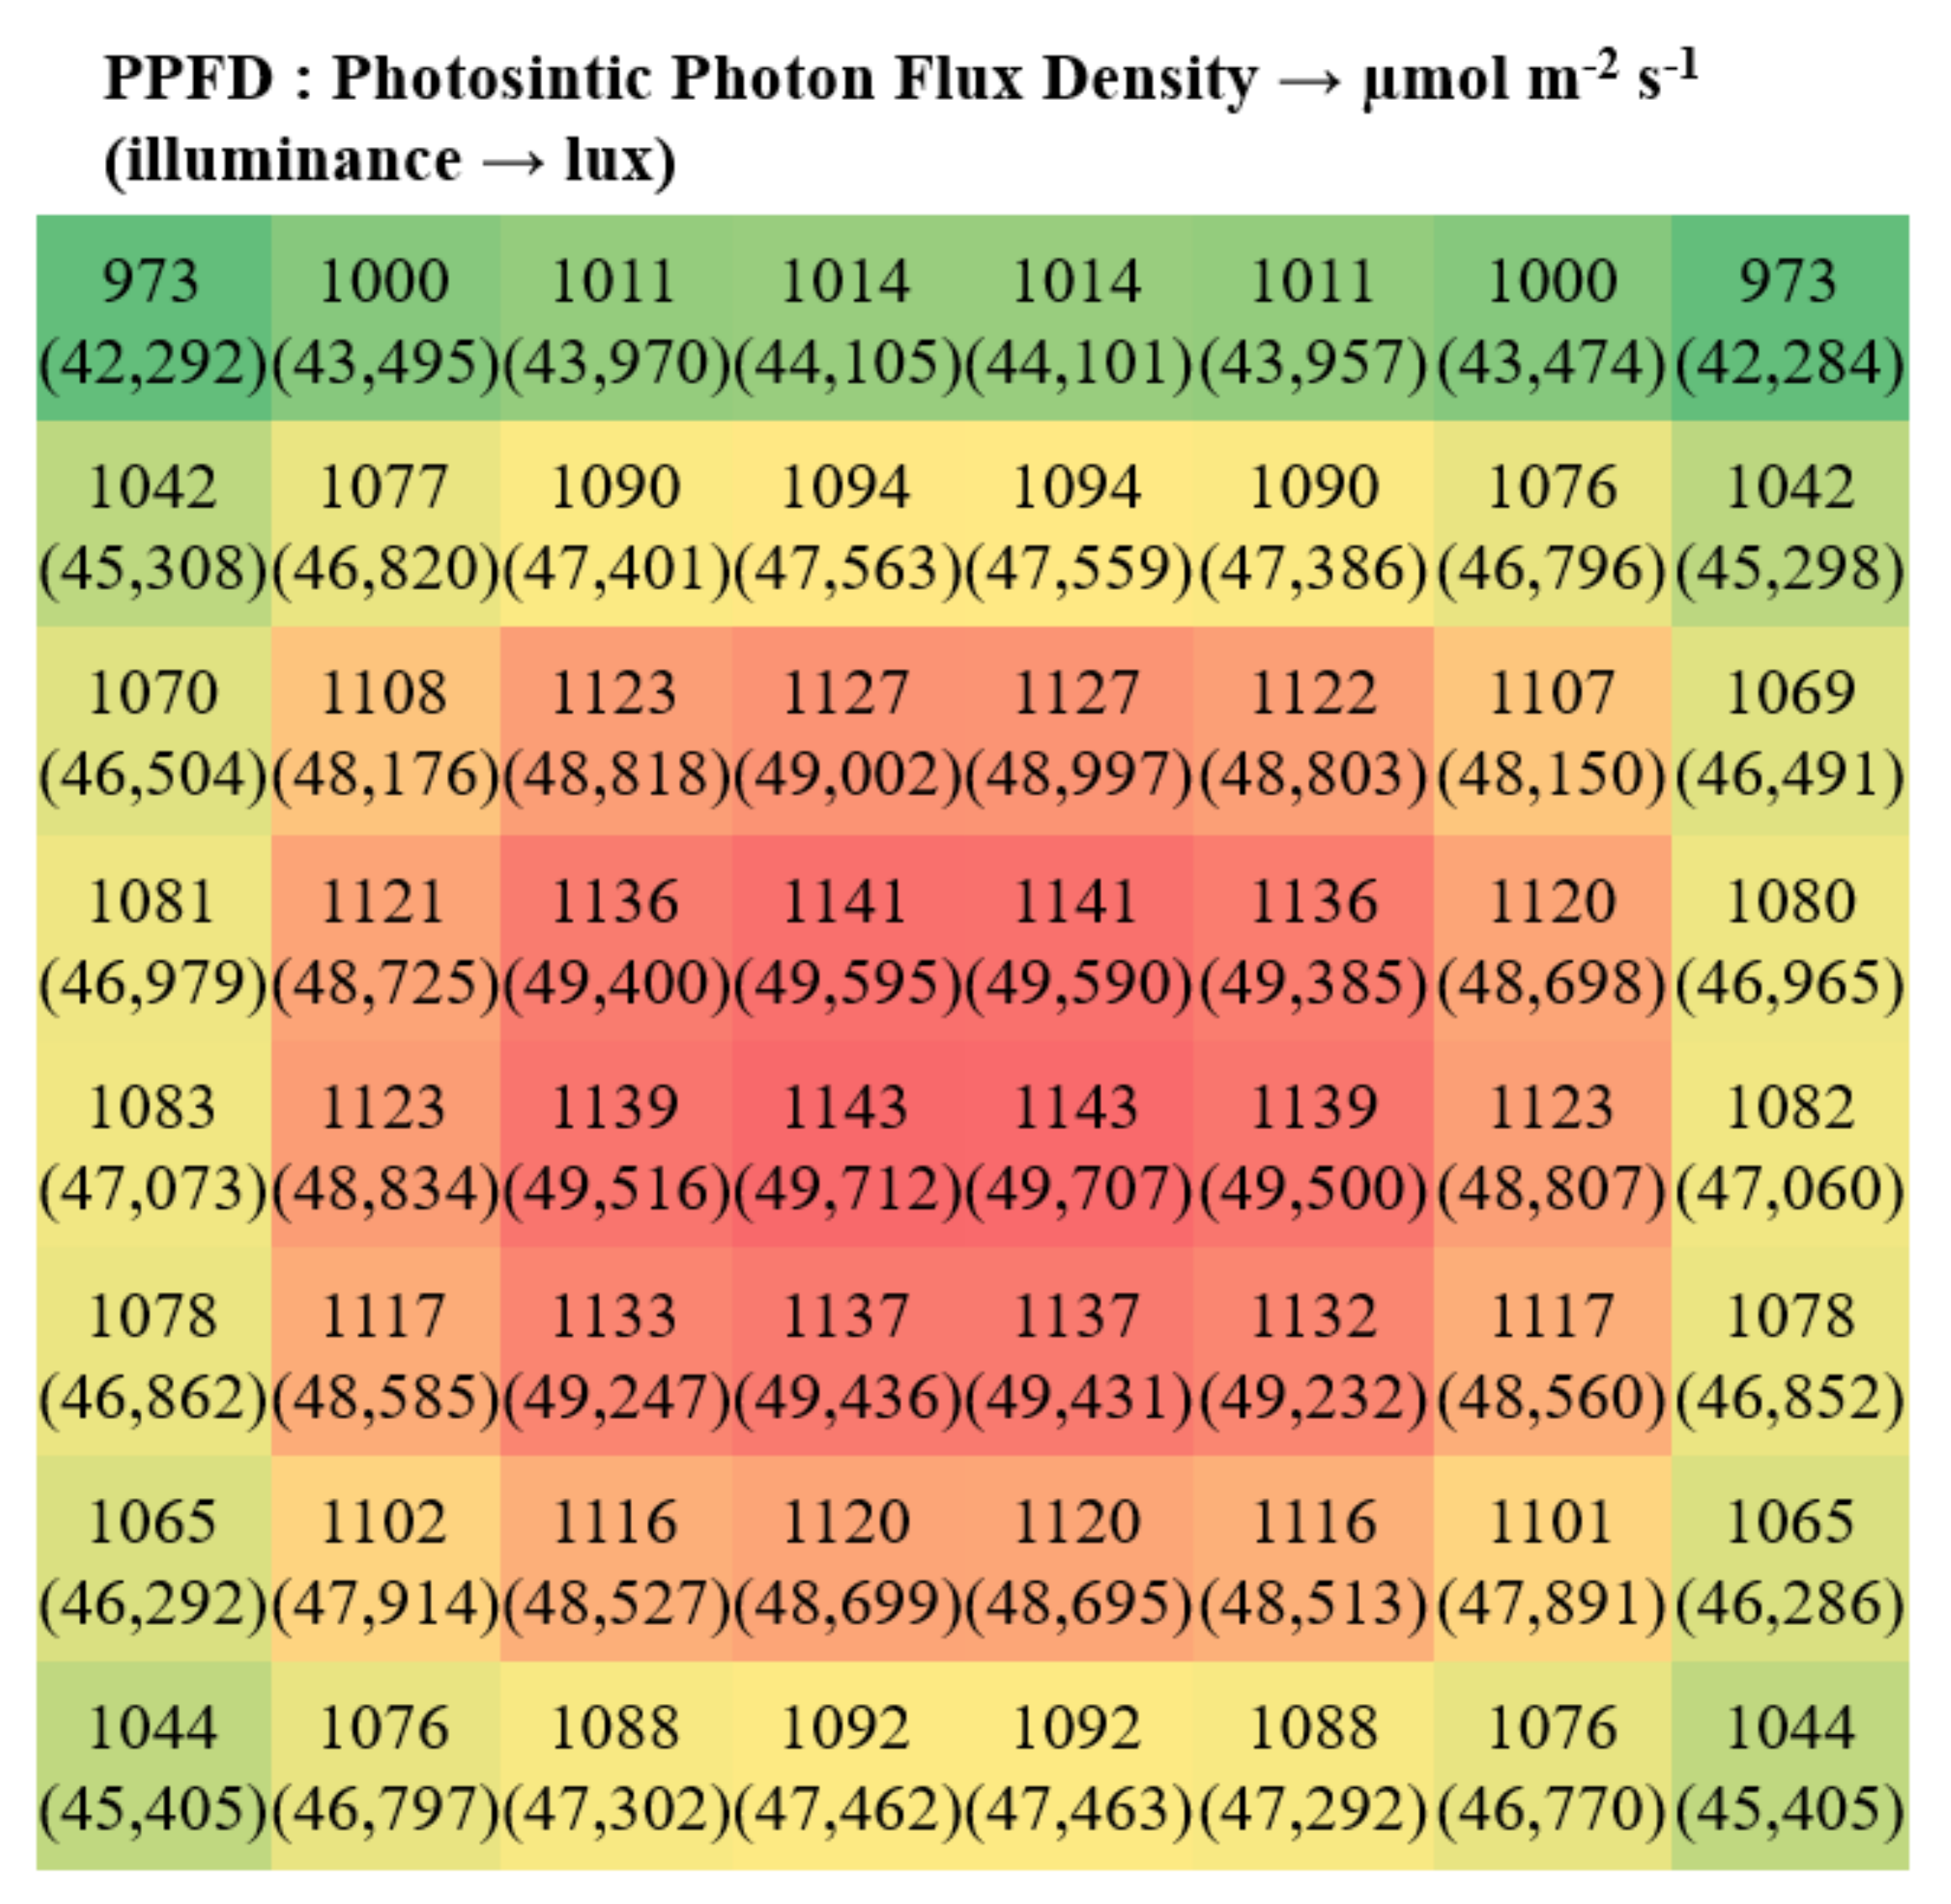
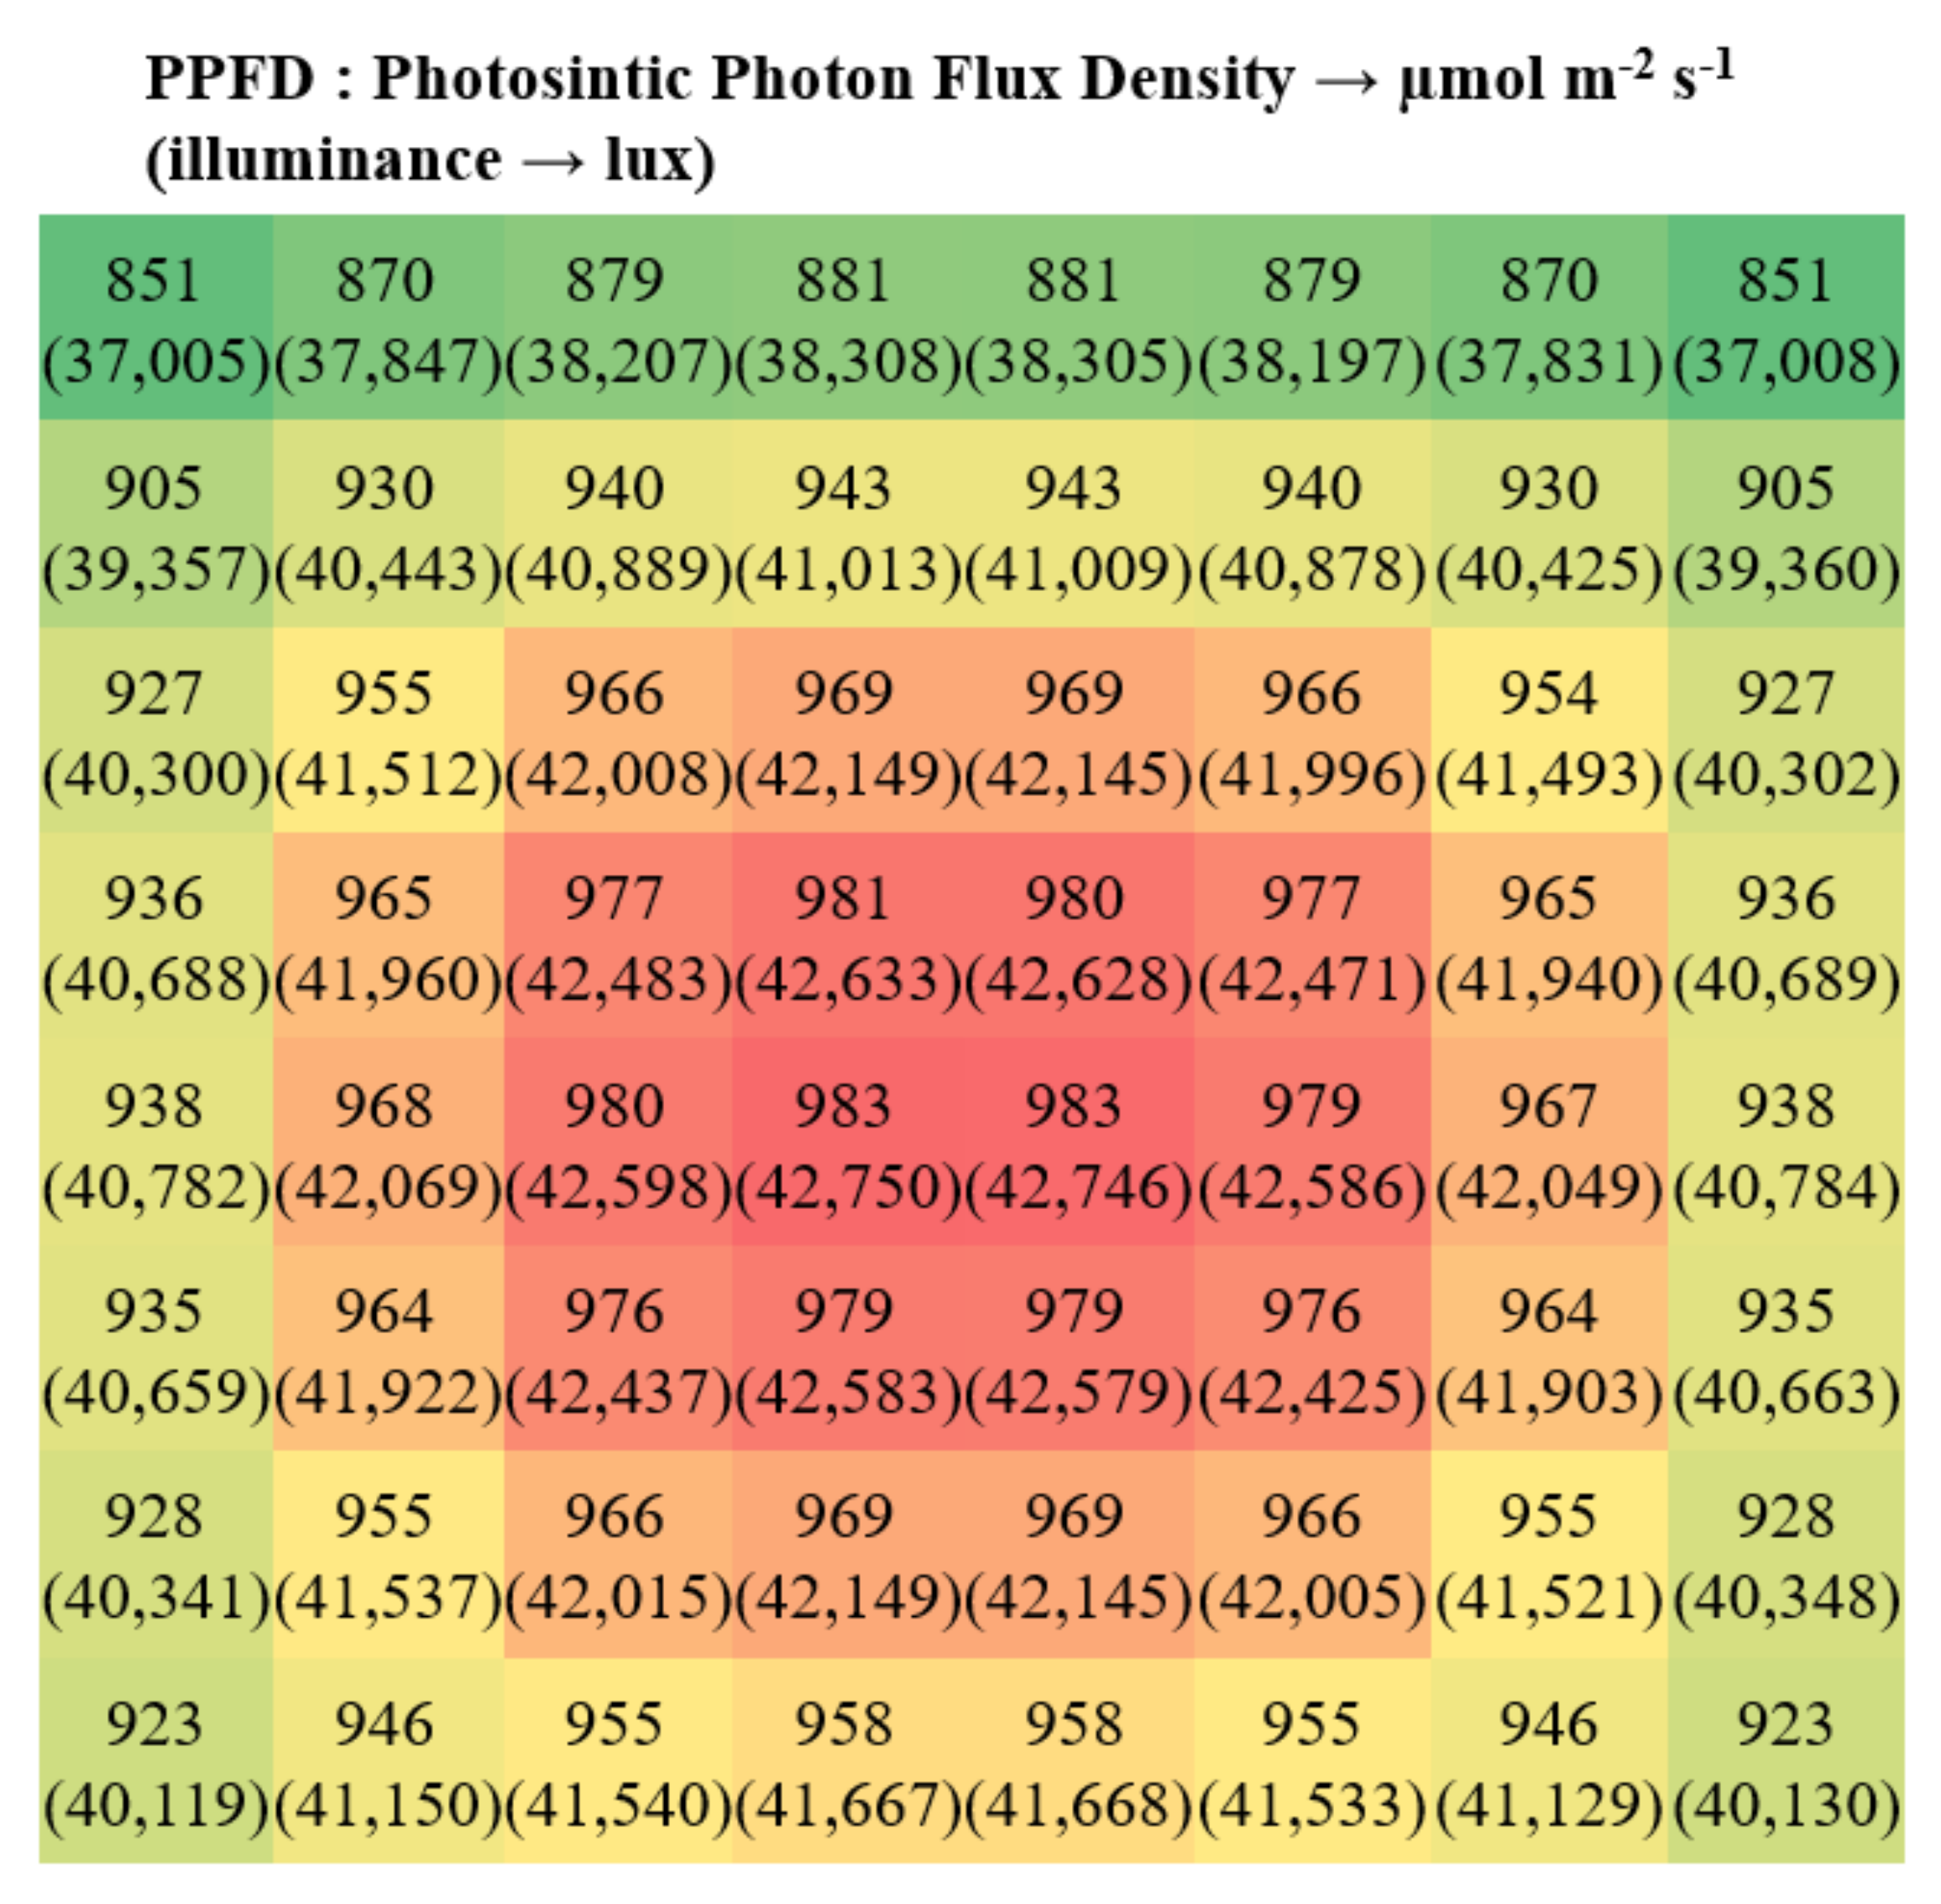
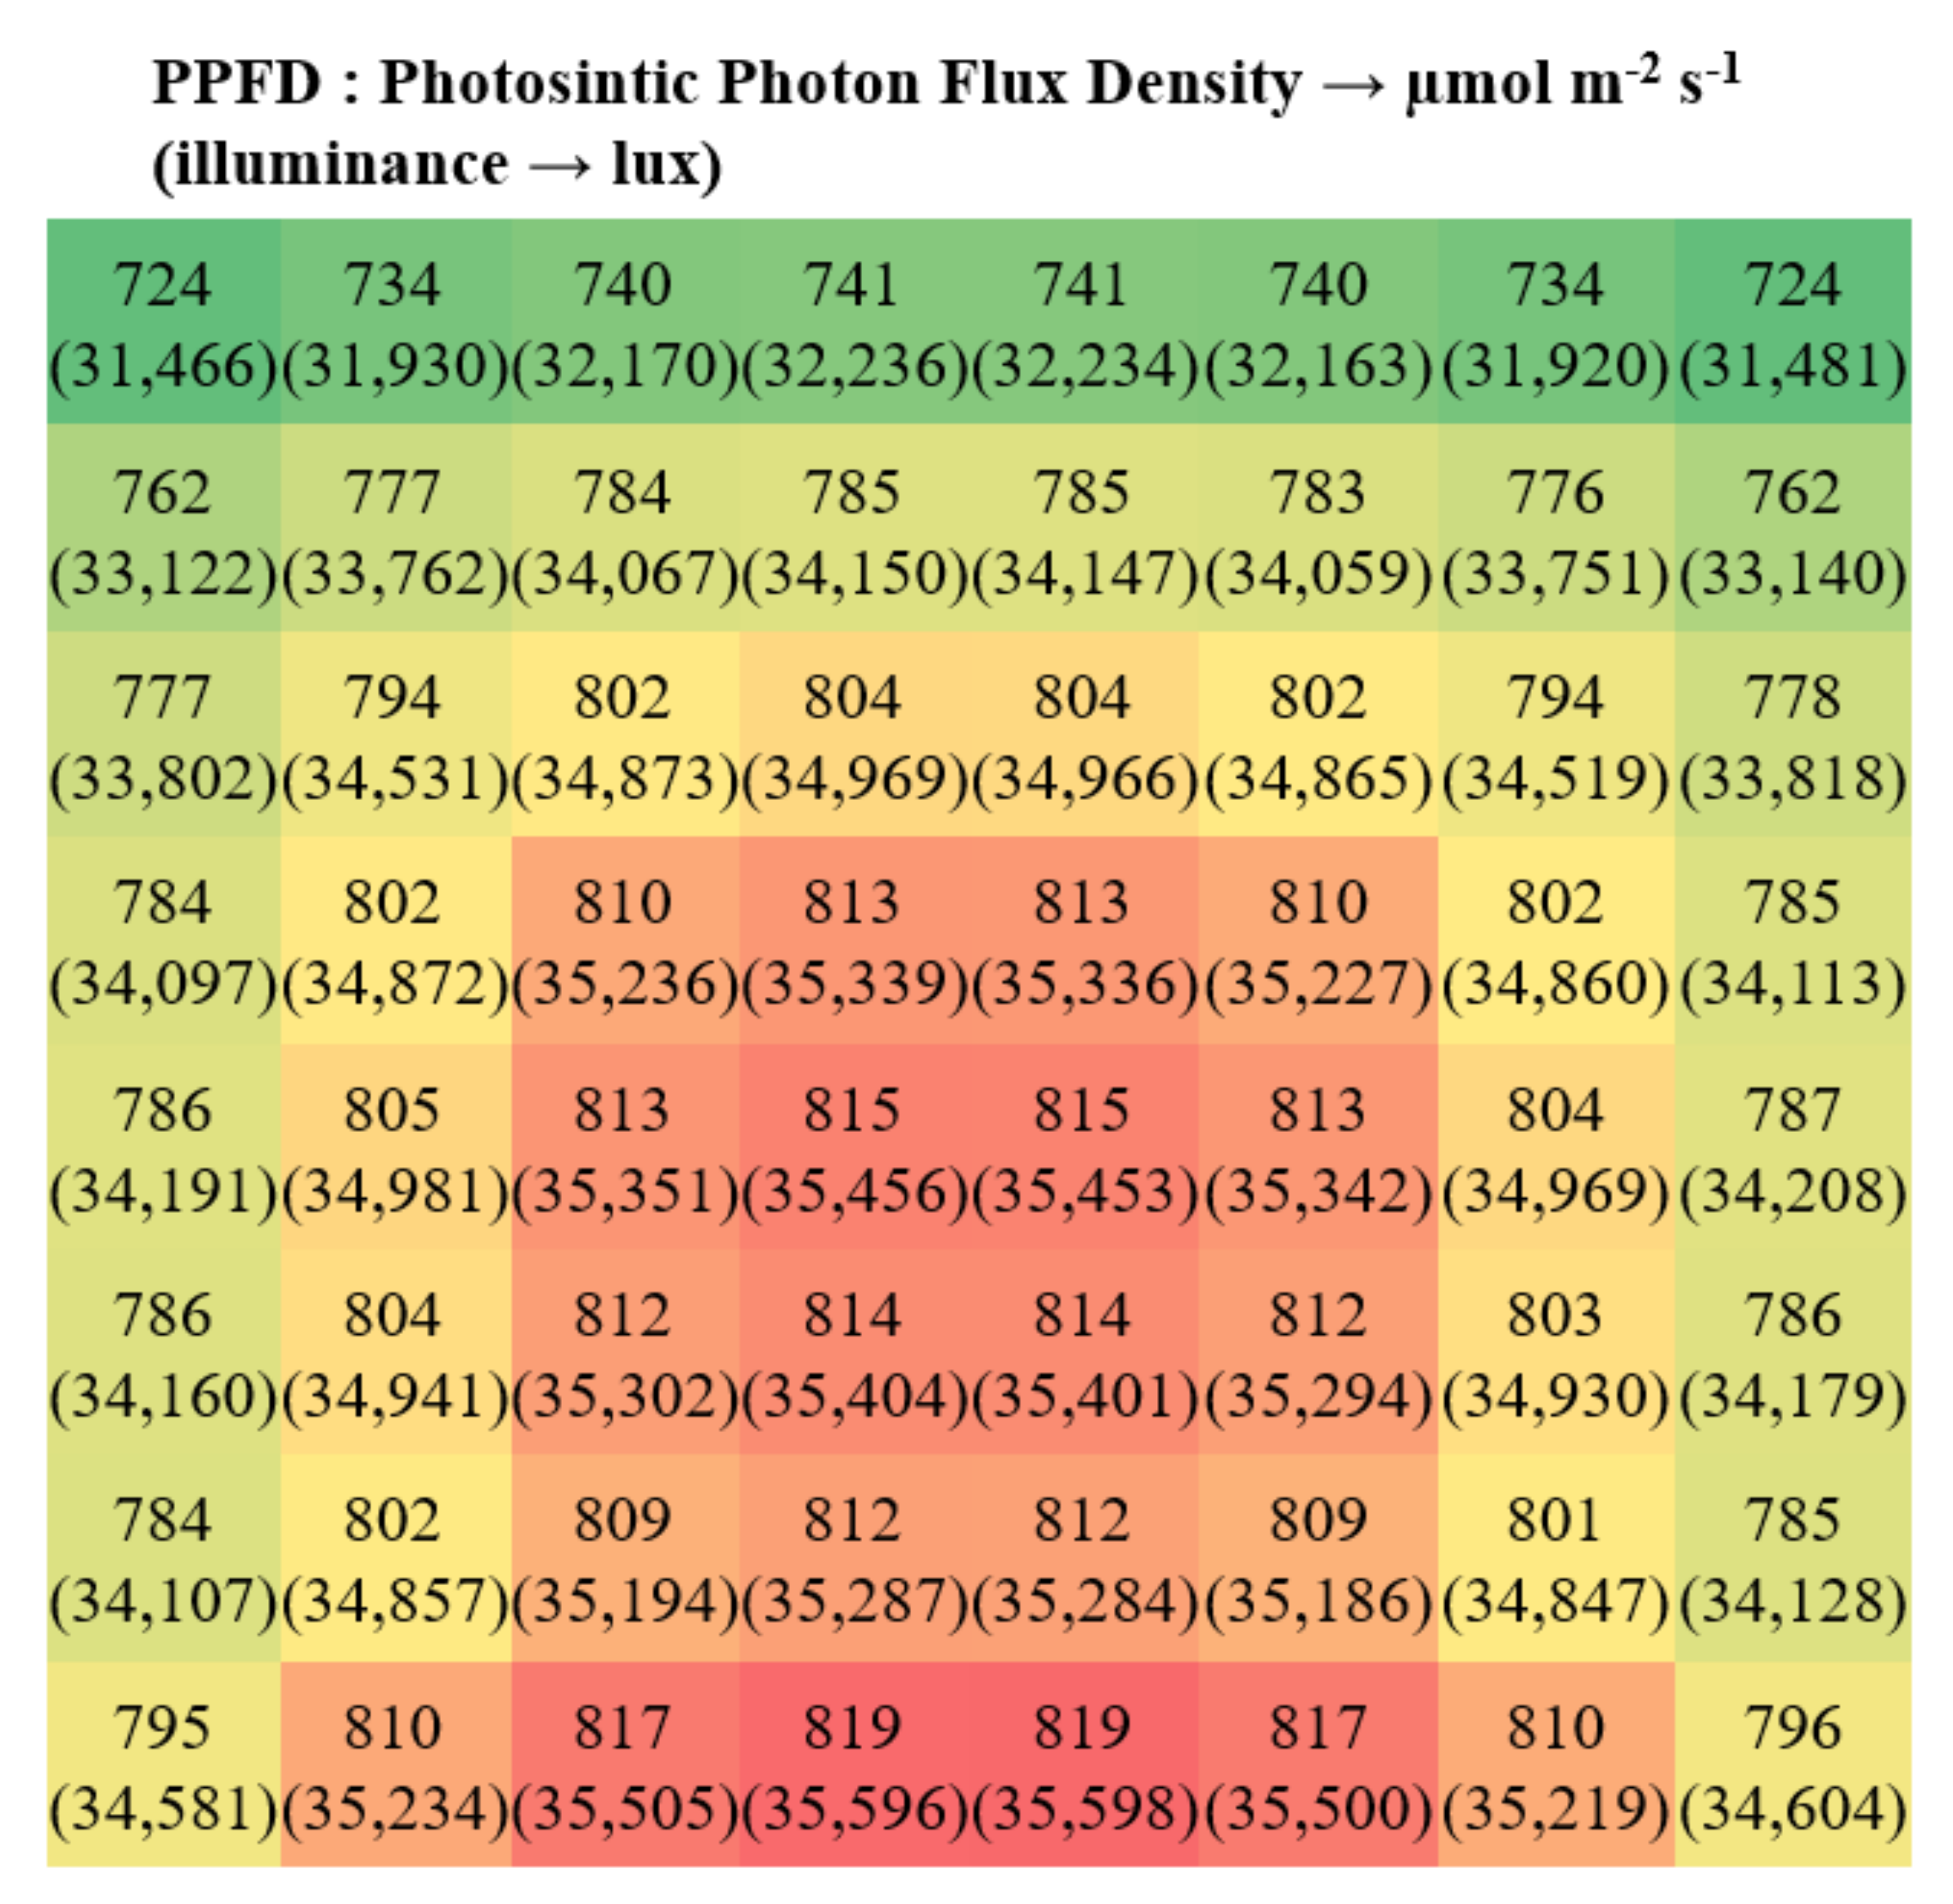
4.3. Result of Daylight Characteristics Simulation for Covering Material

The analysis of daylight simulation was conducted to examine the changes in the indoor illuminance with the visible transmittance for each covering material and shading rate based on the test results. The locations of 64 illuminance sensors were arranged 75 cm from the floor considering the height of the crop and the cultivation room. The results of daylight characteristics simulations according to the shading rate of the PE film, which is the most commonly used covering material, are shown in Figure 14, Figure 15 and Figure 16. Figure 14 shows the indoor PPFD (photosynthetic photon flux density) [25] and illuminance results for 64 sensors on a plane with the shading rate at 40% at noon on June 21, and the evaluated indoor PPFD and illuminance values were a minimum of 973 µmol m−2 s−1 (42,284 lux), a maximum of 1143 µmol m−2 s−1 (49,712 lux), and a mean value of 1089 µmol m−2 s−1 (47,363 lux). Because the target intensity of light for strawberries is 10,000–40,000 lux and the light saturation point is 40,000–45,000 lux, it is determined from the results that it is necessary to further increase the shading rate. Figure 15 shows the indoor PPFD (photosynthetic photon flux density) and illuminance results of 64 sensors on a plane with the shading rate at 50% at noon on June 21. Figure 16 shows the indoor PPFD and illuminance results of 64 sensors on a plane with the shading rate at 60% at noon on June 21, and the evaluated indoor PPFD and illuminance values were a minimum of 724 µmol m−2 s−1 (31,466 lux), a maximum of 819 µmol m−2 s−1 (35,598 lux), and a mean value of 791 µmol m−2 s−1 (34,399 lux).
As the results satisfy the target intensity of light condition and also do not reach the light saturation point, it is determined that it is appropriate to apply the control strategy of Case 2–3 with a shading rate of 60%, which reduces the cooling load while satisfying the intensity of light.
Figure 17 shows the distribution of indoor illuminance by the covering material at noon on June 21. It indicates the indoor illuminance with a shading rate at 60%. Based on the time between 6 am and 8 pm, which are the hours during which daylight enters the indoor space, the average values of the indoor illuminance were 19,879 lux, 20,012 lux, 19,393 lux, 19,555 lux, 16,560 lux, 16,228 lux, and 11,173 lux for glass, PE film, PO film, ETFE, woven film, PMMA, and PC double layer, respectively. Considering the target light intensity for strawberry growth is 10,000–40,000 lux, all of the sample covering materials had indoor illuminance levels that exceeded the lower limit range of the target light intensity.
The results indicate that the selection of a covering material that satisfies the upper limit of the target intensity of the maximum possible light range while not exceeding the light saturation point can be considered an important factor in greenhouse design.

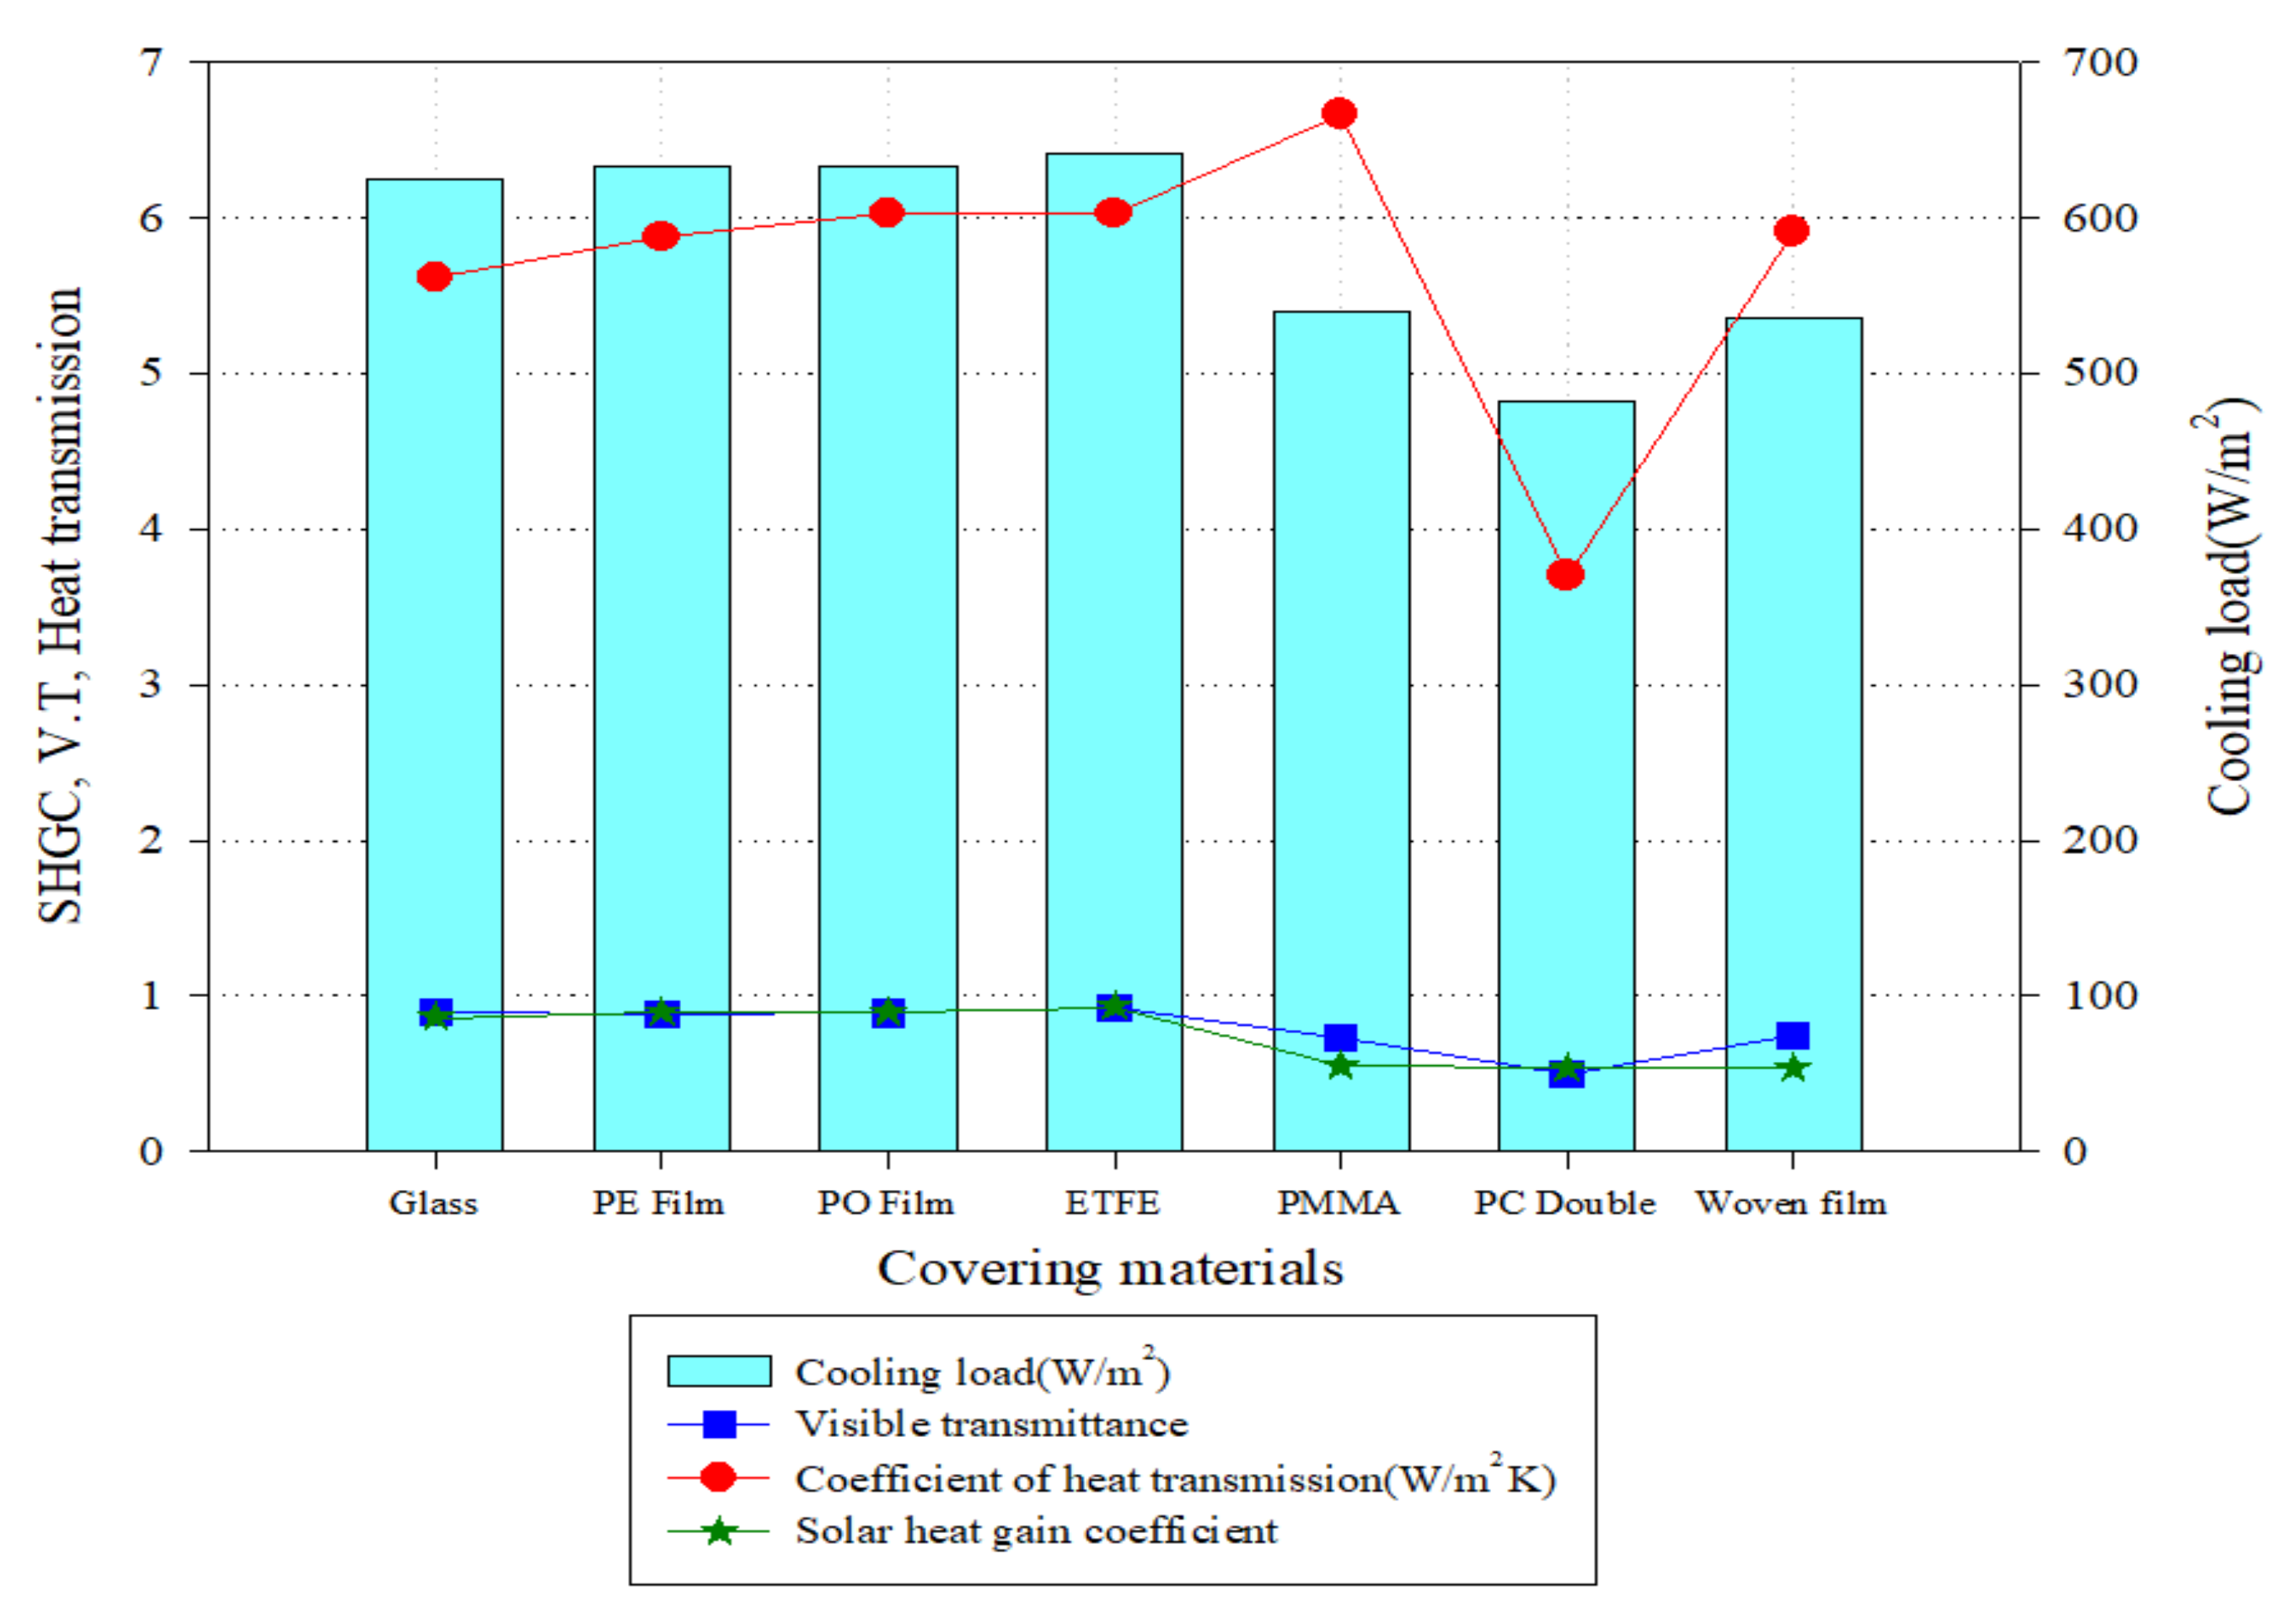
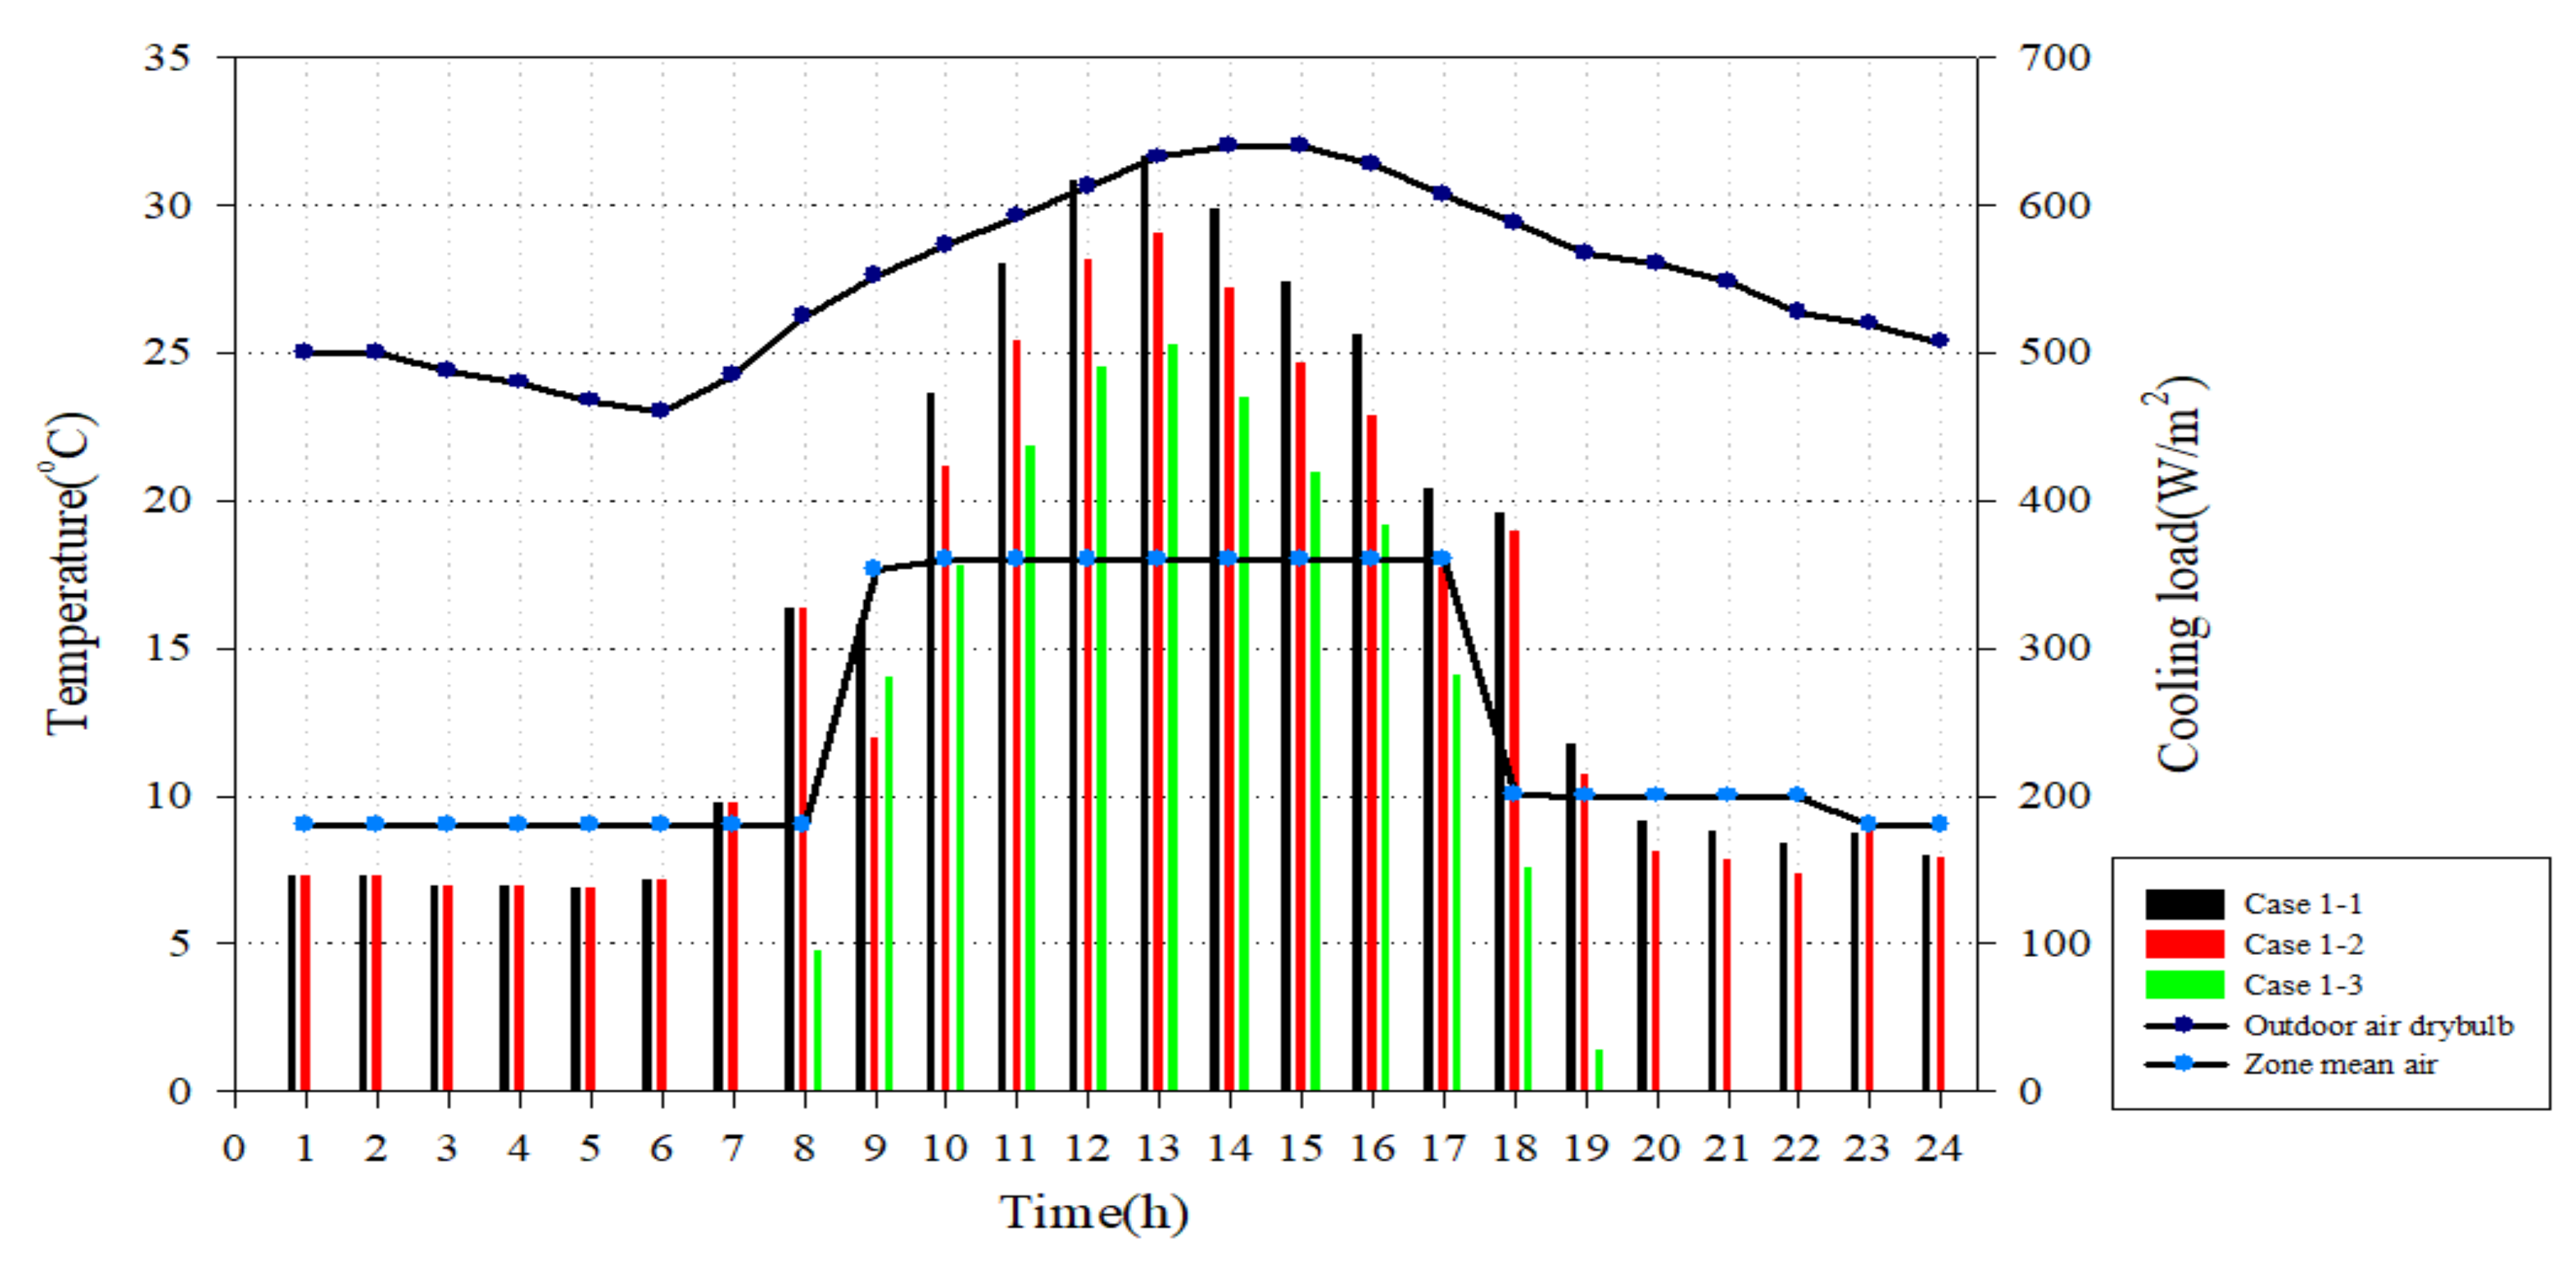
4.4. Result of Cooling Load Simulation by Covering Material

Figure 18 shows a combined presentation of the cooling load, solar heat gain coefficient, visible transmittance, and coefficient of heat transmission by the covering material. For the results of cooling load analysis, the PC double layer had the lowest cooling load at 482.8 W/m2, and the PO film had the highest cooling load at 633.8 W/m2. The coefficient of heat transmission was in the range of 3.7–6.7 W/m2∙K, the solar heat gain coefficient ranged from 54% to 93%, and the visible transmittance was within the range of 50–92%, depending on the covering material. The difference between the cooling loads of the PC double layer and PO film is 151 W/m2, which is equivalent to 23.8%, indicating that the selection of the covering material has a significant impact on the cooling load. The cooling load generally had a pattern similar to that of the coefficient of heat transmission and solar heat gain coefficient, which are the key influencing factors. However, for PMMA, it was determined that the cooling load was low because it had a higher coefficient of heat transmission than other materials, but its solar heat gain coefficient was relatively low. Another reason for the difference is that the solar heat gain coefficient has a significant impact on the cooling load.
The changes in the cooling load according to the cooling set temperature control (Case 1-1–Case 1-3) are depicted in Figure 19. In Case 1-1, the temperature was set to 18 °C, which is the optimal growth temperature, and for the nighttime, it was set to 10 °C for 17:00–22:00 and 9 °C for 22:00–08:00. In Case 1-2, the temperature was set to 23 °C, which is the optimal growth temperature, and for the nighttime, it was 12 °C for 17:00–22:00 and 9 °C for 22:00–08:00. In Case 1-3, the temperature was set to a maximum of 30 °C for 24 h. The maximum outdoor air dry bulb temperature was 32 °C, and for the zone’s mean air temperature, Case 1-1 is represented on the graph, and the analysis results show that the temperature setting conditions of daytime and nighttime were both satisfied.
By setting Case 1-1 as the reference, when the cooling set temperature was controlled from Case 1-1 to Case 1-2, the cooling load was decreased by 10.7% on average. In addition, when the cooling set temperature changed from Case 1-1 to Case 1-3, the cooling load was decreased by 26.1% on average. For cooling set temperature control, maintaining the temperature around the lower temperature range from the optimal growth temperature of the plants increases the yield, but it also incurs increased cooling load and cost. Considering the cost aspect only, maintaining the cooling temperature for 24 h at 30 °C, the upper limit of the optimal growth temperature, would be advantageous, but this will lead to a deterioration in quality and a reduced yield. Therefore, as follow-up studies for further investigations into the findings of this research, there is the need for an evaluation of the yield and quality with respect to the range of cooling set temperatures.
Figure 20 shows the variations in cooling load according to the internal shading rate control (Case 2-1–Case 2-4). Case 2-1 is the case without internal shading, Case 2-2 had an internal shading rate of 40%, Case 2-3 an internal shading rate of 50%, and Case 2-4 had an internal shading rate of 60%. With reference to Case 2-1, which involved a greenhouse without internal shading, when the internal shading rate was increased to 40% (Case 2-2), the cooling load was decreased by 27.4% on average. When the internal shading rate was increased to 50% (Case 2-3) with reference to Case 2-1, the cooling load was decreased by 29.3% on average. In addition, as the internal shading rate increased to 60% (Case 2-4) relative to Case 2-1, the cooling load was decreased by 31.5% on average. However, in the case of a real-life greenhouse, the actual shading rate will be set around 5–10% higher than 60%, because of structural characteristics and the discoloration due to sand and dust storms as well as changes over time, and further increases in the shading rate require careful consideration.

5. Conclusions

In this study, data on solar reflectance, transmittance and visible reflectance, transmittance, and solar heat gain coefficient were presented through tests. These were used in calculating the maximum load of the cooling facility of the greenhouse. FIR and weather resistance data related to the greenhouse effect on cladding and the load by period will also be tested through further research. The equipment used in the research was an FT-IR (Fourier transform infrared) spectrometer, which allows the measurement of surface radiation and the solar heat gain coefficient of the covering materials (single and composite), and a solar simulator. To obtain improved accuracy in the simulation results, the transmittance, reflectivity, coefficient of heat transmission and thickness, etc., which are the key influencing factors, were measured according to the test methods in Korean Industrial Standards (KS) to derive input data for each covering material.
Furthermore, based on the derived optical and thermal input data for each covering material, the cooling load and daylight characteristics of smart farms were simulated to present basic reference information for selecting covering materials in the design of greenhouses. The results of the simulation are outlined as follows.
First, in the case of glass, the mean visible transmittance was 80.33%, and the mean visible reflectivity was 87.4%. In the case of PE film, the mean visible transmittance was 87.13%, and the mean visible reflectivity was 7.86%. In the case of PO film, the mean visible transmittance was 84.44%, and the mean visible reflectivity was 7.63%. In the case of ETFE film, the mean visible transmittance was 91.58%, and the mean visible reflectivity was 6.10%. In the case of PMMA, the mean visible transmittance was 55.85%, and the mean visible reflectivity was 19.36%. In the case of the PC double layer, the mean visible transmittance was 45.05%, and the mean visible reflectivity was 18.74%. In the case of woven film, the mean visible transmittance was 72.12%, and the mean visible reflectivity was 17.91%.
Based on the time between 6 am and 8 pm, which are the hours during which daylight enters the indoor space, the average values of indoor illuminance were 19,879 lux, 20,012 lux, 19,393 lux, 19,555 lux, 16,560 lux, 16,228 lux, and 11,173 lux for glass, PE film, PO film, ETFE, woven film, PMMA, and the PC double layer, respectively.
Considering the target light intensity for strawberry growth is 10,000–40,000 lux, all of the sample covering materials showed an indoor illuminance level above the lower limit range of the target light intensity.
The results indicate that in the design of greenhouses, it is important to select a covering material that adheres to the upper limit of the target intensity of light range, while not exceeding the light saturation point.
As regards the cooling load analysis, the PC double layer had the lowest cooling load at 482.8 W/m2 and the PO film had the highest cooling load at 633.8 W/m2. The coefficient of heat transmission was in the range of 3.7 W/m2∙K to 6.7 W/m2∙K, the solar heat gain coefficient ranged between 54% and 93%, and the visible transmittance was in the range of 50% to 92% depending on the covering material. The difference in the cooling load between the PC double layer and PO film was 151 W/m2, which corresponds to 23.8%, thus indicating that the selection of covering material plays a pivotal role in the determination of the cooling load. The cooling load showed a pattern that is generally similar to that of the coefficient of heat transmission and the solar heat gain coefficient, which are key influencing factors. However, for PMMA, it was determined that the cooling load was low because it had a higher coefficient of heat transmission than other materials, but its solar heat gain coefficient was relatively low. Another reason for the difference is that the solar heat gain coefficient has a critical impact on the cooling load.
When the cooling set temperature was controlled from Case 1-1 to Case 1-2, the cooling load was decreased by 10.7% on average. In addition, when the cooling set temperature changed from Case 1-1 to Case 1-2, the cooling load was decreased by 26.1% on average. To achieve cooling set temperature control, maintaining the temperature around the lower end of the range for the optimal growth of the plants increases the yield, but it also incurs an increased cooling load and cost. When only the cost aspect is taken into account, maintaining the cooling temperature for 24 h at 30 °C, which is the upper limit of the optimal growth temperature, would be advantageous, but it will lead to a degradation of quality and reductions in yield. Therefore, in line with the findings of this study and for a more in-depth investigation, an evaluation of the yield and quality with respect to the range of cooling set temperatures is needed in follow-up studies.
When the internal shading rate was increased to 40% (Case 2-2) with reference to Case 2-1—the greenhouse without internal shading—the cooling load was decreased by 27.4% on average. When the internal shading rate was increased to 50% (Case 2-3) with reference to Case 2-1, the cooling load was decreased by 29.3% on average. In addition, as the internal shading rate increased to 60% (Case 2-4) relative to Case 2-1, the cooling load decreased by 31.5% on average.

Author Contributions

Conceptualization, D.-Y.P., H.-J.L.; methodology, D.-Y.P., S.-I.Y.; formal analysis, D.-Y.P., H.-J.L.; data curation, D.-Y.P., H.-J.L., S.-I.Y.; writing—original draft preparation, D.-Y.P., S.-I.Y., S.-M.C.; writing—review and editing, D.-Y.P., S.-M.C.; supervision, D.-Y.P., S.-M.C. All authors have read and agreed to the published version of the manuscript.

Funding

This work was supported by the Korean Institute of Planning and Evaluation for Technology in Food, Agriculture and Forestry (IPET) through the Smart Plant Farming Industry Technology Development Program, funded by Ministry of Agriculture, Food and Rural Affairs (MAFRA) (grant number: 320087-1).

Institutional Review Board Statement

Not applicable.

Informed Consent Statement

Not applicable.

Data Availability Statement

The data presented in this study are available on request from the corresponding author. The data are not publicly available due to the supporting project involving a confidentiality agreement.

Conflicts of Interest

The authors declare no conflict of interest.

References

  1. Korea Technology & Information Promotion Agency for SMEs (TIPA). Technology Roadmap for SME 2019–2021; Korea Technology & Information Promotion Agency for SMEs (TIPA): Seoul, Korea, 2019. [Google Scholar]
  2. Kim, Y.J.; Park, J.Y.; Park, Y.G. An Analysis of the Current Status and Success Factors of Smart Farms; Korea Rural Economic Research Institute: Naju-si, Korea, 2016. [Google Scholar]
  3. Korea Rural Development Administration. A Casebook of Heat Loss Diagnosis in Agricultural Facilities; Korea National Institute of Agricultural Sciences: Wanju-gun, Korea, 2009.
  4. Korea Rural Development Administration. Guidelines for Smart Greenhouse Environment Management; Korea National Institute of Agricultural Sciences: Wanju-gun, Korea, 2018.
  5. Korea Ministry of Agriculture. Greenhouse Status of Facility Vegetables and Vegetable Production Performance in 2018; Korea Ministry of Agriculture: Gwacheon-si, Korea, 2019.
  6. Choi, Y.H.; Lee, J.H.; Park, D.K.; Kwon, J.K.; Um, Y.C. Effect of Greenhouse Cooling Method on the Growth and Yield of the Tomato cv. Momotaro in Warm Season. J. Bio-Environ. Control. 2000, 9, 60–65. [Google Scholar]
  7. Kwon, J.K.; Jeon, J.G.; Kim, S.H.; Kim, H.G. Application Effect of Heating Energy Saving Package on Venlo Type Glasshouse of Paprika Cultivation. The Korean Society For Bio-Environment Control. Prot. Hortic. Plant Fact. 2016, 25, 225–231. [Google Scholar] [CrossRef]
  8. Kim, Y.H.; Lee, S.G. A Simulation Model for the Analysis of Direct and Diffuse Solar Radiation in Glasshouse—Effect of orientation on the transmissivity of direct solar radiation in single-span glasshouse. The Korean Society For Bio-Environment Control. J. Bio-Environ. Control. 1997, 6, 176–182. [Google Scholar]
  9. Dewanto, H.; Yate, D.; Omer, S.A. Reducing greenhouse energy consumption using novelty rooftop: A simulation. In Proceedings of the 16th International Conference on Sustainable Energy Technologies—SET 2017, Bologna, Italy, 17–20 July 2017. [Google Scholar]
  10. Xu, J.; Li, Y.; Wang, R.Z.; Liu, W.; Zhou, P. Experimental performance of evaporative cooling pad systems in greenhouses in humid subtropical climates. Appl. Energy 2015, 138, 291–301. [Google Scholar] [CrossRef]
  11. Issam, M.A.; Hind, D. Enhancement of evaporative cooling system in a greenhouse using geothermal energy. Renew. Energy 2017, 111, 321–331. [Google Scholar]
  12. Lucas, M.; Valerie, O.; Lefsrud, M.G. An experimental study of the cooling performance and airflow patterns in a model Natural Ventilation Augmented Cooling (NVAC) greenhouse. Biosyst. Eng. 2018, 174, 173–189. [Google Scholar]
  13. Jeon, J.G.; Lee, D.G.; Paek, Y.; Kim, H.G. Study on Heating Performance of Hybrid Heat Pump System Using Geothermal Source and Solar Heat for Protected Horticulture. J. Korean Sol. Energy Soc. 2015, 35, 49–56. [Google Scholar] [CrossRef] [Green Version]
  14. Korean Standard. Testing Method on Transmittance and Emittance of Heat Glasses and Evaluation of Solar Heat Gain Coefficient; KS L 2514; Korean Standard: Seoul, Korea, 2011. [Google Scholar]
  15. Korean Standard. Evaluation on Thermal Resistance of Flat Glasses and Thermal Transmittance of Glazing; KS L 2525; Korean Standard: Seoul, Korea, 2006. [Google Scholar]
  16. Korean Standard. Adhesive Films for Glazings; KS L 2016; Korean Standard: Seoul, Korea, 2014. [Google Scholar]
  17. Korean Standard. Testing Method for the Determination of Solar Heat Gain Coefficient of Fenestration Product Using Solar Simulator; KS L 9107; Korean Standard: Seoul, Korea, 2014. [Google Scholar]
  18. Korean Standard. Mineral Wool Sheathing Boards; KS L 9106; Korean Standard: Seoul, Korea, 2015. [Google Scholar]
  19. American Society of Association Executives (ASAE) STANDARDS 2003. ASAE EP460 FEB04 Commercial Greenhouse Design and Layout; American Society of Agricultural Engineers: St. Joseph, MI, USA, 2004. [Google Scholar]
  20. American Society of Association Executives (ASAE) STANDARDS 2003. ANSI/ASAE EP406.4 JAN03 Heating, Ventilation and Cooling Greenhouses; American Society of Agricultural Engineers: St. Joseph, MI, USA, 2003. [Google Scholar]
  21. Albright, L.D. Environmental Control for Animals and Plants, ASHRAE Handbook-HAVC Applications; American Society of Agricultural Engineers: St. Joseph, MI, USA, 2011. [Google Scholar]
  22. National Greenhouse Manufactures Association (NGMA). Structural Design Manual; NGMA: Harrisburg, PA, USA, 2004.
  23. Korean Standard. Float and Polished Plate Glass; KS L 2012; Korean Standard: Seoul, Korea, 2013. [Google Scholar]
  24. Climate.OneBuilding.Org. Available online: http://climate.onebuilding.org (accessed on 8 July 2021).
  25. Castellano, S.; Santamaria, P.; Serio, F. Photosynthetic photon flux density distribution inside photovoltaic greenhouses, numerical simulation, and experimental results. Appl. Eng. Agric. 2016, 32, 861–869. [Google Scholar]
Figure 1. Flowchart of this study.
Energies 14 06331 g001
Figure 2. Solar heat gain measurement principle.
Energies 14 06331 g002
Figure 3. Light compensation point and light saturation point.
Energies 14 06331 g003
Figure 4. Test equipment for each test item.
Energies 14 06331 g004
Figure 5. Fourier transform infrared spectrometer (FT-IR).
Energies 14 06331 g005
Figure 6. Test device configuration and measurement instruments.
Energies 14 06331 g006
Figure 7. Thermal conductivity measurement.
Energies 14 06331 g007
Figure 8. Target Greenhouse Location.
Energies 14 06331 g008
Figure 9. Floor plan of smart farm.
Energies 14 06331 g009
Figure 10. Simulation modeling image of smart farm.
Energies 14 06331 g010
Figure 11. Muan weather data in Jeollanam-do (dry bulb temperature, solar radiation).
Energies 14 06331 g011
Figure 12. Comparison of visible transmittance by sample.
Energies 14 06331 g012
Figure 13. Comparison of visible reflectivity by sample.
Energies 14 06331 g013
Figure 14. PPFD (illuminance) map of Case 2-2.
Energies 14 06331 g014
Figure 15. PPFD (illuminance) map of Case 2-3.
Energies 14 06331 g015
Figure 16. PPFD (illuminance) map of Case 2-4.
Energies 14 06331 g016
Figure 17. Interior illumination by cladding (6/21).
Energies 14 06331 g017
Figure 18. Cooling load, solar acquisition rate, visible light transmission rate, and heat transmission rate by cladding material.
Energies 14 06331 g018
Figure 19. Cooling load changes according to cooling set temperature control (Case 1-1 through Case1-3).
Energies 14 06331 g019
Figure 20. Cooling load changes according to internal shading rate control (Case 2-1 through Case2-4).
Energies 14 06331 g020
Table 1. Measurement items and characteristics.
Measure ItemsCharacteristics
Glass
  • Glass 3–4 mm thick is the most commonly used.
  • Transparent glass has a 90% visible light transmission rate.
PE Film
  • Manufactured by polymerizing LDPE, MLLDPE, EVA.
  • It can be used for more than five years due to its high light transmission rate and tensile strength.
PO Film
  • PO film permeates more ultraviolet and infrared than other soft films.
  • It is penetrated by long wavelengths, so it is less thermal, but the visible light penetration rate is similar.
ETFE
  • The film has a durability of 10 years for 0.06 mm and 15 years 0.1 mm.
  • Even over time after covering, light transmittance is low and dustproof, but dustproof agents are recommended every two to three years.
PMMA
  • Maintaining long-term weather resistance and transparency.
  • It is used for vacuum molding and is applied in various ways to high-brightness reflective films for optical use.
PC Double-Layer
  • Light penetration and anti-condensation effect.
  • Construction in a relatively large and difficult place for natural lighting.
  • It can reduce electricity costs and create a bright and cozy working environment with smooth natural lighting.
Woven film
  • The film is made of high-strength threads in a lattice pattern, which provides tensile strength and tear strength.
  • The transparency is low, but it is weaving, so you can see the effects of scattering.
  • High penetration due to multiple angles when light is transmitted.
Table 2. Test standard according to cladding material and performance evaluation.
Visible LightSHGCThermal Transmittance
Single materialKS L 2514KS L 2514KS L 2525 (Glass)
KS L 2016 (Film)
Composite materialKS L 2514KS L 9107KS L 9016
Table 3. Current status of overseas greenhouse design standards.
DivisionAgencyStandardRemarks
USAASABEASABE EP 460 (Commercial Greenhouse Design and Layout)
ASABE EP 406 (Heating, Ventilating and Cooling Greenhouses)
ASHRAEASHRAE Applications Handbook Chapter 24
(Environmental Control for Animals and Plants)
NGMAStandards and guidelines
JapanJGHAHandbook of protected horticulture
ChinaChinese national standard
(GuojiaBiaozhun)
GB/T 18621-2002
(Design regulation on greenhouse ventilation and cooling)
Table 4. Summary of standard model.
CategoryContents
AreaCultivation room: 1008 m2 (31.5 m (W) × 32 m (L))
Height and slope of roof7.2 m (side height: 6 m), 25°
North axis124 (North-west)
ShadingInternal shading
BedHanging-gutter system
Weather dataJeollanam-do Muan
CropStrawberry
Table 5. Performance test results of smart farm covering materials.
MaterialsThickness (mm)Visible TransmittanceSolar Heat Gain CoefficientCoefficient of Heat Transmission (W/m2∙K)
Glass3.90.8950.865.62
PE film0.0900.8840.905.88
PO film0.1460.8900.906.03
ETFE0.0970.9230.936.03
PMMA16.10.7320.556.67
PC double layer5.90.4960.543.70
Woven film0.2120.7470.545.91
Table 6. Control strategies of smart farm.
CasesControl Strategies
Case 1-1Cooling setpoint
8:00~17:00 18 °C/17:00~22:00 10 °C/22:00~08:00 9 °C
Case 1-2Cooling setpoint
8:00~17:00 23 °C/17:00~22:00 12 °C/22:00~08:00 9 °C
Case 1-3Cooling setpoint
all time 30 °C
Case 2-1No shading
Case 2-2Internal shading
40%
Case 2-3Internal shading
50%
Case 2-4Internal shading
60%
Table 7. Light performance test results of smart farm covering materials.
Test ItemUnitResult
GlassPEPOETFEPMMAPC DoubleWoven
Visible Light Transmittance%89.5 ± 0.188.4 ± 0.189.0 ± 0.192.3 ± 0.173.2 ± 0.149.6 ± 0.174.7 ± 0.1
Visible Light Reflectivity%7.6 ± 0.18.2 ± 0.18.1 ± 0.16.6 ± 0.123.0 ± 0.123.7 ± 0.122.4 ± 0.1
Solar Radiation Transmittance%82.5 ± 0.189.6 ± 0.189.4 ± 0.192.5 ± 0.170.8 ± 0.151.3 ± 0.176.3 ± 0.1
Solar Radiation Reflectivity%7.1 ± 0.17.9 ± 0.17.7 ± 0.16.7 ± 0.122.8 ± 0.122.2 ± 0.119.9 ± 0.1
Thicknessmm3.90.0900.1460.09716.15.90.212
Table 8. Heat performance test results of smart farm covering materials.
Test ItemUnitResult
GlassPEPOETFEPMMAPC DoubleWoven
Coefficient of heat transmission W / m 2 · K 5.62 ± 0.15.88 ± 0.16.03 ± 0.16.03 ± 0.16.67 ± 0.13.70 ± 0.15.91 ± 0.1
Publisher’s Note: MDPI stays neutral with regard to jurisdictional claims in published maps and institutional affiliations.

