1. Introduction
The use of unmanned aerial systems (UAS, also called drones) have been growing because they can be useful in achieving the project goals of sustainably built environments. Drones can quickly and precisely perform their missions with low operational costs and safety risks, particularly, when they are used with video recording and photography [
1]. As built environments become old, drones play a significant role in detecting anomaly damages in terms of structure and thermal energy leakage issues in building envelopes such as walls, windows, and roofs. For example, the Korean Ministry of Land, Infrastructure and Transport reports that approximately 36% of Korea’s infrastructures was built more than 30 years ago [
2].
Researchers began to actively exploit drones to identify damages through image processing [
3,
4,
5,
6,
7]. In the field of crack inspection in concrete walls, researchers worked mostly on increasing the accuracy of contour detection through exploiting different schemes with complex pre-processing of the captured image. Choi and Kim [
3] suggested a drone-assisted scheme that allowed users to modify a threshold to adjust an image size through an image acquisition system. They used the Canny edge detection algorithm to find cracks inside or outside of a building. Noh et al. [
4] suggested a drone-assisted image processing method to find cracks larger than 0.3 mm on the surface of a bridge. They segmented an image with fuzzy c-means clustering and removed noise through mask filtering with three different sizes. Their approach was important because the images taken from a drone is not typically close to the concrete surface. Their approach enhanced the accuracy of the detection from the drone-assisted images. Dixit and Wagatsuma [
5] used morphological component analysis on a manually acquired image of a concrete bridge to identify the texture features. They used dual tree complex wavelet transform and anisotropic diffusion to remove noise of the image. Then, they used Sobel edge detector to find the fine cracks. Their results showed that anisotropic diffusion outperformed dual tree complex wavelet transform. The results from this study were also important because coarse images taken from a drone can be accurately detected through this approach.
In addition, Seo et al. [
6] suggested a drone-enabled methodology and application for a bridge inspection. They developed a five-stage methodology using a drone based on an extensive literature review and demonstrated their efficient and cost-effective approaches with a filed investigation. Their results showed that drone-enabled methodology can identify various damage types, such as cracks, spalling, corrosion, and moisture, on different materials of concrete, steel, and timber, by using a photogrammetric computer software and a visual inspection. Morgenthal et al. [
7] also presented a framework for an automated drone system to inspect large bridges. Modern cameras of a drone generated high-resolution image data of the bridge surface. Then, an intelligent flight planning was developed to consider the quality of the image from the drone. Using photogrammetry and machine learning, typical damage patterns were identified.
These previous studies used the images from drones to identify anomaly damages such as cracks. Several studies contributed to an automated detection process or scheme. However, all the previous studies did not include an automated image location process and did not compare different detection methods for anomaly damages.
In addition, many studies such as biology [
8] and geology [
9] have covered the use of drones with infrared cameras. Moreover, the construction industry needs to increase the use of infrared drones because there are advantages such as thermal pattern analysis and 3D photogrammetry modeling [
1,
10]. Traditionally, infrared thermography has been widely used in building energy audits [
11,
12]. Infrared thermography has been used for qualitative (i.e., walk-through audit) or qualitative/quantitative (i.e., standard and simulation audit) approaches [
11]. Particularly, drone-assisted infrared thermography approaches are helpful to quantify heat energy losses in the building envelope because they provide reliable and fast inspection for large areas. Infrared drones can be useful for the quantitative approach as well as the qualitative approach when the spatial resolution by the distance of a drone flight and other sensor data by measuring weather conditions are considered [
12,
13,
14,
15].
Recently, Rakha and Gorodetsky reviewed drone-assisted applications in thermography and 3D photogrammetry to analyze building performance [
1]. They found that infrared images from the use of a drone can significantly improve traditional energy auditing methods. Their case study showed that infrared drones can provide useful images on thermal leakage. However, several conditions should be carefully controlled for the better inspection for the pre-flight, during-flight, post-flight steps. Entrop and Vasenev developed a protocol for the building thermography research based on a literature study and several test flights [
10]. Thermal leakage in the building envelope and a photovoltaic panel on the roof was investigated using the protocol. From the multiple test flights, they found that the distance between a drone and a building, the velocity of a drone, and the flight paths of a drone should be carefully adjusted based on the research conditions. They also found that inside and outside temperatures, wind, and precipitation would be influential factors for the drone research results. Ellenberg et al. showed that infrared drones can detect a delamination from the thermography in bridge decks [
16]. They developed a post-processing algorithm using the Canny edge detector combined with the Hough transform. They also suggested a method to identify the location of delamination. However, many images were required to find the location. They concluded that their method provided a rapid screening, but this approach should be supported by other refined methods such as a ground inspection method. Infrared drones can be used for the calibration of urban scale microclimate models [
17]. Fabbri and Costanzo proposed a novel calibration approach using the measurements of urban-scale surface temperatures through drone-assisted infrared images. They compared the measured surface temperatures with the simulated surface temperatures from ENVI-met simulations.
In summary, although the previous studies showed rapid and improved drone-assisted approaches for their research purposes using experimental data, they did not provide a fully automated and easy-to-use procedure through an image from a drone, including an automated location identification approach for anomaly detection in building envelopes. In addition, most of their approaches were not simplified; thus, they required additional steps and/or manual steps. Furthermore, the drones (e.g., DJI Inspire 1, DJI Phantom 2 and 4, etc.) and cameras (e.g., Go Pro 4, 1080P HD/12 Megapixel camera, Sony Alpha 7R, etc.) used for the previous studies were not cost-effective, and the cost was not detailed. The battery usage and computational loads were also not studied during the flight. Finally, they did not compare different detecting methods for anomaly damages.
Therefore, in this paper, using the cost-effective drone and attached equipment, an automated drone-assisted image processing scheme was developed to probe a building envelope. The following objectives were achieved: (1) Considering battery usage with respect to the direction, the most battery efficient routing path was decided. (2) Three different contour detectors (i.e., Sobel [
18], Laplacian [
19,
20], and Canny [
21]) were compared to find an accurate scheme with low computational overhead. (3) Using FPS (frames per second), and angle of view of the camcorder of the drone, the relative position of frame and image was identified.
An overview of the developed scheme for this paper is presented in the second section. The drone developed for this paper, the most battery efficient routing path, the frame-based location identification, and the three different contour detectors is also introduced. In the third section, the results from the developed scheme of this paper are discussed. In
Section 4, the cost of the drone with the attached equipment is summarized.
Section 5 presents the discussion and
Section 6 concludes this paper.
2. Methods
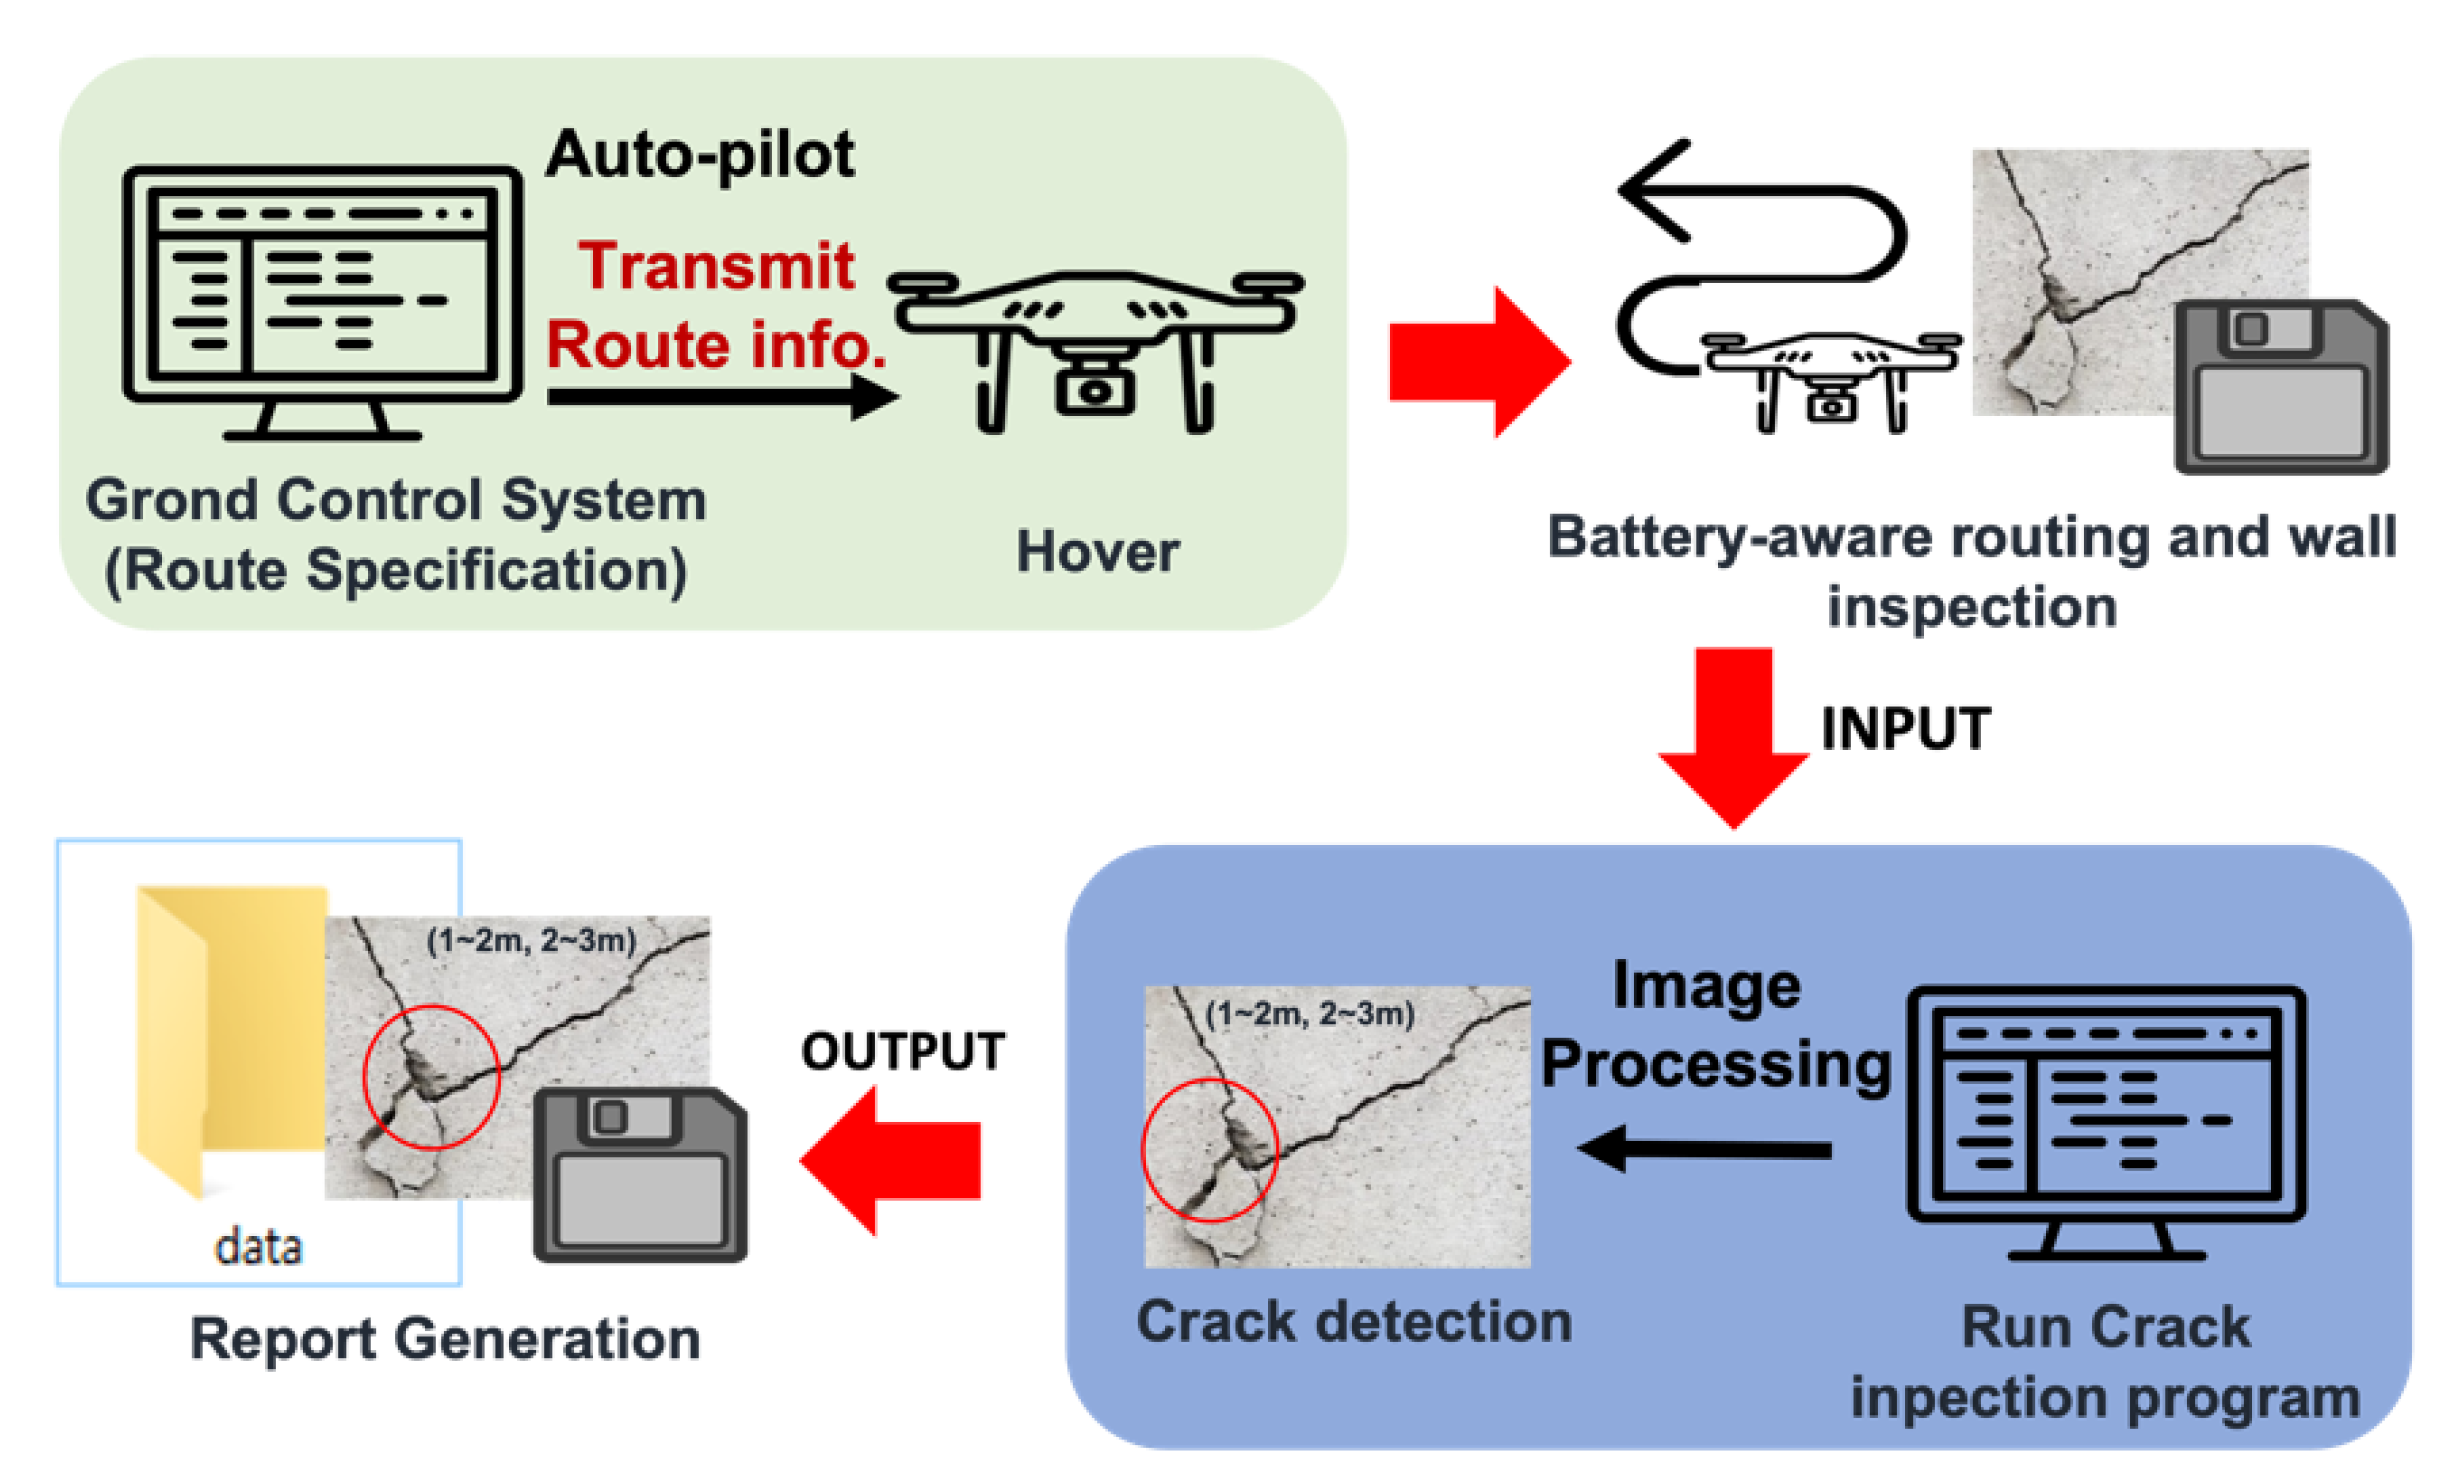
This section includes a brief description of the drone used for this study and an overall procedure of the drone-assisted image scheme. The framework proposed in the paper is illustrated in the
Figure 1. The components are ground control system, drone with camera, wall inspection program, and report generator. Ground control system manages the routes of a drone. Once the route information is fed into the drone, it flies against the wall and takes video. The video feed is used as input to the inspection program. The program generates the report, including the image of crack and the location of the crack.
2.1. Hardware Design
In this paper, we chose DJI F450 quadcopter drone as the base frame with four 920 KV motors because of its small form factor and reliability. The CATIA software (CATIA V5, Dassault Systèmes, Vélizy-Villacoublay, France) [
22] was used to create the 3D models of the drone as well as propeller guards and landing gears (
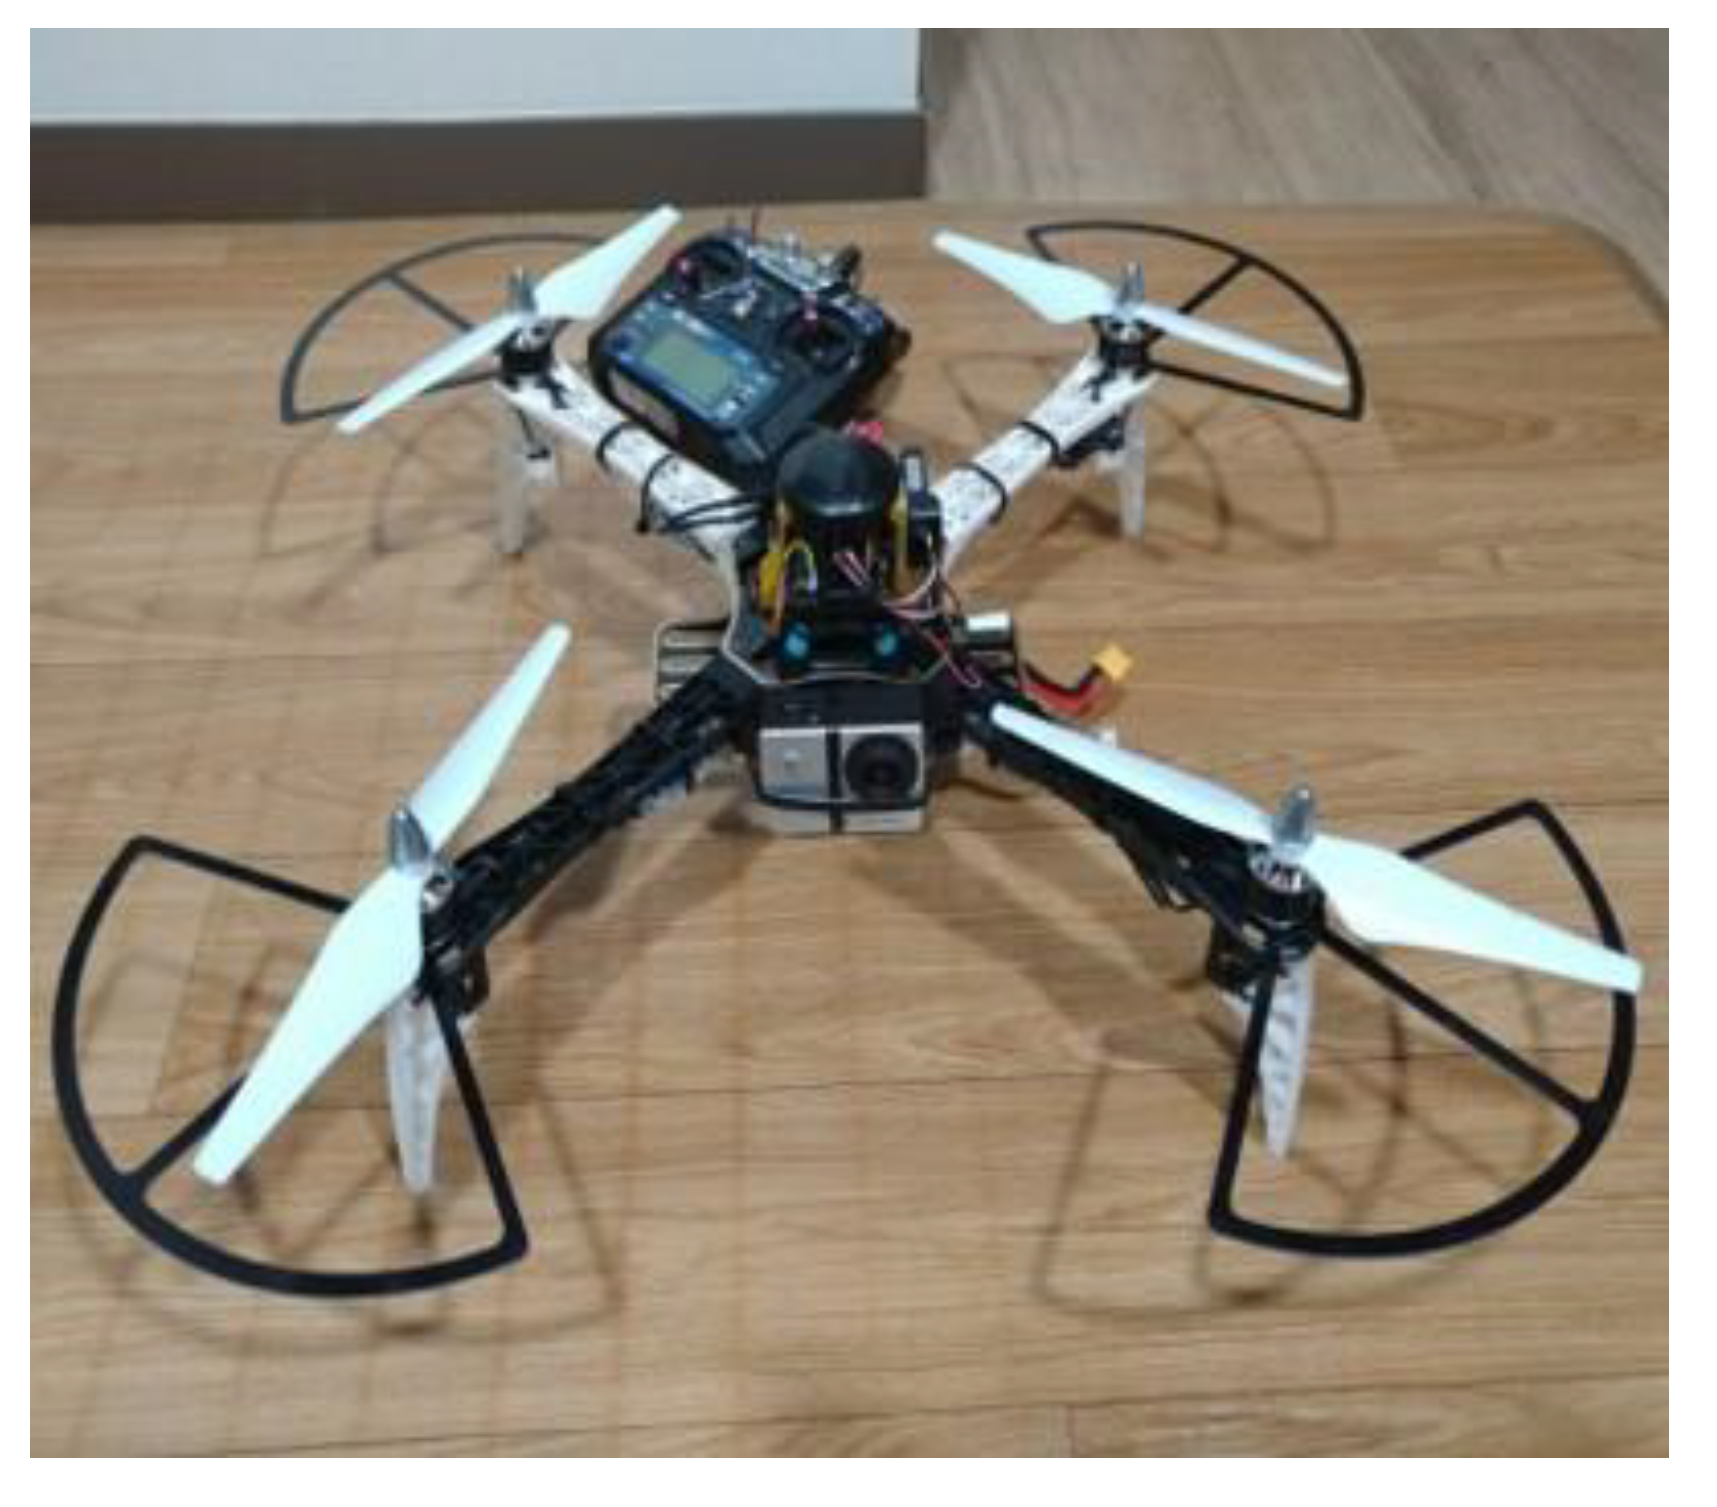
Figure 2). The propeller guards and landing gears were created using a 3D printer to protect the four propellers of the drone arms and to protect the battery and camcorder located at the center of the drone, respectively. Finally, the drone equipped with the battery and camcorder was produced with the propeller guards and landing gears, as shown in
Figure 3. The camcorder angles of horizontal and vertical views were 170 and 60°, respectively, and the camcorder had video resolution of 2.7k@30FPS. In addition, a FLIR thermal camera was additionally equipped with the drone. Hardware components are described in
Section 4.
Since the drone used in the experiment was custom made, the reliability and safety of the drone had to be analyzed. The total load of the drone was 1.497 kg, and by calculation the thrust generated by four motors was able to lift up to 3.8 kg. Another important analysis that had to be carried out was stress and deformation of the frame because the thrust deforms the arms of the drone. We used SAMCEF [
23] to analyze the deformation of the four arms and the stress of the center when the drone was in flight (
Figure 4). The simulation results showed that the maximum deformation of the four arms was 0.39 mm, and the maximum stress of the center was 0.95 MPa. The arm was able to withstand stress of 270 Mpa. The result of deformation and stress test assured the safety of the drone. In addition, the stability during the drone flight was also tested. The test results showed that the drone was returned to a hovering flight status within one second after the roll/pitch was maximized. The cost for the development of the drone used in this study is also identified in
Section 4, which shows that the total cost was significantly lower than the previous studies.
2.2. Software Components
Video captured by the drone was transferred to a ground station PC composed of Intel
[email protected], 4GB DRAM, and Windows 10. The anomaly detection system was built on Visual C++. Xbee explorer dongle communication was used in the drone. We used APM as the flight controller and it was connected to Ground Control System through Mavlink [
24].
Camera module captured the video image of a wall, then Raspberry Pi transfers the image to the ground workstation. The ground station PC ran automated framework to process the image and generate the report. The average run time to process and generate the report was about 0.7 s. Within the report, we made a list of coordinates of identified cracks along with the captured images of cracks and thermal leakages for further investigation.
Figure 5 illustrates an automated framework for the anomaly contour detection. First, once the video data of building envelope was acquired, the captured data is processed by the contour detection algorithms after pre-processing images to remove noises using the Gaussian blur and binarization. Then, the contour detector identified cracks on a wall and/or window. Since all contours may not be cracks, based on the guideline provided by Korea Land Housing Corporation, cracks on a concrete wall with a width larger than 0.3 mm were identified as cracks. For infrared thermal images, the highest temperature contours were considered as thermal leakage because it was assumed that the weather conditions when the research was conducted did not introduce acknowledgeable bias in detecting the thermal leakage in the building envelope using the highest temperature. In addition, it was assumed that the building surface temperature was not significantly affected by the building wall structure.
Second, a frame-based location identification for the contours was developed. Using the images with cracks and/or thermal leakage, a relative position of the frame captured via video frame rate was identified. Then, the location information was embedded on to the image.
Min and max value for hysteresis thresholding in Canny was heuristically determined to 120 and 350, respectively. Threshold and kernel size of Sobel and Laplacian algorithms were also determined heuristically (i.e., threshold 70 and 150, and Kernel size 3 and 5, respectively).
2.3. Contour Detection for Efficient Battery Utilization
The battery power is one of the most important factors in operating a drone for any missions. However, to the best of our knowledge, no previous studies have considered battery usage in executing a flight plan. The average flight time given by the manufacturer is based on hovering of a drone in fixed position; thus, this is the idle use case. Since the building wall is a two-dimensional surface, we have four different ways of exhaustively and completely inspect the wall. We can fly the drone (1) horizontally, (2) vertically, (3) diagonally, and (4) randomly. The battery power is drained at different rate depending on how it is operated. In the case of wall crack inspection, it is inevitable that a drone has to travel upwards. However, thrust and acceleration are the two motions that drains the battery quickly. Thus, it is critical to minimize the thrust and acceleration motions while navigating and inspecting walls. To reach the goal of making a drone travel its maximum distance with lowest possible battery usage, we developed a flight plan as in
Figure 6 to minimize the prolonged upward thrust motion.
2.4. Frame-Based Location Identification
Once a frame with the anomaly detection is identified, users need to know where this frame is taken from in relative coordinates, i.e., (
x,
z). We set the base point (0, 0) as the lower left corner of a building as shown in
Figure 6. In order to calculate the position of a frame, we consider of distance moved per frame and
x-axis coordinates with respect to odd and even orders of the routing turn. It was assumed that a drone is flying in a constant speed at 1 m perpendicularly away from the wall, and the dimension of a building (
W,
H) is given.
The horizontal and vertical length is represented by Equations (1) and (2), respectively.
Here, PPI (pixels per inch) is used to measure the dimension of the wall visible in a frame. The number of pixels in the x- and z-axis is denoted as and . 0.0254 is multiplied to convert the pixels to meters.
The dimension of the wall visible in a frame is (w, h), and the start point of taking video is (0.5 w, 0.5 h). The moving distance in the x- and z-axis is measured by (W-w) and h, respectively. Thus, the drone moves (W-w) m in the x-axis and upward h m in the z-axis as a one-time turn.
The distances moved per frame in
x- and
z-axis, which are denoted as
and
, can be obtained by dividing the moving distance by the total number of frames, which are Equations (3) and (4), respectively.
Here, the total number of frames on x- and z-axis are denoted as and , respectively, which is the product of the number of FPS and the seconds moved in each axis direction.
To calculate the position using the number of frames, it was considered that the direction of drone moves as it travels back and forth in
x-axis as shown in
Figure 6. The number of turns,
T, was counted to find whether a frame is in even or odd turn, that is Equation (5).
Here, N denotes the current frame number.
C was used to denote the number of frames within a turn, which is Equation (6).
Thus, if
T mod 2 = 0 then the order of turn is in an even number and use Equation (7); if
T mod 2 = 1 then the order of turn is in an odd number and use Equation (8).
z can be identified regardless of which order of a turn, which uses Equation (9).
2.5. Contour Detector Methods
Sobel [
5,
18], Laplacian [
19,
20], and Canny [
21] contour detectors were compared using the crack images from a drone. In addition, Canny contour detector was applied to infrared thermal images in the building envelopes. The three contour detectors were built on Visual C++, and the results from the three contour detectors are shown in the
Section 3.3. For completeness of the paper, we have summarized the concepts of each algorithm used in the paper. The details of the algorithms can be found in [
5,
19,
21].
Sobel operator can smooth the presence of random noise in an image using an average factor and can improve the elements of the edge appearing bright and thick. Sobel operator uses an orthogonal gradient operator and first order differential operator. Sober operator convolves an image in horizontal and vertical direction with an integer valued, small, and separable filter. The orthogonal gradient operator can be calculated using Equations (10) and (11).
At the position (
x,
y), the pixel value of an image can be shown in a continuous function
f(
x,
y). The gradient of a continuous function can be expressed using a vector in Equation (12).
Magnitude and directional angle of the vectors can be expressed using Equation (13).
Equation (13) can be simplified using Equations (14) and (15) for a digital image. ∅ is the directional angle between the vectors of
and
.
Partial derivative formula for each pixel location is calculated. Using the gradient operator,
and
are combined for convolution templates. To conduct convolution, two kernels (templates) are used for every point. One kernel has a maximum response to the vertical edge, and the other kernel has a maximum response to the level edge. The output point uses the maximum value of the two convolutions. Then, the edge amplitude image is created. The convolution is conducted using Equations (16)–(18).
Laplacian operator is a second order differential operator. The operator is defined in the n-dimensional Euclidean space using the divergence (∇) of the gradient (∇ f). The Laplacian operator needs a more careful approach to noise because it is the second derivative operator. Scattered broken edge pixels can be shown in the results. To reduce the low-quality pixels, a low pass filter is significant before the Laplacian edge detection. It is proven that the Gaussian low pass filter is effective for image denoising [
25]. This approach is called the Laplacian of Gaussian (LOG) operator using Equation (19).
(
x,
y) is a Gaussian kernel function with the standard deviation of σ.
Canny operator is based on the three standards of the signal-to-noise standard, location accuracy standard, and monolateral response standard. First, using the Gaussian function, an image is denoised. Second, the maximum value of first differential determines the edge points, which is closest to the real edge. Finally, both the maximum and minimum values (i.e., strong edge and weak edge) of the first differential are matched with the zero cross point of the second differential in order to extremely suppress the response of unreal edge. Therefore, Canny operator can effectively avoid noise. Canny operator has the following three standards of Equations (20)–(22):
Signal-to-noise (
SNR) standard
where
G(
x) is an input image,
h(
x) is an impulse response of filter with the width of ω, and σ is the unbiased variance of Gaussian noise.
Location accuracy standard
where
L quantificationally describes the accuracy of the edge detection. Larger value means better accuracy.
Monolateral response standard
where
should be larger to satisfy the zero cross point, impulse response differential coefficient of the operator.
4. Cost Analysis
This paper proposes a cost-effective custom drone to inspect cracks and thermal leakage on buildings autonomously. The cost-effectiveness can be compared using total cost of ownership (TCO) analysis, which is the sum of capital expenditure (CAPEX) and operational expenditure (OPEX). CAPEX includes the cost of the drone, camera, and battery. OPEX contains the cost of assembling the drone, replacing the parts, maneuvering the drone, processing the acquired image, and depreciation of the drone. TCO analysis justifies the need for a custom drone with crack and thermal leakage inspection capabilities.
To compare TCOs from different drones, we chose the mid- and high price range of the custom drones to match the prices of consumer drones (i.e., DJI Phantom 4 Pro and Inspire2). We chose Go Pro4 as a camera for a mid-price custom drone and Sony A7R II with 24–70 mm lens as a high-price custom drone. For the consumer drones, we chose Zenmuse X5S as a camera for Inspire2. In the case of Phantom 4 Pro, it uses a built-in camera.
Table 1 summarizes the breakdown of the cost structure of the custom drone proposed in this paper. Motor and electronic speed control (ESC) and Pixhawk platform were ranked at number one (i.e., 57.2%) and two (11.8%) among the equipment cost, respectively. Note that we excluded the cost of FLIR thermal camera in CAPEX because it is not a default option for consumer drones. The total CAPEX for all drones is shown in
Table 2. The price range of custom-high and Inspire 2 is in the same tier (i.e., approximately
$5000), and the price range of custom-mid and Phantom 4 Pro is in the same tier (i.e., approximately
$2000).
A professional must assemble all the parts for a custom drone. Although assembling is not too difficult, it takes about an hour for novice personnel. We assumed $200 to hire personnel to build a custom drone. We also assumed that we needed two replacements for a frame, landing gear, propellers, and camera lens. In addition, we replaced the battery every year. Since parts on a consumer drone are not replaceable, we considered a care plan for the body and the camera, which provided replacements for various accidents with a fee. Since the camera lens is not replaceable for a module camera or a Go-Pro product, we assumed replacing the camera itself is necessary rather than replacing the lens. In the case of custom-high, we chose to replace the lens because the lens was not fixed to the body.
Unlike a proposed custom drone, a professional must fly consumer drones and post-process acquired images. To consider the cost of hiring a professional, we assumed the professional work for 2 h per day, five days per week, and two weeks with a fee of USD 300 per hour. In the custom drone case, we assumed the same amount of time with USD 100 per hour. It was also assumed that the same amount of proficiency is required to process the image to find the cracks. For the sake of comparison, we assumed the manual inspection for the image; however, we can reduce the cost if it uses the proposed scheme. As the TCO analysis shows in
Table 2, automatically inspecting cracks in the building has competitive advantages over consumer drones.
Using a high-resolution camera in inspecting the wall may reduce overhead by reducing route length for a drone to scan because it may capture an image further away from the wall and still maintain the information it requires to detect cracks. However, using a better camera causes several complications: First, a high-end camera cannot interact with embedded boards such as Raspberry Pi. Moreover, even if we assume it can be connected to the embedded boards, it requires higher computation power to process the acquired image. Second, the heavier the peripherals are attached to a drone, the more battery it consumes and the shorter the drone’s flight time.
Table 3 describes the weight and battery time of drones. Third, we need more skilled drone pilots to fly the drone higher up, which increases the hiring cost. Another critical factor is post-processing cost. Irrelevant to the camera used to capture the image of a wall, we need to take the post-process for the image to determine the cracks in the wall. The distance of the drone from the wall or generating the battery-optimized route of the drone is a customizable factor that one can adjust depending on the specification of a drone. However, determining the crack and identifying the coordinates of the found crack on the wall is time-consuming and tedious error-prone work. Thus, we can expect that using the automation scheme proposed in this paper will reduce the time of operating and processing the acquired images and also significantly reduce the cost of ownership.
5. Discussion
There are other sophisticated and elaborate schemes that allowed more accurate detection of cracks in the built environment. For example, global positioning system (GPS) can be used for the crack detection instead of the frame-based location identification. To address this issue, we set a drone to a hovering mode and measured GPS readings for 30 min. Although the drone was in hovering mode, the difference of longitude and latitude of actual location and the readings were 6.1 m on average. In a short period of time, i.e., 1 min, the GPS readings were constantly fluctuating and gave us an error of 2.3 m. A more expensive yet reliable solution for identifying the location would be an ensemble of more accurate modules. However, the cost-effective solution developed in this study was viable because this solution did not require expensive peripherals.
The default scenario for the built environment inspection includes human engagement for visual confirmation. Since inspections are performed periodically, identifying the location, size, and the pattern of a crack is enough for determining the progress of the crack in many of the cases. Moreover, thermal defects are 3D in nature, and both interior and exterior of the defected area must be thoroughly inspected by trained and qualified personnel. Since the drone was used as auxiliary equipment for the inspection, we believe the developed cost-effective solution will suffice for the inspection scenario. Regarding detecting thermal leakage using drones, weather conditions, such as sky conditions, outside air temperatures, and daylight and solar radiation, are important [
1]. For example, the emissivity of the building materials can be influenced by the solar radiation and cloud conditions [
32]. In addition, the difference of 10 °C between inside and outside air temperatures can be required for the better thermography results [
33]. Thus, stable and desirable weather conditions are necessary to achieve the research goal utilizing the drone equipped with the infrared camera. If the conditions are appropriately met for the infrared camera, the drones equipped with the infrared camera will quickly identify thermal leakage from the envelopes of many buildings and will help human inspectors save the time.
Applications of these drones are applicable to crack and thermal leakage detection of a building and post-earthquake inspection for any built environment. In the case of earthquake inspection scenarios, time is of the essence. The authorities can deploy several drones to inspect for cracks and leakage in high-rise buildings to reduce the safety risks. This approach can also reduce operational costs and time spent inspecting buildings.
The limitations of this study include weather conditions during the drone flight. In low light environments when the sunlight is weak, the three contour detectors were not effective. In addition, wind speeds should be considered to mitigate the effect of adverse wind on a drone. An additional feedback control algorithm is needed to maintain the stability and velocity of a drone.
6. Conclusions
As a built environment ages and as natural disasters such as earthquakes increase, the fatigue also increases, and it causes internal or external cracks on the surface of the building that may lead to greater disaster. Since we have limited manpower and resources, it is not only an expensive but is also a time-consuming job to investigate the buildings for cracks. By using drones, we can mitigate the cost structure of the wall inspection as well as provide time-efficient solution for crack inspection of the built environment. The solution can be used to also utilized to inform a managing agency about the danger signals observed while inspecting. The contribution of the paper is in two-folds. First, it offers ingredients of autonomous building inspection, which opens many doors to sustaining built environment. Second, it offers a low-cost and easily maintainable solution for wall inspection.
This paper presents improved approaches to detect cracks and thermal leakage in building envelopes using drones with video camcorders and/or infrared cameras. First, the efficient routing coordinate was found from several tests. Second, the automated scheme using the frame-based location identification was developed to effectively find the current location of the drone-assisted image frame. Finally, three widely used contour detectors of Sobel, Laplacian, and Canny algorithms were compared to find a better solution with low computational overhead. In addition, the Canny detector was applied to the anomaly detection from thermal images.
The results showed the new simplified drone-assisted scheme provided automation, higher accuracy, and better speed through low battery energy use. Furthermore, this study found that the developed, cost-effective drone with the attached equipment generated accurate results without using an expensive drone.
Although there were limitations, the developed, drone-assisted scheme of this paper will be valuable to automate all the procedures to detect anomaly damages in the building envelopes with low battery use, low computational loads, and low cost. This new scheme will contribute to fully automated anomaly detection, energy audit, and commissioning for sustainably built environments, including numerous residential and commercial buildings.


