Article

A Probabilistic Conductor Size Selection Framework for Active Distribution Networks

by
Lewis Waswa
*,
Munyaradzi Justice Chihota
and
Bernard Bekker
Department of Electrical & Electronic Engineering, Stellenbosch University, Stellenbosch 7602, South Africa
*
Author to whom correspondence should be addressed.
Energies 2021, 14(19), 6387; https://doi.org/10.3390/en14196387
Submission received: 31 July 2021 / Revised: 20 September 2021 / Accepted: 20 September 2021 / Published: 6 October 2021
(This article belongs to the Special Issue Selected Papers from ENERGYCON 2020 Conference)

Abstract

:
With the increasing adoption of distributed energy resources (DERs) such as wind and solar photovoltaics (PV), many distribution networks have changed from passive to active. In turn, this has led to increased technical and operational challenges such as voltage issues and thermal loading in high DER penetration scenarios. These challenges have been further increased by the uncertainties arising from DER allocation. The implication of DER allocation uncertainty in the planning process is far-reaching as it affects critical planning processes, including conductor size selection (CSS). Most reported CSS methods in the literature do not include DER allocation uncertainty modeling as they are mostly deterministic and are set out as optimization problems. The methods, therefore, lack foresight on future loading conditions and cannot be used in a CSS process for feeders with high DER penetration. This paper proposes a novel input–process–output stochastic–probabilistic CSS framework for distribution feeders with DERs. The efficacy of the proposed framework is demonstrated using a low voltage feeder design case study with varying PV penetration targets, and the performance compared to deterministic–active-based estimates from our earlier work. The proposed CSS method is well-suited to the sizing of conductors for future loading conditions considering DER allocation uncertainty and will therefore be useful to planners working on new electrification projects.

1. Introduction

The increasing adoption of distributed energy resources (DERs) such as solar photovoltaics (PV), electric vehicles (EVs), and energy storage systems (ESS) on distribution networks has changed distribution network operations from passive to active [1]. The resulting networks are termed active distribution networks (ADNs) to denote the unique operating dynamics associated with bi-directional power flow and the integration of DERs. While DERs have several potential benefits to the power system, including climate change mitigation (for renewable energy-based DERs) and ancillary services provision, the increased connection of DERs is likely to increase the technical challenges that distribution network operators (DNOs) face [2].
The severity of the problems depends on various factors, including network electrical and loading properties as well as the location and capacity of the DERs. Reported challenges in the literature include violation of voltage limits [3,4,5,6], transformer and conductor overloading, voltage unbalance, and protection issues [5,7,8]. These challenges have motivated research focused on determining the hosting capacity (HC) [9], which defines the maximum DER penetration that existing feeders can host while maintaining acceptable performance [3]. DNOs mostly use the HC as a basis for the formulation of regulations and standards for DER integration and control. However, this usually leads to the restrictive utilization of DERs due to the design characteristics of passive distribution systems.
The design of passive distribution systems, particularly the selection and sizing of conductors, transformers, and other network equipment, were traditionally based on the feeder maximum demand (FMD) [1]. The FMD quantifies the maximum load capacity—which combines the expected loads at the time of commissioning and growth factors in a selected planning horizon—that the feeder can support without violating selected technical constraints. Usually, quality of supply (QoS) constraints in terms of voltage-drop, and unbalance, and thermal loading of conductors and transformers form the set of technical constraints. As such, the FMD indicates the loadability limits of network infrastructure. The application of these traditional network design principles is relatively straightforward and well-known [10,11]. However, extending the design principles to ADNs has significant difficulties due to the numerous factors linked to the differences between active and passive distribution systems, including:
  • New technologies—new load types, such as EVs and ESS, and distributed generation from PV, wind, and arbitrage systems introduce new considerations in the network planning process [1].
  • Combination of uncertainties—the capacity and location, often termed allocation, of DERs, is out of the control of DNOs and is mostly random. Furthermore, stochastic factors influence the DER power exports and imports.
  • Dynamic operation of DERs—the time-of-use characteristic for DERs, mainly EVs and ESSs, is more complicated than for standard residential loads
Practical ADN design principles that lead to reliable systems (with a low likelihood of technical issues) under high DER penetration will need to incorporate the combination of the listed factors.
In general, distribution network design mainly involves the optimal selection (type and size) and placement of network equipment such as transformers, capacitors, and conductors [12,13,14]. Of these, the conductor size selection (CSS) process has been identified as a critical area closely linked to QoS performance [15]. From a technical perspective, the prime objective of the CSS process is to ensure that individual conductors can support the connected load capacity within thermal loading and voltage deviation limits [16]. Accordingly, the correct conductor size is dependent on technical variables such as the system loads and their location on the feeder, which influence the loading of specific feeder branches and bus voltages. As aforementioned, these technical variables are influenced by various uncertainties, whose accurate representation is vital in the correct formulation of CSS models.
A sample of studies investigating the formulation of optimal CSS is reported in [1,14,17,18,19,20,21,22,23,24,25,26,27,28,29,30,31,32,33,34,35]. Analysis of this literature was carried out to establish the number of studies that considered DERs in the CSS formulation. Out of the total number of papers that were reviewed, it was established that only six papers considered DERs in the CSS problem formulation [1,14,18,24,31,35]. The rest of the papers had limitations such as the application of deterministic power flow methods, which cannot adequately represent uncertainties. Additionally, these studies did not consider modeling DERs, which implies that they are not suitable in selecting and sizing conductors in active systems. Furthermore, these methods were largely formulated with a cost minimization objective and did not envision enhancing DER penetration on the network as a key objective [17,19,20,21,22,23,25,26,27,28,29,30,32,33,34,36].
A further analysis of the literature considering DERs was conducted based on several aspects including the objective of the study, uncertainty representation (allocation and input), as well as the power flow method used. It was noted that all the studies except for [1] applied a fixed allocation in the CSS formulation process. This means that the location and the capacity of the DERs were predetermined in the modeling process. Simulation of fixed capacity and placement of DERs does not reflect the practical reality of the future uptake characteristics of DERs, particularly on LV networks, where the DNO’s usually lack control. Therefore, these methods require improvement for their eventual application in the CSS procedure. Secondly, most of the studies applied a deterministic power flow analysis [14,24,31,35], which is unsuitable in representing the uncertainties that characterize the load as well as the DER outputs. The studies reported in [14,18,24,31,35] were modeled with a cost minimization objective. The authors focused on the formulation of the optimization techniques, and they did not pay adequate attention to the stochastic characterization of unknown variables such as the future location of DERs and the power output variations.
While the study in [1] considered both allocation and output uncertainty as well as probabilistic power flow, it applied a deterministic–active-based and approximate approach to the final sizing of the conductors for the active system. This paper expands on the conceptual work presented in [1]. The authors in [1] discussed the significance of DER allocation simulation and presented several case studies to evaluate different assumptions applied in DER allocation. The study used a deterministic–active-based CSS procedure to approximate the sizes of the conductors needed to support the maximum DER penetration on the network. In this paper, we propose a risk-based CSS method for new distribution electrification systems with DERs. The objective of the proposed method is to size conductors that meet the relevant QoS and loading limits while accurately accounting for the DER penetration on these networks.
A stochastic–probabilistic approach is taken to address the combination of uncertainties in the feeder design problem in three steps: firstly, initial conditions of conductor sizes are set by applying a passive feeder CSS method based on the winter load model. Secondly, the technical performance of the feeder under the objective DER penetration conditions is analyzed to identify feeder branches and nodes violating QoS and thermal loading limits. Thirdly, an iterative risk-based resizing technique is implemented, evaluating the compliance of the designed system in each iterative step. Such a comprehensive methodology addressing the combination of input uncertainties in the CSS formulation for new distribution electrification systems has not yet been proposed in the literature.
The contribution of this paper includes the formulation of a novel probabilistic and risk-based CSS approach that incorporates DER allocation and output uncertainties in the modeling exercise. This method is applicable in the design and selection of conductors for new electrification projects, where the DNOs are keen to incorporating high DER penetration.
The remainder of the paper is organized as follows. Section 2 outlines a detailed methodology for the proposed CSS process. Section 3 introduces the simulated case study and outlines the conducted process, the results obtained, and the analysis. Section 4 discusses the findings, and lastly, Section 5 provides the conclusion to the paper.

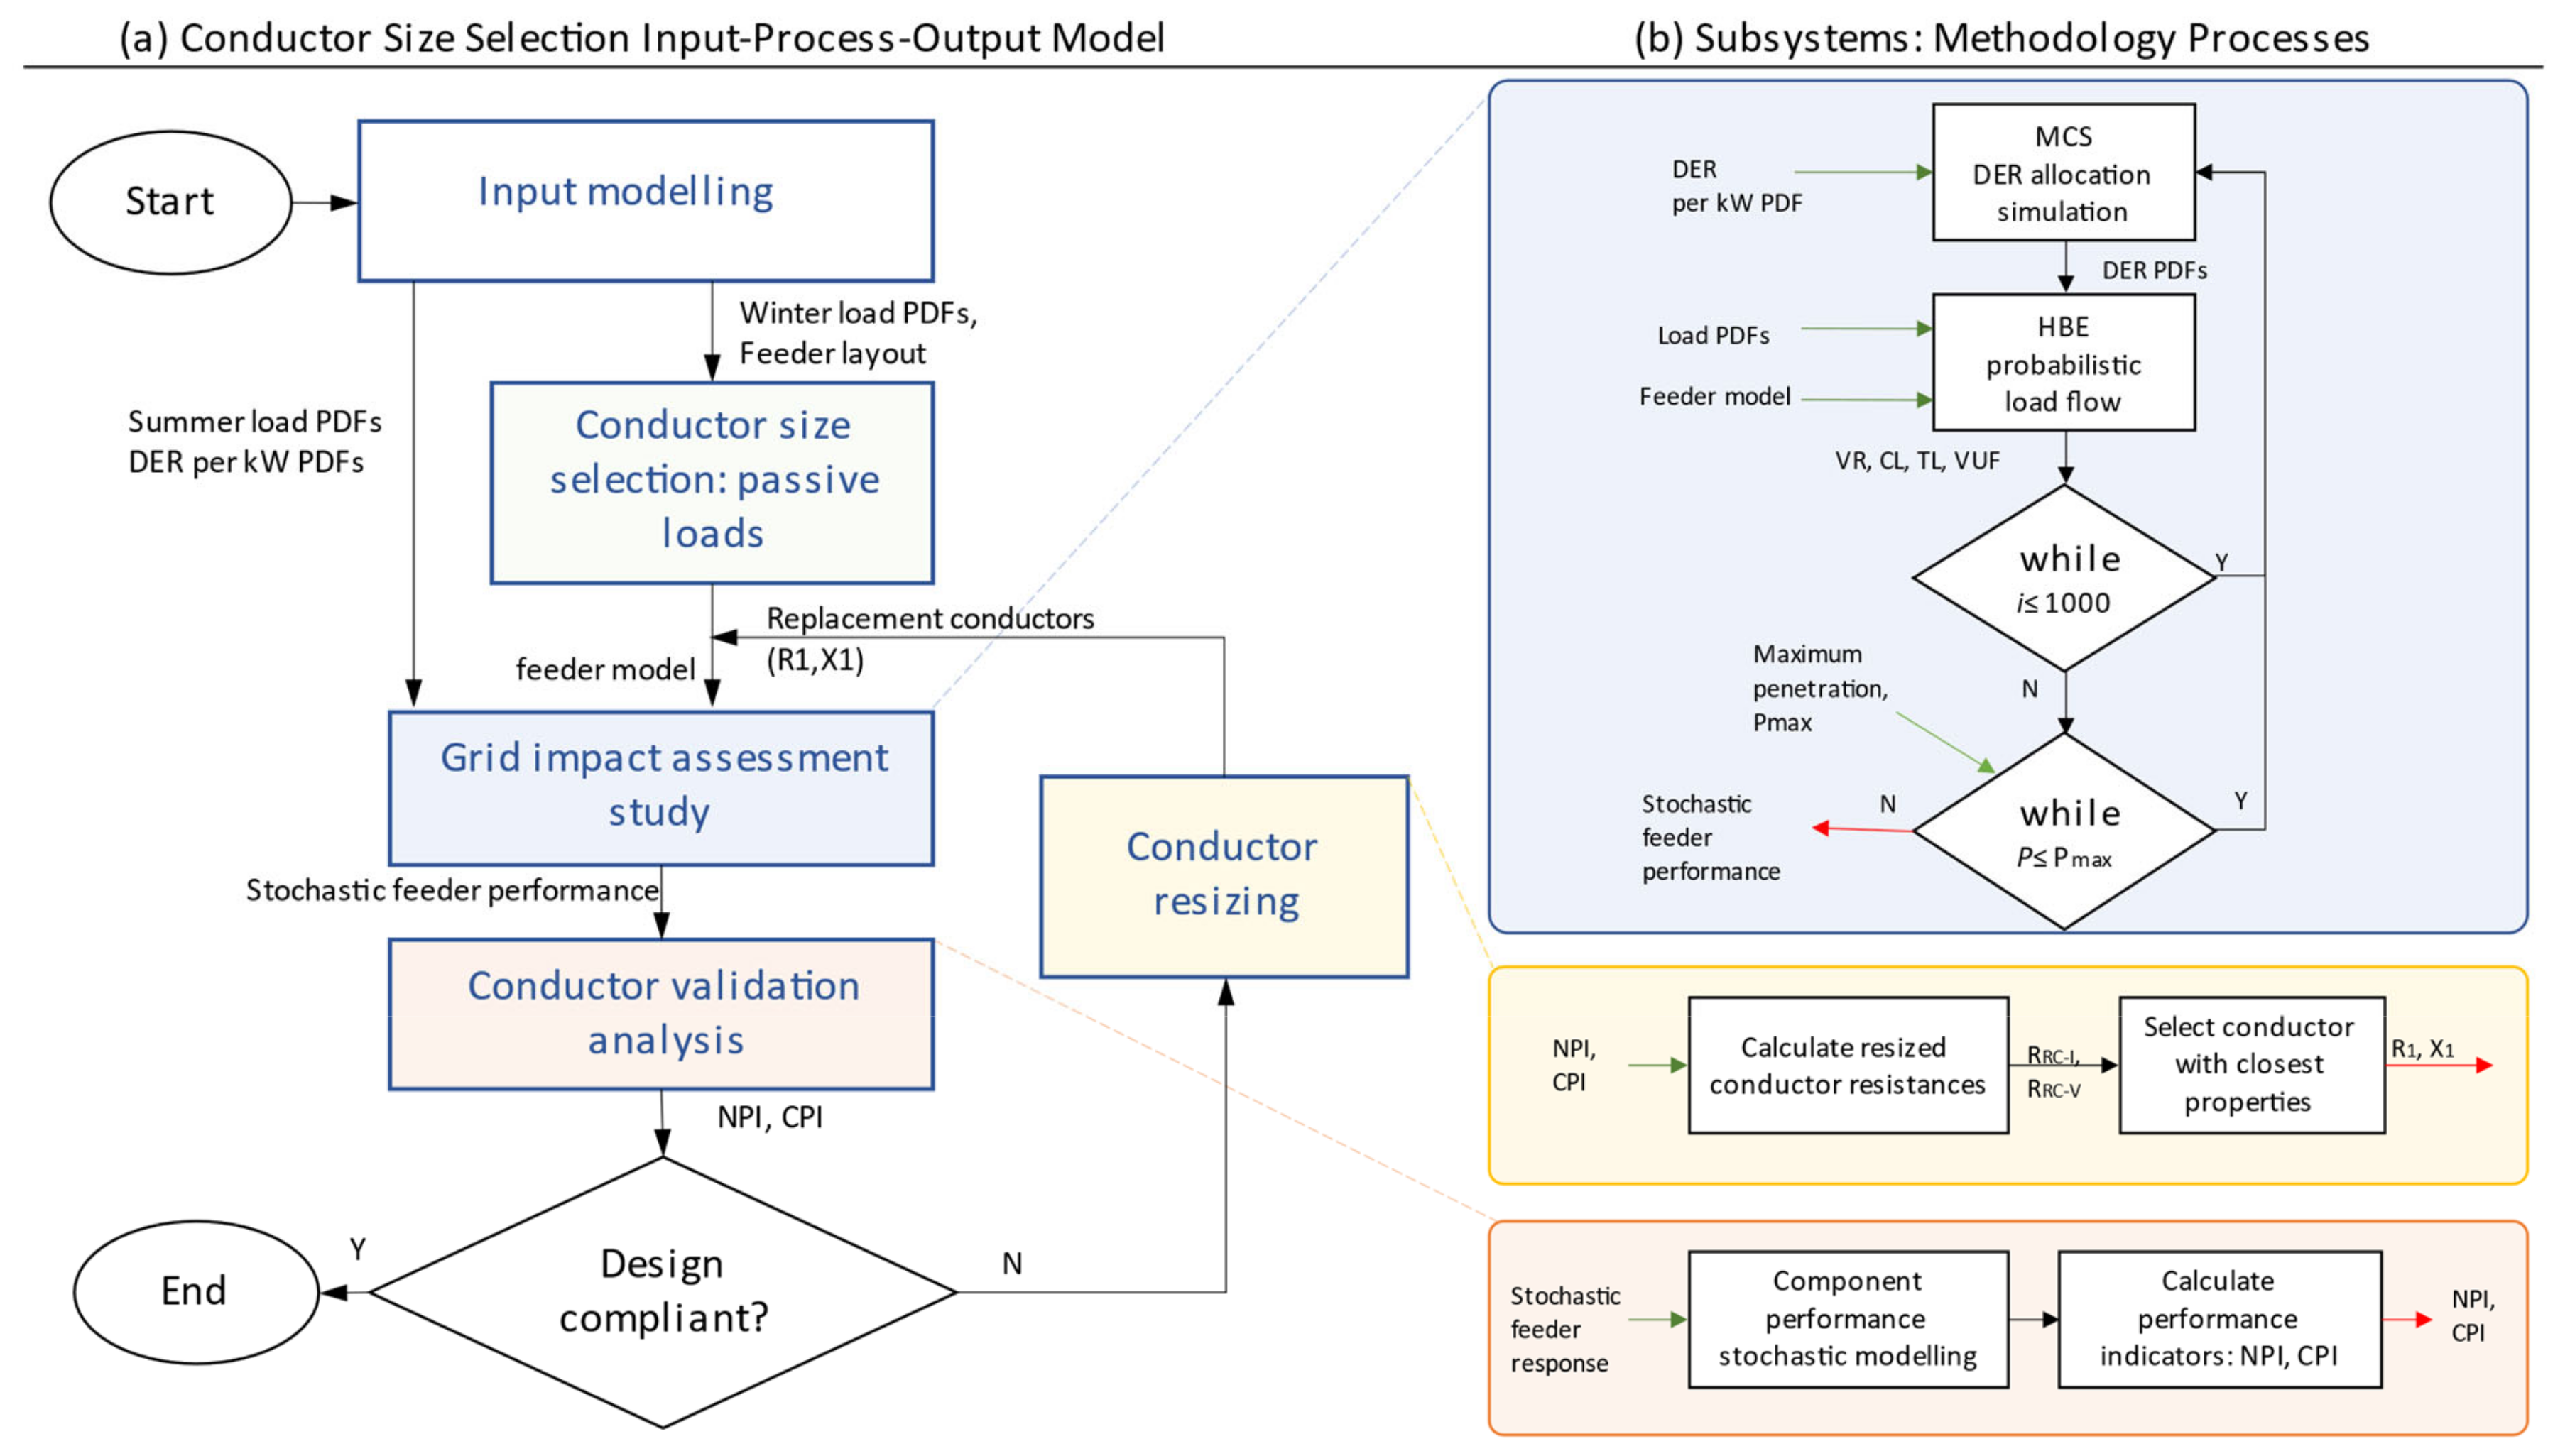
2. A Stochastic-Probabilistic CSS Methodology

Like most engineering systems, the proposed methodology hinges on three important components resembling an input–process–output (IPO) model. Input modeling is critical to ensure the characteristics of the feeder layout and the expected loads and DERs are accurately modeled. The “process” aspect of the model is split into two components: a grid impact assessment study and a conductor validation analysis. The comprehensive grid impact assessment study assesses the performance of the designed feeders—to test the adequacy of the system as a whole—according to a selected set of technical parameters drawn from the planning objectives. The conductor size compliance analysis assesses the performance of individual feeder branches and nodes to derive adjustment factors for resizing. The outputs are risk-based compliance indicators used in the resizing of conductors according to a defined directory of available conductors. Figure 1 illustrates the core components of the methodology, which are described in more technical detail in the sections that follow.

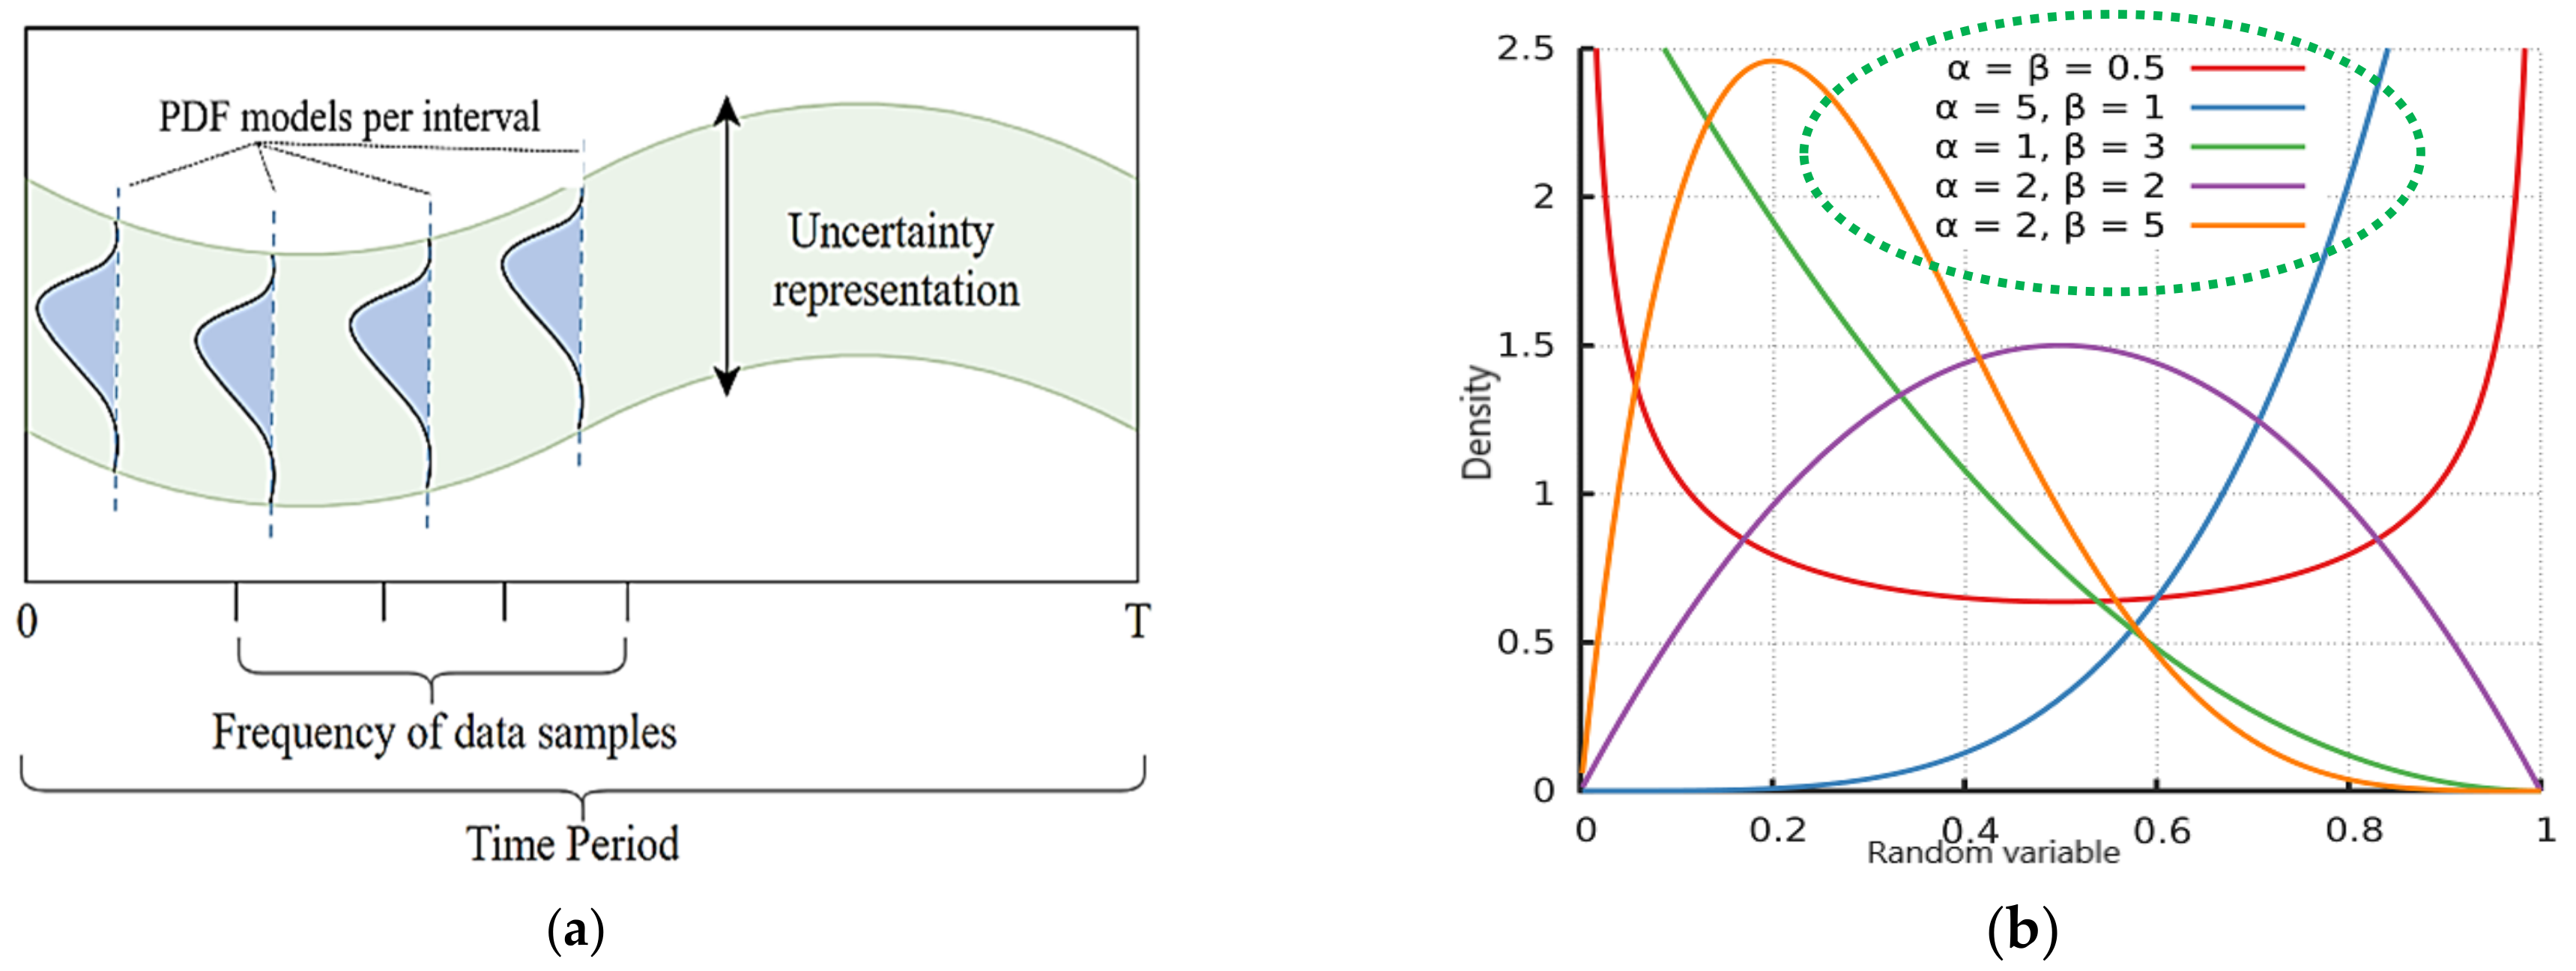
2.1. Input Modelling

Three models are critical inputs to the CSS problem: the feeder layout, expected loads, and DERs. The feeder layout aspects are mostly straightforward. Therefore, much attention is given to the description of the load and DER models. Table 1 provides the design technical constraints adopted for this paper.

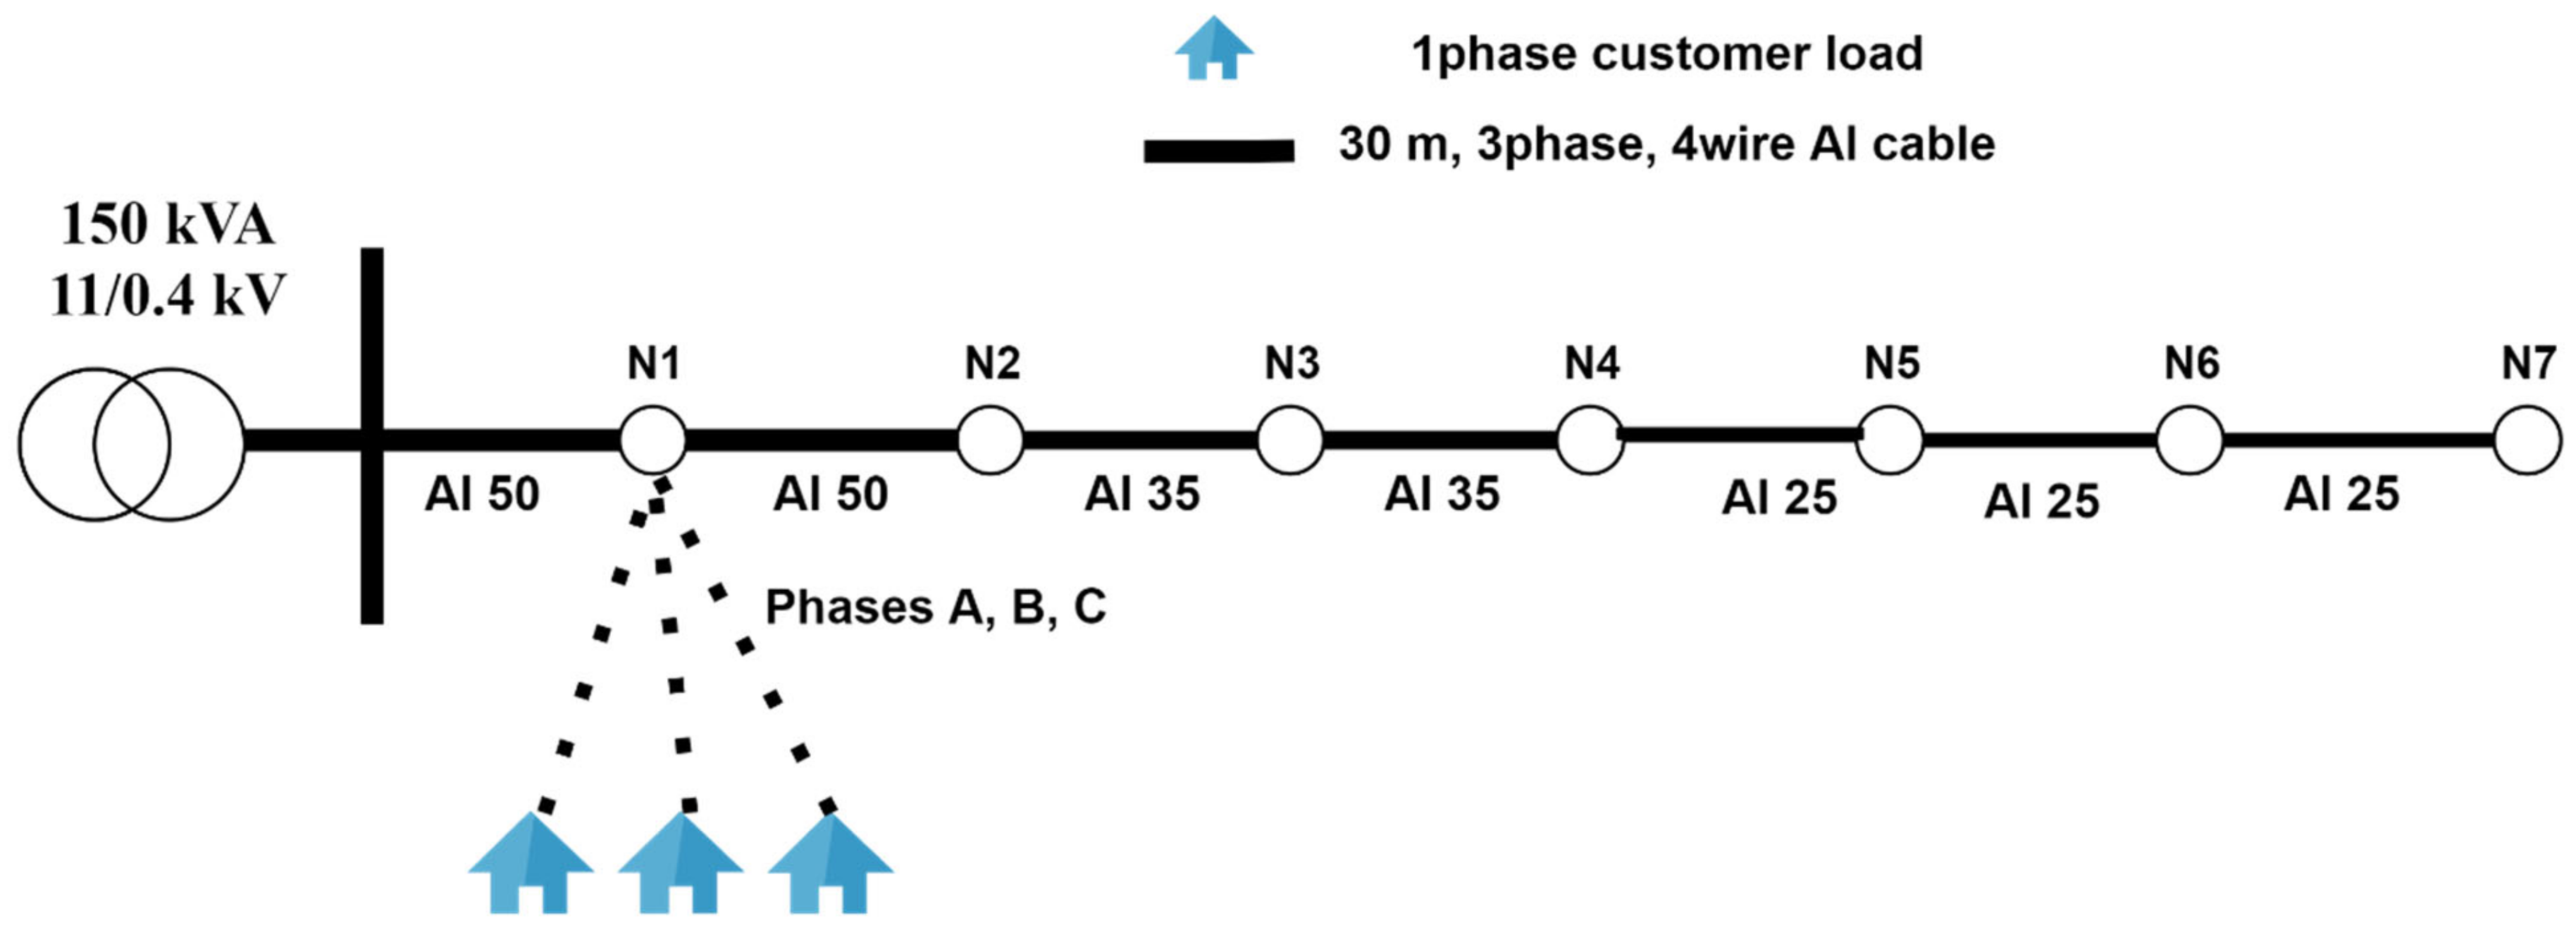
2.1.1. Distribution Feeder

A mathematical feeder model is generated from an electrical reticulation plan derived from the relevant development plans. According to a selected feeder layout, the key characteristics of the feeder model affecting its technical performance include the location of customers to node and distances between them. The placement of customers to phase must be carefully planned to achieve the most balanced arrangement possible. Arrangements such as cosine, cyclic, and balanced are commonly applied.
To complete the feeder model, electrical properties of the supplying feeder branches are required. Our approach requires some initial conditions of conductor sizes to initiate the simulation processes. We select the conductor sizes to firstly meet passive winter peak load conditions. In our local context, in South Africa, planners can easily use a design protocol based on a probabilistic load flow computation in an Excel environment [10]. The design protocol is published as part of the national standards [11] and has been improved for accuracy and extended application [37]. With the results from this passive design protocol, electrical properties (resistance, and reactance where applicable) are built into the feeder model.

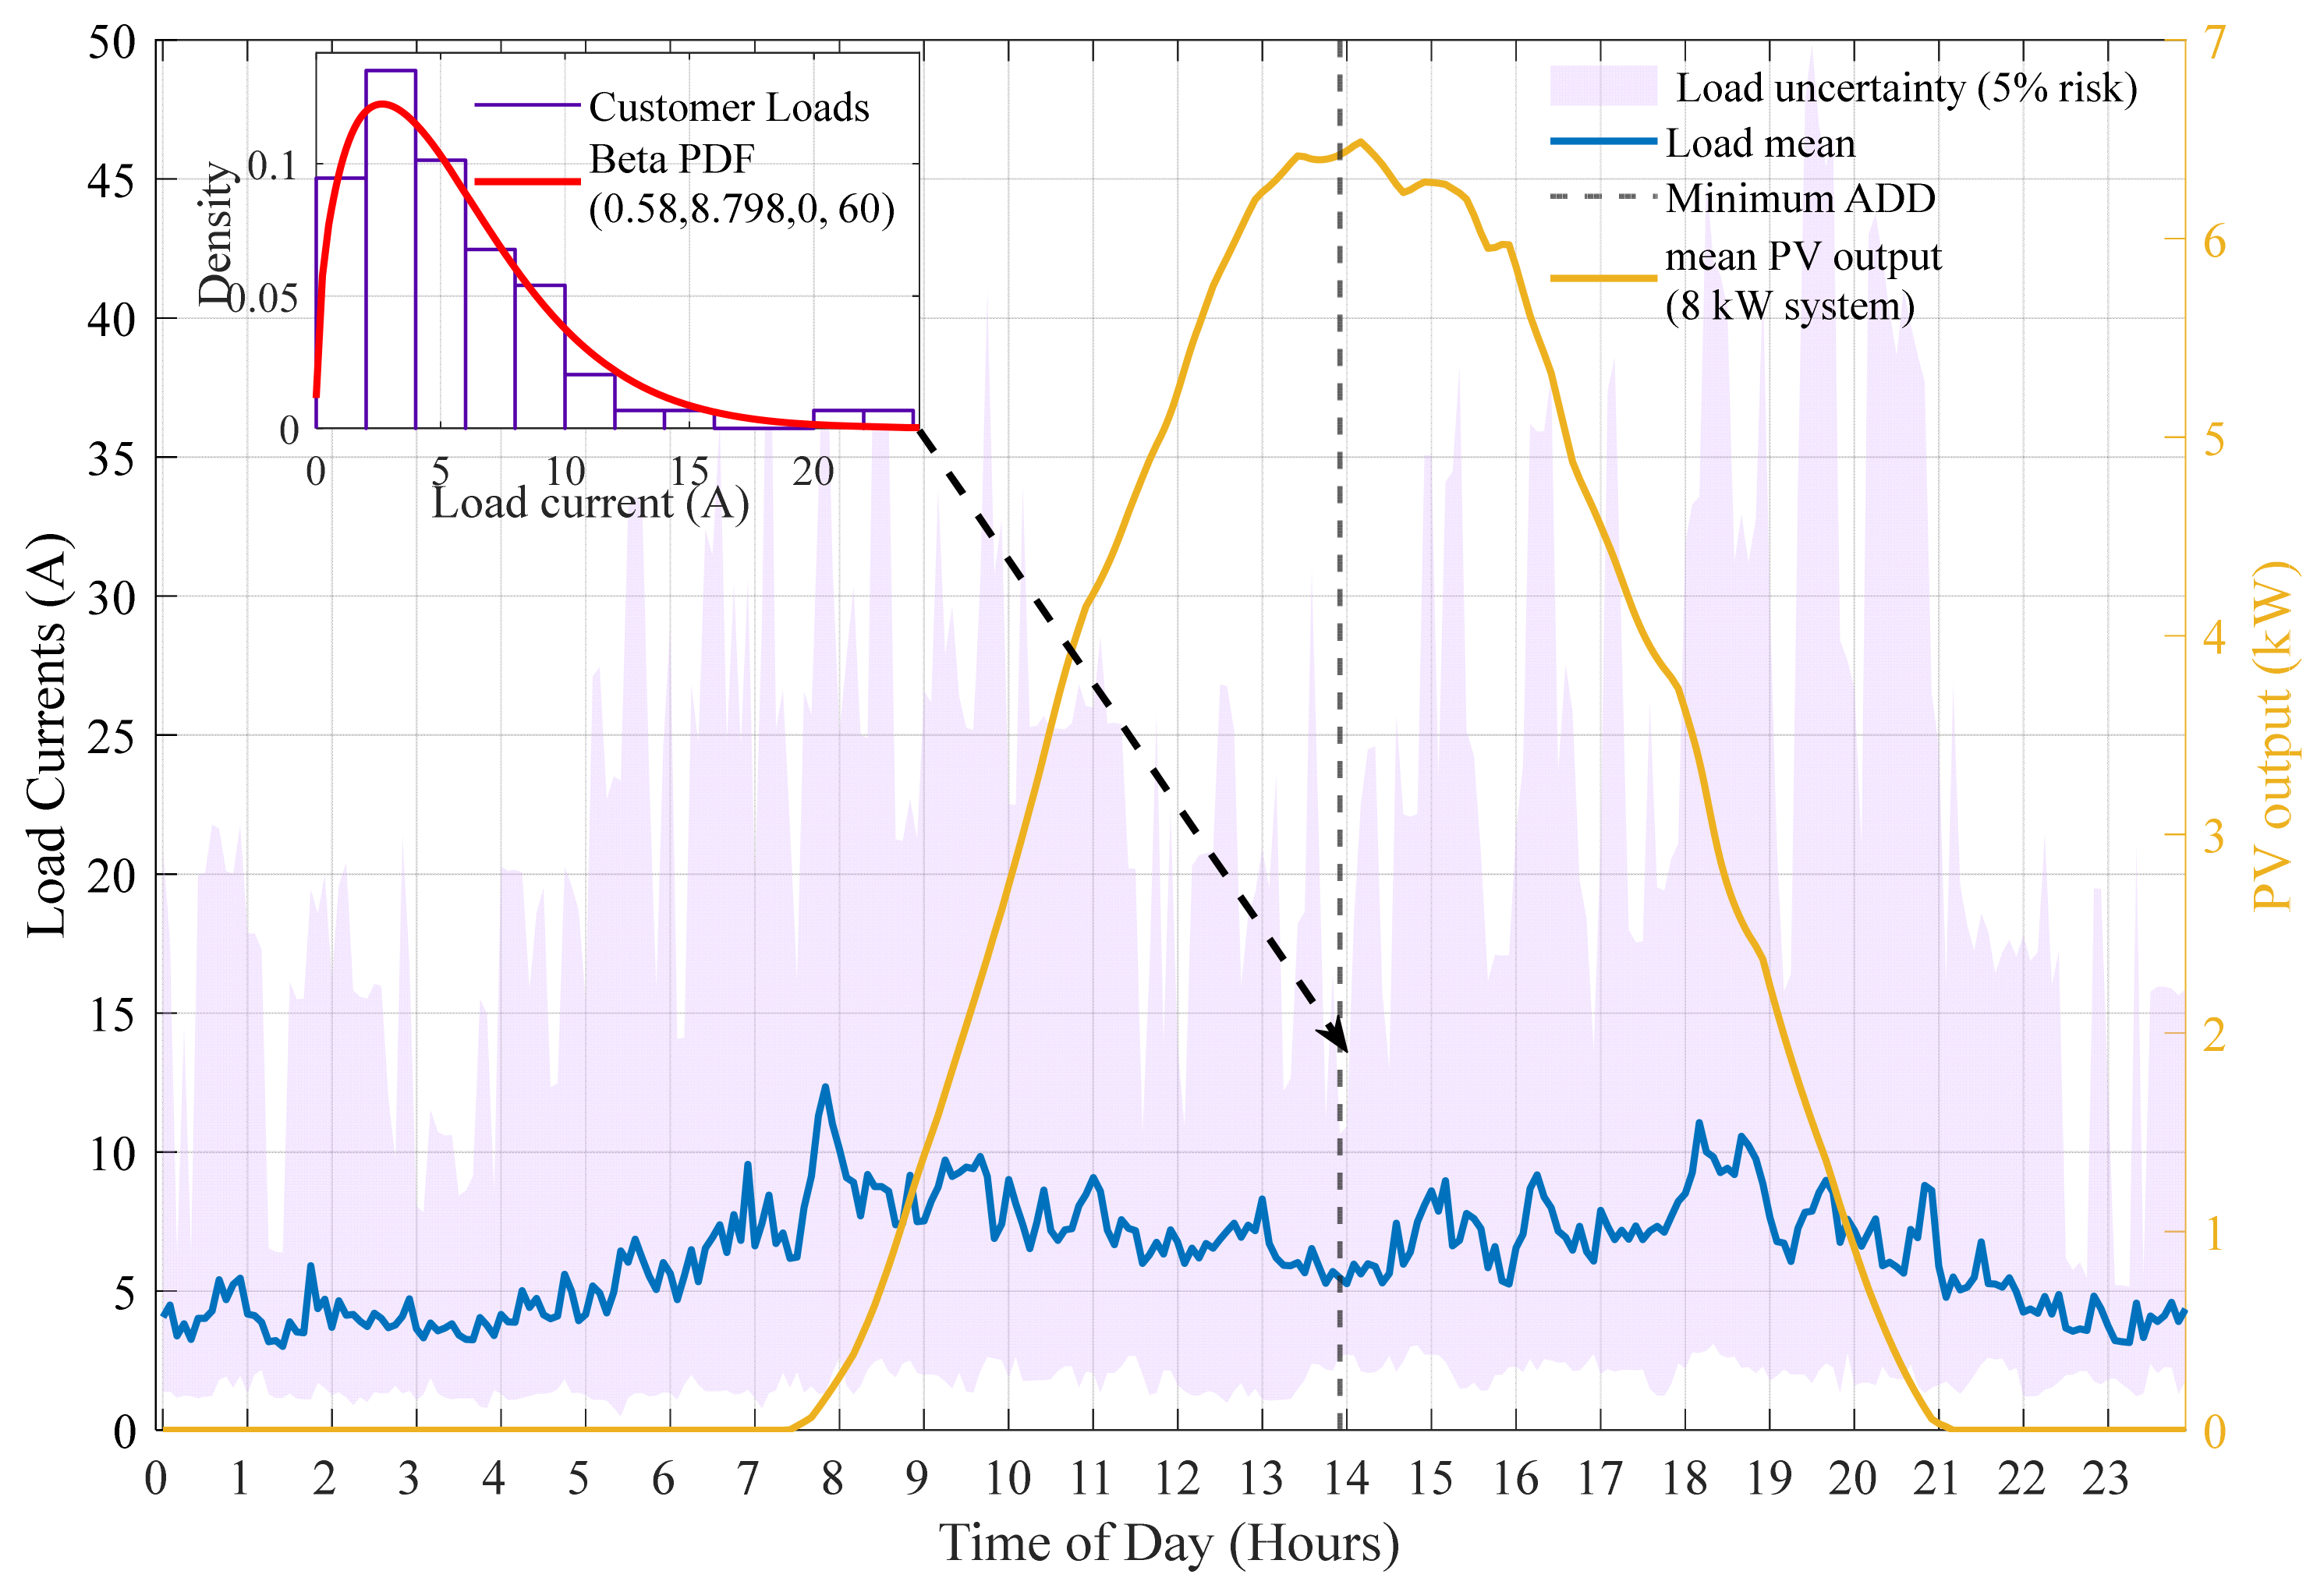
2.1.2. Customer Loads

This work builds on well-established statistical frameworks [10,11,38] and data repositories characterizing the expected customer loads according to their living standard measure (LSM), which considers various parameters including geographic (population density, climatic conditions, etc.), economic (income per household, employment, etc.), and social (occupants per household, dwelling type, etc.) data. This information is relevant in the planning of low voltage distribution networks. To accurately represent the expected load for grouped customers at an interval of time, an appropriate probabilistic distribution function (PDF) of the load, for that interval, is required. Based on the loads’ profile, each interval PDF can be determined, and the parameters of the PDF extracted and used in the modeling exercises. The application of PDF-based analysis enables the planner to stochastically represent the diversity of the loads, and this is illustrated in Figure 2a. The Herman Beta-Extended (HBE) design algorithm, used in the load flow computation in this paper, incorporates beta distribution in its probabilistic load modeling and is adopted as the standard national design tool for residential feeders in South Africa. Research on the HBE formulation is widely published in various studies [10,38,39,40]. Figure 2b shows the versatility of beta PDFs.
To accurately represent the diversity of the customer loads, a beta PDF is used to characterize the statistical properties of these loads for each interval of time. The HBE design algorithm incorporates load beta PDFs as inputs, during its load flow computation. The beta PDF parameters are defined using the alpha (α) and the beta (β) parameters, which are derived using the mean (µ) and the standard deviation (σ) of the customer loads, for a selected period. A scaling factor C, which is defined by the rated current of the customer’s circuit breaker, is also applied in the derivations [38,39].
The following equations define the relationships between the beta parameters of grouped customer loads [10]. In this study, a nominal voltage, Vnom, of 230 V is used.
µ (Cµ−µ2 −σ2)/Cσ2
β = (C−µ) (C−µ2−σ2)/Cσ2
ADMD (kVA) = (α/(α+β)) × C× (Vnom/1000)
From the available data, it is possible to characterize a target area according to the LSM classification and apply adjustment factors to reflect expected variations arising from specific climatic conditions, customer population, and planning horizon. The outputs are customer load samples defined in 5-min temporal resolution from which beta probabilistic density functions (PDFs) are modeled to represent the diversity of customer loads as illustrated in Figure 2a and the inset of Figure 3. Given the PDF representation of customer loads, the stochasticity of the loads can be simulated in a single pass calculation without the need for iterations. This is the essence of analytical PLF. When modeled across consecutive periods, both load variability and diversity can be intrinsically represented.
Figure 3 shows a typical minimum demand summer day for a high-end customer class that is expected to have a high affinity for PV systems. The inset shows a beta PDF extracted from the load data representing the diversity of customer loads during the interval of minimum demand occurring at 14h00. The mean profile for the expected PV output is also included, and its characteristics are discussed next. In this paper, we have adopted the use of a constant-current load model, which was found to be consistent with the residential loads in South Africa [39,41]. However, the proposed method is not limited to such representations and, where appropriate, other models outlined in [42], with voltage dependence, can be included in the input models.

2.1.3. Distributed Energy Resources

The purpose of this modeling exercise is to characterize DER power variations due to stochastic factors, which influence the DER power flow characteristics within a defined interval. This paper focuses on PV systems as the DER type. As such, the DER models characterize the variation of the power injected into the grid. We use the term ‘power export’—a term describing the distributed generation operation mode of DERs—to denote the flow of power into the grid. While this paper uses PV systems for illustration, the modeling principles are generally applicable to other DERs with the relevant adjustments.
To characterize the expected export power per kWp of installed systems, we use PVsyst software with area-specific irradiance data, which we assume is common to all customers on a feeder. Figure 3 shows the expected PV output in terms of export kilowatts for an 8 kWp system. From this expected (or mean) export power, we calculate the expected export currents and build uncertainty representation by applying a small variance factor (10% is used in this paper) to represent the diversity in the performance of different characteristics such as tilt angle, orientation, shading, and dust effects. Where field measurements are available, a more accurate characterization of the coincidence and correlation of PV generation can be performed. We simulate the worst-case conditions for PV output by modeling PV production during a period of high irradiance in summer. Such output can be statistically represented using a PDF with a low coefficient of variation, which implies a high coincidence of maximum PV output [16]. These conditions can be simulated using a beta distribution where the shape parameters, α and, β are equal, with a mean output of 0.5 kW. The shape parameters for the PV beta PDF can be described using Equation (4). A corresponding scaling factor CPV is modeled based on Equation (5). The PV system is modeled to operate at a unity power factor, which concurs with the current planning standards in South Africa.
α = β = 0.5 × ((1/4σ2) − 1)
CPV = (PPv × µPV)/(0.5 × Vnom)
Figure 3 also illustrates the expected PV output in terms of export kilowatts for an 8 kWp system. From these representations, stochastic simulation of customer PV generation profile samples can be generated. In the end, the DER power model is similar in structure to that of the loads and allows representation of diversity using the beta PDF, as seen in the inset of Figure 3. The grid impact assessment study is based on the summer load and DER models during an identified period of maximum PV impacts, which is usually indicated by peak PV generation.

2.2. Process Modelling

We define two processes critical to selecting appropriate conductors considering the range of possible loading (including DERs) conditions in the future.

2.2.1. Grid Impact Assessment Study

The objective of the processes described in this section is to assess the performance of the designed feeder to meet selected QoS and loading limits for the desired range of DER penetration, defined by the interval, 0 ≤ j ≤ Pmax. Pmax refers to the maximum allowable penetration while j refers to a level of penetration between 0 and the maximum. This feeder is designed based on the winter peak load, passive configuration conditions as set out in Section 2.1.1. or from iterative design trials to be discussed later.
Feeder performance assessment is conducted according to the DER penetration characteristics set out in the planning objectives, such as a target aggregated penetration level or individual export or import limits. However, the designed feeder needs to satisfy the technical limits under various DER penetration scenarios reflecting the gradual and considerably random DER uptake. To test this, we use a combined simulation approach involving a stochastic simulator for DER penetration scenarios and a probabilistic approach to the load flow calculation. This paper defines penetration as a ratio of the installed capacity of DER to FMD as follows:
DER penetration = 100 × [Rated DER capacity (kVA)/FMD (kVA)]%
The simulation protocol discussed here is adopted from a hosting capacity methodology presented in [16]. In the simulation, the feeder is loaded in increments of a unit DER size (1 kWp PV in this paper) from passive (i.e., 0% DER penetration) conditions until each customer reaches their export or import limits. At each penetration level in the simulated range, a random allocation process using the MCS method is performed to generate DER capacity and location scenarios on the feeder—1000 scenarios are used in this study. For each of these DER allocation scenarios at a constant penetration level, the per-unit DER model from Section 2.1.2. is scaled according to the MCS allocation characteristics, and a PLF analysis is performed to determine the feeder performance under each scenario. The Herman-beta extended (HBE) method—a single-pass beta PDF-based analytic-PLF method [37]—is used for load flow computation. It takes in beta PDF currents of customer loads and DERs (defined in Section 2.1.) and returns beta PDFs of bus voltages and branch currents. From these, five key technical parameters are calculated at a selected risk factor of 2.5%:
  • Voltage-rise (VR);
  • Voltage-drop (VD);
  • Conductor loading (CL);
  • Transformer loading (TL), calculated as the three-phase aggregated loading;
  • Voltage unbalance factor (VUF), calculated as the ratio between the maximum voltage deviation across the phases and the mean node voltage.
From these results, two forms of representations are achieved. The first assesses the feeder’s performance by taking the extremum record of all node and branch quantities in each PLF analysis. The second representation keeps the full load flow results per node and branch for assessment of individual components, from which the conductor validation analysis is developed.

2.2.2. Conductor Validation Analysis

The objective of the conductor validation analysis is to determine whether the feeder designed based on the passive winter peak load condition can meet the winter loading conditions and the PV generation required by the planner. To do this, we follow the following steps:
i.
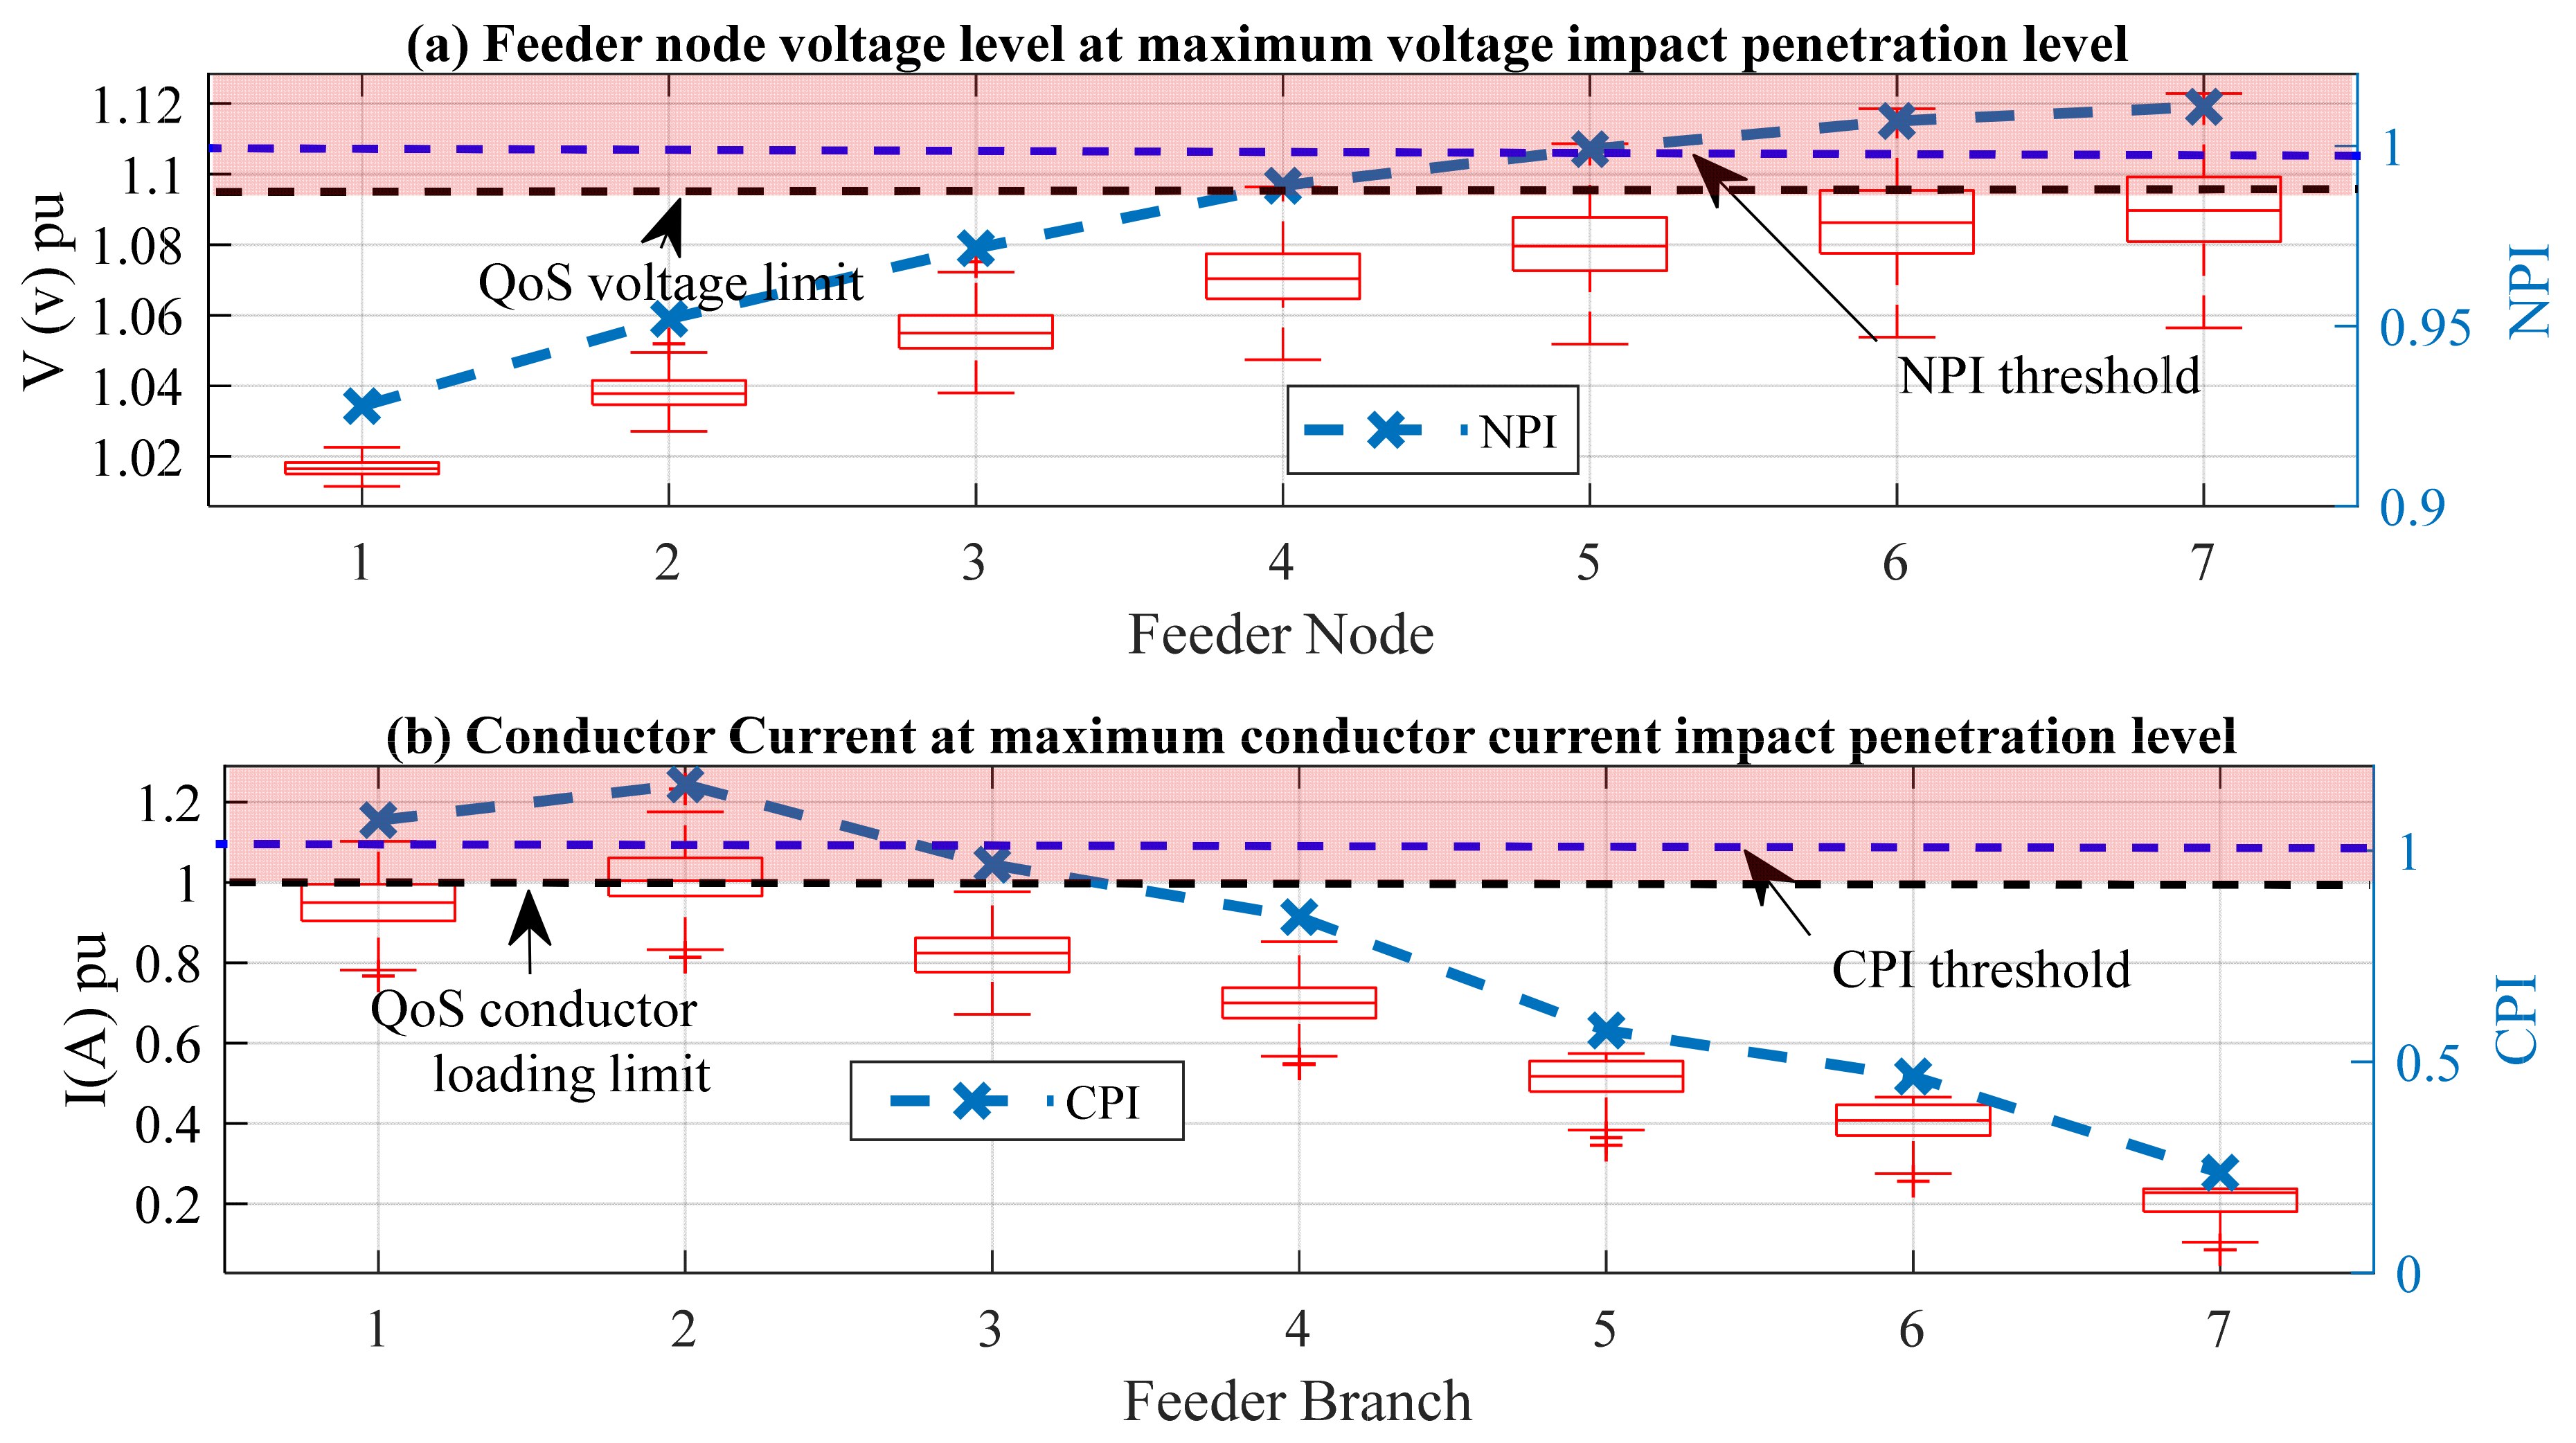
Based on the load flow results obtained from the grid assessment study, we identify the penetration level recording the maximum impact on voltage, p_v, and conductor loading, p_i.
ii.
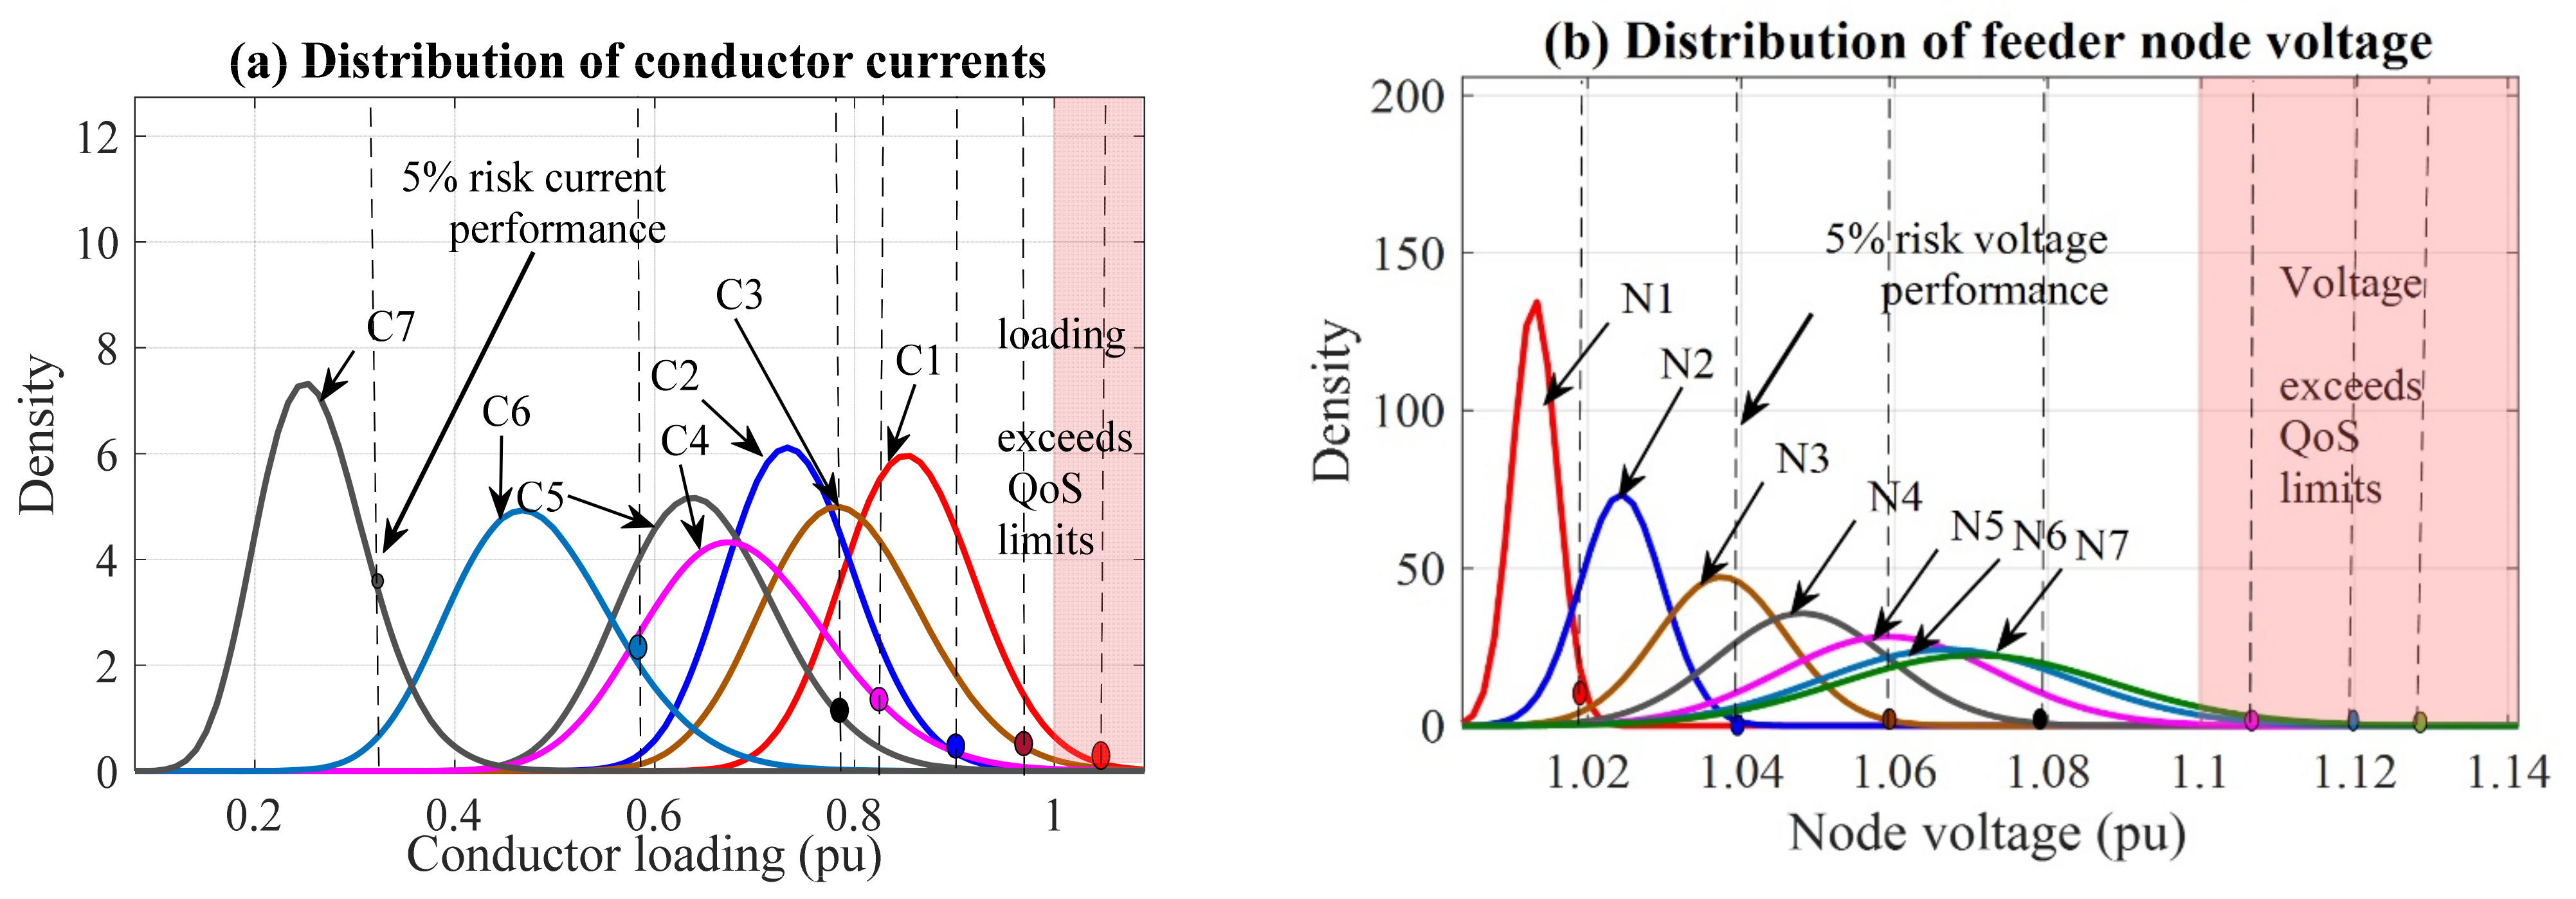
At these maximum impact penetration levels, we characterize using beta PDFs the stochastic performance of the conductor loading, CLBp_i, and node voltage, VRNp_q, results corresponding to the 1000 MCS DER allocation scenarios, for all branches, B, and nodes, N.
iii.
From the beta PDFs, risk-adjusted performance indices are determined by extracting the 97.5th percentile, reflecting a 2.5% risk level. Compounded with the 2.5% risk applied in the HBE load flow analysis, the overall design process’s risk becomes 5%, which satisfies feeder design standards [43]. The calculation of the conductor performance index (CPI) and the node performance index (NPI) are given in Equations (7) and (8).
CPI = prcntl (CLBp_i, 97.5)/CLlimit; for all branches, B
NPI = prcntl (VRNp_v, 97.5)/VRlimit; for all nodes, N
The CPI and NPI indices form the outputs of the conductor validation analysis passed to the resizing process.

2.2.3. Output Processing–Iterative Resizing

The conductor sizing approach is based on the foundation that the conductor size needs to satisfy two critical factors linked to feeder performance: voltage-change (-rise or -drop, depending on the power flow direction) and loading capacity. Accordingly, the resizing approach is driven by the CPI and NPI indices. Conductors with CPIs exceeding 1 (violation of thermal loading limits) or supplying a node with an NPI exceeding 1 (violation of voltage limits) are identified for resizing. Then, an adjustment process outlined below is applied to select replacement conductors:
i.
We estimate the resistance per km of the replacement conductor by scaling down the initial (or previous) per km resistance, R0, using the CPI and NPI indices. Equations (9) and (10) show the calculation of the resized conductor resistance, RRC-V, and RRC-I. RRC-V and RRC-I indicate the resized conductors based on voltage and conductor loading performance, respectively.
RRC-V = R0/NPI
RRC-I = R0/CPI
ii.
A replacement conductor with the closest and lower resistance per km to that of the resized conductors from Equations (9) and (10) is selected from a directory of available conductors, such as Table 2.
iii.
Once a conductor is selected, the feeder model is updated with the new conductor properties (R1, X1) and fed back as modified inputs for another iteration of the CSS simulation. The stop criterion is based on the compliance of all components (NPI, CPI ≤ 1) or the convergence of conductor selection, resulting from the unavailability of appropriate conductors in the available directory.
The influence of reactance on the resizing process is ignored due to the relatively low X/R ratios on LV distribution feeders and the short distances of the distribution lines.

3. Case Study Simulation, Results, and Analysis

We demonstrate the developed CSS approach using a simplified feeder design case study. A radial three-phase feeder supplying 21 residential LV customers is designed to allow PV export limits of 8 kWp per customer. As such the customer is allowed to install a PV system whose capacity ranges between 0 and 8 kWp. The customer loads, typical of a high-end, low-density suburb in South Africa, are used. Three single-phase customers are connected at each node. The distance between consecutive nodes is 30 m. Additional details of the design process are presented in the following sections.

3.1. Feeder Model

Figure 4 illustrates the configuration of the designed passive feeder. To focus the application on the CSS problem, we make a few assumptions on the supporting feeder model characteristics outside of the CSS problem. The feeder layout is radial, without spurs, and has seven supplying nodes. Each node supplies three single-phase customers arranged in a balanced-111 phase allocation, denoting single-phase customer configuration. The distance between the nodes is 30 m. A 150 kVA distribution transformer services the feeder.

3.2. Load and DER Models

Table 3 outlines the statistical parameters of the representative load and PV generation models for a low-density suburb in South Africa in which uptake of PV is highly probable and the customers in the area are categorized in the same LSM class, reducing the diversity in the consumption patterns. The winter load model describes the expected distribution of load currents during the winter maximum demand period, while the summer model represents the load distribution for the summer minimum demand. Both models are valid in 5-min intervals. The summer model is necessary to define the feeder conditions at the point of maximum PV output. The winter model is used to quantify the FMD, which, in turn, is used in quantifying the PV penetration levels. A conservative load power factor pf 0.95 lag is applied. PV output is modeled at unity power factor in line with South Africa’s grid codes [44]. PV production is modeled using a peaky PDF to reflect the expectation of highly coincident currents with minimal variance.
The PV model characterizes the diversity of export currents from a 1 kWp installation linked to differences between customer installation characteristics and varying system efficiencies.

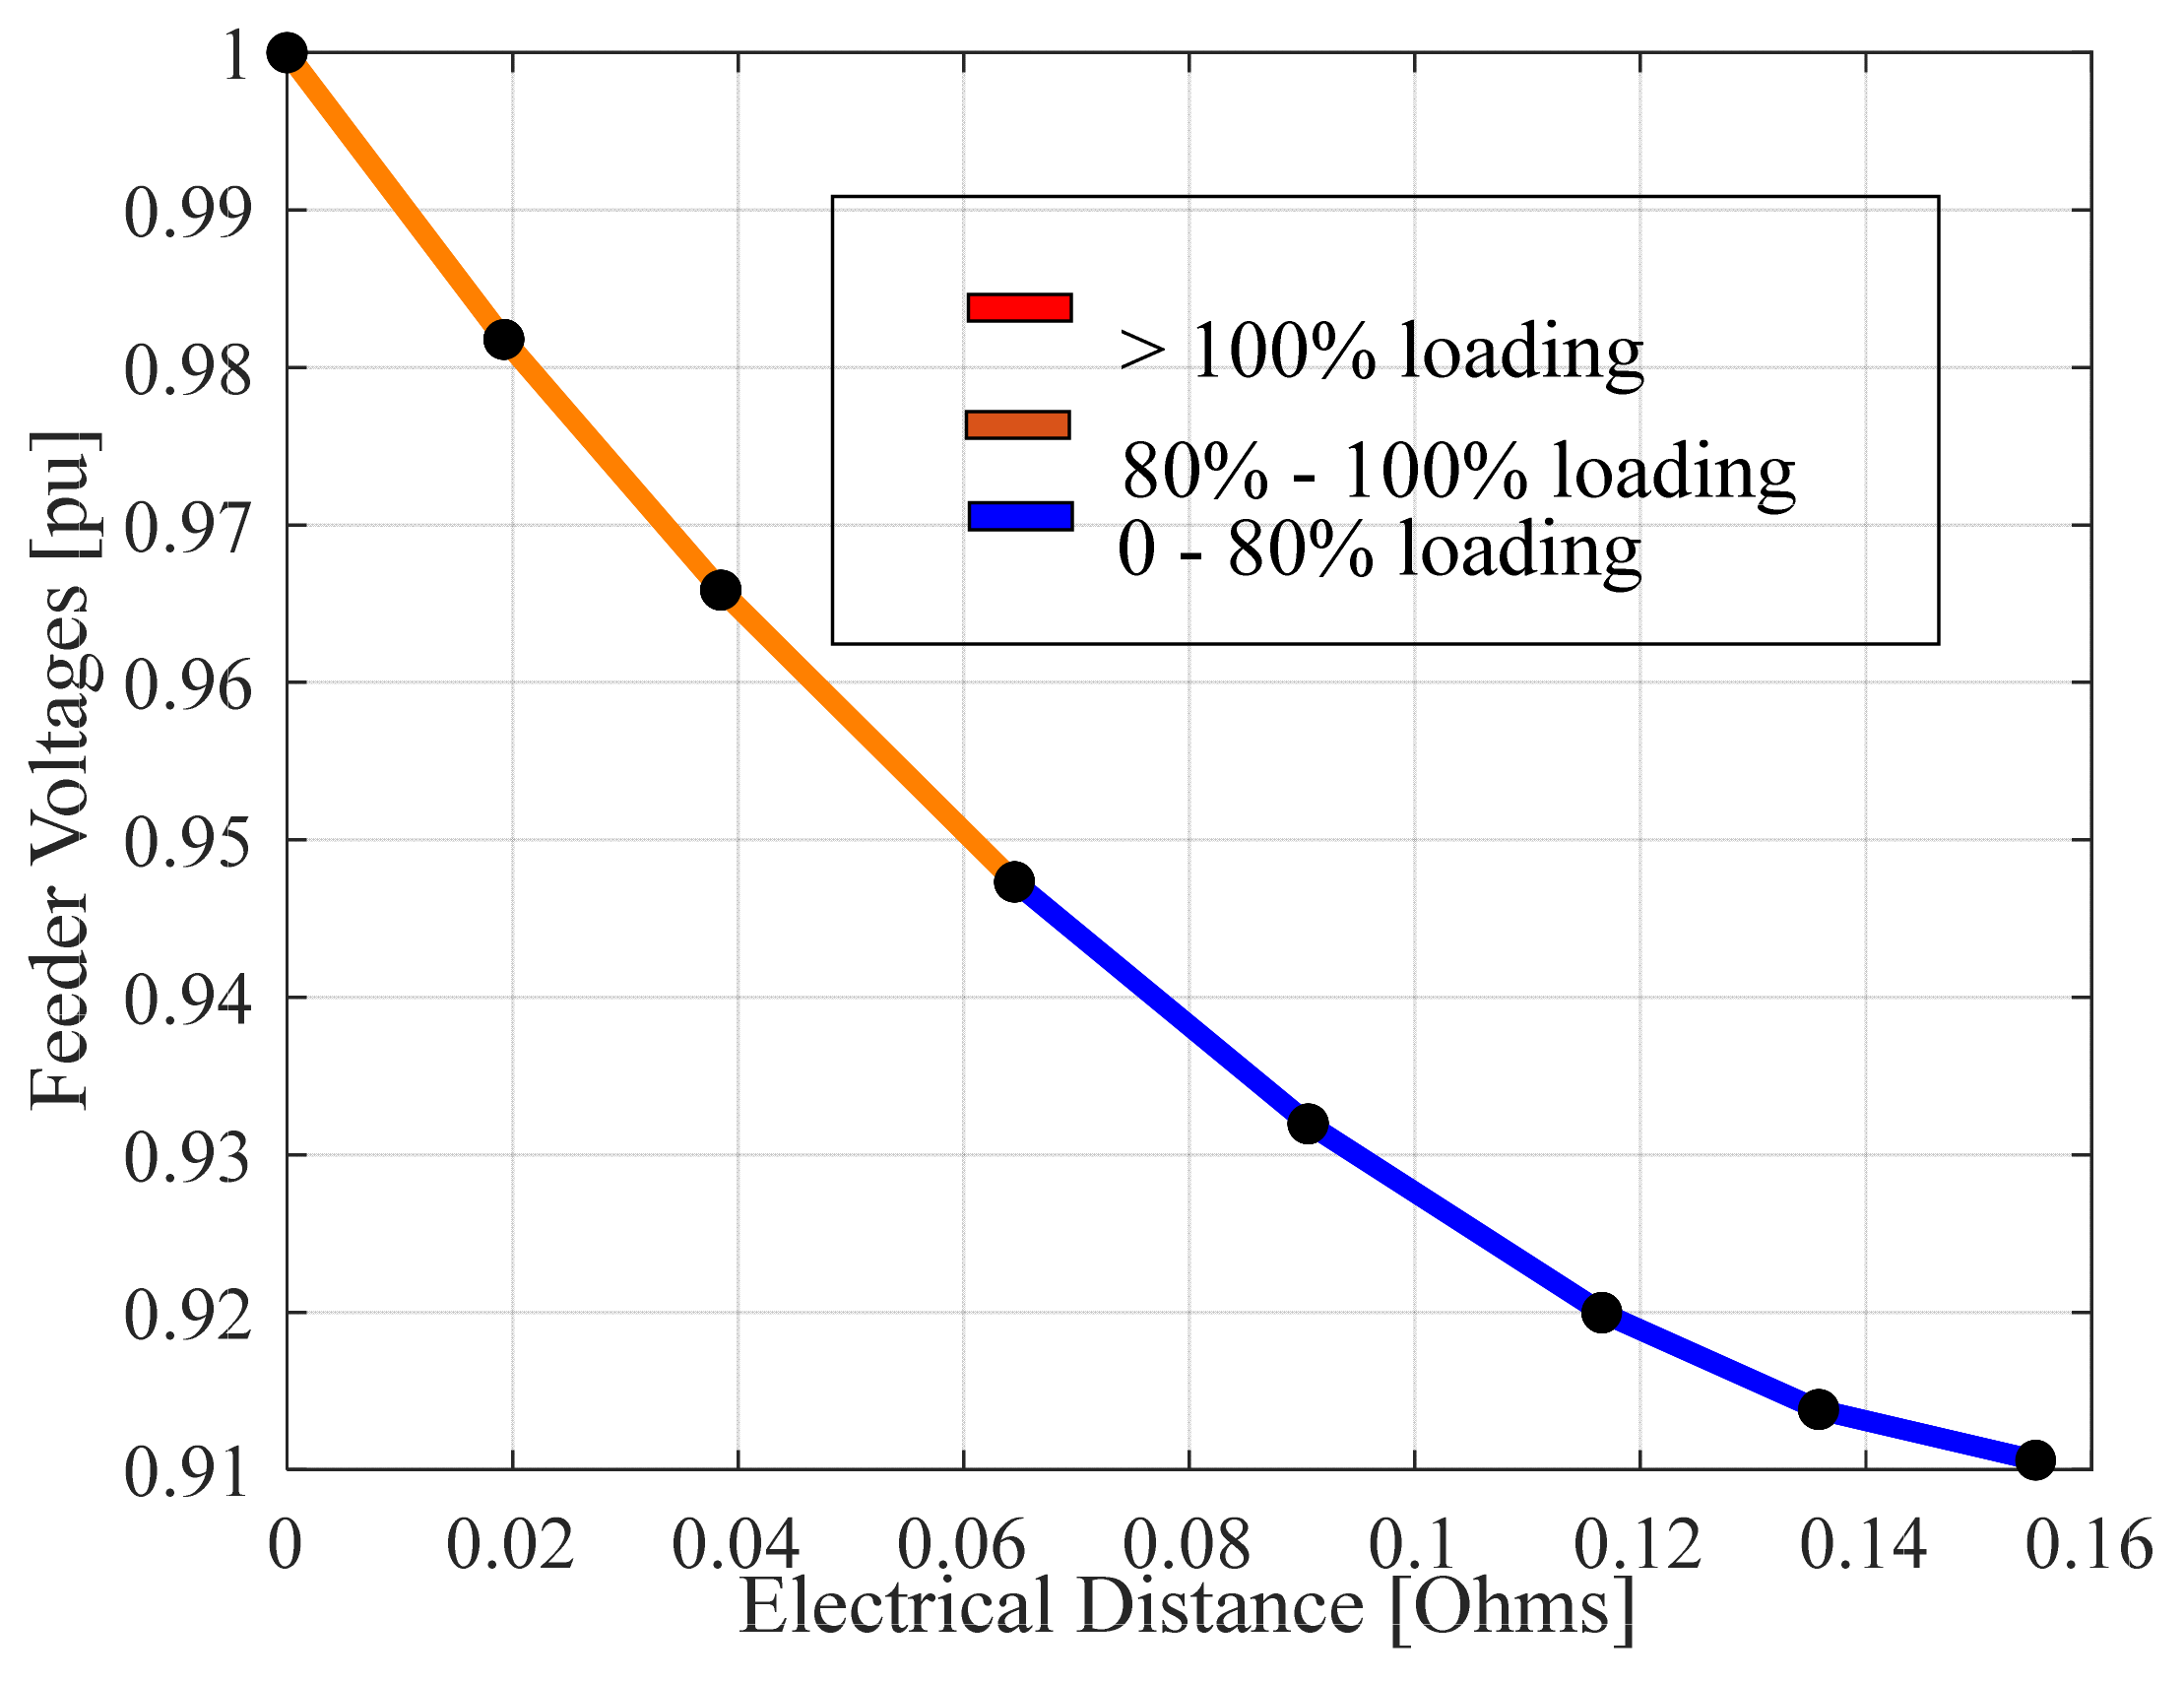
3.3. Initial Feeder Design

A passive feeder is designed according to the existing guidelines for passive feeder design in South Africa to meet the winter peak load and the QoS requirements based on the winter load model (provided in Table 3) alone without consideration of PV generation. The selected conductors are the initial conditions on which we apply our two-step test criteria. The characteristics of the conductors and the performance of these initial feeder conductors are indicated in Figure 4 and Figure 5, respectively. The feeder properties are recorded under Case 1 of Table 4. With these initial conditions, we perform a grid impact assessment to evaluate the suitability of the traditionally designed feeder to host a maximum of 8 kWp of PV per customer and the need for resizing.

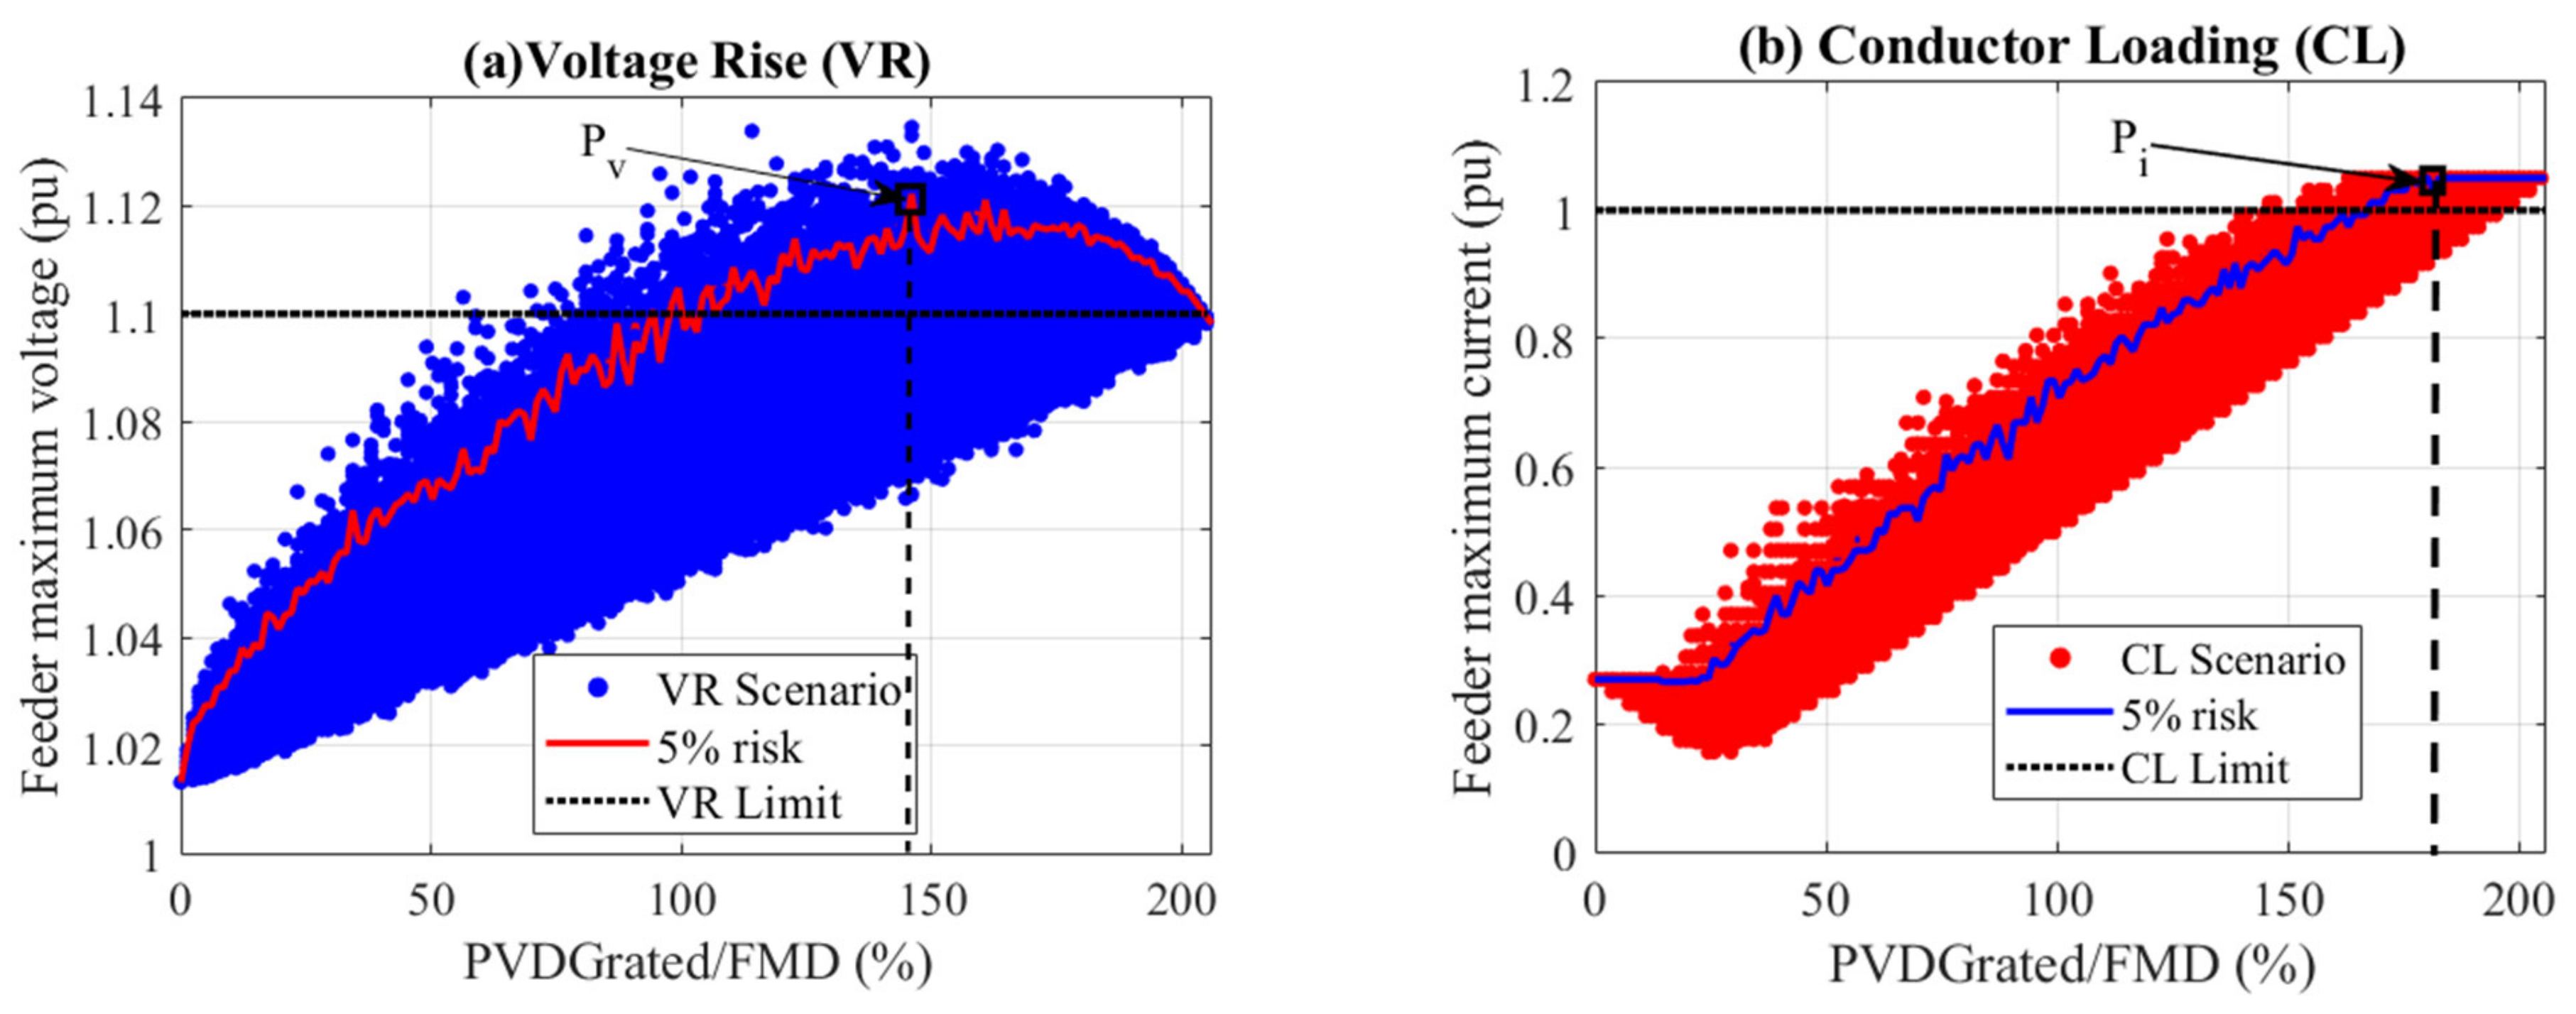
3.4. Grid Impact Assessment and Conductor Validation Analysis for the Initial Design

A grid impact assessment is conducted on the passive feeder (designed without consideration of PV) as elaborated in Section 2.2.1. Summer load and PV generation models (provided in Table 3) are used in the assessment of the feeder performance during the period of maximum PV generation. In the impact assessment study, the feeder is incrementally loaded with PV in a stepwise manner and 1000 MCS DER allocation scenarios are simulated in each step. An HBE-PLF records the load flow results for each MCS-DER trial. Results are presented in the form of scatterplots.

3.4.1. Interpretation of Scatterplots

Figure 6 shows the scatterplots obtained from the grid impact assessment study of the initial feeder design. Each scatter-point records the feeder-wide extremum condition of each technical parameter based on an HBE-PLF at 2.5% risk. At each penetration level, at a fixed x-axis value, there are as many scatter points on the y-axis as the number of considered DER allocation scenarios. The x-axis range reflects the increasing PV penetration from 0% (passive) to a maximum where each customer installation is equal to the set individual export limit. Hence, the scatterplots converge to a single point (no variation in the y-axis) at the maximum allocation scenario. In general, the scatterplot shapes replicate the combined effects of PV penetration and allocation to node and phase.
From Figure 6a, there is a reduction in voltage impacts from the point of maximum impact to the full penetration level. This reflects a decrease in voltage rise effects resulting from the unbalanced allocation of single-phase PV systems before each customer attains the possible maximum PV allocation capacity of 8 kWp. The ‘elbow’ point seen in the conductor loading impacts in Figure 6b indicates the reversal of current flow as PV penetration offsets the loads in most conductors.
A risk-trendline computed at 2.5% risk of the allocation impacts in each penetration level is indicated by a continuous line in all scatterplots. Since the scatter-points already represent 2.5% of risk taken in the HBE-PLF, the risk trendline represents a 5% risk in the whole design process. Conclusions on feeder performance are based on the risk trendline, which denotes the feeder’s risk-adjusted-performance.

3.4.2. Discussion of the Performance of the Initial System Design

From Figure 6, several deductions can be made regarding the performance of the initial feeder design.
i.
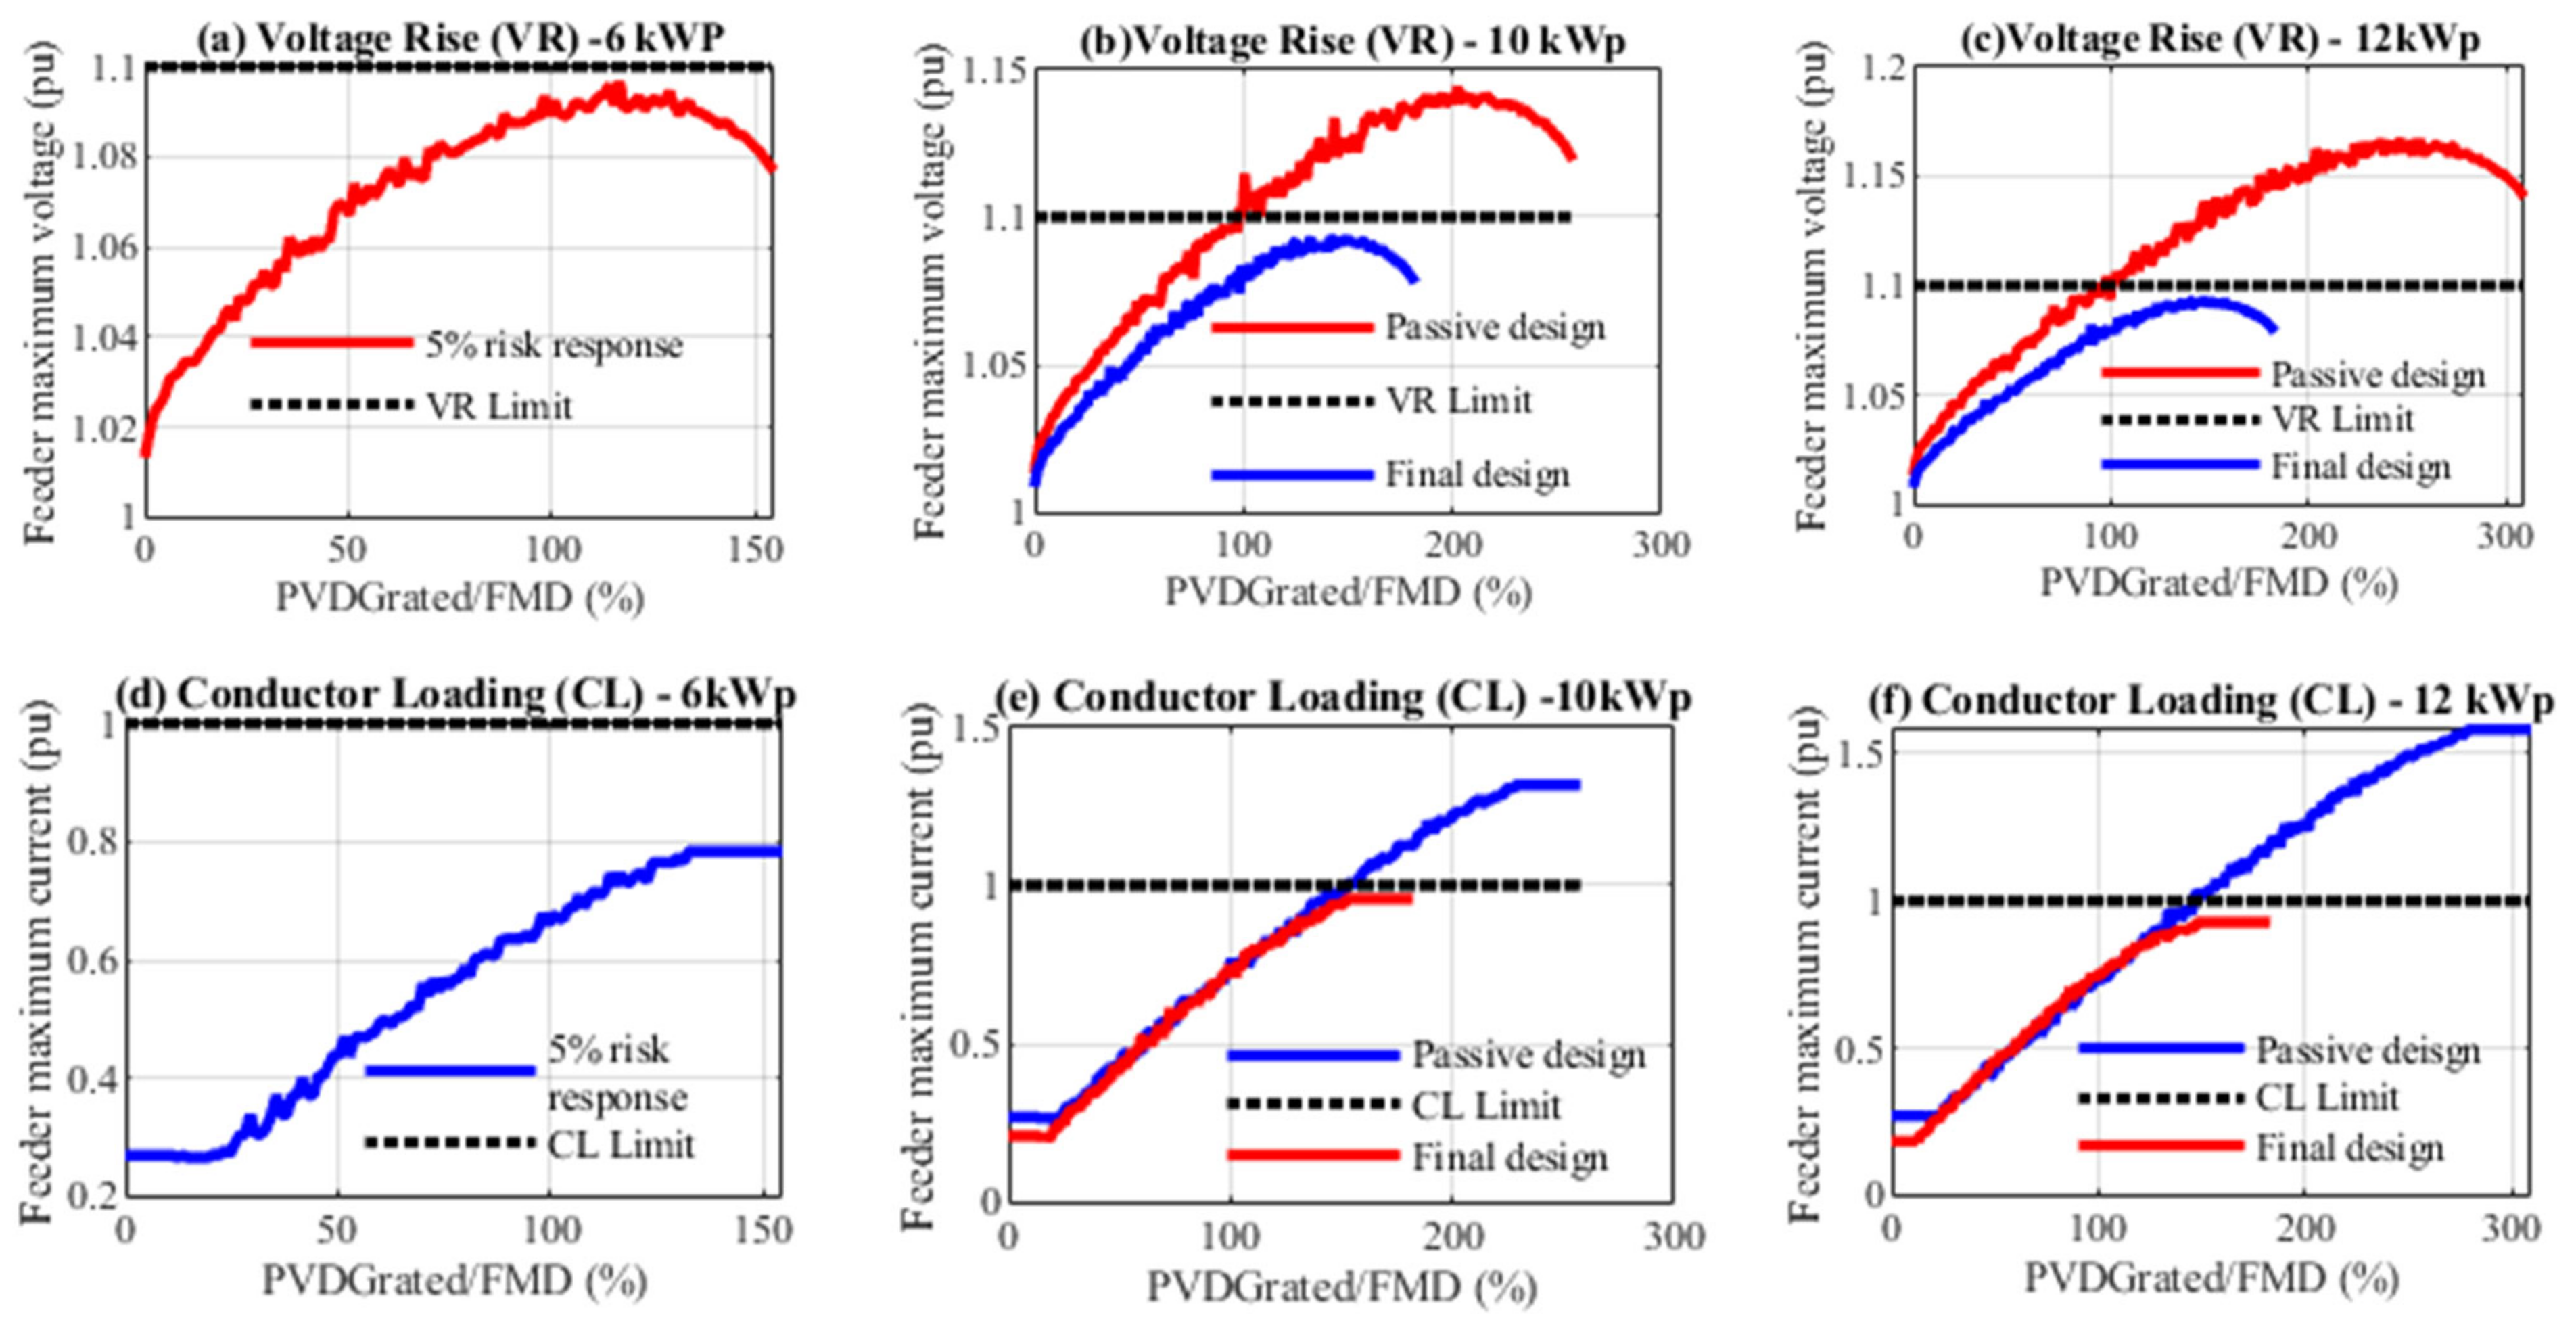
Based on voltage impacts (Figure 6a), the feeder can accommodate penetration up to 100% of FMD (81.5 kWp) and between 205% (162 kWp) and the simulated maximum (162 kWp). The feeder violates voltage limits between 125% and 205% penetration, which indicates that future penetration scenarios falling in this range have a high likelihood for overvoltage conditions.
ii.
Based on conductor loading impacts (Figure 6b), the feeder can accommodate a PV capacity of up to 160% of FMD (130.5 kWp). All penetration scenarios above this limit violate thermal loading limits.
iii.
Combining the limits, the feeder can only host penetrations up to 100% (81.5 kWp), which corresponds to 48.5% of the desired penetration.
Based on this performance, it is conclusive that the initial passive feeder design cannot accommodate the desired PV penetration level. Table 5 summarizes the permissible penetration limits considering a 5% design risk level.

3.4.3. Conductor Validation Analysis

From the stochastic feeder performance of Figure 6, we identify the risk-adjusted penetration level with maximum impacts for voltage (P_v) and conductor loading (P_i), which are 148% and 170% of FMD, respectively, (marked with squares in Figure 6).
The stochastic performance of individual conductors and nodes at penetration levels p_i and p_v is plotted in Figure 7a,b, respectively. The PDFs characterize the distribution of conductor loading and voltage conditions from the HBE-PLF results at 2.5% risk corresponding to the 1000 MCS PV allocation scenarios. Essentially, the PDFs model each component’s response to various PV allocation scenarios.
Each PDF’s 97.5th percentile, which represents each component’s performance considering 2.5% risk in the occurrence of PV allocation scenarios, is marked with dotted lines. These risk lines represent risk-adjusted performance at 5% risk (2.5% in the HBE-PLF and 2.5% in the MCS allocation). Conductors and nodes whose risk lines fall within the shaded region violate conductor loading and voltage QoS limits, respectively. The quantitative identification of the components in violation is made through performance indices, NPI and CPI, for voltage and loading, respectively. Figure 8 shows the performance indices and the progression of voltage-rise and conductor loading on the feeder. The NPI and CPI thresholds, set to one marked in broken lines, identify the conductors requiring resizing.
As expected, voltage rise increases with electrical distance from the source towards downstream nodes, as seen in the boxplots of Figure 8a. Conversely, as shown in Figure 8b, conductor loading is higher at the upstream conductors where the reverse power flow aggregates from downstream PVs. Looking at the CPIs represented at 5% design risk, conductor 1 exceeds the threshold indicating the need for resizing. Likewise, by looking at the NPI threshold, nodes 5, 6, and 7 exceed the voltage QoS constraints. This analysis, therefore, identifies conductors 1, 5, 6, and 7 for resizing to meet the respective technical limits and improve the active feeder performance towards the desired PV penetration level set out in the design specifications.

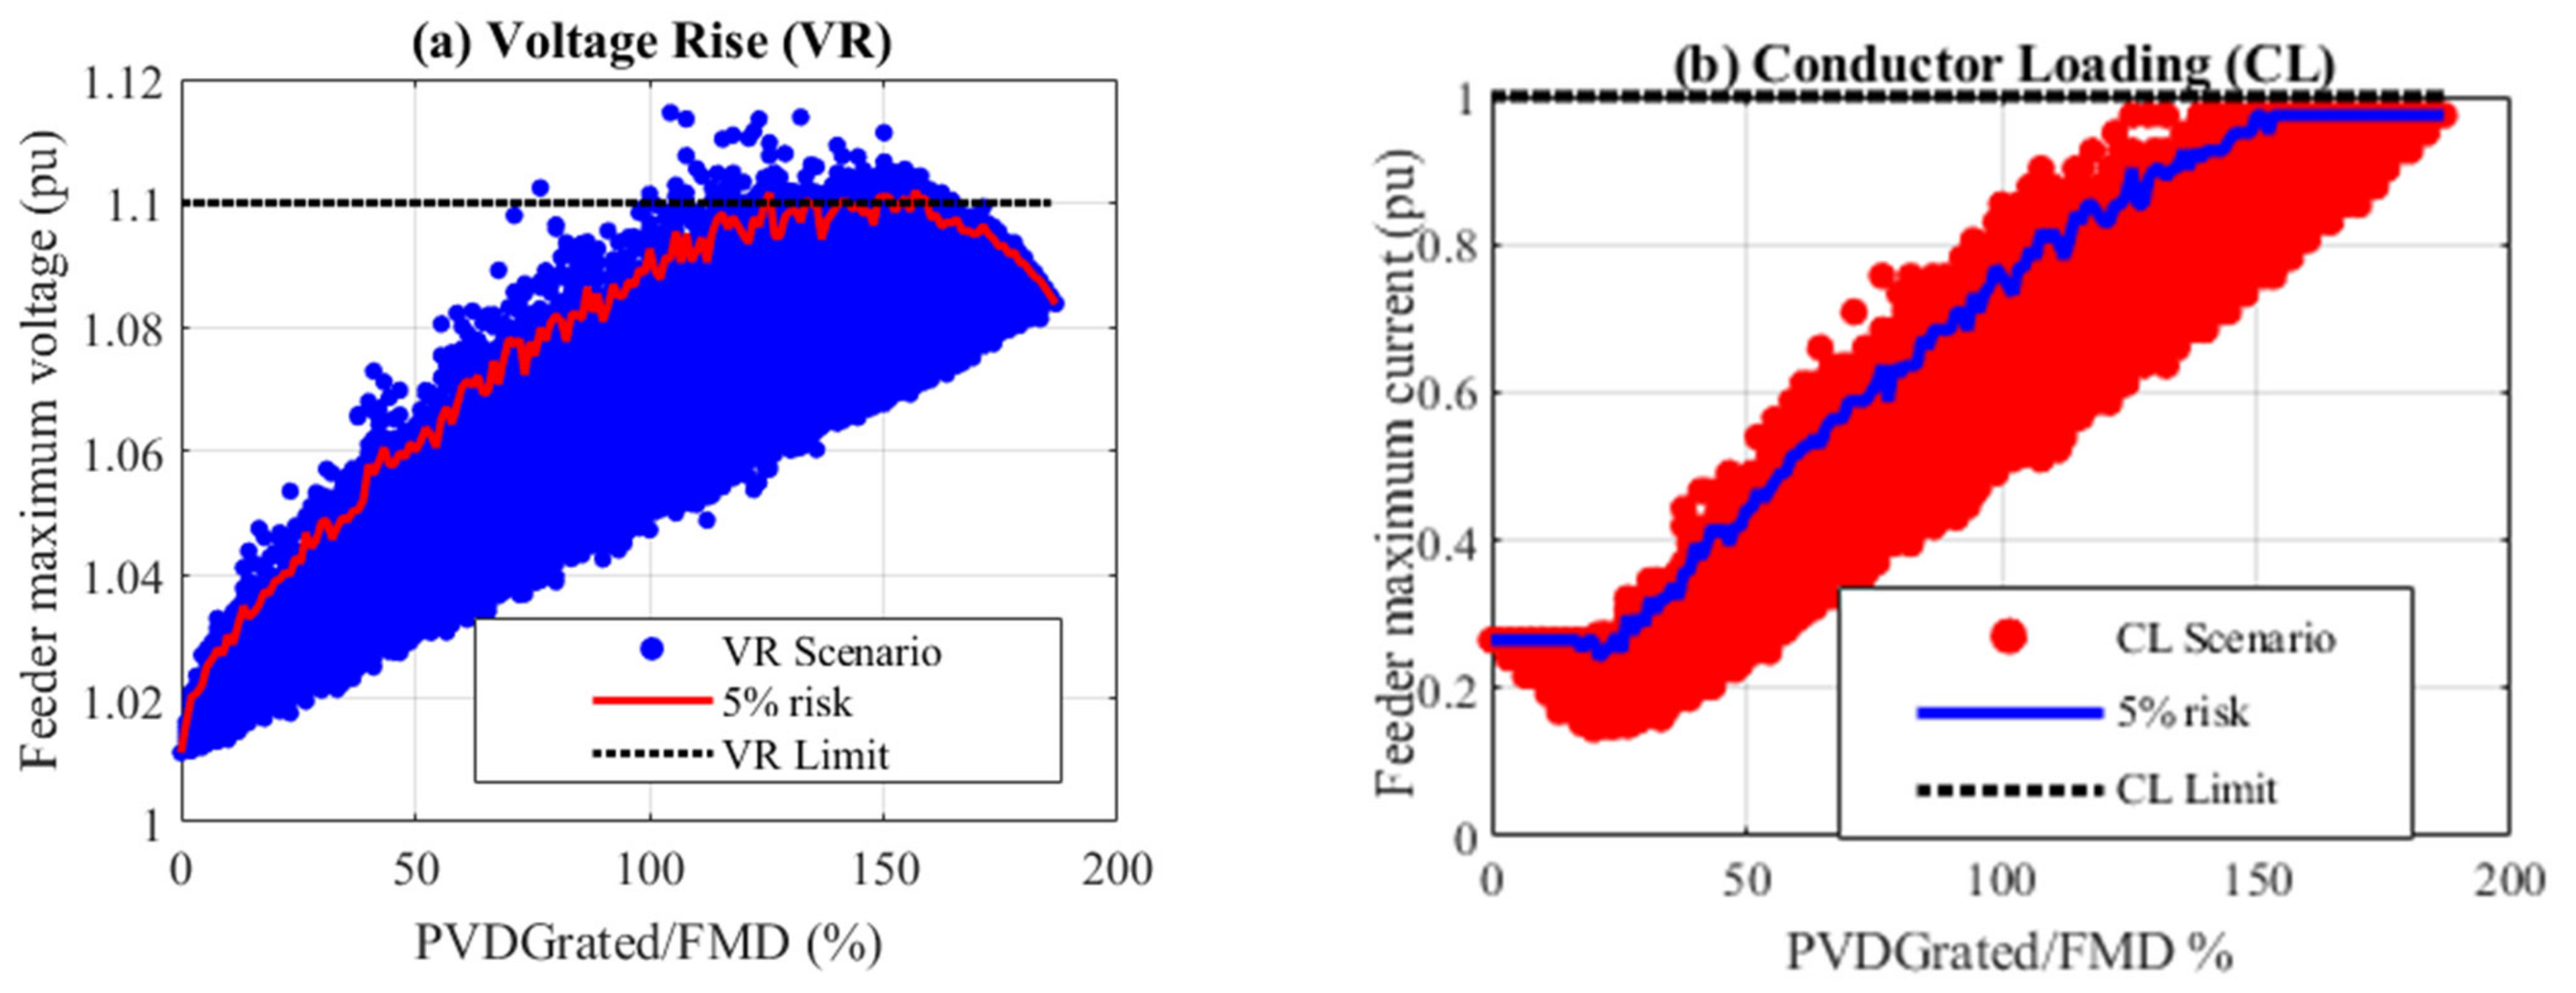
3.5. Conductor Resizing and Performance Validation

The procedure outlined in Section 2.2.3 was followed to calculate the replacement conductor resistances based on the CPI and NPI indices. The final feeder conductor sizes are presented under Case 2 of Table 4.
To test the suitability of the replacement conductors, we performed a grid impact assessment with the updated feeder model. Figure 9 shows the feeder performance of the resized feeder. The voltage performance in Figure 9a indicates that, at a 5% risk level, the feeder voltage performance is within specification for the full range of PV penetration. Note that a few scenarios exceed the limits indicating the acceptable 5% risk in the design. The likelihood of occurrence of these out-of-spec scenarios is low. Moreover, given the time variability of the solar resource, such scenarios, if they occur, would not last for long, preventing the occurrence of consecutive overloading periods. Similar deductions can be made based on Figure 9b.

Discussion of the Performance of the Final System Design

Based on the two tested technical parameters, the final design can accommodate the full range of PV penetration considering various PV allocation conditions. Note that the differences in the penetration quantities between Figure 6 and Figure 9 result from the increase in the FMD capacity in the resized feeder design. The FMD threshold changes in the passive (81 kVA) and active designs (90 kVA) indicate the enhanced capability in the resized feeder. Otherwise, the kWp range is the same in both cases.
To test for consistency in outcomes, we performed three additional case studies involving penetration targets of 6, 10, and 12 kWp PV per customer while maintaining other factors constant. The table below shows the final designs.
From the results illustrated in Figure 10a,d, the initial passive peak winter load designed feeder can host 6 kWp PV per customer. The indicated response shows that the feeder is adequately designed in its current form and does not require further sizing of conductors. Looking at Figure 10b,c, it can also be deduced that the initial voltage for each range of simulated PV capacity is approximately the same for the passive and final designs. This indicates that a change in conductor size may not significantly affect the performance of voltage levels at low penetration. Additionally, at low penetration level, the extent and likelihood of reverse power flow and voltage unbalance that may, in turn, aggravate voltage rise conditions is limited. However, with increased penetration, the benefits of the resized conductors become apparent, with the peak of impacts occurring under the specified volage-rise limit.
Looking at conductor loading in Figure 10e,f, the impacts of conductor resizing at low penetration are more significant than those seen with voltage rise. This is shown by the difference in the initial passive and final designs at the starting point of plots, closer to zero penetration. The comparison of the loading levels at the maximum penetrations shows the extent of loading relief in the redesigned feeder, which in both figures is sufficient to avoid over-loading at 5% risk.
In all redesigned cases, the passive and final design performance plots differ in the range of penetration. This is because the increase in the conductor size consequently increases the feeder loading capacity, which by implication increases the prescribed FMD. Given a constant maximum capacity of PV and an increased FMD threshold, the final design has a smaller quantity of penetration limit compared to the initial feeder design even though the total penetration in ‘power terms’ is the same. This is because the DER penetration is defined as the quotient of PV capacity range and the FMD. Increasing the FMD capacity will lower the penetration quantity, which explains the shorter penetration range in the final designs.
In general, the performance of the final design falls within the specified technical limits demonstrating that increasing the conductor sizes enhances the feeder hosting capacity. Based on the conductor sizes in Table 6, it is demonstrated that both upstream and downstream conductors require an adjustment as the capacity increases. This can be attributed to increased conductor loading for upstream conductors and increased voltage rise on downstream conductors. These two phenomena require appropriate adjustment, and both must be taken into consideration in the CSS process.

4. Discussion

The application of probabilistic methods to power system problems is not new and demonstrations of the drawbacks of deterministic approaches are widely published. However, some feeder design methods remain founded on deterministic principles. Others that attempt probabilistic formulation do so with inadequate input models, and others do not interpret outputs correctly with risk-based analysis. This study has proposed a detailed stochastic–probabilistic approach to the CSS problem for ADNs, addressing the uncertainties related to the stochasticity of customer loads and DER power and unknown uptake characteristics that influence the location and capacity of future DERs. Compared to the traditional CSS methods, this approach integrates a stochastic-probabilistic grid impact assessment study and a risk-based conductor resizing approach into the CSS engine to assist planners design, with risk, for unknown future DER penetration conditions on ADNs.
To achieve comprehensive designs that are robust to the influences of the identified uncertainties, a planner requires detailed probabilistic models informed by practical observations. DNOs will need to advance on load research to study new electricity consumption patterns, forecast trends, and the influence of DERs on these factors. The scope of load modeling must be carefully extended—from the traditional premise of a single, worst-case scenario involving the maximum or peak demand—to include new characteristics such as the summer periods coinciding with PV peaks and those coinciding with wind peaks. Time-series models instead of single interval load definitions are becoming more and more relevant in the context of the dynamic operation of DERs. Based on the obtained results, the importance of considering both voltage rise, and conductor loading has been demonstrated in the CSS formulation. The proposed method and procedure indicate the need to inculcate stochasticity and uncertainty representation in the modeling exercise. In addition to this, the application of a risk-based approach enables the planner to decide the constraints and the allowable risk in the constraints on a scenario-to-scenario basis. This work established the essential CSS framework that can be extended and applied in the design of a robust active distribution network considering varied scenarios and different types of DERs.

5. Conclusions

This paper has presented a novel stochastic–probabilistic approach to the conductor size selection problem in designing new distribution electrification systems with DER penetration. The approach considers the combination of uncertainties arising from the stochasticity of customer loads, the intermittency of DER exports and imports, and the uncertainty regarding the location and capacity of future DER systems. A probabilistic input–process–output model is adopted. The probabilistic input modeling approach ensures detailed uncertainty characterization in the input models for customer loads and DER export and imports. A stochastic–probabilistic grid impact assessment process provides detailed feeder performance assessment considering an extensive range of DER penetration scenarios simulated using an MCS approach and a probabilistic power flow analysis. A conductor validation analysis process handles the risk-based compliance assessment of individual conductors according to voltage and thermal loading constraints. Based on these results, appropriate conductors are selected to achieve desired DER penetration levels while satisfying technical constraints at a design risk of 5%.
Using a practical design simulated case study, the paper demonstrates the efficacy of the proposed approach. Starting with the initial condition design consisting of a passive network designed to meet the winter peak load demand, the approach demonstrates the significance of integrating a grid impact assessment in the CSS process to provide a robust design for an active distribution feeder that can host the desired level of PV. By comparing the performance of the passive- and active-designed feeders, the results demonstrate how scenarios of unknown PV allocation influence the conductor sizing process. Further analysis of the performance of the proposed method in comparison to the deterministic–active-based formulation proposed in our earlier work reveals that the proposed method would be more economic as it addresses each specific conductor as opposed to scaling of conductors sizes which ultimately results in higher reconductoring costs. Comprehensive feeder performance analysis through the presented approach helps understand the influence of DERs on individual conductors and nodes. Validation of the designed feeder using the embedded grid impact assessment process gives the planner additional perspective on the feeder performance regarding voltage rise and conductor loading. In summary, this work has proposed a new approach that can assist planners to conduct CSS exercises and determine the feeder conductor sizes that can support their set out DER threshold. Further work is required to include the voltage unbalance constraint in the CSS modeling framework. This has not been considered in the scope of the current framework. Additionally, careful scenario analysis would go a long way in assessing the impact of different DER mix in optimizing the cost of the CSS process. For an optimal CSS process, these factors need to be considered and included in the extension of the proposed CSS framework.

Author Contributions

Conceptualization; M.J.C. and B.B.; methodology, L.W., and M.J.C.; software, M.J.C.; validation, L.W., and M.J.C.; formal analysis, L.W.; investigation, L.W.; resources, B.B.; data curation, L.W.; writing—original draft preparation, L.W.; writing—review and editing, L.W., M.J.C., and B.B.; visualization, L.W.; supervision, M.J.C., and B.B.; project administration, M.J.C.; funding acquisition, B.B. All authors have read and agreed to the published version of the manuscript.

Funding

This research was funded by The Centre for Renewable and Sustainable Energy Studies, Stellenbosch University, South Africa.

Conflicts of Interest

The authors declare no conflict of interest.

References

  1. Chihota, M.J.; Bekker, B. New planning principles for distribution networks with penetration of distributed energy resources. In Proceedings of the 6th IEEE International Energy Conference, ENERGYCon 2020, Gammarth, Tunisia, 28 September–1 October 2020; IEEE Explore: Gamath, Tunisia, 2020; Volume 2, pp. 643–648. [Google Scholar]
  2. Waswa, L.S.; Bekker, B. Impact of PV small scale embedded generation on South Africa’s system demand profile. In Proceedings of the South African Solar Energy Conference, Durban, South Africa, 25–27 June 2018. [Google Scholar]
  3. Gaunt, C.T.; Herman, R.; Namanya, E.; Chihota, J. Voltage modelling of LV feeders with dispersed generation: Probabilistic analytical approach using Beta PDF. Electr. Power Syst. Res. 2017, 143, 25–31. [Google Scholar] [CrossRef]
  4. Masters, C.L.; Mutale, J.; Strbac, G.; Curcic, S.; Jenkins, N. Statistical evaluation of voltages in distribution systems with embedded wind generation. IEE Proc. Gener. Transm. Distrib. 2000, 147, 207–211. [Google Scholar] [CrossRef]
  5. Walling, R.A.; Saint, R.; Dugan, R.C.; Burke, J.; Kojovic, L.A. Summary of distributed resources impact on power delivery systems. IEEE Trans. Power Deliv. 2008, 23, 1636–1644. [Google Scholar] [CrossRef]
  6. Vita, V.; Alimardan, T.; Ekonomou, L. The impact of distributed generation in the distribution networks’ voltage profile and energy losses. In Proceedings of the 2015 IEEE European Modelling Symposium (EMS), Madrid, Spain, 6–8 October 2015; pp. 260–265. [Google Scholar]
  7. Ismael, S.M.; Abdel Aleem, S.H.E.; Abdelaziz, A.Y.; Zobaa, A.F. State-of-the-art of hosting capacity in modern power systems with distributed generation. Renew. Energy 2019, 130, 1002–1020. [Google Scholar] [CrossRef]
  8. Schwaegerl, C.; Joos, G.; Hatziargyriou, N. Active distributed systems and distibuted energy resources. In Electricity Supply Systems of the Future; Springer: Berlin/Heidelberg, Germany, 2020; pp. 519–567. [Google Scholar]
  9. Rylander, M.; Smith, J.; Sunderman, W. Streamlined Method for Determining Distribution System Hosting Capacity. Pap. Present. Annu. Conf. Rural Electr. Power Conf. 2015, 2015, 3–9. [Google Scholar]
  10. Herman, R.; Gaunt, C.T. A practical probabilistic design procedure for LV residential distribution systems. IEEE Trans. Power Deliv. 2008, 23, 2247–2254. [Google Scholar] [CrossRef]
  11. NRS. NRS 034-1:2007 Electricity Distribution—Guidelines for the Provision of Electricity Distribution Networks in Residential Areas Part 1: Planning and Design of Distribution Networks; NRS: Decatur, TX, USA, 2007. [Google Scholar]
  12. Franco, J.F.; Rider, M.J.; Lavorato, M.; Romero, R. Optimal conductor size selection and reconductoring in radial distribution systems using a mixed-integer LP approach. IEEE Trans. Power Syst. 2013, 28, 10–20. [Google Scholar] [CrossRef]
  13. Rao, R. Optimal conductor selection for loss reduction in radial distribution systems using differential evolution. Int. J. Eng. Sci. Technol. 2010, 2, 2829–2838. [Google Scholar]
  14. Zhao, Z.; Mutale, J. Optimal conductor size selection in distribution networks with high penetration of distributed generation using adaptive genetic algorithm. Energies 2019, 12, 2065. [Google Scholar] [CrossRef] [Green Version]
  15. Sellick, R.L.; Gaunt, C.T. Comparing methods of calculating voltage drop in low voltage feeders. Trans. South African Inst. Electr. Eng. 1995, 86, 96–111. [Google Scholar]
  16. Chihota, M.J.; Bekker, B.; Gaunt, C. Technical Assessment of the impact of Distributed energy resources on distribution feeders. In Uncertainties in Modern Power Systems; Zobaa, A.F., Shady, E., Aleem, A., Eds.; Elsevier: Oxford, UK, 2021; pp. 398–436. [Google Scholar]
  17. Wang, C.; Song, G.; Li, P.; Ji, H.; Zhao, J.; Wu, J. Optimal siting and sizing of soft open points in active electrical distribution networks. Appl. Energy 2017, 189, 301–309. [Google Scholar] [CrossRef]
  18. Pakdel, D.; Ramezani, M. Enhancement of distribution network performance in the presence of uncertain parameters. IET Renew. Power Gener. 2020, 14, 515–525. [Google Scholar] [CrossRef]
  19. Abul’Wafa, A.R. Multi-conductor feeder design for radial distribution networks. Electr. Power Syst. Res. 2016, 140, 184–192. [Google Scholar] [CrossRef]
  20. Funkhouser, A.; Huber, R. A method for determining economical ACSR Conductor sizes for the distribution systems. IEEE Explor. 1955, 74, 479–484. [Google Scholar]
  21. Farrag, M.A.; Khalil, A.H.; Omran, S. Optimal conductor selection and capacitor placement in radial distribution system using nonlinear AC load flow equations and dynamic load model. Int. Trans. Electr. Energy Syst. 2020, 30, 1–19. [Google Scholar] [CrossRef]
  22. Khalil, T.M.; Gorpinich, A.V. Optimal conductor selection and capacitor placement for loss reduction of radial distribution systems by selective particle swarm optimization. Proc. ICCES 2012 2012 Int. Conf. Comput. Eng. Syst. 2012, 215–220. [Google Scholar]
  23. Mendoza, F.; Requena, D.; Bemal-Agustín, J.L.; Domínguez-Navarro, J.A. Optimal conductor size selection in radial power distribution systems using evolutionary strategies. In Proceedings of the 2006 IEEE/PES Transmission & Distribution Conference and Exposition: Latin America, Caracas, Venezuela, 15–18 August 2006; pp. 6–10. [Google Scholar]
  24. Falaghi, H.; Singh, C. Optimal Conductor Size Selection in Distribution Systems with Wind Power Generation. In Wind Power Systems-Application of Computational Intelligence; Wang, L., Singh, C., Kusiak, A., Eds.; Springer: Berlin/Heidelberg, Germany, 2010; pp. 25–51. ISBN 9783642132490. [Google Scholar]
  25. Falaghi, H.; Ramezani, M.; Haghifam, M.R.; Milani, K.M. Optimal selection of conductors in radial distribution systems with time varying load. Proceedings of the CIRED 18th International Conference and Exhibition on Electricity Distribution 1–4.
  26. Rao, R.S.; Satish, K.; Narasimham, S.V.L. Optimal conductor size selection in distribution systems using the harmony search algorithm with a differential operator. Electr. Power Compon. Syst. 2011, 40, 41–56. [Google Scholar] [CrossRef]
  27. Sivanagaraju, S.; Rao, J.V. Optimal conductor selection in radial distribution system using discrete Particle Swarm Optimization. World J. Model. Simul. 2009, 5, 183–191. [Google Scholar]
  28. Rao, P.S.N. An extremely simple method of determining optimal conductor sections for radial distrbution feeders. IEEE Trans. Power Appar. Syst. 1985, 104, 1439–1442. [Google Scholar] [CrossRef]
  29. Kaur, D.; Sharma, J. Optimal conductor sizing in radial distribution systems planning. Int. J. Electr. Power Energy Syst. 2008, 30, 261–271. [Google Scholar] [CrossRef]
  30. Martínez-Gil, J.F.; Moyano-García, N.A.; Montoya, O.D.; Alarcon-Villamil, J.A. Optimal Selection of Conductors in Three-Phase Distribution Networks Using a Discrete Version of the Vortex Search Algorithm. Computation 2021, 9, 80. [Google Scholar] [CrossRef]
  31. Ismael, S.M.; Abdel Aleem, S.H.E.; Abdelaziz, A.Y.; Zobaa, A.F. Practical Considerations for Optimal Conductor Reinforcement and Hosting Capacity Enhancement in Radial Distribution Systems. IEEE Access 2018, 6, 27268–27277. [Google Scholar] [CrossRef]
  32. Wang, Z.; Liu, H.; Yu, D.C.; Wang, X.; Song, H. A practical approach to the conductor size selection in planning radial distribution systems. IEEE Trans. Power Deliv. 2000, 15, 350–354. [Google Scholar] [CrossRef]
  33. Montoya, G.O.D.; Grajales, A.; Hincapié, I.R.A. Optimal selection of conductors in distrbution systems using tabu search algorithms. Ingeniare. Rev. Chil. Ing. 2018, 26, 283–295. [Google Scholar]
  34. Montoya, O.D.; Garces, A.; Castro, C.A. Optimal conductor size selection in radial distribution networks using a mixed-integer non-linear programming formulation. IEEE Lat. Am. Trans. 2018, 16, 2213–2220. [Google Scholar] [CrossRef]
  35. Montoya, O.D.; Gil-González, W.; Grisales-Noreña, L.F. On the mathematical modeling for optimal selecting of calibers of conductors in DC radial distribution networks: An MINLP approach. Electr. Power Syst. Res. 2021, 194, 107072. [Google Scholar] [CrossRef]
  36. Samani, E.; Aminifar, F. Tri-Level Robust Investment Planning of DERs in Distribution Networks with AC Constraints. IEEE Trans. Power Syst. 2019, 34, 3749–3757. [Google Scholar] [CrossRef]
  37. Chihota, M.J. Extending the Herman-Beta Transform for Probabilistic Load Flow Analysis of Radial Feeders; University of Cape Town: Cape Town, South Africa, 2019. [Google Scholar]
  38. Herman, R.; Kritzinger, J. The statistical description of grouped domestic electrical load currents. Electr. Power Syst. Res. 1993, 27, 43–48. [Google Scholar] [CrossRef]
  39. Herman, R.; Heunis, S.W. General probabilistic voltage drop calculation method for LV distribution networks based on a beta p.d.f. load model. Electr. Power Syst. Res. 1998, 46, 45–49. [Google Scholar] [CrossRef]
  40. Gaunt, C.T.; Herman, R.; Dekenah, M.; Sellick, R.L.; Heunis, S.W. Data collection, load modelling and probabilistic analysis for LV domestic electrification. In Proceedings of the 15th International Conference on Electricity Distribution, Nice, France, 1–4 June 1999. [Google Scholar]
  41. University of Cape Town, Domestic Electrical Load Survey Secure Data 1994:2014. version 1. Available online: https://www.datafirst.uct.ac.za/dataportal/index.php/catalog/757/study-description (accessed on 30 September 2021).
  42. IEEE Load representation for dynamic performance analysis. IEEE Trans. Power Syst. 1993, 8, 472–482. [CrossRef]
  43. NRS. NRS 048-2: Electricity Supply-Quality of Supply Part 2: Voltage Characteristics, Compatibility Levels, Limits and Assessment Methods; NRS: Decatur, TX, USA, 2003. [Google Scholar]
  44. NRS. NRS 097-2-3: 2014-A Simplified Utility Connection Criteria for Low-Voltage Connected Generators; NRS: Decatur, TX, USA, 2014; p. 27. [Google Scholar]
Figure 1. Methodology for the assessment of feeder performance and conductor size selection.
Energies 14 06387 g001
Figure 2. Illustrating uncertainty representation (a), the variation in beta probability distribution function curves with different shape parameters (b).
Energies 14 06387 g002
Figure 3. Representation of the load demand for a typical summer day for a group of customers.
Energies 14 06387 g003
Figure 4. Configuration of the designed feeder.
Energies 14 06387 g004
Figure 5. Performance of the passive feeder based on the winter load model.
Energies 14 06387 g005
Figure 6. Illustration of the passive feeder response: (a) voltage rise (b) conductor loading.
Energies 14 06387 g006
Figure 7. Probability distributions showing (a) conductor currents at the maximum loading impact penetration and (b) feeder voltages at the maximum voltage impact penetration.
Energies 14 06387 g007
Figure 8. Illustrating the feeder node voltage level and feeder conductor loading performance and the respective performance indices (NPI, CPI) used in the resizing process.
Energies 14 06387 g008
Figure 9. Illustration of the response of the resized feeder. (a) Voltage rise (b) conductor loading.
Energies 14 06387 g009
Figure 10. Illustrating the performance response of 6 kWp, 10 kWp, and 12 kWp systems: (ac) illustrates voltage initial and final design performance while (df) illustrate conductor loading initial and final performance.
Energies 14 06387 g010
Table 1. Technical design constraints.
Technical ConstraintConstraint LimitConfidence Intervals
Voltage drop >0.9 pu2.5%
Voltage rise<1.1 pu97.5%
Loading of conductors<1 pu2.5%
Table 2. A representative section of the conductor inventory based on aluminum conductor steel reinforced (ACSR) conductors.
Cable SizeCurrent RatingResistance ReactanceImpedance
mm2(A)Ω/kmΩ/kmΩ/km
251051.2000.0961.493
351440.8680.0961.082
501830.6410.0900.801
702280.4430.0890.557
952770.3200.0860.406
1203220.2530.0840.325
1503500.2060.0820.269
Table 3. Load and PV statistical model parameters.
Input TypeInput Model Parameters
PeriodProbabilistic ModelADMD (kVA)pf
αβC (A)σ (A)
LoadWinter1.674.076010.504.0150.95
Summer0.588.78604.4230.8550.95
PVSummer255.5255.56.960.1500.8001
Table 4. Conductor properties for the passive (initial) and adjusted feeder designs.
Conductor PropertiesFeeder Section
1234567
Case 1:
(Initial design)
Cross-section (mm2)50503535252525
Resistance
(ohms/km)
0.6410.6410.8680.8681.201.201.20
Case 2:
(Final design)
Cross-section (mm2)70503535353535
RRC-I (Ω/km)0.6100.7120.8941.0951.442.073.13
RRC-V (Ω/km)0.6970.6740.8940.8761.1921.1731.16
Resistance (ohms/km)0.4430.6410.8680.8680.8680.8680.868
Deterministic–active designCross-section (mm2)70705050353535
Table 5. Feeder performance analysis for different impact factors.
Feeder DesignPermissible Penetration Range (% of FMD)
Voltage RiseCond. LoadingOverall
Case 1 (Initial, passive design)0–100%0–160%0–100%
205%–full uptake
Case 2 (Final, active design)Full rangeFull rangeFull range
Table 6. Conductor sizes for different DER capacities.
Capacity (kWp)Conductor Size (mm2)
1234567
Passive Design50503535252525
6 kWp50503535252525
8 kWp70503535353535
10 kWp95705035355050
12 kWp120957050355050
Publisher’s Note: MDPI stays neutral with regard to jurisdictional claims in published maps and institutional affiliations.

