Management and Economic Sustainability of the Slovak Industrial Companies with Medium Energy Intensity


Abstract
:1. Introduction
2. Theoretical Background
2.1. Economic Sustainability
2.2. Factor Analysis of Financial Ratios
3. Materials and Methods
3.1. The Slovak Mechanical Engineering Industry and Research Sample
3.2. Statistical Analysis
4. Results
- Factor of liquidity, which includes the equity to liabilities ratio, quick ratio, debt ratio, net working capital to assets ratio, and current ratio, describes items connected with cash management of the companies. Management of current assets and short-term financing are critical factors that affect the change in the state of net working capital, which is the generator of operating cash flow.
- Factor of profitability is composed of return on sales and return on investments. It is an integral factor, which decomposes almost all factors and includes all business activities.
- Factor of indebtedness is an important criterion for internal users, external entities, or potential investors. It is created by financial leverage, and debt to equity ratio. The variables quantify the creditworthiness of companies and provide information on the structure of the company’s financial resources.
- Factor of activity is formed of assets turnover, and current assets turnover. The factor is a reflection of the efficient use and management of the company’s assets; specifically, how effectively the company is using its assets to generate sales.

| Factor | Variance | Difference | Proportion | Cumulative |
|---|---|---|---|---|
| Factor 1—Factor of liquidity | 2.9809 | 0.8078 | 0.2710 | 0.2710 |
| Factor 2—Factor of profitability | 2.1732 | 0.0522 | 0.1976 | 0.4686 |
| Factor 3—Factor of indebtedness | 2.1210 | 0.3845 | 0.1928 | 0.6614 |
| Factor 4—Factor of activity | 1.7365 | 0.1579 | 0.8192 |
5. Discussion and Conclusions
Author Contributions
Funding
Institutional Review Board Statement
Informed Consent Statement
Data Availability Statement
Acknowledgments
Conflicts of Interest
References
- The Mechanical Engineering Blog. Mechanical vs. Energy Engineering, 2020. Available online: https://mechanicalengineeringhq.com/mechanical-vs-energy-engineering/ (accessed on 5 November 2020).
- Mechanical Engineering: University of Washington. Available online: https://www.me.washington.edu/research/research_areas/energy-environment (accessed on 5 November 2020).
- Hargroves, K.; Gockowiak, K.; Wilson, K.; Lawry, N.; Desha, C. An Overview of Energy Efficiency Opportunities in Mechanical Engineering; The University of Adelaide and Queensland University of Technology (The Natural Edge Project), Commissioned by the Australian Government Department of Industry: Canberra, Australia, 2014. [Google Scholar]
- Hussain, H.I.; Slusarczyk, B.; Kamarudin, F.; Thaker, H.M.T.; Szczepańska-Woszczyna, K. An investigation of an adaptive neuro-fuzzy inference system to predict the relationship among energy intensity, globalization, and financial development in major ASEAN economies. Energies 2020, 13, 850. [Google Scholar] [CrossRef] [Green Version]
- Sabishchenko, O.; Rębilas, R.; Sczygiol, N.; Urbański, M. Ukraine energy sector management using hybrid renewable energy systems. Energies 2020, 13, 1776. [Google Scholar] [CrossRef] [Green Version]
- Škare, M.; Tomić, D.; Stjepanović, S. Energy consumption and Green GDP in Europe: A panel cointegration analysis 2008–2016. Acta Montan. Slovaca 2020, 25, 46–56. [Google Scholar]
- Tvaronavičiene, M.; Lisin, E.; Kindra, V. Power market formation for clean energy production as the prerequisite for the country’s energy security. Energies 2020, 13, 4930. [Google Scholar] [CrossRef]
- Fernández-Miranda, S.S.; Marcos, M.; Peralta, M.E.; Aguayo, F. The challenge of integrating Industry 4.0 in the degree of Mechanical Engineering. Procedia Manuf. 2017, 13, 1229–1236. [Google Scholar] [CrossRef]
- Horváth, D.; Szabó, R.Z. Driving forces and barriers of Industry 4.0: Do multinational and small and medium-sized companies have equal opportunities? Technol. Forecast. Soc. Chang. 2019, 146, 119–132. [Google Scholar] [CrossRef]
- Bartelmus, P. Sustainability Economics: An Introduction; Routledge: New York, NY, USA, 2013. [Google Scholar]
- Markulev, A.; Long, A. On Sustainability: An Economic Approach: Productiivity Commision Staff Research Note; Media and Publications: Melbourne, Australia, 2013. [Google Scholar]
- Reddy, T.L.; Thompson, R.J. Environmental, Social and Economic Sustainability: Implications for Actuarial Science; Institute of Actuaries of Australia: Sydney, Australia, 2015. [Google Scholar]
- Da Costa Maynard, D.; Vidigal, M.D.; Farage, P.; Zandonadi, R.P.; Nakano, E.Y.; Botelho, R.B.A. Environmental, social and economic sustainability indicators applied to food services: A systematic review. Sustainability 2020, 12, 1804. [Google Scholar] [CrossRef] [Green Version]
- Pitelis, C.N. Towards a more ‘ethically correct’ governance for economic sustainability. J. Bus. Ethics 2013, 118, 655–665. [Google Scholar] [CrossRef]
- Anand, S.; Sen, A. Human development and economic sustainability. World Dev. 2000, 28, 2029–2049. [Google Scholar] [CrossRef] [Green Version]
- Spangenberg, J.H. Economic sustainability of the economy: Concepts and indicators. Int. J. Sustain. Dev. 2005, 8, 47–64. [Google Scholar] [CrossRef]
- Goerner, S.J.; Lietaer, B.; Ulanowicz, R.E. Quantifying economic sustainability: Implications for free-enterprise theory, policy and practice. Ecol. Econ. 2009, 69, 76–81. [Google Scholar] [CrossRef]
- Zhong, Y.; Wu, P. Economic sustainability, environmental sustainability and constructability indicators related to concrete-and steel-projects. J. Clean. Prod. 2015, 108, 748–756. [Google Scholar] [CrossRef]
- Khudyakova, T.; Shmidt, A. Methodical approaches to managing the sustainability of enterprises in a variable economy. Rev. Espac. 2018, 39, 1–5. [Google Scholar]
- Jurigová, Z.; Tučková, Z.; Kuncová, M. Economic sustainability as a future phenomenon: Moving towards a sustainable hotel industry. J. Secur. Sustain. Issues 2016, 16, 103–112. [Google Scholar] [CrossRef]
- Mensah, J.; Casadevall, S.R. Sustainable development: Meaning, history, principles, pillars, and implications for human action: Literature review. Cogent Soc. Sci. 2019, 5, 1–21. [Google Scholar] [CrossRef]
- Kocmanová, A.; Němeček, P. Economic, environmental and social Issuses and Corporate Governance in Relation to Measurement of Company Performance. In Liberec Economic Forum 2009, Proceedings of the 9th International Conference Liberec Economic Forum, Liberec, Czech Republic, 15 September 2009; Kocourek, A., Ed.; Technical University of Liberec: Liberec, Czech Republic, 2009; pp. 177–178. [Google Scholar]
- Kocmanová, A.; Hornungová, J.; Klímková, M. Udržitelnost: Integrace Environmentální, Sociální a Ekonomické Výkonnosti Podniku; Akademické nakladatelství CERM: Brno, Czech Republic, 2010. [Google Scholar]
- Kocmanová, A. Ekonomické Řízení Podniku; Linde Praha: Praha, Czech Republic, 2013. [Google Scholar]
- Maříková, P.; Mařík, M. Moderní Metódy Hodnocení Výkonnosti a Oceňování Podniku; Ekopress: Praha, Czech Republic, 2006. [Google Scholar]
- Kocmanová, A.; Dočekalová, M. Corporate sustainability: Environmental, social, economic and corporate performance. Acta Univ. Agric. Silvic. Mendel. Brun. 2011, 59, 203–208. [Google Scholar] [CrossRef] [Green Version]
- Čámská, D. Requirements for Models Predicting Corporate Financial Distress. In Proceedings of the 8th International Days of Statistic and Economics, Prague, Czech Republic, 11–13 September 2014; Loster, T., Pavelka, T., Eds.; Melandrium: Slaný, Czech Republic, 2014; pp. 316–323. [Google Scholar]
- Horák, J. Does Industry 4.0 Influence Efficiency of Financial Management of a Company? In Proceedings of the 10th International Days of Statistic and Economics, Prague, Czech Republic, 8–10 September 2016; Loster, T., Pavelka, T., Eds.; Melandrium: Slaný, Czech Republic, 2016; pp. 575–582. [Google Scholar]
- Alekseev, A.N.; Evdokimov, S.Y.; Tarasova, A.Y.; Khachaturyan, K.S.; Khachaturyan, A.A. Financial strategy of development of industry 4.0 in the countries with developing economy. Rev. Espac. 2018, 39, 1–8. [Google Scholar]
- Hornungová, J. Methodology for selection of economic performance factors in the area of information and communication activities. Acta Univ. Agric. Silvic. Mendel. Brun. 2015, 63, 533–537. [Google Scholar] [CrossRef] [Green Version]
- Andjelic, S.; Vesic, T. The importance of financial analysis for business decision making. In Book of Proceedings from Sixth International Scientific Conference Employment, Education and Entrepreneurship, Belegrade, Serbia, 19–21 October 2017; Ristanovic, V., Vojtesi-Kljenak, D., Piljan, I., Eds.; Faculty of Business Economics and Enterpreneurship: Belegrade, Serbia, 2017; pp. 9–25. [Google Scholar]
- Czillingová, J.; Petruška, I.; Tkáč, M. Financial and economic analysis of steel industry by multivariate analysis. Ekon. Časopis 2012, 60, 388–405. [Google Scholar]
- Hornungová, J.; Milichovský, F. Financial performance evaluation of the Czech agricultural companies with factor analysis. Sci. Pap. Univ. Pardubic. Ser. D 2016, 37, 26–38. [Google Scholar]
- De, A.; Bandyopadhyay, G.; Chakraborty, B.N. Application of the factor analysis on the financial ratios and validation of the results by the cluster analysis: An empirical study on the Indian cement industry. J. Bus. Stud. Q. 2011, 2, 13–31. [Google Scholar]
- Öcal, M.E.; Oral, E.L.; Erdis, E.; Vural, G. Industry financial ratios—Application of factor analysis in Turkish construction industry. Build. Environ. 2007, 42, 385–392. [Google Scholar] [CrossRef]
- Erdogan, A. Applying factor analysis on the financial ratios of Turkey’s top 500 industrial enterprises. Int. J. Bus. Manag. 2013, 8, 134–139. [Google Scholar] [CrossRef] [Green Version]
- Ming, H.; Juqin, S.; Lu, C. An empirical study of factor analysis on M & A performance of listed companies of Chinese pharmaceutical industry. J. Chem. Pharm. Res. 2014, 6, 963–968. [Google Scholar]
- Yu, Z.; Sun, Q.; Parmar, M.; Zhang, T. A Prediction of Financial Distress for Listed Companies of the New tertiary board Based on Factor Analysis and Logistic Regression. In Proceedings of the 2016 International Conference on Education, Management Science and Economics, Singapore, 26–28 December 2016; Hee, T., Liu, J., Eds.; Atlantis Press: Paris, France, 2016; pp. 22–26. [Google Scholar]
- Perisa, A.; Kurnoga, N.; Sopta, M. Multivariate analysis of profitability indicators for selected companies of Croatian market. UTMS J. Econ. 2017, 8, 231–242. [Google Scholar]
- Jenčová, S.; Štefko, R.; Vašaničová, P. Scoring Model of the Financial Health of the Electrical Engineering Industry’s Non-Financial Corporations. Energies 2020, 13, 4364. [Google Scholar] [CrossRef]
- Republiková únia zamestnávaetľov. Analýza Dopadov Digitálnej Transformácie na Podnikateľov, v Súkromnom a Verejnom Sektore. Available online: https://www.ia.gov.sk/data/files/NP_CSD_II/Analyzy/RUZ/RUZ_Analyza_Analyza_dopadov_digitalnej_transformacie_na_podnikatelov__v_sukromnom_a_verejnom_sektore.pdf (accessed on 4 November 2020).
- Official Journal of the European Union. Opinion of the European Economic and Social Committee on Industrial Change in the Mechanical Engineering Sector. 2005/C 267/02. Available online: https://eur-lex.europa.eu/legal-content/EN/TXT/PDF/?uri=CELEX:52005IE0526&from=SK (accessed on 3 November 2020).
- Jenčová, S. Aplikácia Pokročilých Metód vo Finančno-Ekonomickej Analýze Elektrotechnického Odvetvia Slovenskej Republiky; SAEI: Ostrava, Czech Republic, 2018. [Google Scholar]
- Statistical Office of the Slovak Republic. Available online: https://slovak.statistics.sk/ (accessed on 14 September 2020).
- CRIBIS. Available online: https://www.cribis.sk/ (accessed on 14 September 2020).
- Dubravská, M.; Marchevská, M.; Vašaničová, P.; Kotulič, R. Corporate Social Responsibility and Environmental Management Linkage: An Empirical Analysis of the Slovak Republic. Sustainability 2020, 12, 5431. [Google Scholar] [CrossRef]
- FinStat. Available online: https://finstat.sk/databaza-financnych-udajov (accessed on 14 September 2020).
- SARIO. Machinery & Equipment Industry in SLOVAKIA. Available online: https://www.sario.sk/sites/default/files/data/sario-machinery-and-equipment-industry-in-slovakia-2019-11-29.pdf (accessed on 14 September 2020).
- Act No. 513/1991 Coll. In Commercial Code; Iura Edition: Bratislava, Slovakia, 2013.
- Pride, W.M.; Hughes, R.J.; Kapoor, J.R. Business; South-Western Cengage Learning: Mason, MA, USA, 2010. [Google Scholar]
- Rist, M.; Pizzica, A.J. Financial Ratios for Executives; Apress: London, UK, 2014. [Google Scholar]
- Troy, L. Almanac of Business and Industrial Financial Ratios; Wolters Kluwer Business: Chicago, IL, USA, 2008. [Google Scholar]
- Megginson, W.L.; Smart, S.B.; Lucey, B.M. Introduction to Corporate Finance; Cengage Learning EMEA: London, UK, 2008. [Google Scholar]
- Sekhar, C. Financial Ratio Analysis; Independently published; 2018. [Google Scholar]
- Ciby, J. Advanced Credit Risk Analysis and Management; John Wiley & Sons: New York, NY, USA, 2013. [Google Scholar]
- Bačík, R.; Paolone, F.; Nastišin, Ľ. Financial Performance and On-Line Reputation: Empirical Evidence from a Random Sample of European Food Industry. Mediterr. J. Soc. Sci. 2016, 7, 105. [Google Scholar] [CrossRef]
- Williams, B.; Onsman, A.; Brown, T. Exploratory factor analysis: A five-step guide for novices. Australas. J. Paramed. 2010, 8, 1–13. [Google Scholar] [CrossRef] [Green Version]
- Kaiser, H.F. A second generation little jiffy. Psychometrika 1970, 35, 401–415. [Google Scholar] [CrossRef]
- Kaiser, H.F.; Rice, J. Little Jiffy, Mark IV. Educ. Psychol. Meas. 1974, 34, 111–117. [Google Scholar] [CrossRef]
- Bartlett, M.S. Tests of significance in factor analysis. Br. J. Psychol. 1950, 3, 77–85. [Google Scholar] [CrossRef]
- Aczel, A.D. Complete Business Statistics; Homewood: Irwin, PA, USA, 1989. [Google Scholar]
- Reinard, J.C. Communication Research Statistics; Sage Publications: Thousand Oaks, CA, USA, 2006. [Google Scholar]
- Hair, J.F.; Black, B.; Babin, B.; Anderson, R.E.; Tatham, R.L. Multivariate Data Analysis, 6th ed.; Pearson: London, UK, 2006. [Google Scholar]
- Child, D. The Essentials of Factor Analysis, 3rd ed.; Continuum International Publishing Group: London, UK, 2006. [Google Scholar]
- Stankovičová, I.; Mojsejová, A. Human development index: Rating and classification of European countries by multivariate methods. Slovak Stat. Demogr. 2020, 3, 9–35. [Google Scholar]
- Vojtková, M.; Stankovičová, I. Viacrozmerné Štatistické Metódy s Aplikáciami v Softvéri SAS; Letra Edu: Bratislava, Slovak Republic, 2020. [Google Scholar]
- Braeken, J.; Van Assen, M.A. An empirical Kaiser criterion. Psychol. Methods 2017, 22, 450–466. [Google Scholar] [CrossRef] [PubMed] [Green Version]
- Ehiedu, V.C. The impact of liquidity on profitability of some selected companies: The financial statement analysis (FSA) approach. Res. J. Financ. Account. 2014, 5, 81–90. [Google Scholar]
- Denis, D.J. Financial flexibility and corporate liquidity. J. Corp. Financ. 2011, 17, 667–674. [Google Scholar] [CrossRef]
- Elmosehly, S.A.M. Design for Profitability: Guidelines to Cost Effectively Manage the Development Process of Complex. Products; CRC Press: Boca Raton, FL, USA, 2016. [Google Scholar]
- Lee, A.C.; Lee, J.C.; Lee, C.F. Financial Analysis, Planning & Forecasting: Theory and Application; World Scientific: London, UK, 2009. [Google Scholar]
- Anderson, G.; Raissi, M. Corporate Indebtedness and Low Productivity Growth of Italian Firms. Working Paper, International Monetary Fund, 2018. Available online: https://www.elibrary.imf.org/doc/IMF001/24965-9781484343265/24965-9781484343265/Other_formats/Source_PDF/24965-9781484343371.pdf (accessed on 22 December 2020).
- Spathis, C.; Doumpos, M.; Zopounidis, C. Detecting falsified financial statements: A comparative study using multicriteria analysis and multivariate statistical techniques. Eur. Account. Rev. 2002, 11, 509–535. [Google Scholar] [CrossRef] [Green Version]
- Ramadan, Z.S.; Ramadan, I.Z. Capital structure and firm’s performance of Jordanian manufacturing sector. Int. J. Econ. Financ. 2015, 7, 279–284. [Google Scholar] [CrossRef] [Green Version]
- Nazir, M.S.; Afza, T. Working capital requirements and the determining factors in Pakistan. IUP J. Appl. Financ. 2009, 15, 28–38. [Google Scholar]
- Dharmaraj, A.; Sivakumar, S. Direct and Indirect Effects of Independents Variables on Return on the Total Assets of Composite Cotton Sector-An Analytical Study in Indian Textile Companies. Bonfring Int. J. Ind. Eng. Manag. Sci. 2013, 3, 24–26. [Google Scholar]
- Chen, K.H.; Shimerda, T.A. An empirical analysis of useful financial ratios. Financ. Manag. 1981, 10, 51–60. [Google Scholar] [CrossRef]
- Šebová, Ľ.; Báťová, L. Financial Situation in the Field of the Accommodation and Hospitality Services in Slovakia in the Years 2012–2014. J. Econ. Soc. Res. 2016, 17, 37–46. [Google Scholar]
- Adamko, P.; Svabova, L. Prediction of the risk of bankruptcy of Slovak companies. In Proceedings of the 8th International Scientific Conference Managing and Modelling of Financial Risks, Ostrava, Czech Republic, 5–6 September 2017; Čulík, M., Ed.; VŠB-Technical University of Ostrava: Ostrava, Czech Republic, 2016; pp. 15–20. [Google Scholar]
- Kliestik, T.; Kovacova, M.; Podhorska, I.; Kliestikova, J. Searching for key sources of goodwill creation as new global managerial challenge. Pol. J. Manag. Stud. 2018, 17, 144–154. [Google Scholar] [CrossRef]
- Biceková, A.; Pusztová, Ľ. Dolovanie dát z bankového sektora. Acta Inform. Pragensia 2019, 8, 18–37. [Google Scholar] [CrossRef] [Green Version]
- Štefko, R.; Horváthová, J.; Mokrišová, M. Bankruptcy prediction with the use of Data Envelopment Analysis: An empirical study of Slovak Businesses. J. Risk Financ. Manag. 2020, 13, 212. [Google Scholar] [CrossRef]
- Horváthová, J.; Mokrišová, M. Comparison of the Results of a Data Envelopment Analysis Model and Logit Model in Assessing Business Financial Health. Information 2020, 11, 160. [Google Scholar] [CrossRef] [Green Version]
- Kliestik, T.; Valaskova, K.; Lazaroiu, G.; Kovacova, M.; Vrbka, J. Remaining Financially Healthy and Competitive: The Role of Financial Predictors. J. Compet. 2020, 12, 74–92. [Google Scholar]
- Kotane, I.; Kuzmina-Merlino, I. Assessment of financial indicators for evaluation of business performance. Eur. Integr. Stud. 2012, 6, 216–224. [Google Scholar] [CrossRef]
- Vu, T.L.A.; Le, T.Q. Development orientation for higher education training programme of mechanical engineering in industrial revolution 4.0: A perspective in Vietnam. J. Mech. Eng. Res. Dev. 2019, 42, 71–73. [Google Scholar]


| Authors | Factors | Financial Indicators |
|---|---|---|
| Czillingová, Petruška, Tkáč [32] | Liquidity factor | Responsive liquidity; Current liquidity; Total liquidity; Insolvency |
| Profitability factor | ROA; ROE; ROCE (Return on capital employed); ROS | |
| Factor of indebtedness | Total indebtedness; CF level; Financial leverage | |
| Activity factor | Stock turnover; AT | |
| Hornungová, Milichovský [33] | Operational factor | CF; P/L before tax; Operating revenue; Sales; EBIT; P/L after taxes |
| Profit factor | ROA; EBITDA; Profit margin; Profit per employees | |
| Return factor | ROCE; ROE | |
| Average cost per employee factor | Average costs of employees | |
| De, Bandyopadhyay, Chakraborty [34] | Profitability and ROI factor | CP to TA; CP to average capital employed; EBITDA/capital employed; Return on average capital employed/net assets; CP to total income; CP to average shareholder’s fund |
| Cash position | CB to CA; CB to CA; CB to total income; CB to TA | |
| Capital structure | Shareholder’s fund to total liabilities; Proprietary ratio; Total debt to TA; Net fixed assets to capital employed | |
| Asset and material management | Fixed AT; Total income to capital employed; Raw-material expenses to average raw-material | |
| Short-term liquidity | CR; QR | |
| Long-term solvency | CP to shareholder’s fund/equity; Debt ER | |
| Dividend policy | Total dividend distribution ratio; Equity dividend distribution ratio | |
| Productivity of WC | WC turnover; CP to net WC | |
| Öcal et al. [35] | Liquidity | QR; Cash ratio; EBIT/interest; CR; |
| Capital structure and profitability | Debt ratio; ROA; EBT/net sales | |
| Activity efficiency | WC turnover; AT; Long term AT; Inventory turnover | |
| Profit margin and growth | EBIT/net sales; Gross profit/net sales; Assets growth rate | |
| Assets structure | Accounts receivable/TA; CA/TA | |
| Erdogan [36] | Productivity | Labor productivity; Capital productivity |
| Profitability and Capital structure | Pretax profit margin; ROE; Debt ratio | |
| Efficiency | AT; Equity turnover | |
| Export intensity and proportion of sales from production | Exports/net sales; Sales from production/net sales | |
| Ming, Juqin, Lu [37] | Operating capacity | Inventory turnover; TAT Current AT; Asset-liability ratio; ER; CR |
| Solvency | OPE (Main business profit/net sales revenue); Return on TA; ROE; Ratio to profits to cost | |
| Profit ability | TA growth rate; Earnings per share growth rate | |
| Growth ability | CROA (The current main business profit growth/main business profit of the previous period) | |
| Yu et al. [38] | Solvency factor | CR; QR; Cash ratio; Asset-liability ratio; ER; Interest coverage |
| Workability factor | Accounts receivable turnover; Inventory turnover; TAT; Operating cash/gross revenue | |
| Profitability factor | ROE; Earning per share; Return on TA; Net profit margin on sales | |
| Growth ability factor | Gross operating income; Net profit growth | |
| Perisa, Kurnoga, Sopta [39] | Profit | ROA; ROI; ROCE |
| Return | EBITDA margin; EBIT margin; Net profit margin | |
| Hornungová [30] | Profitability | ROE; ROA; EBIT |
| CF | Liquidity; Operating CF | |
| Returns | ROI; ROS |
| Code | Description |
|---|---|
| E/L | Equity to liabilities ratio |
| ROS | Return on Sales (ROS) = earnings before interest, taxes, depreciation and amortization (EBITDA)/sales, |
| ROI | Return on Investments (ROI) = earnings before interest, taxes (EBT)/total capital |
| QR | Quick ratio (QR) = (current assets − inventory)/current liabilities |
| AT | Assets turnover = sales/assets |
| DR | Debt ratio (DR) = total debt/total assets ratio |
| FL | Financial leverage (FL) = assets/equity = equity multiplier |
| NWC/A | Net working capital to assets ratio |
| CR | Current ratio = current assets/current liabilities |
| CAT | Current assets turnover = sales/current assets |
| D/E | Debt to equity ratio |
| Variable | Mean | Std. Dev. | Min | Max |
|---|---|---|---|---|
| E/L | 1.317359 | 2.751604 | −0.28862 | 31.56228 |
| ROS | 0.043808 | 0.090276 | −0.39727 | 0.482496 |
| ROI | 0.055478 | 0.114313 | −0.31327 | 0.591286 |
| QR | 1.155496 | 1.716645 | 0.017055 | 20.69541 |
| AT | 1.827275 | 0.979476 | 0.250104 | 7.832292 |
| DR | 0.601763 | 0.247309 | 0.03071 | 1.405719 |
| FL | 5.670203 | 16.79358 | −101.806 | 166.3051 |
| NWC/A | 0.202056 | 0.289388 | −1.05706 | 0.819416 |
| CR | 2.194666 | 2.147463 | 0.097574 | 22.9207 |
| CAT | 3.229475 | 1.722648 | 0.50229 | 10.83912 |
| D/E | 4.499063 | 16.55731 | −102.806 | 165.3051 |
| Variable | E/L | ROS | ROI | QR | AT | DR | FL | NWC/A | CR | CAT | D/E |
|---|---|---|---|---|---|---|---|---|---|---|---|
| E/L | 1 | ||||||||||
| ROS | 0.2268 d | 1 | |||||||||
| ROI | 0.1558 c | 0.8333 d | 1 | ||||||||
| QR | 0.5489 d | 0.1736 d | 0.1732 d | 1 | |||||||
| AT | −0.1679 d | −0.0082 | 0.2215 d | −0.0432 | 1 | ||||||
| DR | −0.6052 d | −0.3771 d | −0.4243 d | −0.4251 d | 0.0892 | 1 | |||||
| FL | −0.1113 b | −0.0606 | −0.0880 | −0.1048 | −0.0330 | 0.2628 d | 1 | ||||
| NWC/A | 0.2848 d | 0.3731 d | 0.3748 d | 0.4677 d | 0.0460 | −0.6055 d | −0.2804 d | 1 | |||
| CR | 0.5670 d | 0.1837 c | 0.1418 b | 0.9114 d | −0.1274 a | −0.5146 d | −0.1409 b | 0.6284 d | 1 | ||
| CAT | −0.0594 | −0.1112 a | 0.0529 | −0.1343 b | 0.6721 d | 0.1215 a | 0.0484 | −0.3729 d | −0.2478 d | 1 | |
| D/E | −0.1086 a | −0.0528 | −0.0830 | −0.1024 | −0.0284 | 0.2631 d | 0.9980 d | −0.2788 d | −0.1381 b | 0.0515 | 1 |
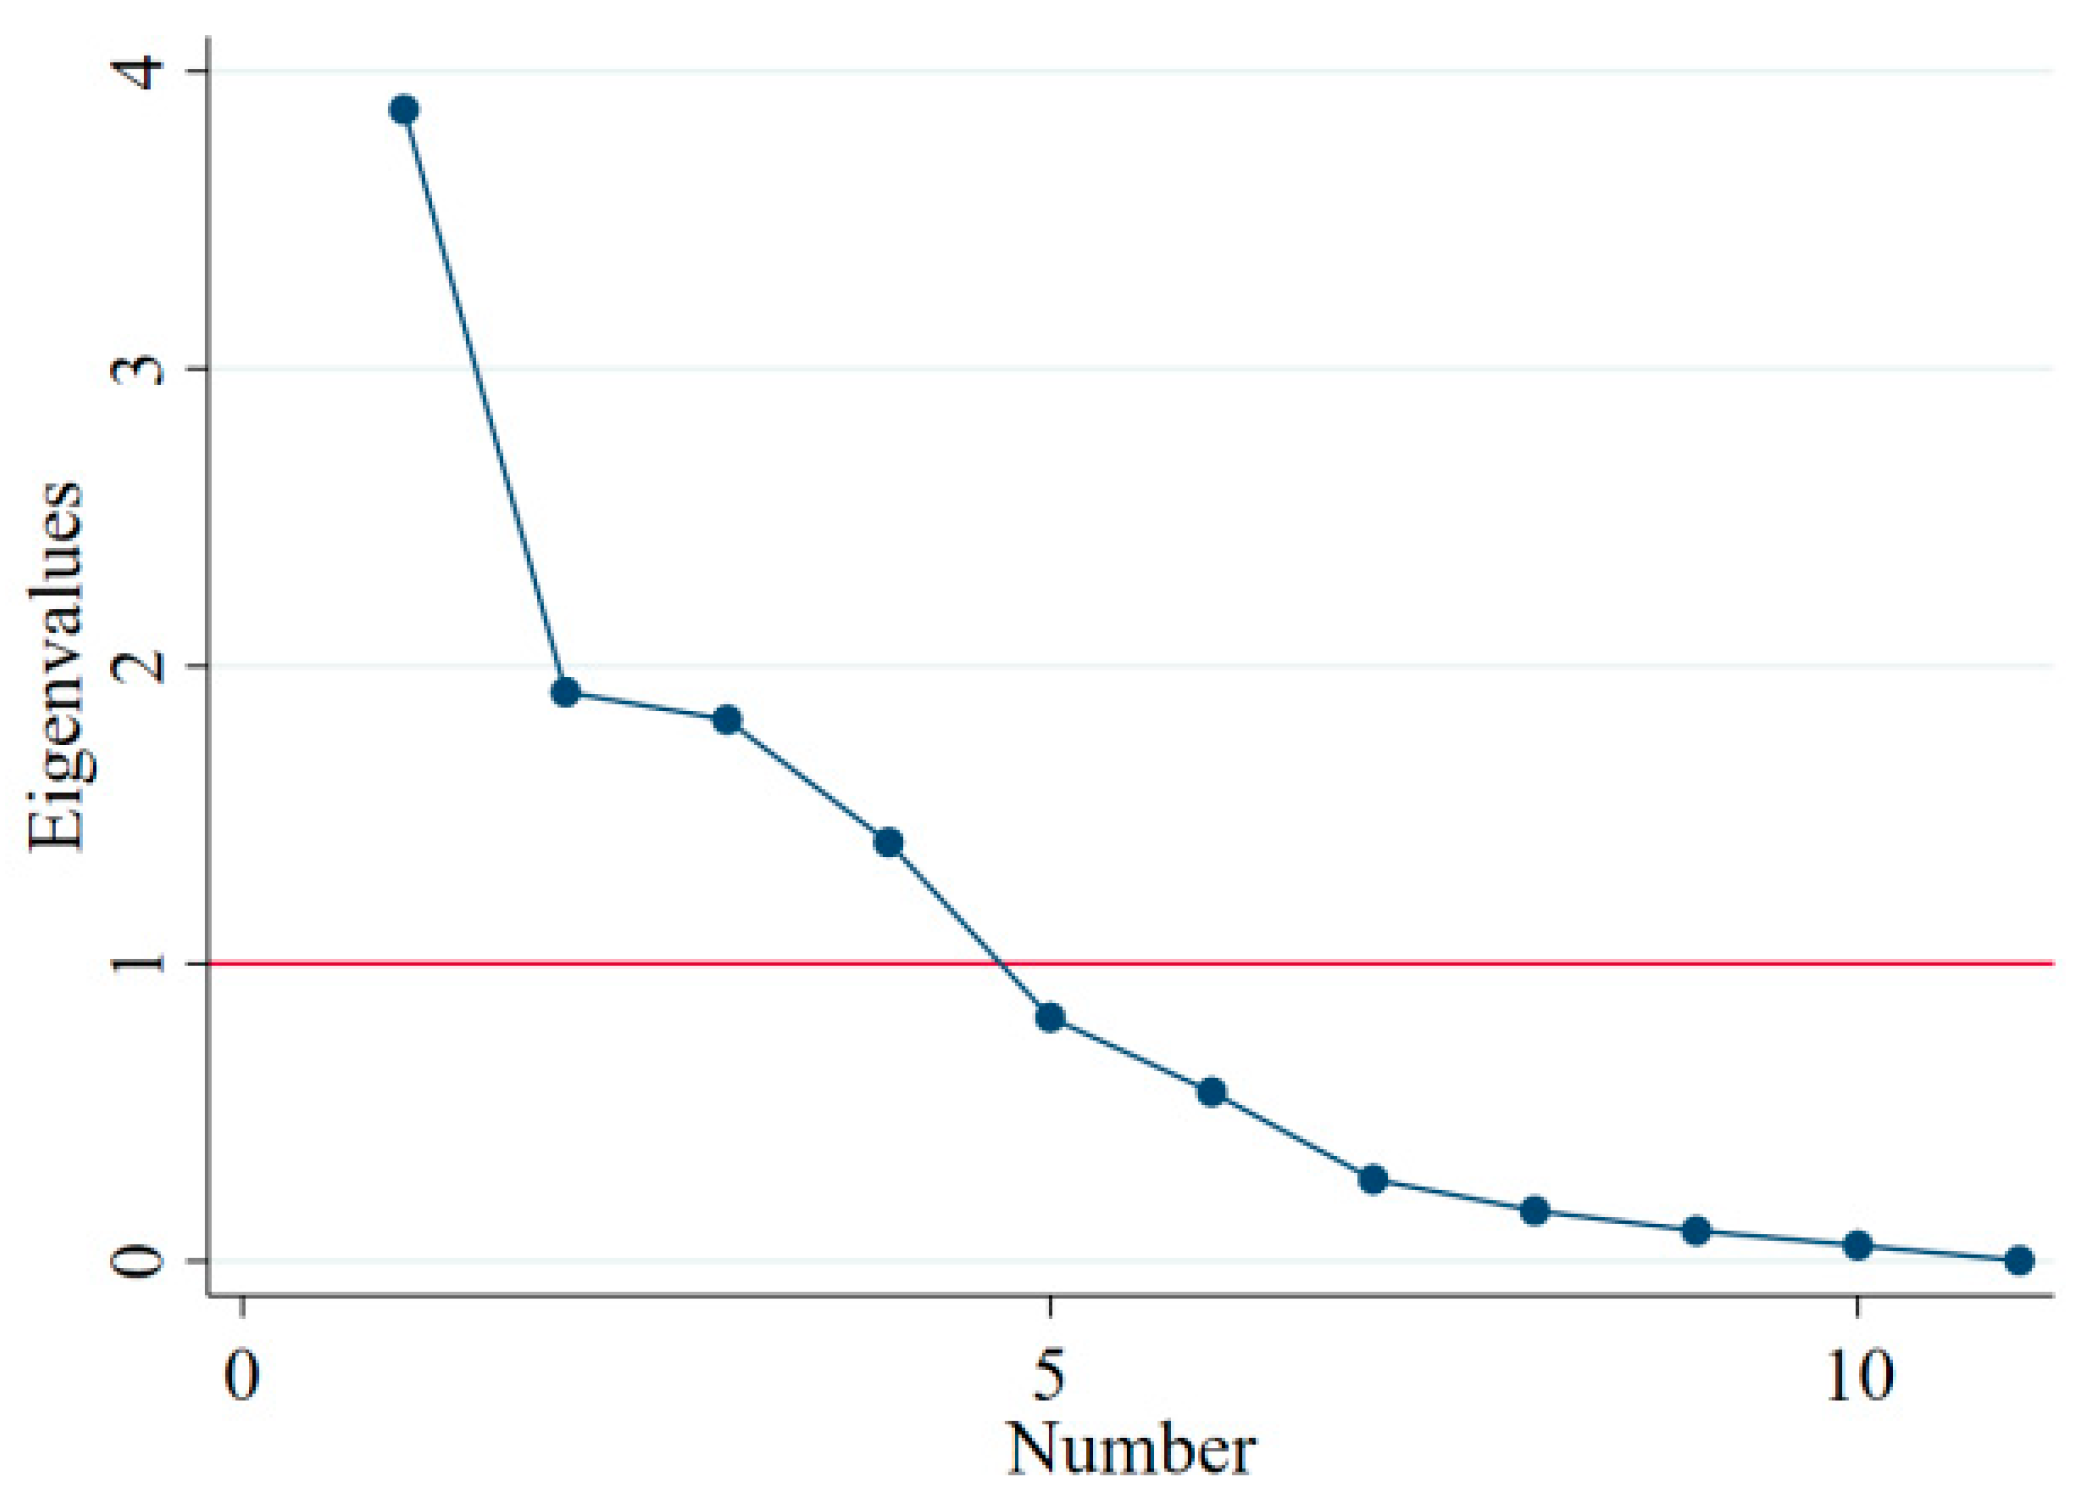
| Factor | Eigenvalue | Difference | Proportion | Cumulative |
|---|---|---|---|---|
| Factor 1 | 3.8711 | 1.9582 | 0.3519 | 0.3519 |
| Factor 2 | 1.9129 | 0.0929 | 0.1739 | 0.5258 |
| Factor 3 | 1.8200 | 0.4124 | 0.1655 | 0.6913 |
| Factor 4 | 1.4076 | 0.5882 | 0.1280 | 0.8192 |
| Factor 5 | 0.8194 | 0.2511 | 0.0745 | 0.8937 |
| Factor 6 | 0.5683 | 0.2937 | 0.0517 | 0.9454 |
| Factor 7 | 0.2746 | 0.1052 | 0.0250 | 0.9704 |
| Factor 8 | 0.1694 | 0.0676 | 0.0154 | 0.9858 |
| Factor 9 | 0.1018 | 0.0489 | 0.0093 | 0.9950 |
| Factor 10 | 0.0529 | 0.0510 | 0.0048 | 0.9998 |
| Factor 11 | 0.0019 | 0.0002 | 1 |
| Variable | Factor 1 | Factor 2 | Factor 3 | Factor 4 |
|---|---|---|---|---|
| E/L | 0.748781 | 0.112240 | 0.034428 | −0.045771 |
| ROS | 0.093536 | 0.926614 | −0.004238 | −0.082619 |
| ROI | 0.086565 | 0.939693 | 0.039352 | 0.147577 |
| QR | 0.906875 | 0.042029 | 0.017883 | −0.003109 |
| AT | −0.050905 | 0.127969 | 0.056484 | 0.894689 |
| DR | −0.614979 | −0.444085 | −0.245355 | 0.082930 |
| FL | −0.066312 | −0.031874 | −0.990388 | −0.001757 |
| NWC/A | 0.559429 | 0.438856 | 0.288548 | −0.186813 |
| CR | 0.931262 | 0.065504 | 0.071269 | −0.129172 |
| CAT | −0.109651 | −0.070487 | −0.053815 | 0.920243 |
| D/E | −0.064453 | −0.026275 | −0.991177 | 0.002311 |
| Expl. Var. | 2.980915 | 2.173148 | 2.120997 | 1.736496 |
| Prp. Totl. | 0.270992 | 0.197559 | 0.192818 | 0.157863 |
Publisher’s Note: MDPI stays neutral with regard to jurisdictional claims in published maps and institutional affiliations. |
© 2021 by the authors. Licensee MDPI, Basel, Switzerland. This article is an open access article distributed under the terms and conditions of the Creative Commons Attribution (CC BY) license (http://creativecommons.org/licenses/by/4.0/).
Share and Cite
Štefko, R.; Vašaničová, P.; Jenčová, S.; Pachura, A. Management and Economic Sustainability of the Slovak Industrial Companies with Medium Energy Intensity. Energies 2021, 14, 267. https://doi.org/10.3390/en14020267
Štefko R, Vašaničová P, Jenčová S, Pachura A. Management and Economic Sustainability of the Slovak Industrial Companies with Medium Energy Intensity. Energies. 2021; 14(2):267. https://doi.org/10.3390/en14020267
Chicago/Turabian StyleŠtefko, Róbert, Petra Vašaničová, Sylvia Jenčová, and Aneta Pachura. 2021. "Management and Economic Sustainability of the Slovak Industrial Companies with Medium Energy Intensity" Energies 14, no. 2: 267. https://doi.org/10.3390/en14020267