Article

Effect of Accumulative Recycling of Aqueous Phase on the Properties of Hydrothermal Degradation of Dry Biomass and Bio-Crude Oil Formation

1
School of Agricultural Engineering and Food Science, Shandong University of Technology, Zibo 255000, China
2
Shandong Research Center of Engineering and Technology for Clean Energy, Zibo 255000, China
3
College of Engineering, Huazhong Agricultural University, Wuhan 430070, China
*
Authors to whom correspondence should be addressed.
Energies 2021, 14(2), 285; https://doi.org/10.3390/en14020285
Submission received: 16 December 2020 / Revised: 31 December 2020 / Accepted: 2 January 2021 / Published: 7 January 2021
(This article belongs to the Special Issue HTL Biocrude Production, Optimization, and Upgrading)

Abstract

:
For hydrothermal liquefaction of dry biomass to produce liquid fuels, water needs to be added or the aqueous phase products can be recycled. This paper focuses on understanding the relationship between hydrothermal degradation of the dry biomass and oil formation under the condition of accumulative recycling of the aqueous phase. Completely dried corn stalk and deionized water were used for the hydrothermal liquefaction (HTL) experiment. The aqueous products for subsequent recycling were not diluted. It was demonstrated that the recycling of the aqueous can promote the enrichment of organic acids and the conversion of ketones and phenols in the aqueous, improving the yield and quality of Bio-crude oil. After recycling, the yield of Bio-crude oil increased from 20.42% to 24.31% continuously, and the oxygen content decreased from 13.34% to 9.90%. Although the process was accompanied by solid deposition and had a negative impact on the hydrothermal degradation efficiency, the formation of carbon microspheres during the deposition enhanced the utilization of nondegradable solids, while the formation of metal salt particles had a positive impact on oil production. After three rounds of recycling, the solid deposition effect was weakened. At this time, oil production and solids degradation can be promoted simultaneously.

1. Introduction

Crop straws are typically dry biomass and composed mainly of cellulose, hemicellulose, and lignin [1]. Crop straws have abundant reserves, especially corn stalk [2]. Every year, a large number of corn stalk are burned in the fields and buried in the open, which causes great waste of resources and serious environmental issues [3]. With the depletion of fossil fuels and the associated environmental issues, there has been much attention in the recent years to the conversion of lignocellulose to liquid fuels [4]. Among them, the most common methods are biochemical and thermochemical methods. For example, biomass is converted into fuel ethanol by microbial fermentation, which can be used as vehicle fuel alone or mixed with gasoline and diesel. There are two typical routes to thermochemical liquefaction, fast pyrolysis liquefaction (FPL) and hydrothermal liquefaction (HTL) [5]. FPL is generally used for the preparation of liquid fuels from dry biomass due to the feedstock characteristics, technical difficulties, and equipment costs. In contrast to FPL, the HTL technology for biomass has only been gradually studied in the recent years [6]. HTL is a process of thermal decomposition and re–polymerization of biomass into liquid organic components in sub– or near–critical water at 250–370 °C and 5–15 MPa for a certain residence time (0–2 h). In this process, the unique properties of subcritical water, with its high ion product and low dielectric constant, behave similarly to those of the organic solvents [7]. Therefore, it makes the HTL process of biomass more advantageous than FPL. Specifically, this is demonstrated by the raw materials that do not need to be dried and are widely available, lower conversion temperatures and heating rates, higher biomass conversion rates [8]. In addition, oil produced from HTL has higher energy density and superior fuel properties such as thermal and storage stability compared to pyrolysis bio–oil [9]. As water plays a key role in the HTL process, hydrothermal degradation is currently mainly done with wet biomass [10]. For the hydrothermal degradation of dry biomass, on the one hand, water can be added directly and on the other hand, the aqueous phase products can be recycled.
Due to the use of water as a reaction medium, the HTL generates a large amount of process wastewater, especially when additional water is required to meet the scale of industrial production, recycling of which is important for economic and sustainable production. As a result, aqueous phase recycling has become an important aspect that cannot be ignored and is beginning to receive attention [11]. Because the wastewater, in many circumstances, can be considered as a “negative–cost” feedstock [12]. For example, reuse of the aqueous phase produced by the hydrothermal degradation of barley straw at 300 °C led to increased yield and higher heating values of the Bio-crude oil and nondegradable solids (NDS) [13]. It was proved that organic acids in the aqueous phase could produce catalytic dehydration reaction after the hydrothermal degradation of poplar sawdust at 220 °C, and the carbon content of NDS increased with the aqueous phase recycling [14]. Experiments carried out in a continuous reactor have shown that recycling of the aqueous phase from the hydrothermal conversion of poplar and glycerol resulted in high–quality Bio-crude oil and reduced coke formation, and, thus, extending the life of the reactor [15]. As it is not possible to recover all the aqueous phase products during the experiments, current studies use additional water replenishment to maintain the quality of the aqueous phase products, which is equivalent to the dilution of the aqueous phase products. Hence, the cumulative effects of the aqueous phase recycling can not be studied properly.
Besides, it is difficult to understand the process of Bio-crude oil formation from the HTL of biomass because of the involvement of complex four–phase product conversion reactions in the hydrothermal degradation of biomass [16]. Studies involving the construction of reaction networks and kinetic models [17,18] have shown that in the early stages of hydrothermal degradation of biomass, around 20–50% of the water–soluble organics are transferred to the aqueous phase [19]. The conversion of aqueous phase into Bio-crude oil is the main reaction pathway, and then, there are complex interconversion relationships between the products. Therefore, it is relatively difficult to understand the Bio-crude oil formation process of biomass by studying the transformation relationships between the multiphase products. In this manuscript, a simple method has been used to understand how the process of hydrothermal degradation relates to the Bio-crude oil formation by directly studying the properties of NDS. Very few studies have been carried out to study the Bio-crude oil formation process systematically using this method. Understanding of the NDS after accumulative recycling of the aqueous phase is also not clear. The properties of NDS are of great importance for the hydrothermal conversion process. The hydrothermal generation of NDS is accompanied by the solidification of coke and metal salts as well as reversible reactions of the hydrolyzed substances through polymerization and re–polymerization to produce carbon–derived deposits. These solids can affect the normal operation of the equipment by creating blockages in the system [20]. Solid deposition is an inevitable part of the hydrothermal degradation process and systematic understanding of the effects of aqueous phase recycling on the deposition properties of the solids is still lacking [21].
This manuscript focuses on the relationship between the hydrothermal degradation of dry biomass and Bio-crude oil formation under accumulative aqueous phase recycling. In this work, dried corn stalk and deionized water were used for the HTL experiment and the aqueous phase products from each recycling were not diluted during the recycling steps. Characterization of the collected hydrothermal solids followed by back–extrapolation of the relationship between the hydrothermal solids and the hydrothermal degradation process was carried out to understand the combined properties of nondegradable substances. By analyzing the properties of the collected hydrothermal solids, the comprehensive properties of NDS are understood, and then the relationship with the hydrothermal degradation process is deduced. Finally, the understanding of hydrothermal degradation and oil formation of biomass under the water phase accumulation cycle is established based on the analysis of the characteristics of the generated Bio-crude oil. The results show that the cumulative aqueous phase recycling can promote oil production and carbonation processes. Moreover, it can achieve the goal of water saving. Although solid deposition effect occurs during the recycling, which affects the hydrothermal degradation efficiency, the deposition effect can be weakened after three rounds of the recycling. It can promote both oil production and degradation.

2. Materials and Methods

2.1. Raw Materials and Analytical Methods

Dry biomass was selected from corn stalk with large reserves. After natural air drying, it was crushed, sieved, dried, and then sealed at 40–60 mesh. Before the experiment, the stalk was dried to a constant weight at 105 °C. The proximate analysis was performed according to the standards (ASTM D1102–84(2013) and ASTM 872–82(2013)). Ultimate analysis (CHNS/O) was analyzed by a fully automated elemental analyzer (EuroEA3000, Milan, Italy). The chemical compositions were analyzed by a semi–automatic fiber analyzer (ANKOM A220i, New York, NY, USA). The above analyses were repeated three times.

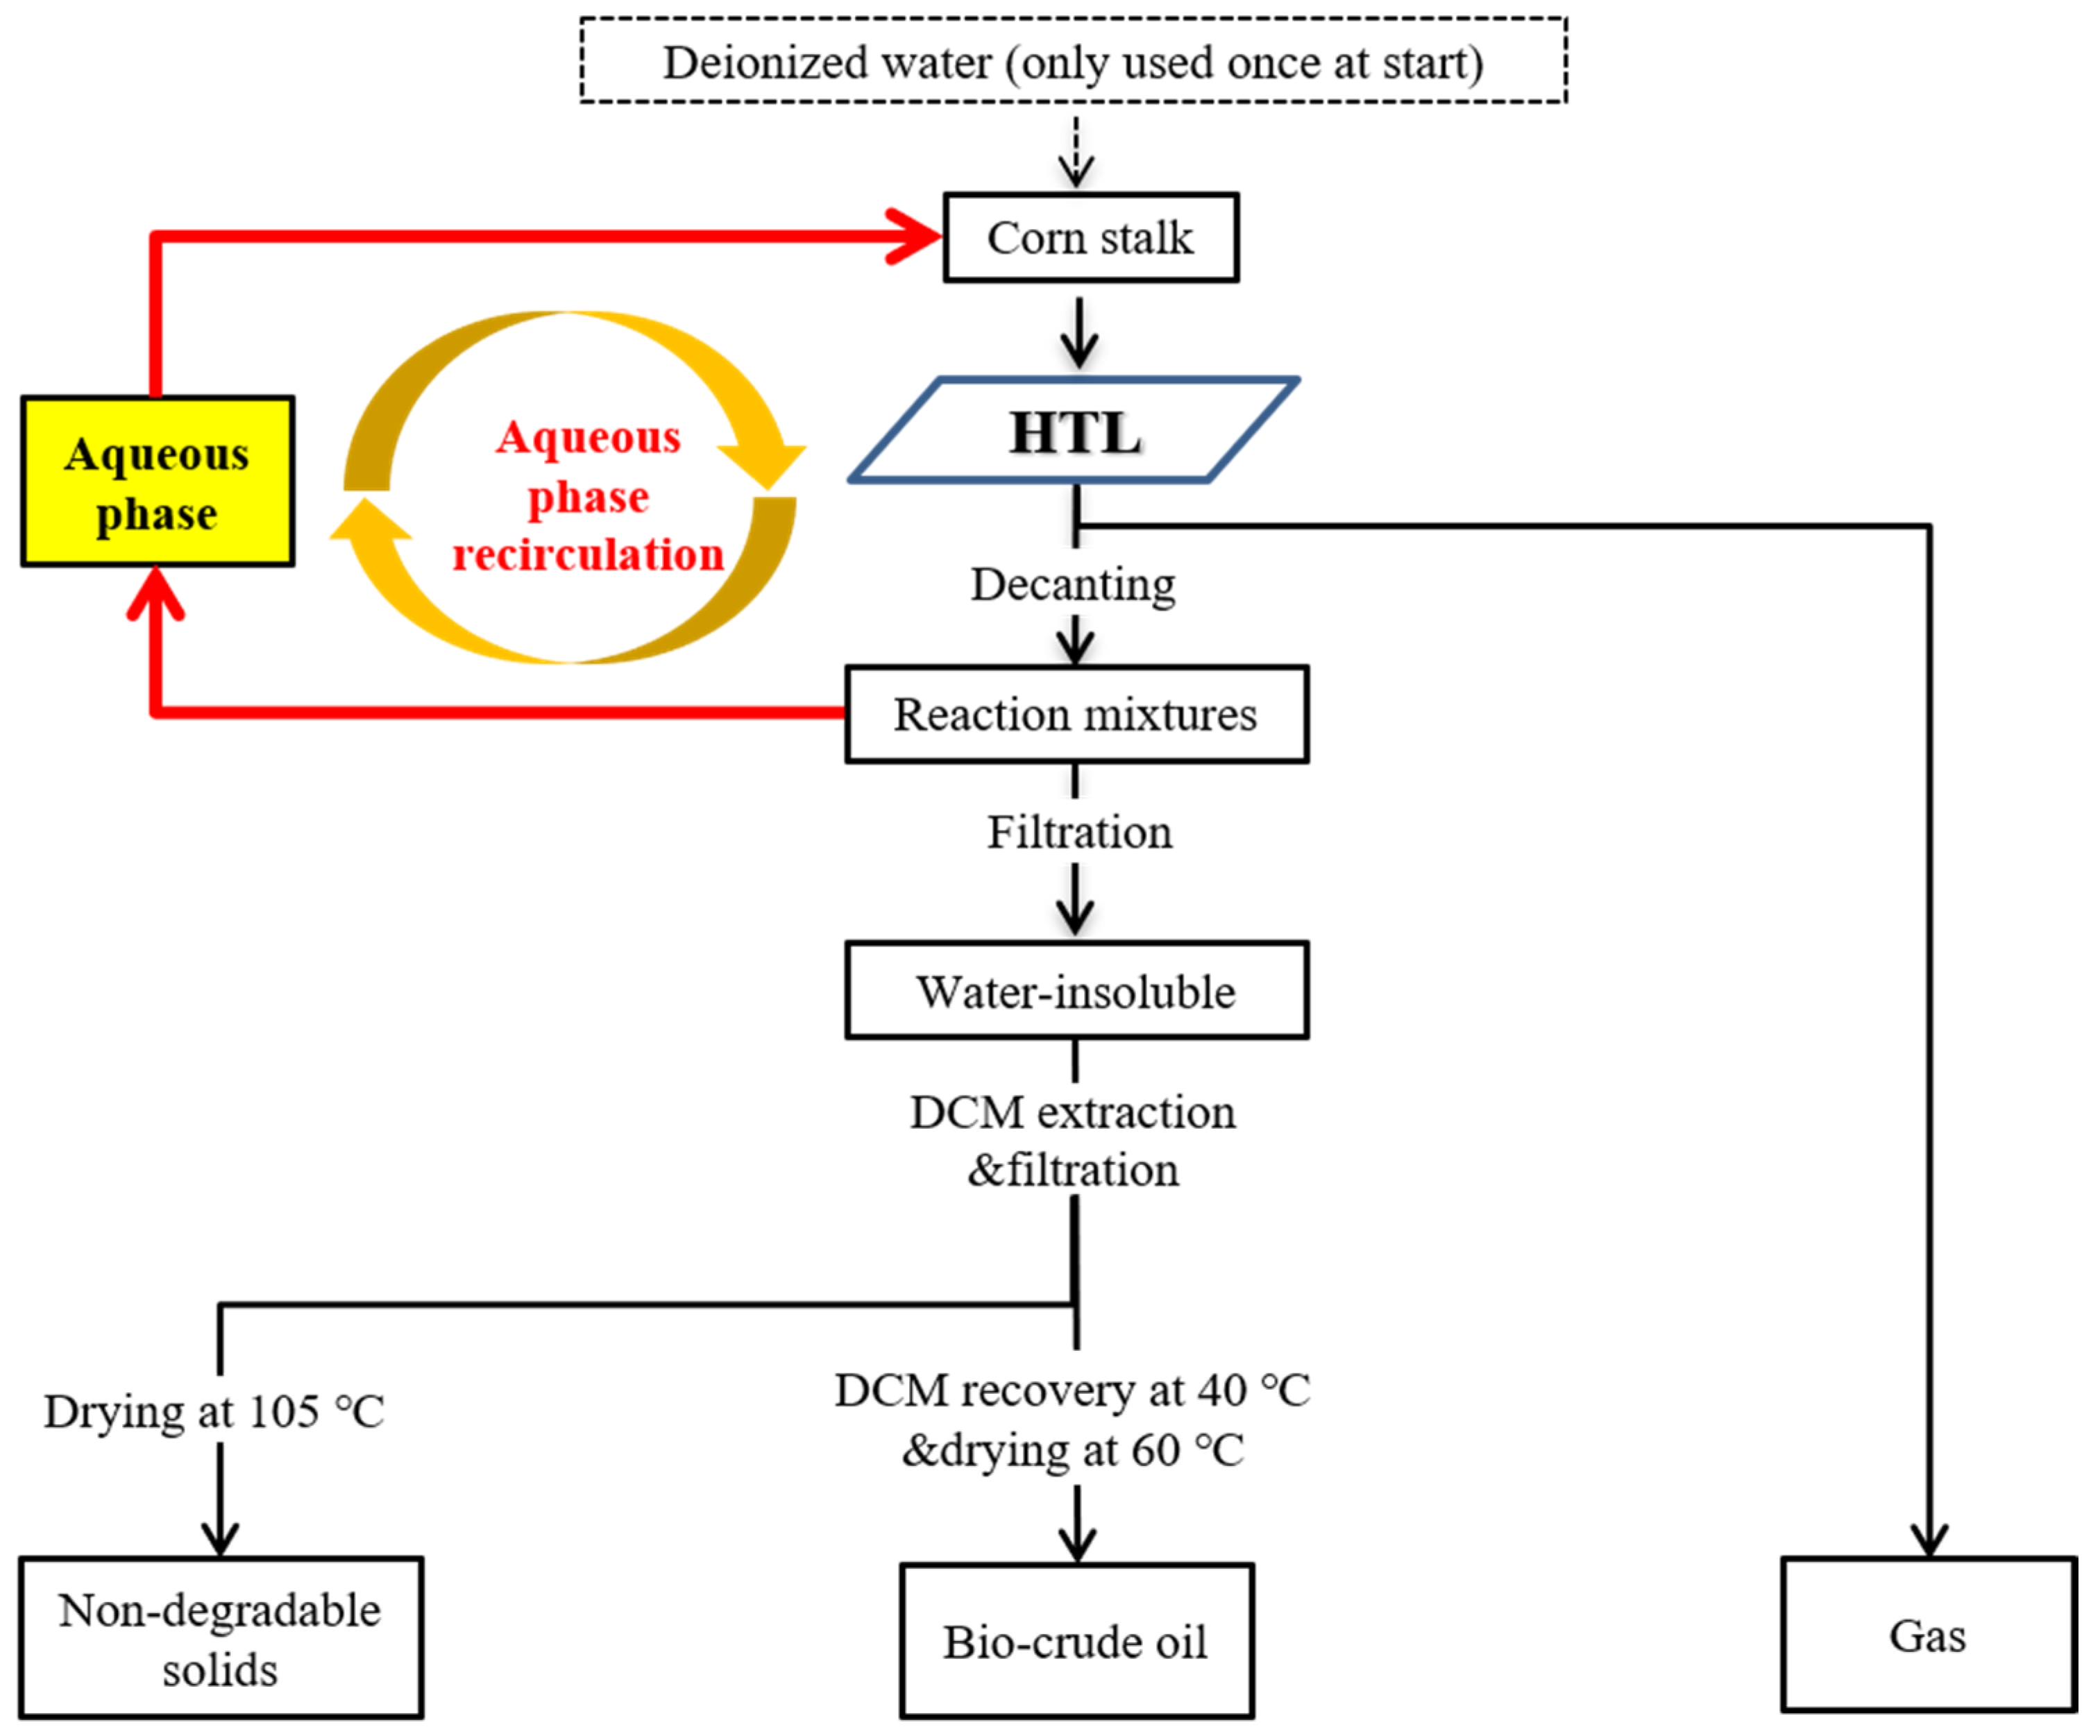
2.2. HTL Experimental Methods

For the first HTL experiment, 6 g dried stalk and 54 g deionized water were added to a high–pressure reactor (Parr 4575A, Moline, IL, USA). Nitrogen was passed through the reactor for more than three times to remove air. The speed was set as 300 rpm. Then the pre–mixing was started. After that, the air–tightness of the reactor was observed for 30 min without leakage, then the temperature was increased to 300 °C at the rate of 10 °C/min and then kept for 30 min. The experiment was repeated three times under the same conditions for each group. Immediately after the reaction was completed, the heating was stopped and the reactor was cooled to room temperature for 50 min by using a chiller. The product separation and collection procedure was shown in Figure 1. The gas was discharged and the mixed products were filtered to obtain the water–insoluble and aqueous phase products (AP). The collected aqueous products were filtered through a 0.45 µm membrane and then the indicators were measured. The water–insoluble matter was extracted with dichloromethane (DCM) for further separation. The DCM–insoluble matter was dried at 105 °C for 24 h and defined as nondegradable solids (NDS). After drying, it was weighed to obtain the exact weight of the NDS; the obtained DCM soluble matter was defined as the Bio-crude oil (BO). The DCM was recovered by rotary evaporation at 40 °C and dried under vacuum (60 °C, vacuum <133 pa) for 8 h to remove water and then accurately weighed to obtain the weight of BO.
Except for the initial HTL experiment, no additional deionized water was added in the cumulative recycling experiment. The initial HTL experiment was conducted as the control group (C0), and the medium used for the first aqueous phase recycling was the aqueous phase product collected in the C0 group, which was recorded as C1, and so on, until three recyclings (C1–C3) were conducted. Due to the aqueous phase losses in the actual process, the content of aqueous phase after each recycling was less than 54 g. Due to unavoidable losses during operation, the mass of the aqueous phase product after recovery is about 48 g, with a loss of about 6 g. Actually, water cannot be lost because the hydrothermal liquefaction process is accompanied by the occurrence of dehydration reactions. In this study, the aqueous phase from repeated parallel experiments was mixed and combined before the next recycling. The other operations were identical to the initial experiment.

2.3. Analysis and Calculation Methods

2.3.1. Analysis of HTL Products

The compositional changes of AP and BO were identified using a gas chromatography–mass spectrometry (GC–MS) analyzer (Agilent 5973–6890 N, San Diego, CA, USA). High–purity helium (99.999%) was used as the carrier gas; the inlet temperature, interface temperature, and ion source temperature were respectively set at 280 °C, 250 °C, and 150 °C. The mass spectrometer was having an EI source, 70 eV; the scan range (m/z) was 20–550 amu. The aqueous phase was analyzed using a DB–1701 column (60 m × 250 μm × 0.25 μm). The aqueous phase was extracted with DCM, filtered with a 0.22 μm filter membrane, and determined on the machine. The GC oven temperature program was as follows: starting at 40 °C, raised to 240 °C at a rate of 5 °C/min (held for 5 min). The Bio-crude oil was analyzed using an HP–5MS column (60 m × 320 μm × 1 μm). The sample was first diluted with DCM, filtered with 0.45 μm organic membrane, and then determined on the machine. The Bio-crude oil was warmed up as follows: started at 40 °C, raised to 120 °C at a rate of 10 °C/min (held for 2 min), and finally raised to 240 °C at a rate of 5 °C/min (held 5 min).
Proximate analysis and ultimate analysis of the NDS were performed as in Section 2.1. Inorganic elements in the NDS were measured by inductively coupled plasma emission spectrometer (ICP–OES, Agilent 725ES, Santa Clara, CA, USA) after microwave digestion and ash firing at 575 °C. The NDS were sampled by potassium bromide (KBr) crushing and were analyzed by a Fourier Transform Infrared (FT–IR) spectrometer (Thermo Nicolet 5700, Waltham, MA, USA) with an attenuated total reflectance (ATR) mode between 4000–400 cm−1. Thermogravimetric analysis (TGA) of the NDS and BO were conducted on a synchrothermal analyzer (Jupiter STA449F5, Selb, Germany) under N2 atmosphere at a flow rate of 20 mL/min. The samples were heated from 30 to 800 °C at a heating rate of 20 K/min. The microstructures of the NDS were characterized by scanning electron microscopy (SEM, FEI quanta 250, Hillsboro, OR, USA). The BET surface area, pore volume, and pore size of the NDS were determined using a fully automatic surface area and void analyzer (ASAP2460, Atlanta, GA, USA).

2.3.2. Calculation Methods of Evaluation Indicators

The evaluation of hydrothermal degradation efficiency included Bio-crude oil yield ( w B O ,   d % ) , nondegradable solids yield ( w N D S , d%), and hydrothermal degradation rate ( w H T D , d%). w H T D is an important indicator of the hydrothermal conversion efficiency, which refers to the fractions that have been transformed but are not NDS. The hard–to–degrade organics are mainly organic carbon that remains in the NDS that has coked. Hydrothermal degradation promotes the carbonization process, which results in the carbonization of other volatile substances. Therefore, the content of hard–to–degrade organics can be determined by measuring the volatile organics at high temperatures. The ash content can be obtained by proximate analysis of NDS. The hydrothermal deposition efficiency was measured based on the content of each component of the NDS and the deposition rate (%) of each component. The calculation methods of evaluation indicators were as follows:
  • Calculation of the evaluation indicator for hydrothermal degradation:
    Non degradable   solid   yield   ( w N D S ,   d % ) = Solid   mass Stalk   mass × 100 %
    Hydrothermal   degradation   rate   ( w H T D ,   d % )   =   100 % w N D S
    Bio - crude   oil   yield   ( w B O ,   d % ) = Bio crude   oil   quality Stalk   mass × 100 %
  • Calculation and indicators for the characterization of NDS:
    Hard to degrade   organics   of   NDS   ( w V N D S ,   NDS % ) = Volatile   fractions   of   NDS
    Ash   of   NDS   ( w A s h N D S ,   NDS % ) = Ash   content   of   NDS
    Fixed   carbon   of   NDS   ( w F C N D S ,   NDS % ) = 100 % w V N D S w A s h N D S
  • Calculation of the deposition rates of NDS:
    Fixed   carbon   deposition ( w F C ,   FC % ) = Solid   fixed   carbon   mass   Stalk   fixed   carbon   mass × 100 %
    Hard to degrade   organics   deposition ( w V , daf % ) = Solid   volatile   fraction   mass Stalk   volatile   fraction   mass × 100 %
    Ash   deposition ( w A s h ,   Ash % ) = Solid   ash   mass Stalk   ash   mass × 100 %

3. Results and Discussion

3.1. Characteristics of Raw Materials

3.1.1. Characteristics of Corn Stalk

The characteristics of corn stalk are shown in Table 1. It can be seen from the table that the content of cellulose and hemicellulose of corn stalk is 40.13% and 31.31%, which is much higher than that of lignin (4.74%). Corn stalk had higher volatile fractions, higher oxygen content, and lower sulfur and nitrogen content.

3.1.2. Characteristics of Aqueous Phase

The pH value of the aqueous phase did not change much throughout the recycling and was always between 3.50 and 4.00, which corresponds to the fact that the aqueous phase product of the hydrothermal degradation of lignocellulosic biomass appears acidic. As the aqueous phase recycling progressed, the pH value increased, but the organic acid content also increased. Presumably, the organic acids are involved in the reaction and are consumed.
The value of total organic carbon (TOC) in the aqueous phase can be characterized by the concentration of total organic matter. The value of TOC in group C0 is 26.90 g/L, which is much lower than the TOC content after recycling of the aqueous phase (43.88 to 60.30 g/L). With increasing cycles of aqueous phase recycling, there is a steady increase in the TOC content. From the correlation of the measuring principle, electrical conductance (EC), total dissolved solids (TDS), and salinity (SAL) all three represent the concentration of ions in the water and have a similar tendency to change. The former evaluates the electrical conductivity of liquids, while the latter two are general terms for a class of dissolved solids in the aqueous phase. An increasing trend for all three was observed with the aqueous phase recycling, which indicated that the total dissolved solids and metal salt ions in the aqueous phase products were increasing and the electrical conductivity was enhanced. This indicates that recycling of the aqueous phase promotes the hydrolysis of corn stalk, which has the potential to further improve the efficiency of hydrothermal degradation.
As evident from Table 2, the content of organic acids (mainly acetic acid and propionic acid) in the aqueous phase products are increasing after the cumulative recycling. This indicates that the aqueous phase recycling promotes the hydrolysis and dehydration reactions of cellulose and hemicellulose in corn stalk [22]. The contents of ketones (e.g., 2–cyclopentenone, 3–methyl–2–cyclopenten–1–one) and phenols (e.g., phenol, 2–methoxy–phenol, 4–ethylphenol) were decreasing with the aqueous phase recycling. The phenolic compounds were primarily derived from the degradation of lignin [23,24]. Despite the low content of lignin in corn stalk, the concentration of phenolic compounds in the aqueous phase was high, and it is speculated that the phenolics may also originate from the decomposition of cellulose and hemicellulose [25]. Some alcohols (e.g., 1,3–propanediol) are gradually appearing and increasing in the aqueous phase. These multihydroxy compounds in the aqueous phase help to dissolve the intermediates or products, promoting hydrothermal degradation to oil [13]. In summary, the aqueous phase recycling has an impact on the hydrothermal degradation and oil formation process of corn stalk. To verify this conclusion, a one–way ANOVA was conducted (Section 3.2).

3.2. Significance Analysis

A one–way ANOVA was conducted on the number of aqueous phase recycling with oil production rate, degradation rate, NDS production rate, and solid deposition effect (carbon deposition and ash deposition), as listed in Table 3. Moreover, it can be seen that the significant p–values of one–way ANOVA were all less than the significance level a = 0.05. The significant p–values corresponding to w A s h and w V were less than 0.01. This indicates that the number of aqueous phase recycling has a significant effect on the above dependent variables and has a highly significant effect on w A s h and w V . Therefore, the hydrothermal degradation and oil formation process can be investigated by means of cumulative aqueous phase recycling. In this paper, the properties of the aqueous phase products are further investigated in combination with the properties of NDS (Section 3.3) and the properties of BO (Section 3.4) for further study.

3.3. Effect of Aqueous Phase Recycling on Degradation Based on NDS Characteristics

During hydrothermal degradation, macromolecules in the biomass undergo hydrolysis, decomposition, and depolymerization reactions to form low–molecular–weight intermediates that can be depolymerized to form the NDS [25]. NDS actually contains the unconverted fraction (e.g., inorganic ash), as well as the carbides formed by coking after conversion. They are stable and the yields are not easily affected by the product separation and collection process. Therefore, the analysis of NDS characteristics is helpful to understand the hydrothermal degradation and oil formation of corn stalk.
The overall characteristics of NDS during aqueous recycling are shown in Table 4. In general, the trend of NDS was opposite to w H T D . (1) After the 1st and 2nd recycling of the aqueous phase, an increase in w N D S was accompanied by an increase in w B O and a decrease of w H T D . At this time, the aqueous recycling promoted the degradation of corn stalk into Bio-crude oil, and the free radicals may lead to an increase of w N D S through condensation, cyclization, and depolymerization reactions [24]. Furthermore, the dissolved substances in the aqueous also polymerized to form NDS that affect degradation efficiency. (2) After the 3rd recycling of the aqueous phase, the decrease in w N D S was accompanied by an increase in w B O   and a rebound in w H T D .
From Table 4, it can be seen that both the hydrothermal degradation process and aqueous recycling are accompanied by a solid deposition effect, which also has some influence on the hydrothermal degradation process. Solid deposition effects mainly include carbon deposition of NDS (mainly include fixed carbon deposition and hard–to–degrade organics deposition) as well as ash deposition. Notably, w F C (277.28–309.97%) after recycling was much higher than 100%, indicating that the carbon deposition of the hydrothermal solids was mainly in the form of fixed carbon, which was also continuously generated in the form of higher aggregates during hydrothermal degradation [26]. (1) After the 1st and 2nd recycling of the aqueous phase, an increase in w F C (Equation (7)) and w A s h (Equation (9)) was accompanied by a decrease in w V (Equation (8)) (2) After the 3rd recycling of the aqueous phase, w F C and w A s h decrease while w V still decreases. All the values after recycling are higher than those without recycling, indicating that the aqueous phase recycling produces a deposition effect. After the third recycling, the deposition rates are all reduced, and hydrothermal degradation is more complete at this time.
The above analysis shows that the characteristics of NDS are particularly important for understanding the hydrothermal degradation process of the stalk. The process of hydrothermal degradation and oil formation can be understood indirectly by studying the microscopic morphology (Section 3.3.1 and Section 3.3.2), internal structure (Section 3.3.3), and thermal stability (Section 3.3.4) of NDS.

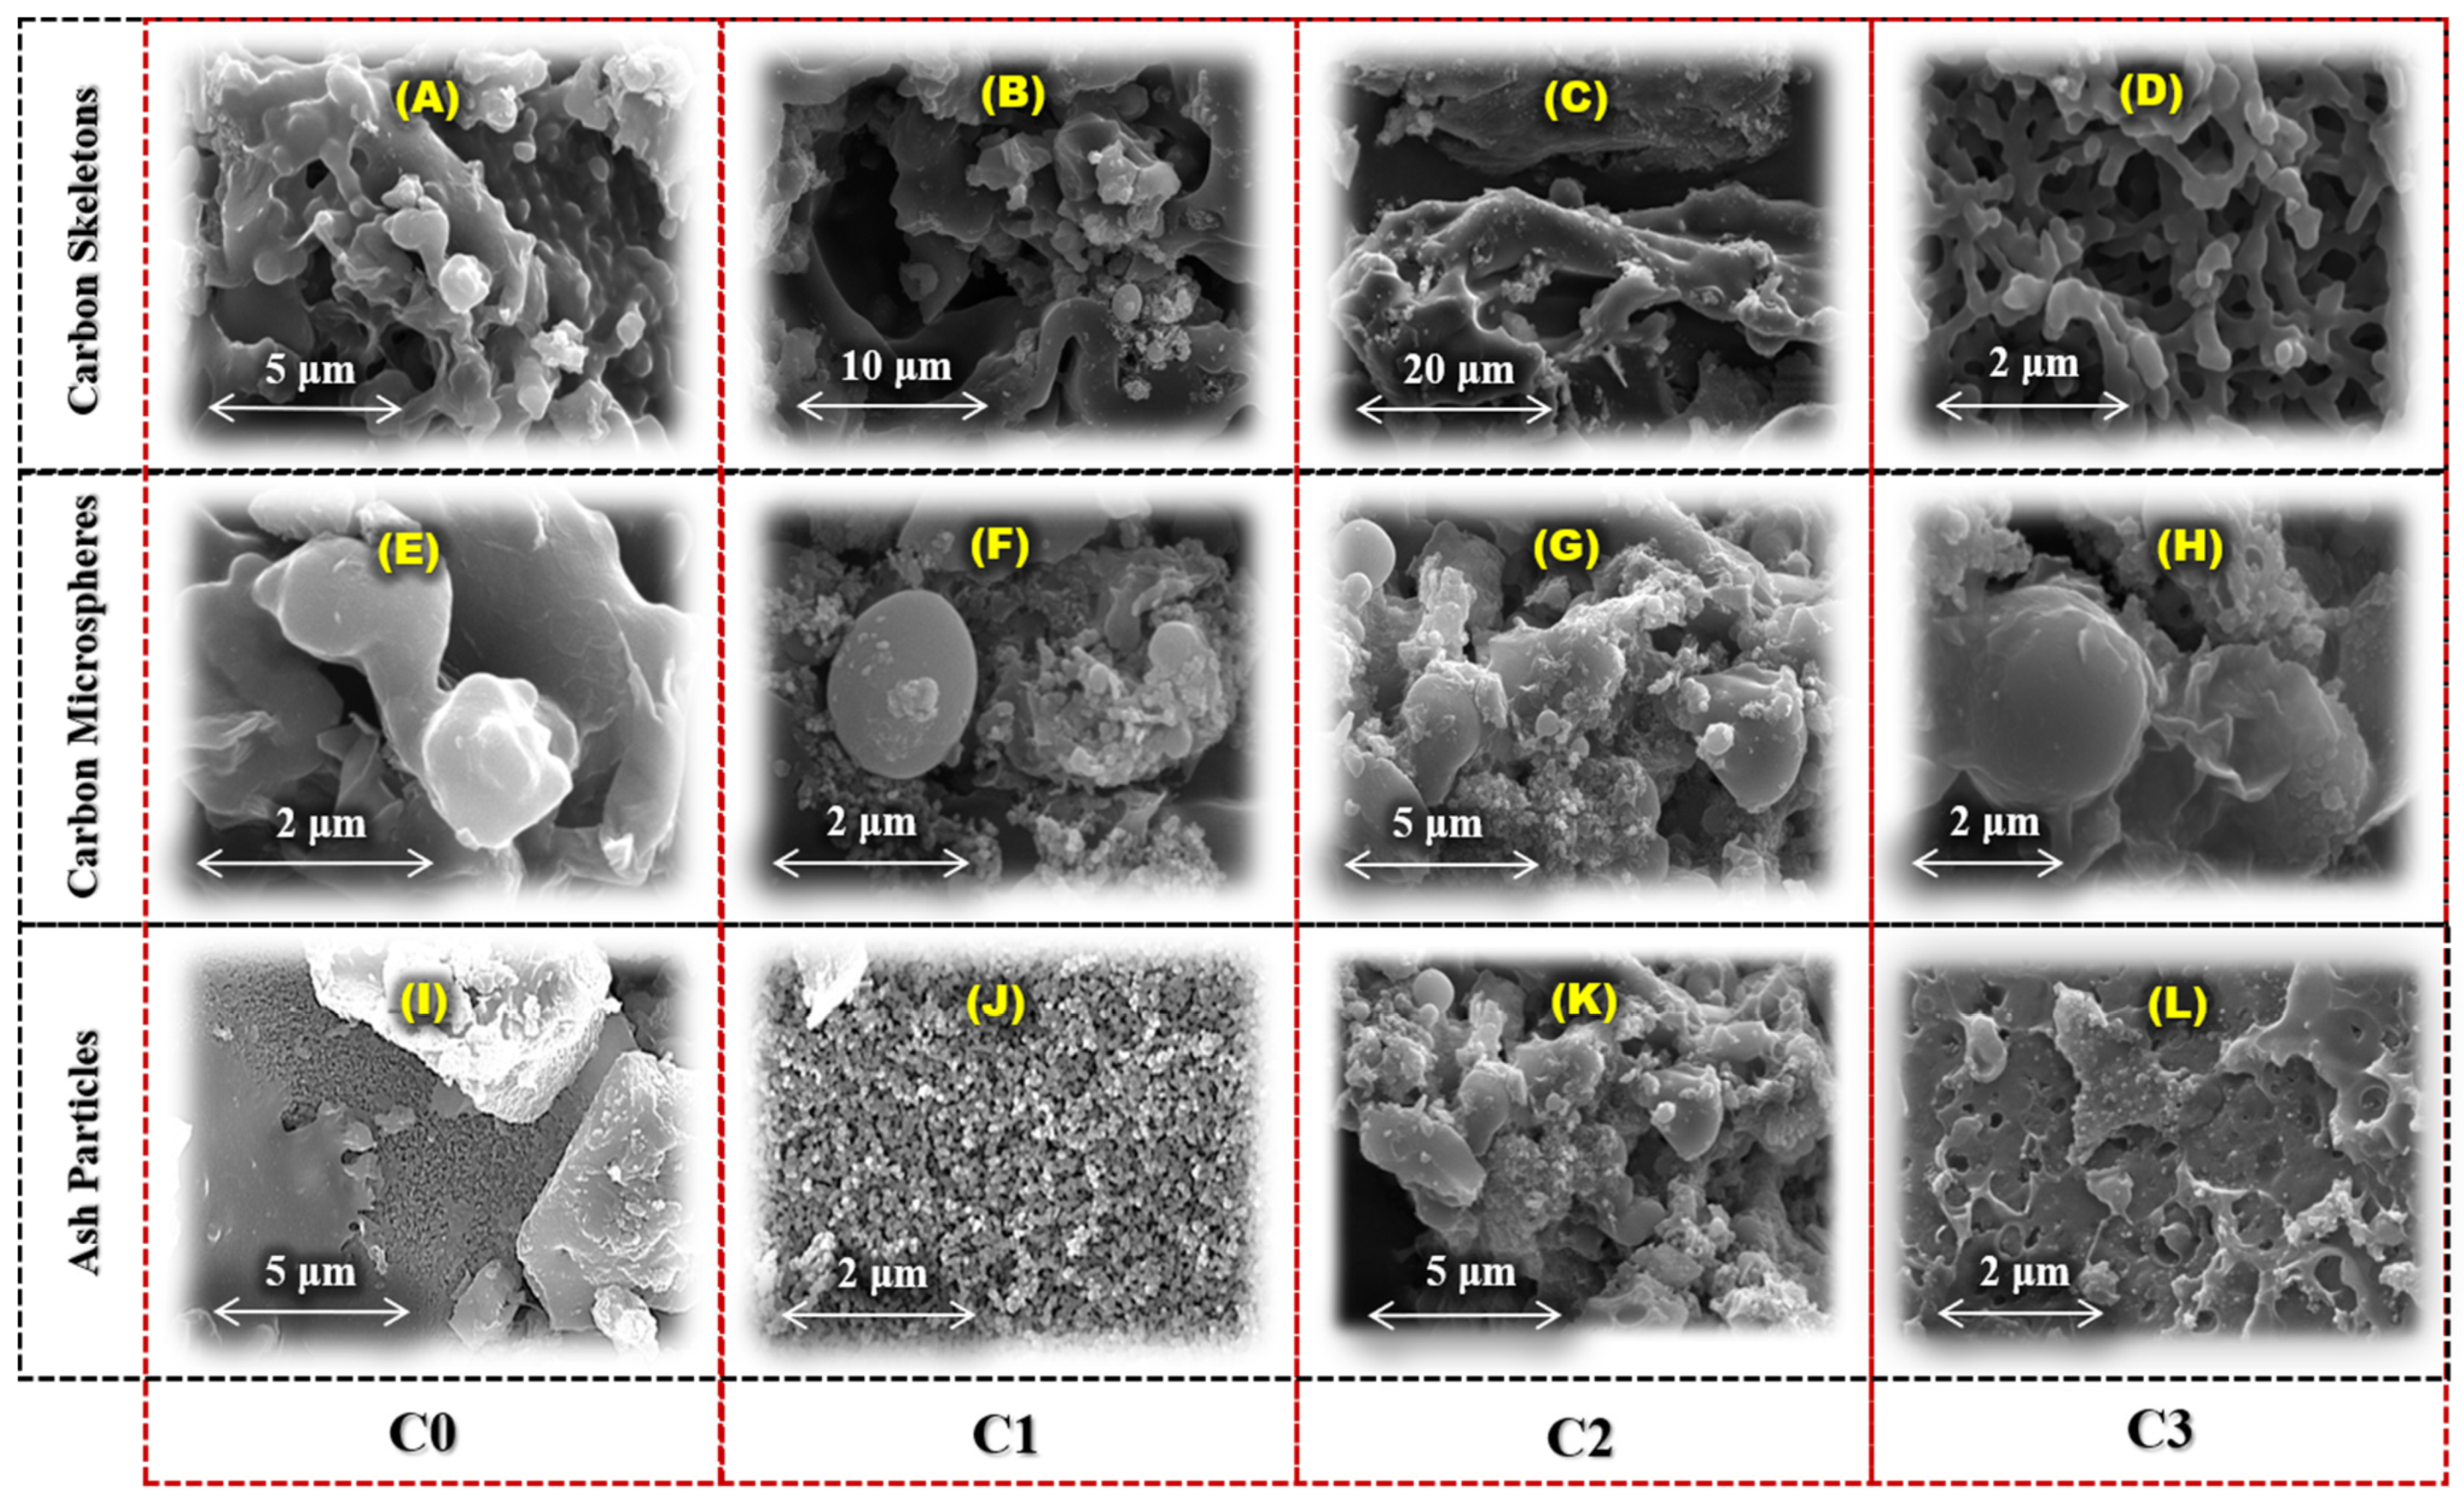
3.3.1. Changes of NDS Microstructure

SEM showed that a distinct carbon skeleton, carbon microsphere structure, deposited metal salt particles, and microscopic morphology of the nondegraded portion of the stalk appeared in the NDS (Figure 2). No significant carbon skeleton structure (Figure 2A) but a higher number of carbon microspheres (Figure 2E) appeared in group C0. The carbon microspheres were formed in groups C1 and C2, along with the appearance of a carbon skeleton similar to the pore structure in the middle of the microspheres (Figure 2B). Irregular agglomerates started appearing around the carbon microspheres in group C2 (Figure 2G), which may be due to the deposited ash. The particle size of the carbon microspheres of the C3 group was further enlarged (Figure 2H), with the observance of concave porous structures and deposited fine particles (Figure 2L). The formation of the carbon microsphere structures is associated with the aromatization of sugars generated by cellulose breakdown [27]. This also confirms that the aqueous phase recycling promotes the decomposition of lignin and a distinct carbon skeleton structure is formed through intermolecular interactions (Figure 2A–D). The formation of carbon skeleton and carbon microsphere (Figure 2A–H) directly proves the existence of carbon deposition effect.
It has been reported that ash deposition at high temperatures produces large, hard, and depositional blocks with burst pores [28]. Therefore, dispersed nanoparticles (Figure 2I–L) have been observed in the NDS. These deposited particles might be crystal matters of metal salts (Al, Fe, etc.) present in the ash. The deposited particles of group C0 were small and a thin carbon film could be seen above the pores (Figure 2I). The pores of group C1 became larger and more numerous (Figure 2J). The particles of group C2 were aggregated into depositional blocks (Figure 2K). It is hypothesized that the aqueous phase recycling promotes the hydrolysis of corn stalks and the organic fraction of stalk further undergoes condensation and other reactions, and the pore size of the deposited particles becomes larger, resulting in deposition blocks (Figure 2J,K) [29]. The surface of group C3 solids becomes smooth and produces many semi–porous structures (Figure 2L). This indicates that the aqueous phase recycling can promote mineral enrichment and solidification, producing a strong ash deposition in the second recycling, which is consistent with the results of the ash content of NDS (Table 4). The characteristics of the major ash–forming metals in NDS are described in Section 3.3.2.

3.3.2. Changes of Major Ash–Forming Metals in NDS

Most of the inorganic elements in the ash are not directly transformed and are eventually deposited as NDS. Elements in the ash are usually present in the form of metal cations (Ca, Fe, K, Mg, Mn, and Na), nonmetallic anions (P, S, Cl), or uncharged species (Si) [30]. This paper focuses on the trends of cation. Table 5 shows the percentages (%) of major ash–forming metals in NDS before and after aqueous phase recycling. As the aqueous phase recycling proceeds, percentages of the major elements of ash in group C2 were up to 2.414%, which showed the same pattern as that of the ash residues. Combined with the observation of the microscopic topography of NDS (Figure 2), the presence of more deposited particles in group C2 (Figure 2K). These macroporous structures can absorb some inorganic substances (e.g., sulfates, phosphates, and halides of K, Ca, Mg, and Al), which explains the deposition of the major ash–forming metals in NDS.
As the aqueous phase recycling proceeds, the following patterns of change were exhibited by the major ash–forming metals in NDS: (1) From the beginning of the recycling up to the second cumulative recycling, there is a continuous increase reaching to the highest values (e.g., Ca, Mg, Mn, Mo), fully consistent with the trends in ash deposition and fixed carbon deposition characteristics. (2) A decreasing trend has been observed since the beginning of recycling, but all are lower than the unrecycled group C0 (e.g., Al, Ni, Cr, Ba), which is the opposite to the organic deposition trend. (3) A decreasing trend has been observed (e.g., Fe, Ti), which is opposite to the changes in acid intensity, the yield of Bio-crude oil, and TOC concentration. After the 3rd recycling of the aqueous phase, the percentages of most of the inorganic elements decreased and were lower than those without the recycling, which is opposite to the trend of electrical conductance (EC) and salinity (SAL) in the aqueous phase. Combined with Figure 2L, it is assumed that the pores on the solid surface of group C3 are clogged and the deposition effects of ash and its metallic elements are weakened. In addition, although the total dissolved solids and ash–forming metal salt ions in the aqueous phase products are increasing, these substances are mainly used to promote the Bio-crude oil production, resulting in low content in the NDS [31].
It has been shown that the presence of alkali (earth) metal salts (K, Na, Ca, etc.) in ash has a catalytic effect that may promote Bio-crude oil production [32] and possibly coking carbonization [33]. However, this study demonstrates that the 3rd aqueous phase accumulative recycling can positively promote both oil production and hydrothermal degradation, as well as the degradation of ash–forming metals. It is of great significance in improving the heat and mass transfer and coking and slagging in thermochemical processes.

3.3.3. Changes of Internal Structure in NDS

The surface area, pore volume, and pore size distribution can give a further understanding of the internal structural characteristics of NDS [34]. As shown in Table 6, the maximum surface area of NDS in group C0 is 12.20 m2/g while the pore size is smaller and only 18.25 nm. Aqueous phase recycling leads to a large reduction of the surface area fluctuating between 4.00 and 6.70 m2/g. However, the pore size of NDS in C1 and C2 groups reached 36.15 nm and 20.29 nm, respectively, which was much larger than that in group C0. This can be related to the change of volatile organics. In combination with Figure 2, it can be assumed that a larger number of microporous structures was generated in group C0. With aqueous phase recycling, hydrothermal degradation process is enhanced and thereby generating more volatiles. These precipitated volatiles lead to the formation of pores with different sizes, resulting in the changes of surface area and pore size. The deposition particles in C1 and C2 groups were significantly larger, but the number was decreased. So the surface area was less than that in C0 group. After the 3rd recycling of the aqueous phase, the pore channels of these deposits are disrupted or clogged, which affects the escape of volatiles. This results in decreased pore size and minimum surface area. This is consistent with the fact that many semi–pore structures were observed only in the NDS of the C3 group (Figure 2L).

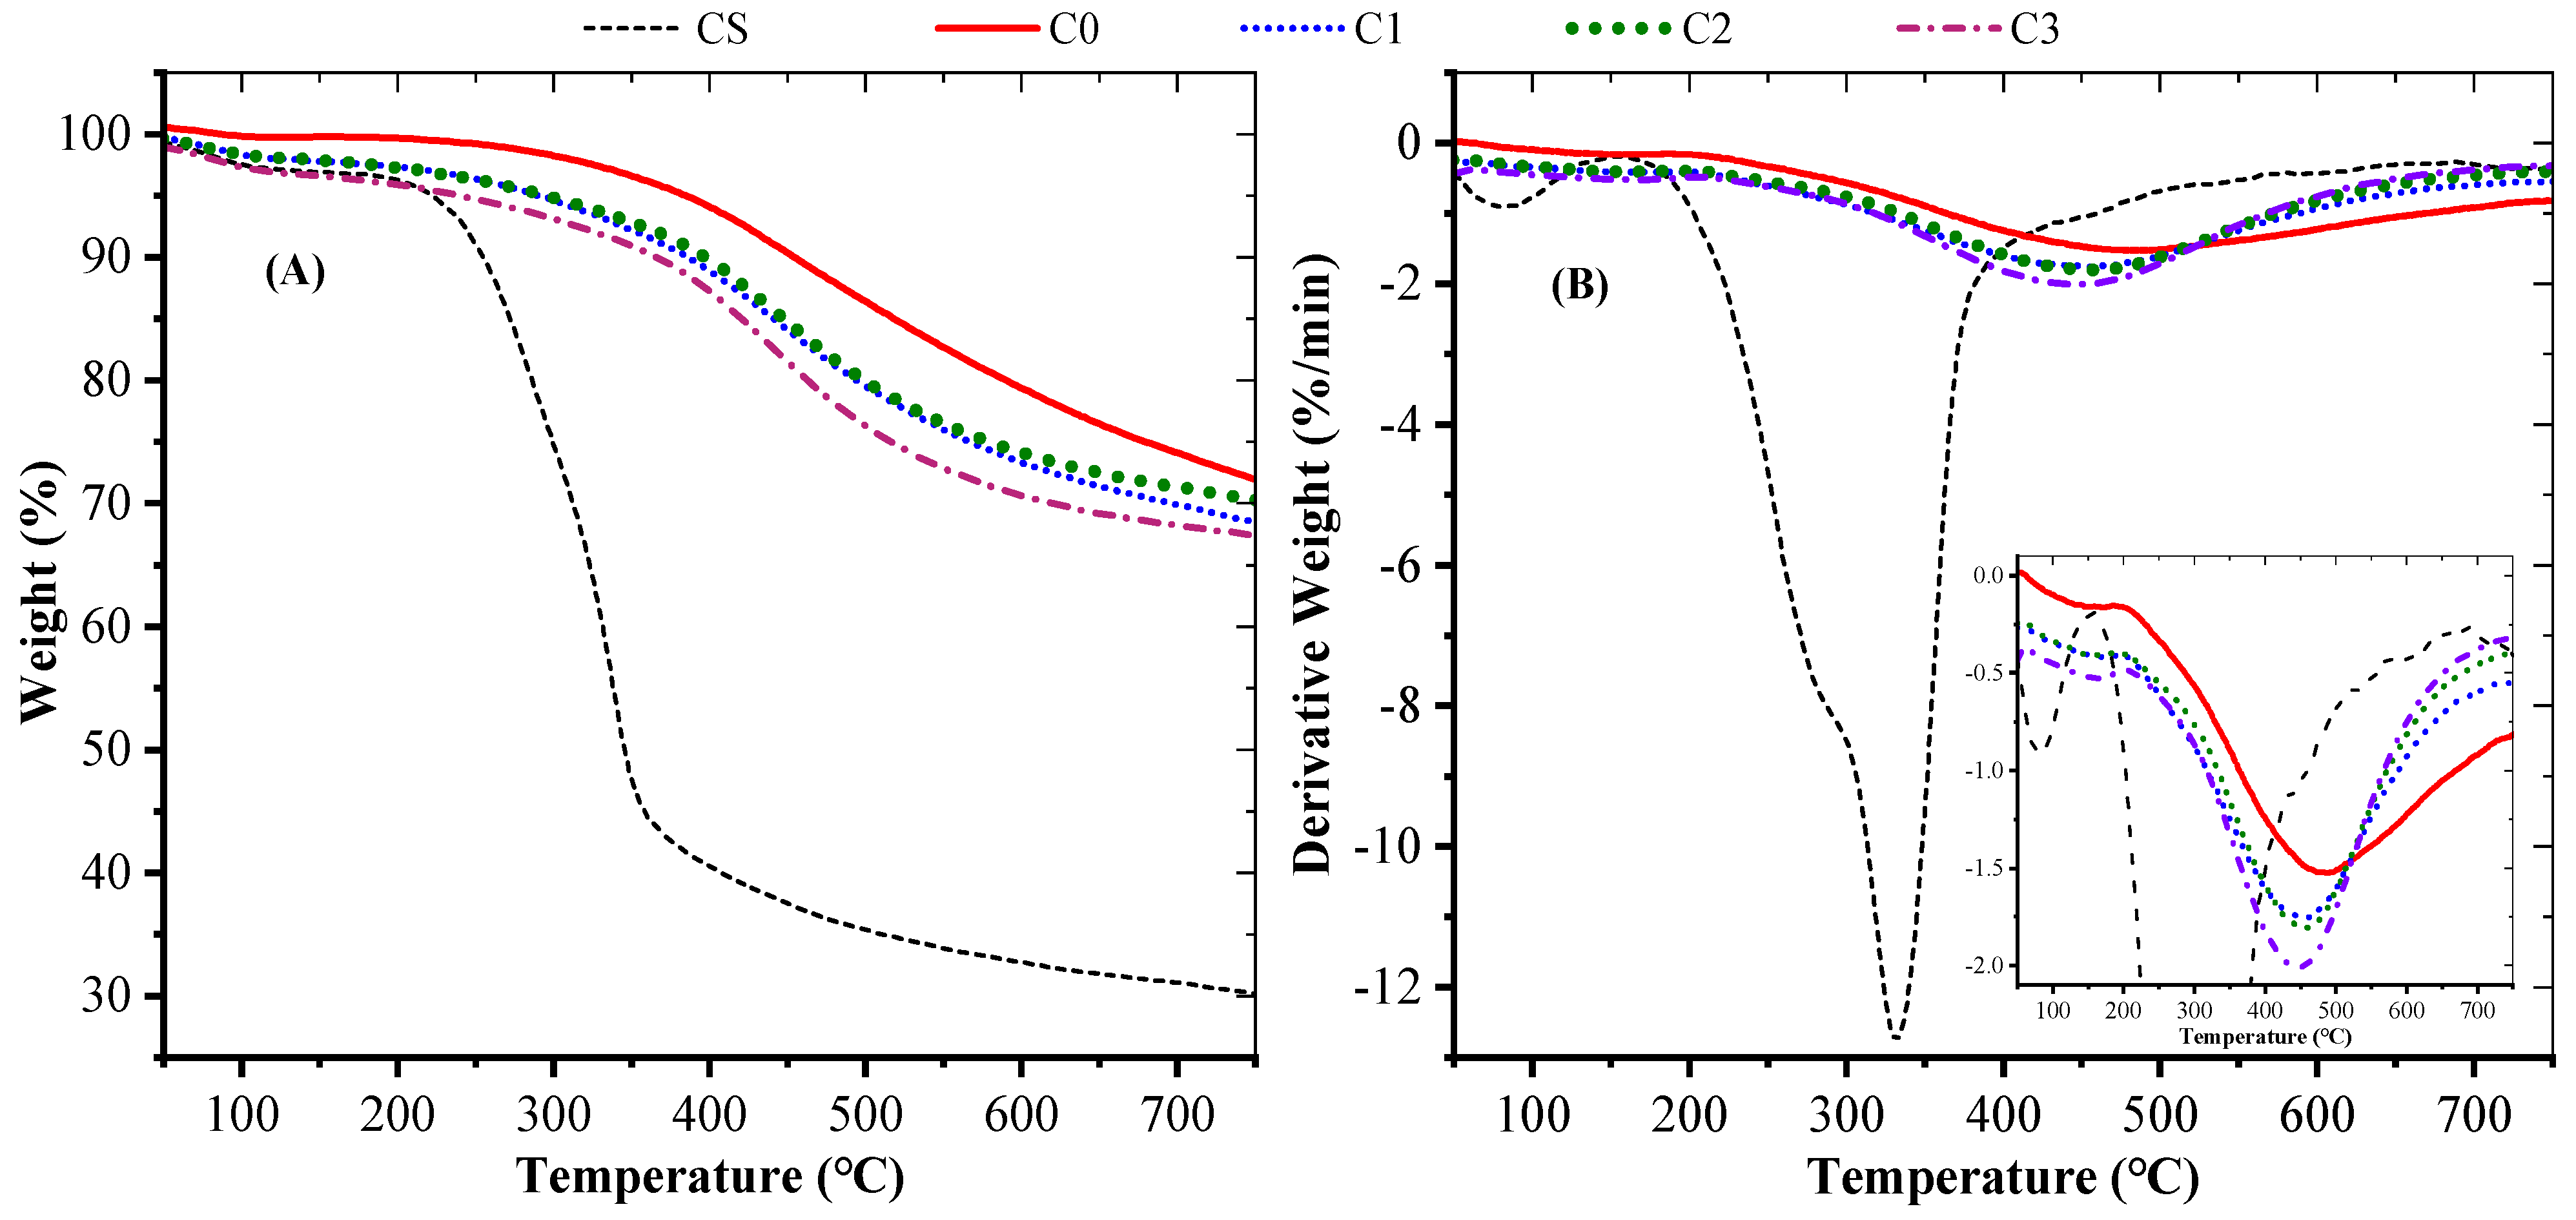
3.3.4. Thermal Stability of NDS

The thermal stability of NDS was correlated with its potential for continued hydrothermal degradation. Thermogravimetric analysis of the corn stalk, as well as the NDS, was carried out, with the results of thermal gravity (TG) and derivative thermal gravity (DTG) being shown in Figure 3. By comparing the thermal weight loss characteristics of the corn stalk with the remaining NDS after its HTL, it was found that when the temperature reached 800 °C, about 70% of the material in corn stalk was transformed, while only 20–30% of the material in NDS. The number of nondegradable substances increased significantly. By comparing the unrecycling C0 group with the cumulative recycling groups, it was found that the nondegradable material after recycling was less than that of unrecycling, decreasing from 70.52% in group C0 to 66.83% in group C3. The changes in C1 and C2 groups were not significant, and the changes in w N D S at this time were also not significant (Table 4), indicating that the carbonation degree of C1 and C2 groups was almost the same. From Figure 3B, it can be seen that two weight loss rate peaks were observed in corn stalk. The maximum weight loss rate was about 15.81%/min at around 338 °C. At this stage, it is mainly the pyrolysis of cellulose and hemicellulose. In general, the degradation temperatures of these two species are between 150–350 °C and 275–350 °C, respectively, and the peaks overlap with each other. However, there is only one peak of weight loss rate in NDS and moves toward a lower temperature as the recycling progresses. The maximum weight loss from C0 to C3 occurred at 486.1 °C, 455.8 °C, 451.4 °C, and 448.4 °C, and the maximum weight loss rate of the C3 group was about 2%/min, which was greatly reduced compared with the stalk. It shows that cellulose and hemicellulose are completely decomposed after aqueous phase recycling, with the occurrence of even some lignin decomposition [23]. Though there is slight decrease of the thermal stability of NDS, it can still be degraded at around 450~500 °C.

3.4. Effect of Aqueous Phase Recycling on Bio-Crude Oil Characteristics

The w B O gradually increased from 20.42% to 24.31% with the progress of aqueous phase recycling (Table 4). Comparing the characteristics of the aqueous phase products after cumulative recycling (Table 2) and the Bio-crude oil yield (Table 4), it can be observed that the two trends are highly similar, from which it can be assumed that the Bio-crude oil formation pathway is closely related to the aqueous phase products. In this paper, the comparative analysis of the aqueous phase products and Bio-crude oil fractions (Table 2 and Figure 4), the boiling point distribution and the ultimate analysis of Bio-crude oil further reveal the effect of accumulative aqueous phase recycling on the characteristics of Bio-crude oil.

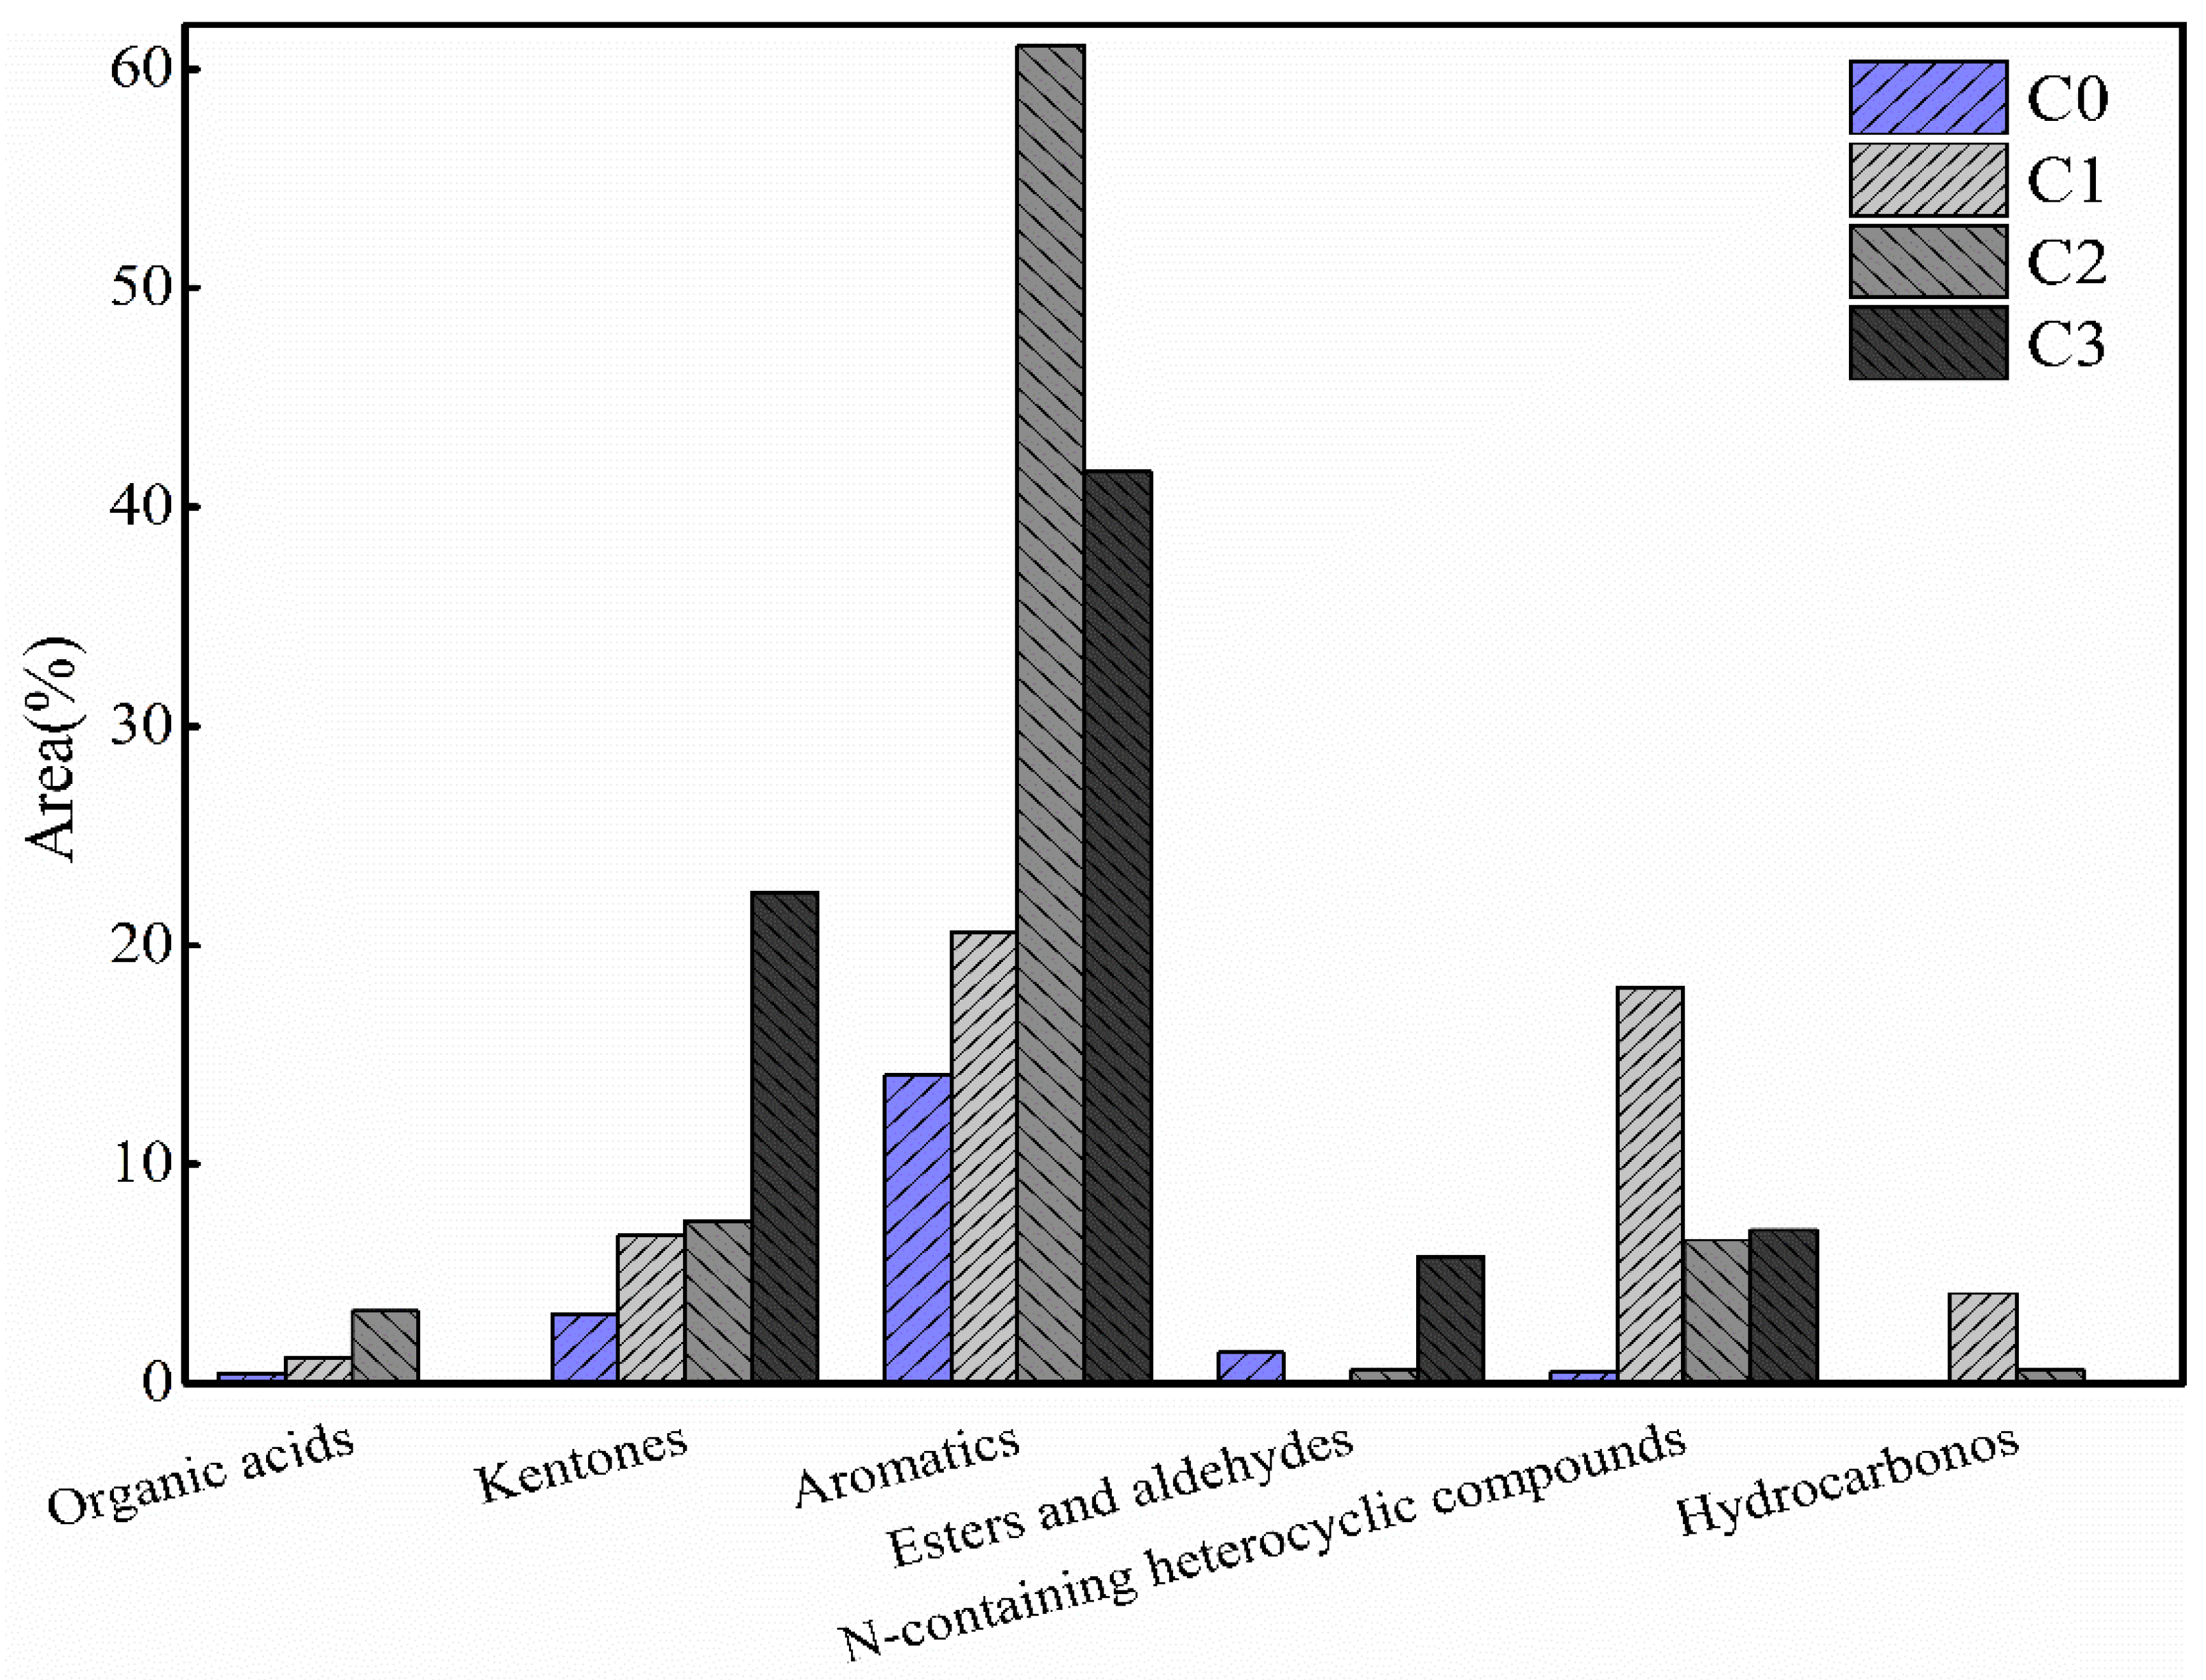
3.4.1. Compound Composition

The components of Bio-crude oil include organic acids, ketones, aromatics, esters, aldehydes, and N–containing heterocyclic compounds (Figure 4). The detailed name and composition are shown in Figure S1.
From Figure 4, ketones and aromatics compounds are the most abundant compounds in Bio-crude oil. As the aqueous recycling progressed, their content increased, in contrast to their trend in the aqueous products. From Figure S1, the Bio-crude oil contained nine aromatic compounds, mainly 4–ethyl–phenol, 4–ethyl–2–methoxy–phenol, 3,4–dimethoxy–phenol, and 2,6–dimethoxy–phenol. With the aqueous phase recycling, the content of 4–ethyl–phenol in the Bio-crude oil increased substantially from 5.217% to 22.102%, while its content in the aqueous phase decreased from 4.048% to 1.153%. More 2,6–dimethoxyphenol was detected in the Bio-crude oil after the 2nd recycling, but its content in the aqueous phase was decreasing. This indicates that aqueous recycling can facilitate the conversion of phenolic compounds from the aqueous phase to the Bio-crude oil. As the aqueous phase recycling progresses, more five membered–ring compounds (e.g., furfurals and furans) appear in the Bio-crude oil, which are important intermediates for phenolics. This indicates that the aqueous phase recycling favors the hydrolysis and dehydration reactions of corn stalk. Further recycling might lead to the polymerization of phenolics into high molecular weight solid products, which explained the higher w N D S after aqueous phase recycling [35]. The Bio-crude oil also contained eight ketone compounds, most of which were pentameric cyclic ketones. Among them, the content of 2–methyl–2–cyclopenten–1–one increased from 0.615% to 4.166%, while decreasing from 5.055% to 2.695% in the aqueous phase. The same pattern of change was observed for 3–methyl–2–cyclopenten–1–one. The pathway of ketone formation is related to cellulose hydrolysis, dehydration, and cyclization [31]. After aqueous phase recycling, some N–containing heterocyclic compounds such as pyrazine and pyrrole were observed in Bio-crude oil, which is related to the Maillard reaction. The increase of nitrogen–oxygen heterocyclic compounds in Bio-crude oil is an important factor in the increase of nitrogen content (Table 4). The content of organic acids in the Bio-crude was much smaller than the aqueous phase and no acetic acid or propionic acid were detected, indicating that sugars produced by the hydrolysis of corn stalk were mainly distributed in the aqueous phase. Most importantly, the decline of acid content improved the properties of Bio-crude oil with low oxygen content. The aqueous recycling enriches the organic acids in the aqueous phase, which is an effective catalyst for the hydrolysis and dehydration reactions, resulting in the formation of more intermediates. The intermediates decomposed and isomerized to produce more oil, confirming that the formation pathway of Bio-crude oil is closely related to the aqueous phase products.

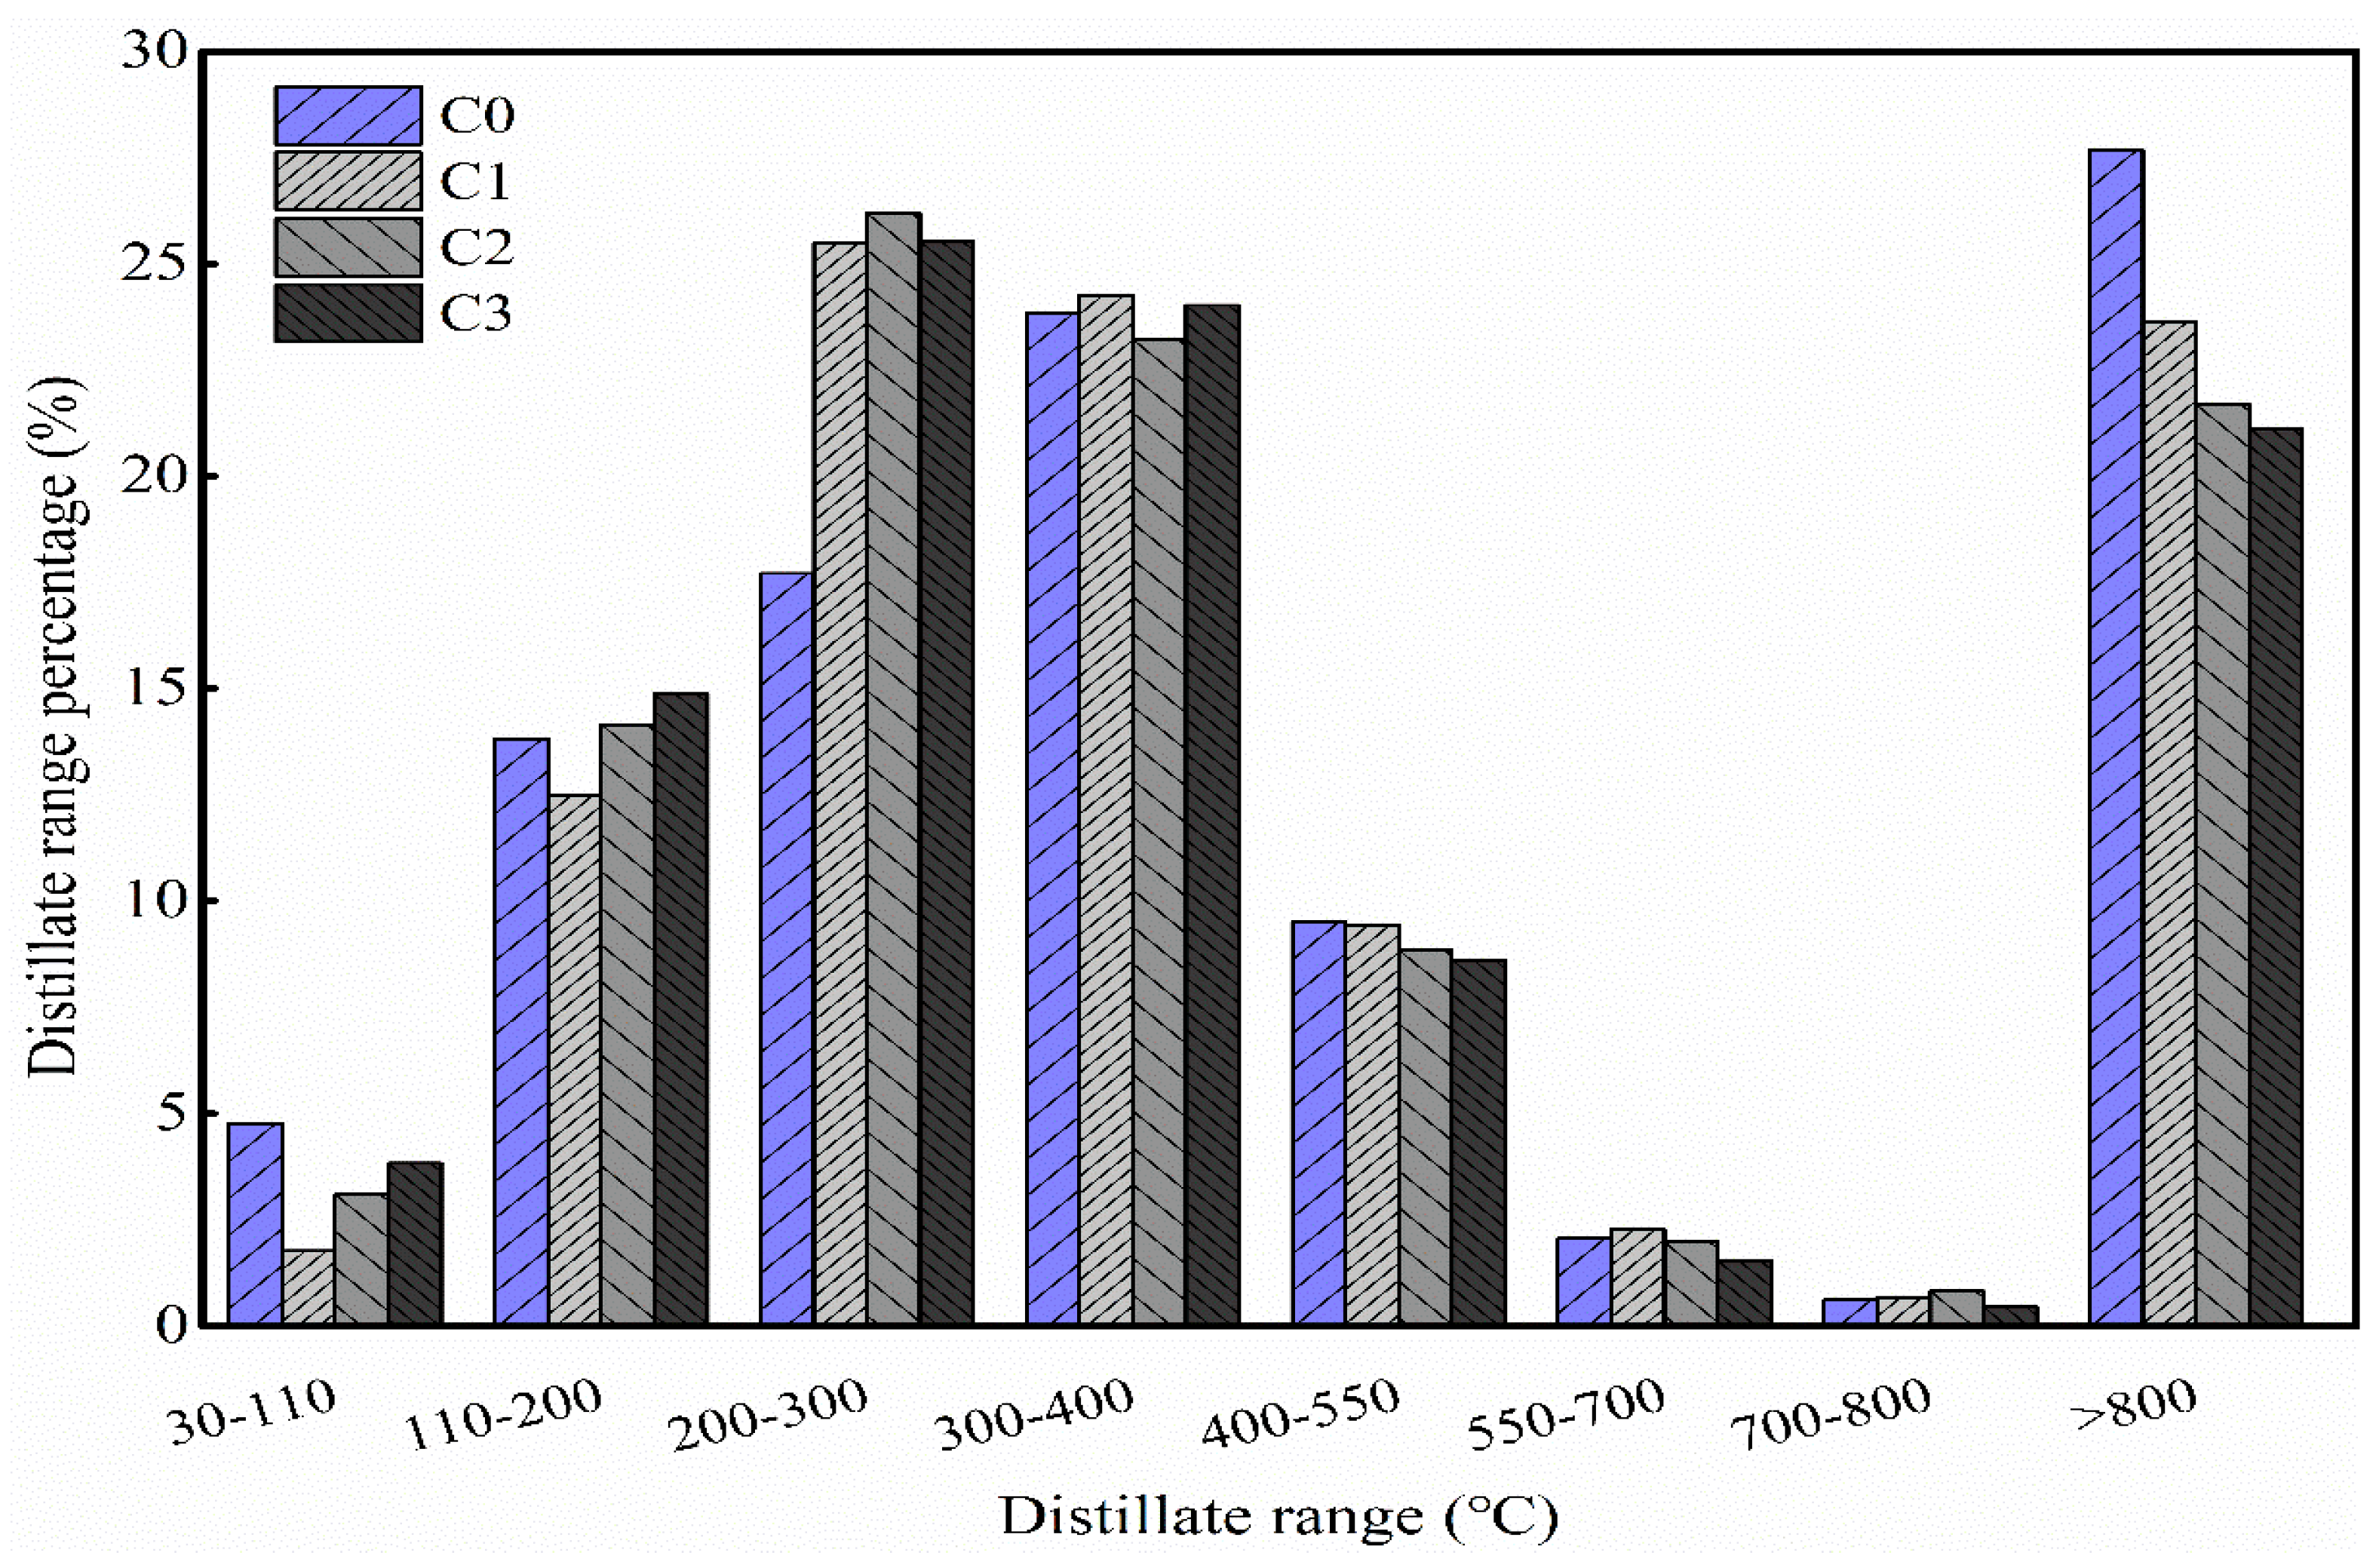
3.4.2. Boiling Point Distribution

The boiling point distribution of Bio-crude oil obtained by thermogravimetric analysis in this study is shown in Figure 5. Thermogravimetric analysis can be considered as a miniature “distillation” [36,37] that can determine the volatility characteristics of the Bio-crude fraction [38].
A weight loss of only about 4% for the Bio-crude oil before 110 °C indicates that the drying process effectively removes the DCM solvent. The boiling point distribution of Bio-crude oil in this study was mainly in the range of 110–550 °C, reaching about 64.87%, which can generally enter the refinery. The fractions at 200–400 °C accounted for nearly half of the total, and the fraction after recycling is slightly higher than unrecycling, indicating that the aqueous recycling could increase the content of low molecular weight compounds and weakly polar substances in the Bio-crude oil [37]. This is consistent with the results of GC–MS (Figure 4), which showed that the content of phenols and ketones in the Bio-crude oil increased with the aqueous phase recycling. It was also observed that the Bio-crude oil was neither evaporated nor completely decomposed when heated to 800 °C. The residual content after recycling was between 21.13% and 23.63%, lower than unrecycling (27.67%). In conclusion, the cumulative aqueous recycling decreases the heavy fraction of the Bio-crude oil while the lighter fraction and less polar organic matter increase gradually; the middle fraction biomass also increases significantly compared to unrecycling.

3.4.3. Ultimate Analysis

After the 3rd recycling of the aqueous phase, the carbon, hydrogen, and nitrogen content of the Bio-crude oil increased to 69.84%, 7.08%, and 1.49% (Table 7). The recovery rates of carbon, hydrogen, and nitrogen increased to 38.44%, 30.45%, and 39.37%, respectively. The recovery rates of hydrogen decreased slightly after the second recycling, which was consistent with the trend of its content. The oxygen content of Bio-crude oil decreased significantly from 13.34% to 9.90% after the 3rd recycling, which was much lower than corn stalk. The Bio-crude oil after HTL has higher oxygen content due to the depolymerization of biomass components (cellulose, hemicellulose, and lignin). It is present in Bio-crude oil in the form of organic acids, alcohols, ketones, aldehydes, sugars, furans, phenols, and other O–containing compounds. As the aqueous phase recycling proceeds, oxygen is removed in the form of CO2. Therefore, the aqueous phase recycling can effectively reduce the oxygen content of Bio-crude oil and improve the oil quality. The H/C ratio of Bio-crude oil varies between 0.87 and 0.91, which is lower than the average H/C ratio of petroleum (1.84). The main reason is that the hydrogen content of the Bio-crude oil (about 5%) does not increase efficiently with the aqueous phase recycling and hydrothermal degradation. The N/C ratio of Bio-crude oil was very low (0.10%). This is mainly due to the low nitrogen content of corn stalk (0.92%).

3.5. Comprehensive Analysis on Hydrothermal Degradation and Bio-Crude Oil Formation

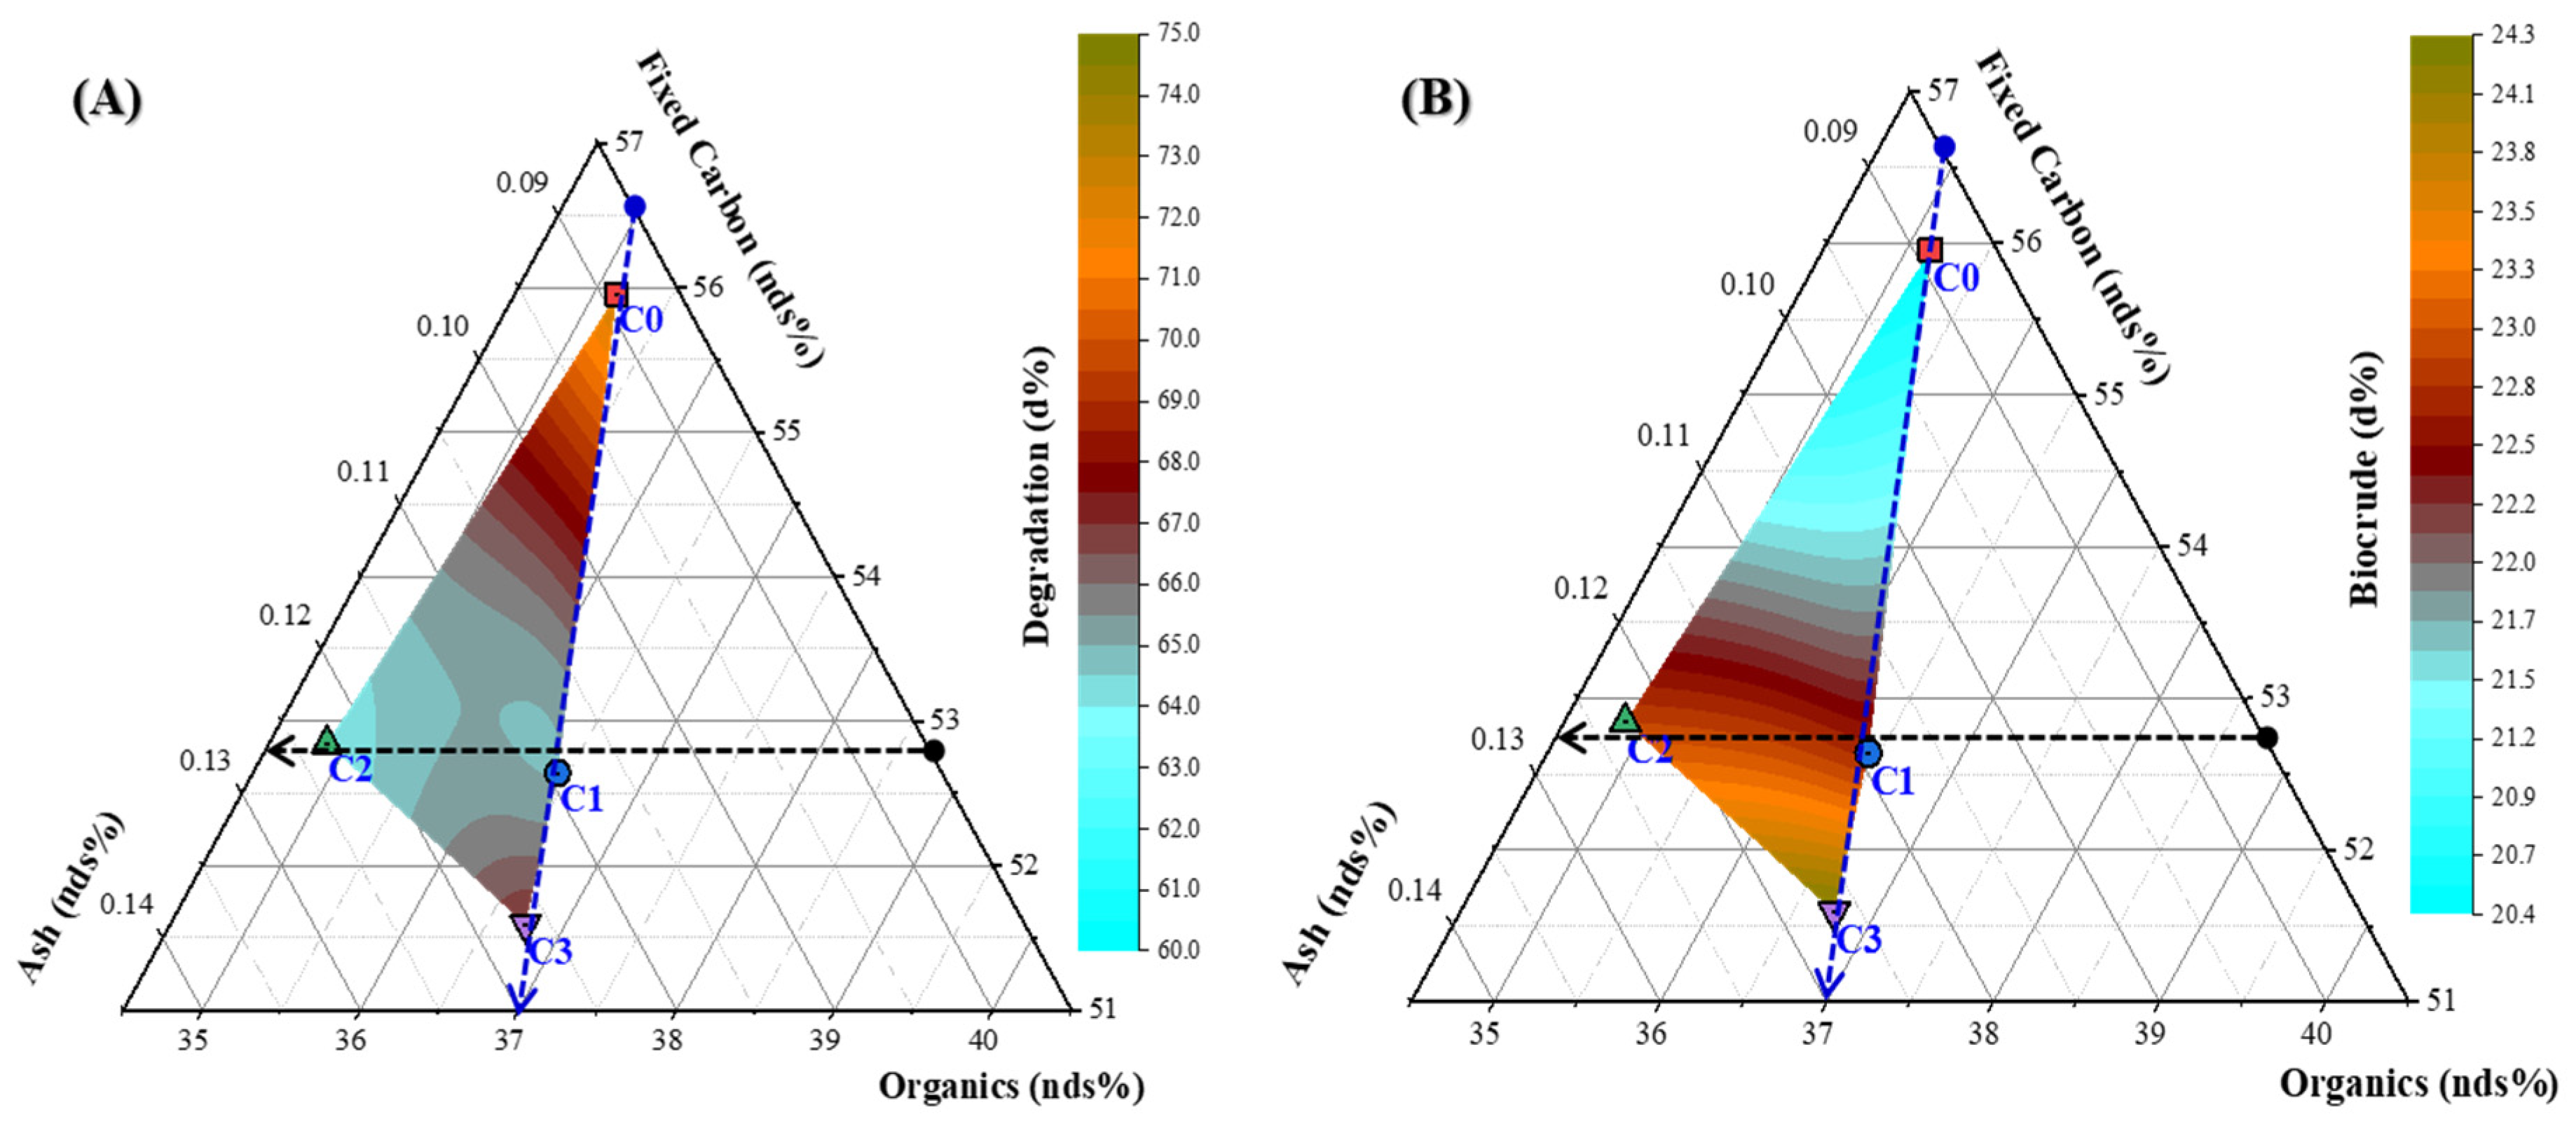
3.5.1. Effect of the Compositional Characteristics of NDS

Due to the complexity of the aqueous phase recycling process, it is relatively simple to understand the influence of aqueous phase recycling on hydrothermal degradation and oil formation process by directly studying the composition and deposition characteristics of NDS in this paper. The relationship between the major components of NDS (ash, volatile organics, and fixed carbon) and degradation and formation is shown in Figure 6.
The points C0, C1, and C3 were distributed on a line approximately passing through the vertices of the triangle, implying that the ash content and organics vary in equal proportions and the ratio is almost constant. At the same time, the fixed carbon content decreases significantly as one move in a straight line from C0 to C3. Besides, the points of the groups C1 and C2 were distributed in a straight line parallel to the axis of organics, indicating that the fixed carbon content hardly changed but the ash is being enriched and the organic residues are relatively reduced as one move in a straight line from C1 to C2. With the accumulative aqueous phase recycling, the changes in the compositional characteristics of the NDS showed that the overall fixed carbon ratio decreased, indicating that the accumulative aqueous phase recycling can mitigate the carbonization process. The carbonization of C1–C2 is almost the same with the occurrence of significant ash deposition and solidification.
From Figure 6A, as one moves almost in a straight line from C0 to C3, the ash and organic residues increased in equal proportion, the fixed carbon content decreased, w H T D increased but still below C0. As one moves from C1 to C2, the fixed carbon content was almost unchanged, while the ash enrichment was significant and accompanied by a decrease in organic matter. At this time, w H T D decreased slightly but not significantly. This indicates that the change in w H T D is most closely related to the change in fixed carbon content. In addition, the enrichment of ash hindered the heat and mass transfer of the organic components in the reaction process, which also negatively affects w H T D . The hydrothermal degradation process was weakened after the recycling compared to the unrecycling, but was rebounded after the third recycling.
From Figure 6B, as one moves almost in a straight line from C0 to C3, the w B O increases significantly. As one moves from C1 to C2, the w B O increases slightly. It is speculated that certain metal salts such as K and Ca in the ash plays the role of catalysis to promote oil production [39]. The aqueous phase recycling not only promotes the oil production, but also promotes the carbonization process. Reducing carbonization process is beneficial to oil formation.

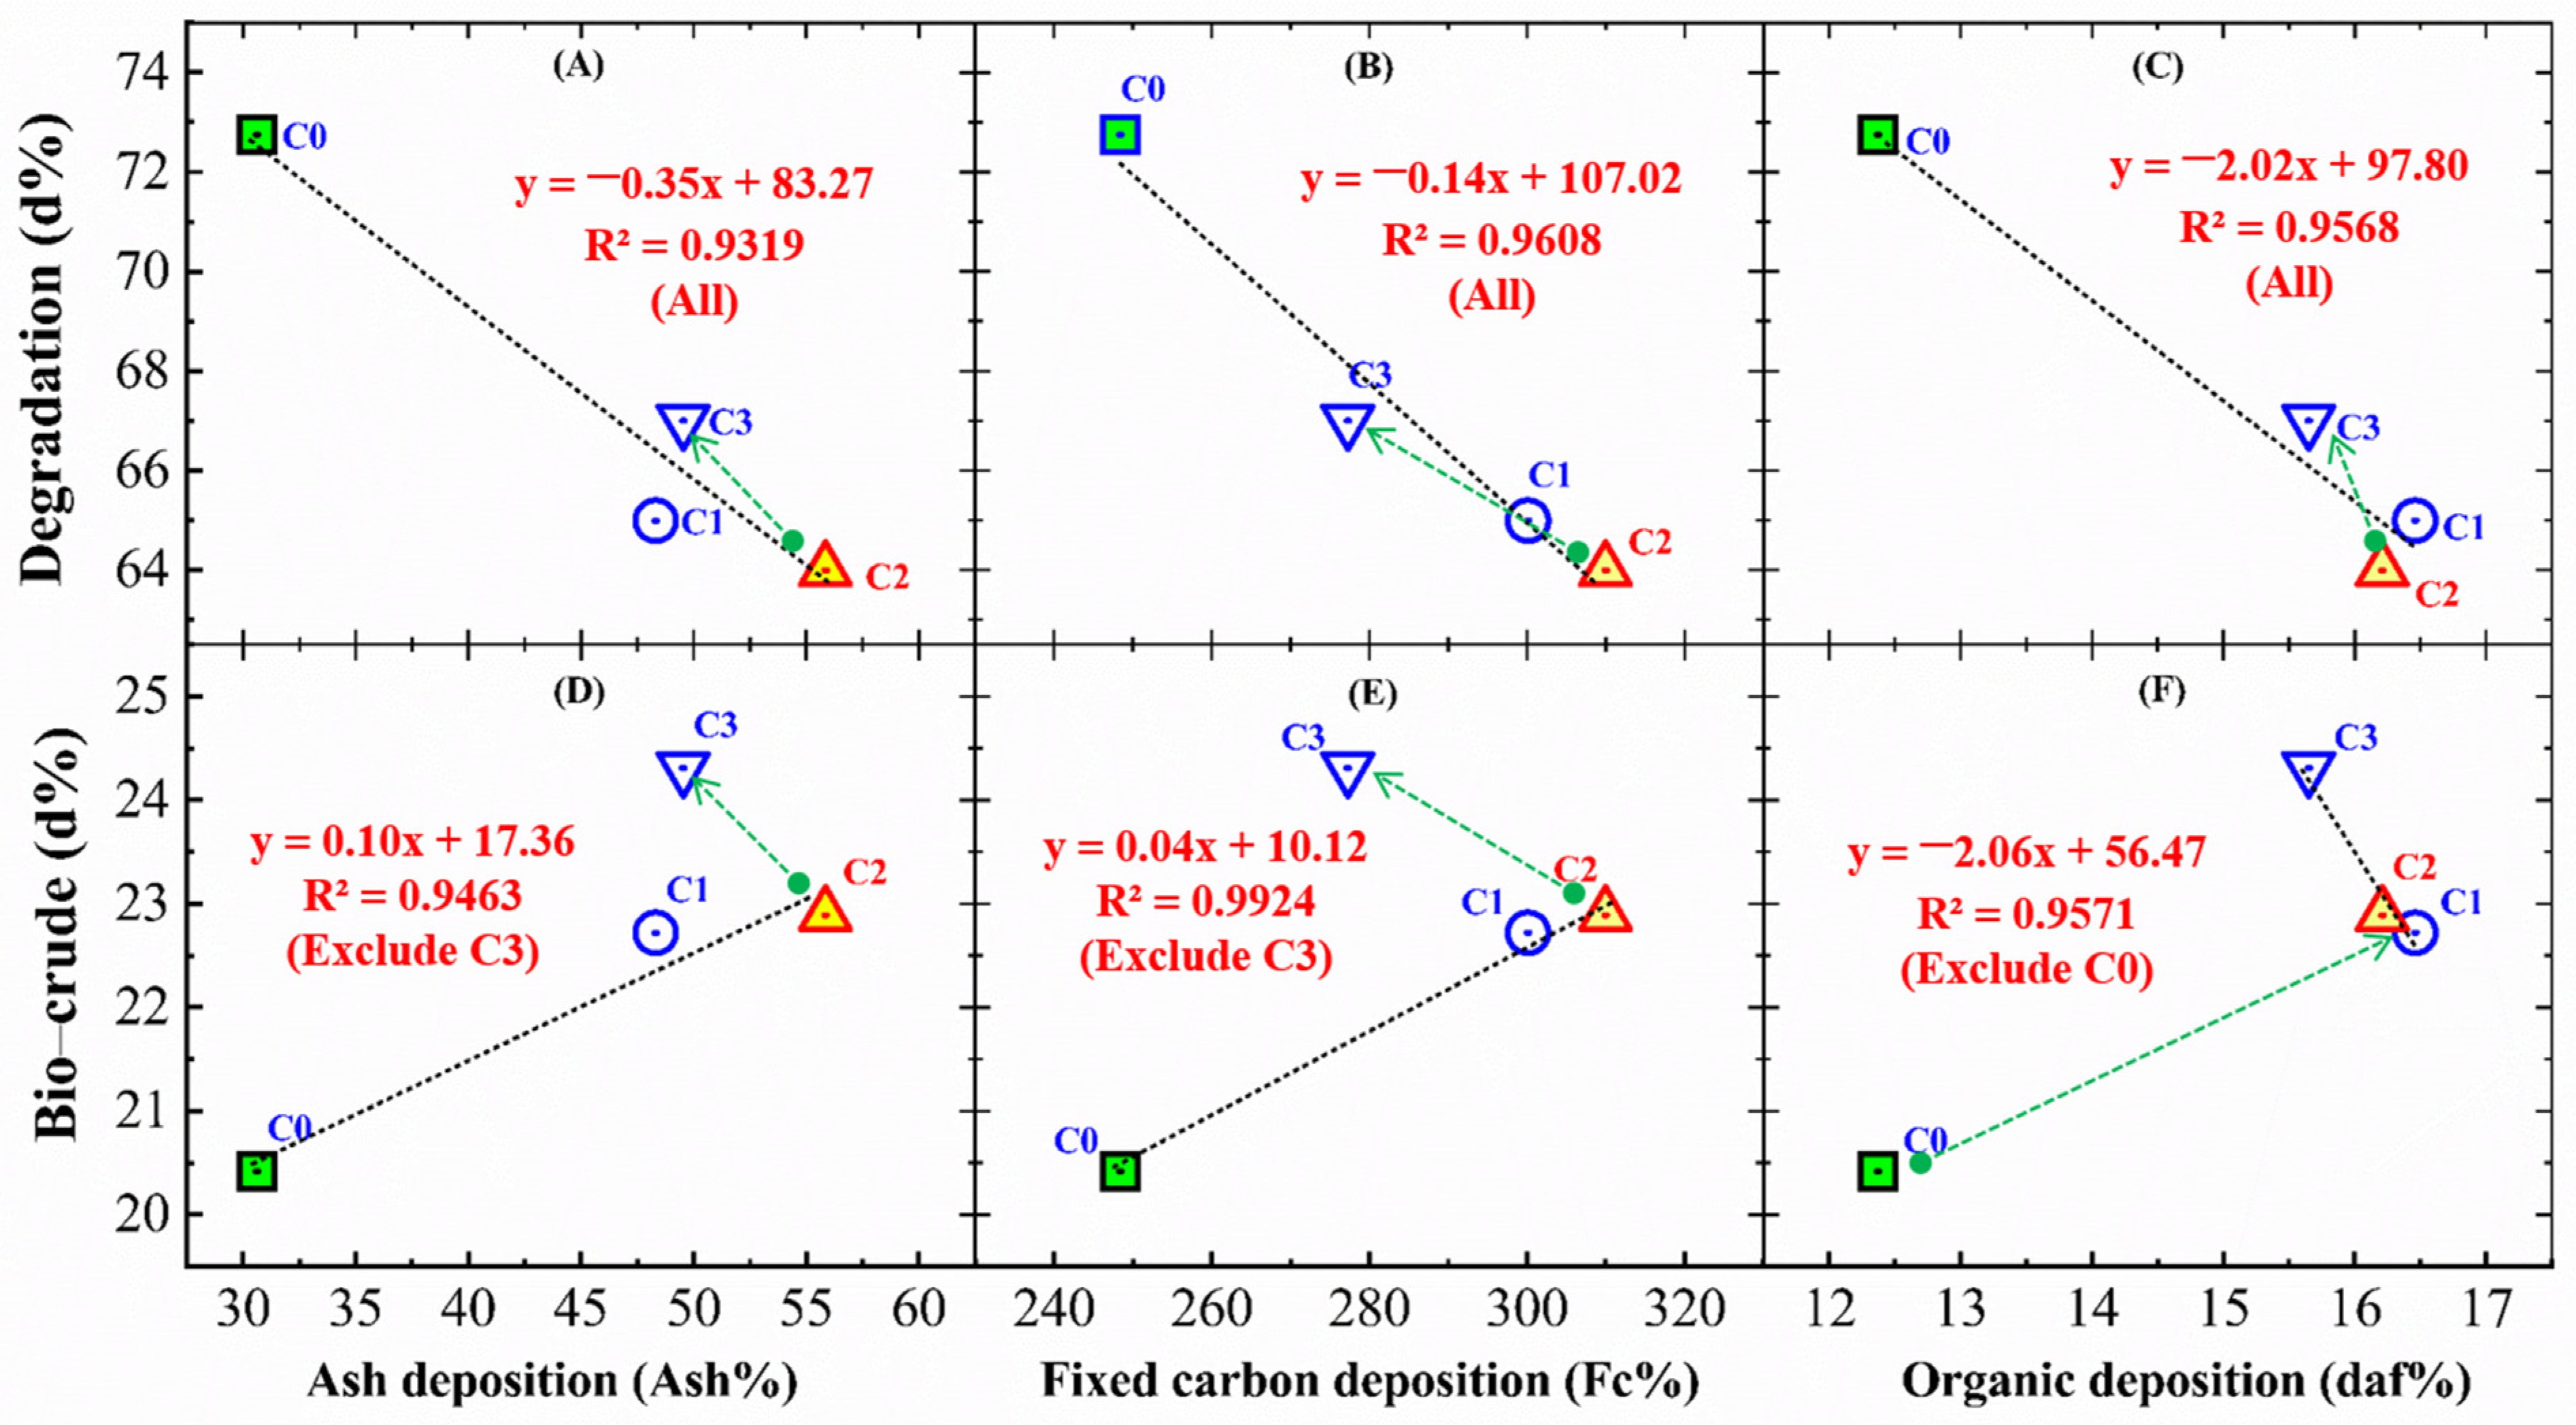
3.5.2. Effect of the Deposition Characteristics of NDS

There is a correlation between deposition characteristics ( w F C , w V and w A s h ) and hydrothermal degradation and oil formation before and after aqueous recycling (Figure 7). There is a negative correlation of the three deposition parameters with w H T D , while positively correlated with the oil formation process. In the first two rounds of the aqueous phase cumulative recycling, the correlation coefficients between the deposition characteristics of ash and fixed carbon, which have no potential for further oil formation, and the overall hydrothermal degradation efficiency and oil formation reach above 0.9 or more. The trends are reversed after third recycling, the deposition effect is reduced, while the hydrothermal degradation efficiency and oil formation are increased. In the case of organics, which have potential for further hydrothermal degradation and oil formation, the aqueous phase accumulation recycling results in the slow deposition of this material. The main reason is the lack of hydrolytic drive due to the increased substrate concentration in the aqueous phase. Even so, the TOC concentration and acidity in the aqueous phase are sufficiently high to further enhance the Bio-crude oil formation (Table 2).

3.5.3. Summary

This study confirms the feasibility of hydrothermal degradation of corn stalk to produce Bio-crude oil through aqueous phase cumulative recycling. It was found that the accumulation recycling in the aqueous phase produced an enrichment of organic acids and alcohols and conversion of ketones and phenols in the aqueous phase, and accompanied by an unavoidable solid deposition effect. Although the solid deposition hurts the hydrothermal degradation efficiency, the formation of larger carbon microspheres during the deposition process enhances the utilization of NDS, while the Bio-crude oil formation process is positively impacted by the porous structure of carbon skeleton and the formation of nano–sized metal salt particles. After the third round of aqueous phase accumulation recycling, a positive impact on both hydrothermal degradation and Bio-crude oil production was observed. With the aqueous phase recycling, the Bio-crude oil yield kept increasing from 20.42% to 24.31%, and the oxygen content decreased significantly from 13.34% to 9.90%. The aqueous recycling could increase the content of low molecular weight compounds and weakly polar substances in the Bio-crude oil. It was also found that the carbonation process could be weakened after the 3rd round of aqueous phase accumulation recycling, which had a positive impact on both hydrothermal degradation and oil production. After the 3rd recycling, the hydrothermal degradation efficiency rebounded from 63.99% to 67.00%.
The improvement of oil formation after the cumulative recycling is mainly due to the following factors: (1) the aqueous phase accumulation recycling produces the enrichment effect of organic acids, which can catalyze the promotion of Bio-crude oil production [39]; (2) the aqueous phase accumulation recycling promotes the decomposition of corn stalk, which produces a substrate for Bio-crude oil; (3) the aqueous recycling produces an ash deposition effect, which increases the metal salts such as K and Ca in the ash, which plays the role of catalysis and promotes oil formation [40].

4. Conclusions

Based on the characteristics of NDS, this manuscript systematically analyzes the hydrothermal degradation and oil production process. The next step could be to combine the reaction kinetics of the four products for further study. Moreover, more rounds of cumulative recycling could be studied in–depth.
This study can provide a theoretical basis for large–scale industrial conversion and utilization of dry biomass in the future. The use of certain industrial process wastewater, such as biogas plant liquid and wood vinegar liquid from the pyrolysis industry, can be further investigated as a medium source of water and its recyclability. This study can also be extended to apply to lignocellulosic biomass such as hemp fiber. In future work, the addition of CuO + NaOH as a catalyst in the HTL process could be considered to improve the yield of biocrude oil.

Supplementary Materials

The following are available online at https://www.mdpi.com/1996-1073/14/2/285/s1, Figure S1. Composition of Bio-crude oil and relative peak area of major components before and after aqueous phase recycling.

Author Contributions

Conceptualization: C.T., W.Y.; analysis and investigation: S.Y., N.Z.; writing and preparation of manuscript: S.Y., C.T., W.Y.; funding acquisition: C.T., W.Y., Q.Y., P.F., Y.Z., Z.L. All authors have read and agreed to the published version of the manuscript.

Funding

This research was supported by National Natural Science Foundation of China (51706126, 51536009, and 31872400), Shandong Provincial Natural Science Foundation of China (ZR2017BEE049), Shandong University of Technology and Zibo City Integration Development Project (2019ZBXC380), and the Youth Innovation Support Program of Shandong Colleges and Universities (2019KJD013).

Institutional Review Board Statement

Not applicable.

Informed Consent Statement

Not applicable.

Data Availability Statement

No new data were created or analyzed in this study. Data saharing is not applicable to this article.

Acknowledgments

We gratefully thank to the Analysis & Testing Center in Shandong University of Technology for SEM and FT–IR analyses.

Conflicts of Interest

The authors declare no conflict of interest.

Abbreviations

HTLHydrothermal liquefaction
FPLFast pyrolysis liquefaction
HTDHydrothermal degradation
DCMDichloromethane
BOBio-crude oil
NDSNondegradable solids
APAqueous phase
dafDry ash free basis
dDry basis
GC–MSGas chromatography–mass spectrometry
ICP–OESInductively coupled plasma optic emission spectrometer
FT–IRFourier transform infrared spectroscopy
TGAThermogravimetric analysis
SEMScanning electron microscope
TOCTotal organic carbon
ECElectrical conductance
TDSTotal dissolved solids
SALSalinity
VVolatile/Hard–to–degrade organics
FCFixed carbon

References

  1. Cao, L.; Zhang, C.; Chen, H.; Tsang, D.C.; Luo, G.; Zhang, S.; Chen, J. Hydrothermal liquefaction of agricultural and forestry wastes: State-of-the-art review and future prospects. Bioresour. Technol. 2017, 245, 1184–1193. [Google Scholar] [CrossRef]
  2. Chen, H.; Hao, S.; Chen, Z.; Sompong, O.; Fan, J.; Clark, J.; Luo, G.; Zhang, S. Mesophilic and thermophilic anaerobic digestion of aqueous phase generated from hydrothermal liquefaction of cornstalk: Molecular and metabolic insights. Water Res. 2020, 168, 115199. [Google Scholar] [CrossRef] [PubMed]
  3. Gao, Y.; Liu, S.; Du, J.; Wang, Z.; Wang, H.; Zhao, T. Conversion and extracting bio-oils from rod-shaped cornstalk by sub-critical water. J. Anal. Appl. Pyrolysis 2015, 115, 316–325. [Google Scholar] [CrossRef]
  4. Panisko, E.; Wietsma, T.; Lemmon, T.; Albrecht, K.; Howe, D. Characterization of the aqueous fractions from hydrotreatment and hydrothermal liquefaction of lignocellulosic feedstocks. Biomass Bioenergy 2015, 74, 162–171. [Google Scholar] [CrossRef] [Green Version]
  5. Chen, H.; He, Z.; Zhang, B.; Feng, H.; Kandasamy, S.; Wang, B. Effects of the aqueous phase recycling on bio-oil yield in hydrothermal liquefaction of Spirulina Platensis, α-cellulose, and lignin. Energy 2019, 179, 1103–1113. [Google Scholar] [CrossRef]
  6. Biller, P.; Madsen, R.B.; Klemmer, M.; Becker, J.; Iversen, B.B.; Glasius, M. Effect of hydrothermal liquefaction aqueous phase recycling on bio-crude yields and composition. Bioresour. Technol. 2016, 220, 190–199. [Google Scholar] [CrossRef] [PubMed]
  7. Akhtar, J.; Amin, N.A.S. A review on process conditions for optimum bio-oil yield in hydrothermal liquefaction of biomass. Renew. Sustain. Energy Rev. 2011, 15, 1615–1624. [Google Scholar] [CrossRef]
  8. Hognon, C.; Delrue, F.; Texier, J.; Grateau, M.; Thiery, S.; Miller, H.; Roubaud, A. Comparison of pyrolysis and hydrothermal liquefaction of Chlamydomonas reinhardtii. Growth studies on the recovered hydrothermal aqueous phase. Biomass Bioenergy 2015, 73, 23–31. [Google Scholar] [CrossRef]
  9. Matayeva, A.; Basile, F.; Cavani, F.; Bianchi, D.; Chiaberge, S. Development of Upgraded Bio-Oil Via Liquefaction and Pyrolysis. Stud. Surf. Sci. Catal. 2019, 178, 231–256. [Google Scholar] [CrossRef]
  10. Elliott, D.C.; Biller, P.; Ross, A.B.; Schmidt, A.J.; Jones, S.B. Hydrothermal liquefaction of biomass: Developments from batch to continuous process. Bioresour. Technol. 2015, 178, 147–156. [Google Scholar] [CrossRef] [Green Version]
  11. Hu, Y.; Feng, S.; Yuan, Z.; Xu, C.C.; Bassi, A. Investigation of aqueous phase recycling for improving Bio-crude oil yield in hydrothermal liquefaction of algae. Bioresour. Technol. 2017, 239, 151–159. [Google Scholar] [CrossRef] [PubMed]
  12. Adhikari, S.; Nam, H.; Chakraborty, J.P. Conversion of Solid Wastes to Fuels and Chemicals through Pyrolysis. Waste Biorefin. 2018, 239–263. [Google Scholar] [CrossRef]
  13. Zhu, Z.; Rosendahl, L.A.; Toor, S.S.; Yu, D.; Chen, G. Hydrothermal liquefaction of barley straw to bio-crude oil: Effects of reaction temperature and aqueous phase recirculation. Appl. Energy 2015, 137, 183–192. [Google Scholar] [CrossRef]
  14. Stemann, J.; Putschew, A.; Ziegler, F. Hydrothermal carbonization: Process water characterization and effects of water recirculation. Bioresour. Technol. 2013, 143, 139–146. [Google Scholar] [CrossRef] [PubMed]
  15. Pedersen, T.; Grigoras, I.; Hoffmann, J.; Toor, S.; Daraban, I.; Jensen, C.; Iversen, S.; Madsen, R.; Glasius, M.; Arturi, K.; et al. Continuous hydrothermal co-liquefaction of aspen wood and glycerol with water phase recirculation. Appl. Energy 2016, 162, 1034–1041. [Google Scholar] [CrossRef] [Green Version]
  16. Ramirez, J.A.; Brown, R.J.; Rainey, T.J. A Review of Hydrothermal Liquefaction Bio-crude Properties and Prospects for Upgrading to Transportation Fuels. Energies 2015, 8, 6765–6794. [Google Scholar] [CrossRef] [Green Version]
  17. Valdez, P.J.; Savage, P.E. A reaction network for the hydrothermal liquefaction of Nannochloropsis sp. Algal Res. 2013, 2, 416–425. [Google Scholar] [CrossRef]
  18. Valdez, P.J.; Tocco, V.J.; Savage, P. A general kinetic model for the hydrothermal liquefaction of microalgae. Bioresour. Technol. 2014, 163, 123–127. [Google Scholar] [CrossRef]
  19. Zhuang, X.; Zhan, H.; Song, Y.; Huang, Y.; Yin, X.; Wu, C. Reutilization potential of antibiotic wastes via hydrothermal liquefaction (HTL): Bio–oil and aqueous phase characteristics. J. Energy Inst. 2019, 92, 1537–1547. [Google Scholar] [CrossRef]
  20. Watson, J.; Wang, T.; Si, B.-C.; Chen, W.-T.; Aierzhati, A.; Zhang, Y. Valorization of hydrothermal liquefaction aqueous phase: Pathways towards commercial viability. Prog. Energy Combust. Sci. 2020, 77, 100819. [Google Scholar] [CrossRef]
  21. Usman, M.; Chen, H.; Chen, K.; Ren, S.; Clark, J.H.; Fan, J.; Luo, G.; Zhang, S. Characterization and utilization of aqueous products from hydrothermal conversion of biomass for bio-oil and hydro–char production: A review. Green Chem. 2019, 21, 1553–1572. [Google Scholar] [CrossRef]
  22. Yin, S.; Tan, Z. Hydrothermal liquefaction of cellulose to bio–oil under acidic, neutral and alkaline conditions. Appl. Energy 2012, 92, 234–239. [Google Scholar] [CrossRef]
  23. Zhu, Z.; Toor, S.S.; Rosendahl, L.; Yu, D.; Chen, G. Influence of alkali catalyst on product yield and properties via hydrothermal liquefaction of barley straw. Energy 2015, 80, 284–292. [Google Scholar] [CrossRef]
  24. Déniel, M.; Haarlemmer, G.; Roubaud, A.; Weiss–Hortala, E.; Fages, J. Energy valorisation of food processing residues and model compounds by hydrothermal liquefaction. Renew. Sustain. Energy Rev. 2016, 54, 1632–1652. [Google Scholar] [CrossRef] [Green Version]
  25. Zhu, Z.; Si, B.-C.; Lu, J.; Watson, J.; Zhang, Y.; Liu, Z. Elemental migration and characterization of products during hydrothermal liquefaction of cornstalk. Bioresour. Technol. 2017, 243, 9–16. [Google Scholar] [CrossRef]
  26. Kalderis, D.; Kotti, M.S.; Méndez, A.; Gascó, G. Characterization of hydrochars produced by hydrothermal carbonization of rice husk. Solid Earth 2014, 5, 477–483. [Google Scholar] [CrossRef] [Green Version]
  27. Sevilla, M.; Fuertes, A.B. The production of carbon materials by hydrothermal carbonization of cellulose. Carbon 2009, 47, 2281–2289. [Google Scholar] [CrossRef] [Green Version]
  28. Luan, C.; You, C.; Zhang, D. An experimental investigation into the characteristics and deposition mechanism of high–viscosity coal ash. Fuel 2014, 119, 14–20. [Google Scholar] [CrossRef]
  29. Reza, M.T.; Lynam, J.G.; Uddin, M.H.; Coronella, C.J. Hydrothermal carbonization: Fate of inorganics. Biomass Bioenergy 2013, 49, 86–94. [Google Scholar] [CrossRef]
  30. Vassilev, S.V.; Vassileva, C.G.; Song, Y.-C.; Li, W.-Y.; Feng, J. Ash contents and ash–forming elements of biomass and their significance for solid biofuel combustion. Fuel 2017, 208, 377–409. [Google Scholar] [CrossRef]
  31. Zhou, D.; Zhang, L.; Zhang, S.; Fu, H.; Chen, J. Hydrothermal Liquefaction of Macroalgae Enteromorpha prolifera to Bio-oil. Energy Fuels 2010, 24, 4054–4061. [Google Scholar] [CrossRef]
  32. Liu, H.; Chen, Y.; Yang, H.; Gentili, F.G.; Söderlind, U.; Wang, X.; Zhang, W.; Chen, H. Conversion of high-ash microalgae through hydrothermal liquefaction. Sustain. Energy Fuels 2020, 4, 2782–2791. [Google Scholar] [CrossRef]
  33. Li, C.; Yang, X.; Zhang, Z.; Zhou, D.; Zhang, L.; Zhang, S.; Chen, J. Hydrothermal Liquefaction of Desert Shrub Salix psammophila to High Value-added Chemicals and Hydrochar with Recycled Processing Water. BioResources 2013, 8, 2981–2997. [Google Scholar] [CrossRef]
  34. Hu, J.; Shen, D.; Wu, S.; Zhang, H.; Xiao, R. Effect of temperature on structure evolution in char from hydrothermal degradation of lignin. J. Anal. Appl. Pyrolysis 2014, 106, 118–124. [Google Scholar] [CrossRef]
  35. Tian, Y.; Wang, F.; Djandja, J.O.; Zhang, S.-L.; Xu, Y.-P.; Duan, P.-G. Hydrothermal liquefaction of crop straws: Effect of feedstock composition. Fuel 2020, 265, 116946. [Google Scholar] [CrossRef]
  36. Zhang, J.; Chen, W.-T.; Zhang, P.; Luo, Z.; Zhang, Y. Hydrothermal liquefaction of Chlorella pyrenoidosa in sub- and supercritical ethanol with heterogeneous catalysts. Bioresour. Technol. 2013, 133, 389–397. [Google Scholar] [CrossRef]
  37. Chen, W.-T.; Zhang, Y.; Zhang, J.; Schideman, L.; Yu, G.; Zhang, P.; Minarick, M. Co-liquefaction of swine manure and mixed-culture algal biomass from a wastewater treatment system to produce Bio-crude oil. Appl. Energy 2014, 128, 209–216. [Google Scholar] [CrossRef]
  38. Ross, A.B.; Biller, P.; Kubacki, M.; Li, H.; Lea-Langton, A.; Jones, J. Hydrothermal processing of microalgae using alkali and organic acids. Fuel 2010, 89, 2234–2243. [Google Scholar] [CrossRef]
  39. Ross, A.B.; Jones, J.M.; Kubacki, M.L.; Bridgeman, T. Classification of macroalgae as fuel and its thermochemical behaviour. Bioresour. Technol. 2008, 99, 6494–6504. [Google Scholar] [CrossRef]
  40. Tian, C.; Li, B.; Liu, Z.; Zhang, Y.; Lu, H. Hydrothermal liquefaction for algal biorefinery: A critical review. Renew. Sustain. Energy Rev. 2014, 38, 933–950. [Google Scholar] [CrossRef]
Figure 1. Hydrothermal liquefaction (HTL) products separation and collection procedure.
Energies 14 00285 g001
Figure 2. Microscopic morphological characteristics of NDS.
Energies 14 00285 g002
Figure 3. Thermal gravity analysis (A) and differential thermal gravity analysis (B) of NDS.
Energies 14 00285 g003
Figure 4. Compound composition of Bio-crude oil.
Energies 14 00285 g004
Figure 5. Boiling point distribution of Bio-crude oil.
Energies 14 00285 g005
Figure 6. Effect of the compositional characteristics of NDS on hydrothermal degradation (A) and oil formation (B).
Energies 14 00285 g006
Figure 7. Effect of the deposition characteristics of NDS on hydrothermal degradation (AC) and oil formation (DF).
Energies 14 00285 g007
Table 1. Characteristics of corn stalk.
ComponentsContent
Proximate analysis (d%)
Fixed carbon6.14 ± 0.20
Volatile matter77.48 ± 0.30
Ash content7.92 ± 0.22
Ultimate analysis (d%)
Carbon44.17 ± 0.09
Hydrogen5.65 ± 0.07
Nitrogen0.92 ± 0.06
Sulfur0.19 ± 0.05
Oxygen *49.07 ± 0.14
Chemical composition (daf%)
Hemicellulose31.31 ± 0.69
Cellulose40.13 ± 0.40
Lignin4.74 ± 0.87
* Calculated by difference; the number after ± denotes Standard Deviation.
Table 2. The effect of aqueous phase accumulation recycling on its properties.
Water Quality AnalysisC0C1C2C3
pH3.77 ± 0.103.62 ± 0.203.85 ± 0.043.91 ± 0.03
EC (μs/cm)913.15 ± 19.551973.75 ± 149.082250.50 ± 89.802739.50 ±21.92
TDS (ppm)473.55 ± 29.92986.78 ± 173.821125.50 ± 44.551402.00 ± 56.57
Salinity (psu)0.46 ± 0.031.00 ± 0.191.16 ± 0.051.46 ± 0.06
TOC (g/L)26.90 ± 0.6443.88 ± 0.5352.07 ± 0.4660.30 ± 0.54
Componentsidentification of aqueous phase
Acids40.8955.0255.9659.93
Ketones14.4310.249.908.27
Phenols26.2119.7715.589.38
Esters, alcohols, and aldehydesND2.793.534.32
N–containing compoundsND3.283.294.17
Heterocyclic compoundsNDND0.571.55
ND: Cannot be detected.
Table 3. One–way ANOVA on the effect of aqueous phase recycling on hydrothermal degradation and oil formation processes.
Dependent Variables Sum of SquaresdifMean SquareFSig.
w B O Between Groups15.50535.1687.2010.043 *
Within Groups2.87140.718
Total18.3767
w H T D Between Groups92.012330.67115.4130.012 *
Within Groups7.96041.990
Total99.9717
w N D S Between Groups92.012330.67115.4130.012 *
Within Groups7.96041.990
Total99.9717
w A s h Between Groups703.8523234.61747.5230.001 **
Within Groups19.74844.937
Total723.6007
w F C Between Groups4485.41231495.1379.8530.026 *
Within Groups606.8194151.705
Total5092.2307
w V Between Groups21.63237.21117.4400.009 **
Within Groups1.65440.413
Total23.2867
Note: ** indicates highly significant (p < 0.01); * indicates significant (0.01 < p < 0.05).
Table 4. Effect of aqueous phase recycling on the overall characteristics of hydrothermal degradation.
Number of Recycling0123
Hydrothermal degradation efficiency index (d%)
Nondegradable solid yield ( w N D S , d%)27.26 ± 1.3135.01 ± 1.1936.02 ± 2.1733.00 ± 0.35
Hydrothermal degradation rate (HTD, d%)72.75 ± 1.3164.99 ± 1.1963.99 ± 2.1767.00 ± 0.35
Bio-crude oil yield ( w B O , d%)20.42 ± 0.3222.72 ± 1.6122.89 ± 0.2024.31 ± 1.64
Composition characteristics of nondegradable solids (NDS%)
Hard–to–degrade organics content of NDS ( w V N D S , SR%)35.15 ± 0.6536.43 ± 0.7834.87 ± 0.2136.75 ± 2.01
Ash content of NDS ( w A s h N D S , NDS%)8.90 ± 1.7310.93 ± 0.7412.29 ± 1.7311.66 ± 0.65
Fixed carbon content of NDS ( w F C N D S , NDS%)55.96 ± 1.0952.64 ± 1.5152.85 ± 1.9551.59 ± 1.36
Deposition characteristics of nondegradable solids components (%)
Fixed carbon deposition rate ( w F C , FC%)248.41± 11.92300.14 ± 10.20309.97 ± 18.68277.28 ± 2.97
Hard–to–degrade organics deposition rate ( w V , daf%)12.37 ± 0.5916.46 ± 0.5616.21 ± 0.9815.65 ± 0.17
Ash deposition rate ( w A s h , Ash%)30.61 ± 1.4748.31 ± 1.6455.86 ± 3.3749.55 ± 1.89
Table 5. The percentages (%) of major ash–forming metals in NDS.
MetalsC0C1C2C3
Ca0.6920.3560.6990.465
K0.3590.6290.6430.389
Mg0.3450.1560.5690.246
Al0.2840.4550.1640.139
Fe0.1770.1370.1190.068
Ni0.0480.1220.0820.035
Ti0.0170.0100.0100.002
Cr0.0070.0200.0190.006
Mn0.0060.0050.0060.004
Ba0.0060.0080.0060.003
Mo0.0050.0040.0970.026
Table 6. The surface area and pore volume of nondegradable solids (NDS).
Number of RecyclingSurface Area
(m2/g)
Pore Volume
(cm3/g)
Pore Size
(nm)
012.200.0618.25
14.640.0436.15
26.690.0320.29
34.080.0217.74
Table 7. Ultimate analysis of Bio-crude oil.
Number of RecyclingUltimate Analysis (d%)H/CO/CN/OCarbon Recovery (CR%)Hydrogen Recovery (HR%)Nitrogen Recovery (NR%)
CHONS
069.80 ± 0.066.78 ± 0.1313.34 ± 0.201.19 ± 0.140.00 ± 0.001.170.140.1032.28 ± 0.5024.51 ± 0.3826.42 ± 0.41
168.08 ± 0.167.10 ± 0.1712.56 ± 0.401.25 ± 0.030.08 ± 0.041.250.140.1135.01 ± 2.4728.54 ± 2.0230.86 ± 2.18
268.61 ± 0.046.86 ± 0.0210.75 ± 0.031.49 ± 0.010.00 ± 0.001.200.120.1635.55 ± 0.3127.80 ± 0.2437.07 ± 0.32
369.84 ± 0.127.08 ± 0.079.92 ± 0.011.49 ± 0.010.02 ± 0.031.220.23 0.1738.44 ± 2.5930.45 ± 2.0539.37 ± 2.66
Publisher’s Note: MDPI stays neutral with regard to jurisdictional claims in published maps and institutional affiliations.

