Characterization of Severely Biodegraded Crude Oils Using Negative-Ion ESI Orbitrap MS, GC-NCD and GC-SCD: Insights into Heteroatomic Compounds Biodegradation

Abstract
:1. Introduction
2. Materials and Methods
2.1. Sample Descriptions
2.2. GC-NCD and GC-SCD
2.3. Negative-Ion ESI Orbitrap MS and Data Processing
3. Results and Discussion
3.1. GC-Amendable Nitrogen and Sulfur Compounds
3.2. Heteroatom Class Composition
3.3. Alteration of Oxygen-Only Containing Classes
3.3.1. O1 Species
3.3.2. O2 Species
3.3.3. O3–O5 Species
3.4. Alteration of Nitrogen-Containing Classes
3.4.1. N1 Species
3.4.2. N2 Species
3.4.3. N1O1–N1O3 Species
3.5. Alteration of Sulfur-Containing Classes
3.5.1. N1S1 Species
3.5.2. Benzothiophenes and Dibenzothiophenes
4. Conclusions
Author Contributions
Funding
Institutional Review Board Statement
Informed Consent Statement
Data Availability Statement
Acknowledgments
Conflicts of Interest
References
- Milner, C.W.D.; Rogers, M.A.; Evans, C.R. Petroleum transformations in reservoirs. J. Geochem. Explor. 1977, 7, 101–153. [Google Scholar] [CrossRef]
- Volkman, J.K.; Alexander, R.; Kagi, R.I.; Woodhouse, G.W. Demethylated hopanes in crude oils and their applications in petroleum geochemistry. Geochim. Cosmochim. Acta 1983, 47, 785–794. [Google Scholar] [CrossRef]
- Peters, K.E.; Walters, C.C.; Moldowan, J.M. The Biomarker Guide 2. Biomarkers and Isotopes in Petroleum Exploration and Earth History; Cambridge University Press: New York, NY, USA, 2005. [Google Scholar]
- Wenger, L.M.; Davis, C.L.; Isaksen, G.H. Multiple controls on petroleum biodegradation and impact on oil quality. SPE Reserv. Eval. Eng. 2002, 5, 375–383. [Google Scholar] [CrossRef]
- Widdel, F.; Rabus, R. Anaerobic biodegradation of saturated and aromatic hydrocarbons. Curr. Opin. Biotech. 2001, 12, 259–276. [Google Scholar] [CrossRef]
- Moldowan, J.M.; McCaffrey, M.A. A novel microbial hydrocarbon degradation pathway revealed by hopane demethylation in a petroleum reservoir. Geochim. Cosmochim. Acta 1995, 59, 1891–1894. [Google Scholar] [CrossRef]
- Meckenstock, R.U.; Boll, M.; Mouttaki, H.; Koelschbach, J.S.; Cunha Tarouco, P.; Weyrauch, P.; Dong, X.; Himmelberg, A.M. Anaerobic degradation of benzene and polycyclic aromatic hydrocarbons. Microb. Physiol. 2016, 26, 92–118. [Google Scholar] [CrossRef]
- Meredith, W.; Kelland, S.J.; Jones, D.M. Influence of biodegradation on crude oil acidity and carboxylic acid composition. Org. Geochem. 2000, 31, 1059–1073. [Google Scholar] [CrossRef]
- Watson, J.S.; Jones, D.M.; Swannell, R.P.J.; van Duin, A.C.T. Formation of carboxylic acids during aerobic biodegradation of crude oil and evidence of microbial oxidation of hopanes. Org. Geochem. 2002, 33, 1153–1169. [Google Scholar] [CrossRef]
- Behar, F.H.; Albrecht, P. Correlations between carboxylic acids and hydrocarbons in several crude oils. Alter. Biodegrad. Org. Geochem. 1984, 6, 597–604. [Google Scholar] [CrossRef]
- Marshall, A.G.; Hendrickson, C.L.; Jackson, G.S. Fourier transform ion cyclotron resonance mass spectrometry: A primer. Mass Spectrom. Rev. 1998, 17, 1–35. [Google Scholar] [CrossRef]
- Rodgers, R.P.; Marshall, A.G. Petroleomics: Advanced characterization of petroleum-derived materials by fourier transform ion cyclotron resonance mass spectrometry (FT-ICR MS). In Asphaltenes, Heavy Oils, and Petroleomics; Mullins, O.C., Sheu, E.Y., Hammami, A., Marshall, A.G., Eds.; Springer: New York, NY, USA, 2007; pp. 63–93. [Google Scholar]
- Hu, Q.; Noll, R.J.; Li, H.; Makarov, A.; Hardman, M.; Graham Cooks, R. The Orbitrap: A new mass spectrometer. J. Mass Spectrom. 2005, 40, 430–443. [Google Scholar] [CrossRef]
- Schmidt, E.M.; Pudenzi, M.A.; Santos, J.M.; Angolini, C.F.F.; Pereira, R.C.L.; Rocha, Y.S.; Denisov, E.; Damoc, E.; Makarov, A.; Eberlin, M.N. Petroleomics via Orbitrap mass spectrometry with resolving power above 1 000 000 at m/z 200. RSC Adv. 2018, 8, 6183–6191. [Google Scholar] [CrossRef] [Green Version]
- Hughey, C.A.; Hendrickson, C.L.; Rodgers, R.P.; Marshall, A.G. Elemental composition analysis of processed and unprocessed diesel fuel by electrospray ionization fourier transform ion cyclotron resonance mass spectrometry. Energy Fuels 2001, 15, 1186–1193. [Google Scholar] [CrossRef]
- Qian, K.; Rodgers, R.P.; Hendrickson, C.L.; Emmett, M.R.; Marshall, A.G. Reading chemical fine print: Resolution and identification of 3000 nitrogen-containing aromatic compounds from a single electrospray ionization Fourier transform ion cyclotron resonance mass spectrum of heavy petroleum crude oil. Energy Fuels 2001, 15, 492–498. [Google Scholar] [CrossRef]
- Hughey, C.A.; Rodgers, R.P.; Marshall, A.G.; Qian, K.; Robbins, W.K. Identification of acidic NSO compounds in crude oils of different geochemical origins by negative ion electrospray Fourier transform ion cyclotron resonance mass spectrometry. Org. Geochem. 2002, 33, 743–759. [Google Scholar] [CrossRef]
- Liu, P.; Shi, Q.; Chung, K.H.; Zhang, Y.; Pan, N.; Zhao, S.; Xu, C. Molecular characterization of sulfur compounds in Venezuela crude oil and its SARA fractions by electrospray ionization fourier transform ion cyclotron resonance mass spectrometry. Energy Fuels 2010, 24, 5089–5096. [Google Scholar] [CrossRef]
- Wan, Z.; Li, S.; Pang, X.; Dong, Y.; Wang, Z.; Chen, X.; Meng, X.; Shi, Q. Characteristics and geochemical significance of heteroatom compounds in terrestrial oils by negative-ion electrospray Fourier transform ion cyclotron resonance mass spectrometry. Org. Geochem. 2017, 111, 34–55. [Google Scholar] [CrossRef]
- Ji, H.; Li, S.; Greenwood, P.; Zhang, H.; Pang, X.; Xu, T.; He, N.; Shi, Q. Geochemical characteristics and significance of heteroatom compounds in lacustrine oils of the Dongpu Depression (Bohai Bay Basin, China) by negative-ion Fourier transform ion cyclotron resonance mass spectrometry. Mar. Pet. Geol. 2018, 97, 568–591. [Google Scholar] [CrossRef]
- Hughey, C.A.; Rodgers, R.P.; Marshall, A.G.; Walters, C.C.; Qian, K.; Mankiewicz, P. Acidic and neutral polar NSO compounds in Smackover oils of different thermal maturity revealed by electrospray high field Fourier transform ion cyclotron resonance mass spectrometry. Org. Geochem. 2004, 35, 863–880. [Google Scholar] [CrossRef]
- dos Santos Rocha, Y.; Pereira, R.C.L.; Mendonça Filho, J.G. Negative electrospray Fourier transform ion cyclotron resonance mass spectrometry determination of the effects on the distribution of acids and nitrogen-containing compounds in the simulated thermal evolution of a Type-I source rock. Org. Geochem. 2018, 115, 32–45. [Google Scholar]
- Han, Y.; Poetz, S.; Mahlstedt, N.; Karger, C.; Horsfield, B. Fractionation and origin of NyOx and Ox compounds in the Barnett Shale sequence of the Marathon 1 Mesquite well, Texas. Mar. Pet. Geol. 2018, 97, 517–524. [Google Scholar] [CrossRef]
- Han, Y.; Poetz, S.; Mahlstedt, N.; Karger, C.; Horsfield, B. Fractionation of pyrrolic nitrogen compounds compounds during primary migration of petroleum within the barnett shale sequence of marathon 1 Mesquite well, Texas. Energy Fuels 2018, 32, 4638–4650. [Google Scholar] [CrossRef] [Green Version]
- Liu, P.; Li, M.; Jiang, Q.; Cao, T.; Sun, Y. Effect of secondary oil migration distance on composition of acidic NSO compounds in crude oils determined by negative-ion electrospray Fourier transform ion cyclotron resonance mass spectrometry. Org. Geochem. 2015, 78, 23–31. [Google Scholar] [CrossRef]
- Ventura, G.T.; Rossel, P.E.; Simoneit, B.R.T.; Dittmar, T. Fourier transform ion cyclotron resonance mass spectrometric analysis of NSO-compounds generated in hydrothermally altered sediments from the Escanaba Trough, northeastern Pacific Ocean. Org. Geochem. 2020, 149, 104085. [Google Scholar] [CrossRef]
- Gomez-Saez, G.V.; Niggemann, J.; Dittmar, T.; Pohlabeln, A.M.; Lang, S.Q.; Noowong, A.; Pichler, T.; Wörmer, L.; Bühring, S.I. Molecular evidence for abiotic sulfurization of dissolved organic matter in marine shallow hydrothermal systems. Geochim. Cosmochim. Acta 2016, 190, 35–52. [Google Scholar] [CrossRef]
- Yang, C.; Zhang, G.; Serhan, M.; Koivu, G.; Yang, Z.; Hollebone, B.; Lambert, P.; Brown, C.E. Characterization of naphthenic acids in crude oils and refined petroleum products. Fuel 2019, 255, 115849. [Google Scholar] [CrossRef]
- Liu, Y.; Huang, H.; Liu, Q.; Xu, X.; Cheng, H. The acid and neutral nitrogen compounds characterized by negative ESI Orbitrap MS in a heavy oil before and after oxidation. Fuel 2020, 277, 118085. [Google Scholar] [CrossRef]
- Xia, Y.; Ma, C.; Ju, R.; Zhao, C.; Zheng, F.; Sun, X.; Li, Z.; Wang, C.; Shi, D.; Lin, X.; et al. Characterization of nitrogen-containing compounds in petroleum fractions by online reversed-phase liquid chromatography-electrospray ionization Orbitrap mass spectrometry. Fuel 2021, 284, 119035. [Google Scholar] [CrossRef]
- Rodrigues Covas, T.; Santos de Freitas, C.; Valadares Tose, L.; Valencia-Dávila, J.A.; dos Santos Rocha, Y.; Duncan Rangel, M.; Cabral da Silva, R.; Gontijo Vaz, B. Fractionation of polar compounds from crude oils by hetero-medium pressure liquid chromatography (H-MPLC) and molecular characterization by ultrahigh-resolution mass spectrometry. Fuel 2020, 267, 117289. [Google Scholar] [CrossRef]
- Ghaste, M.; Mistrik, R.; Shulaev, V. Applications of fourier transform ion cyclotron resonance (FT-ICR) and orbitrap based high resolution mass spectrometry in metabolomics and lipidomics. Int. J. Mol. Sci. 2016, 17, 816. [Google Scholar] [CrossRef]
- Kim, S.; Stanford, L.A.; Rodgers, R.P.; Marshall, A.G.; Walters, C.C.; Qian, K.; Wenger, L.M.; Mankiewicz, P. Microbial alteration of the acidic and neutral polar NSO compounds revealed by Fourier transform ion cyclotron resonance mass spectrometry. Org. Geochem. 2005, 36, 1117–1134. [Google Scholar] [CrossRef]
- Hughey, C.A.; Galasso, S.A.; Zumberge, J.E. Detailed compositional comparison of acidic NSO compounds in biodegraded reservoir and surface crude oils by negative ion electrospray Fourier transform ion cyclotron resonance mass spectrometry. Fuel 2007, 86, 758–768. [Google Scholar] [CrossRef]
- Pan, Y.; Liao, Y.; Shi, Q.; Hsu, C.S. Acidic and neutral polar NSO compounds in heavily biodegraded oils characterized by negative-ion ESI FT-ICR MS. Energy Fuels 2013, 27, 2960–2973. [Google Scholar] [CrossRef]
- Oldenburg, T.B.P.; Jones, M.; Huang, H.; Bennett, B.; Shafiee, N.S.; Head, I.; Larter, S.R. The controls on the composition of biodegraded oils in the deep subsurface—Part 4. Destruction and production of high molecular weight non-hydrocarbon species and destruction of aromatic hydrocarbons during progressive in-reservoir biodegradation. Org. Geochem. 2017, 114, 57–80. [Google Scholar] [CrossRef] [Green Version]
- Liu, Y.; Wan, Y.Y.; Zhu, Y.; Fei, C.; Shen, Z.; Ying, Y. Impact of biodegradation on polar compounds in crude oil: Comparative simulation of biodegradation from two aerobic bacteria using ultrahigh-resolution mass spectrometry. Energy Fuels 2020, 34, 5553–5565. [Google Scholar] [CrossRef]
- Cheng, X.; Hou, D.; Xu, C.; Wang, F. Biodegradation of tricyclic terpanes in crude oils from the Bohai Bay Basin. Org. Geochem. 2016, 101, 11–21. [Google Scholar] [CrossRef]
- Cheng, X.; Hou, D.; Mao, R.; Xu, C. Severe biodegradation of polycyclic aromatic hydrocarbons in reservoired crude oils from the Miaoxi Depression, Bohai Bay Basin. Fuel 2018, 211, 859–867. [Google Scholar] [CrossRef]
- Cheng, X.; Hou, D.; Xu, C. The effect of biodegradation on adamantanes in reservoired crude oils from the Bohai Bay Basin, China. Org. Geochem. 2018, 123, 38–43. [Google Scholar] [CrossRef]
- Shi, Q.; Hou, D.; Chung, K.H.; Xu, C.; Zhao, S.; Zhang, Y. Characterization of heteroatom compounds in a crude oil and its saturates, aromatics, resins, and asphaltenes (SARA) and non-basic nitrogen fractions analyzed by negative-ion electrospray ionization fourier transform ion cyclotron resonance mass spectrometry. Energy Fuels 2010, 24, 2545–2553. [Google Scholar]
- Shi, Q.; Pan, N.; Long, H.; Cui, D.; Guo, X.; Long, Y.; Chung, K.H.; Zhao, S.; Xu, C.; Hsu, C.S. characterization of middle-temperature gasification coal tar. part 3: Molecular composition of acidic compounds. Energy Fuels 2013, 27, 108–117. [Google Scholar] [CrossRef]
- Song, H.; Wen, Z.; Bao, J. Influence of biodegradation on carbazole and benzocarbazole distributions in oils from the Bongor Basin, Chad. Org. Geochem. 2016, 100, 18–28. [Google Scholar] [CrossRef]
- Liao, Y.; Shi, Q.; Hsu, C.S.; Pan, Y.; Zhang, Y. Distribution of acids and nitrogen-containing compounds in biodegraded oils of the Liaohe Basin by negative ion ESI FT-ICR MS. Org. Geochem. 2012, 47, 51–65. [Google Scholar] [CrossRef]
- Liu, W.; Liao, Y.; Pan, Y.; Jiang, B.; Zeng, Q.; Shi, Q.; Hsu, C.S. Use of ESI FT–ICR MS to investigate molecular transformation in simulated aerobic biodegradation of a sulfur-rich crude oil. Org. Geochem. 2018, 123, 17–26. [Google Scholar] [CrossRef]
- Harwood, C.S.; Burchhardt, G.; Herrmann, H.; Fuchs, G. Anaerobic metabolism of aromatic compounds via the benzoyl-CoA pathway. FEMS Microbiol. Rev. 1998, 22, 439–458. [Google Scholar] [CrossRef]
- Qian, K.; Robbins, W.K.; Hughey, C.A.; Cooper, H.J.; Rodgers, R.P.; Marshall, A.G. Resolution and identification of elemental compositions for more than 3000 crude acids in heavy petroleum by negative-ion microelectrospray high-field fourier transform ion cyclotron resonance mass spectrometry. Energy Fuels 2001, 15, 1505–1511. [Google Scholar] [CrossRef]
- Colati, K.A.P.; Dalmaschio, G.P.; de Castro, E.V.R.; Gomes, A.O.; Vaz, B.G.; Romão, W. Monitoring the liquid/liquid extraction of naphthenic acids in brazilian crude oil using electrospray ionization FT-ICR mass spectrometry (ESI FT-ICR MS). Fuel 2013, 108, 647–655. [Google Scholar] [CrossRef] [Green Version]
- Mapolelo, M.M.; Rodgers, R.P.; Blakney, G.T.; Yen, A.T.; Asomaning, S.; Marshall, A.G. Characterization of naphthenic acids in crude oils and naphthenates by electrospray ionization FT-ICR mass spectrometry. Int. J. Mass Spectrom. 2011, 300, 149–157. [Google Scholar] [CrossRef]
- Cooper, J.E. Fatty acids in recent and ancient sediments and petroleum reservoir waters. Nature 1962, 193, 744–746. [Google Scholar] [CrossRef]
- Shimoyama, A.; Johns, W.D. Catalytic conversion of fatty acids to petroleum-like paraffins and their maturation. Nat. Phys. Sci. 1971, 232, 140–144. [Google Scholar] [CrossRef]
- Aitken, C.M.; Jones, D.M.; Larter, S.R. Anaerobic hydrocarbon biodegradation in deep subsurface oil reservoirs. Nature 2004, 431, 291–294. [Google Scholar] [CrossRef]
- Barth, T.; Høiland, S.; Fotland, P.; Askvik, K.M.; Pedersen, B.S.; Borgund, A.E. Acidic compounds in biodegraded petroleum. Org. Geochem. 2004, 35, 1513–1525. [Google Scholar] [CrossRef]
- Bennett, B.; Fustic, M.; Farrimond, P.; Huang, H.; Larter, S.R. 25-Norhopanes: Formation during biodegradation of petroleum in the subsurface. Org. Geochem. 2006, 37, 787–797. [Google Scholar] [CrossRef]
- Bennett, B.; Aitken, C.M.; Jones, D.M.; Farrimond, P.; Larter, S.R. The occurrence and significance of 25-norhopanoic acids in petroleum reservoirs. Org. Geochem. 2007, 38, 1977–1985. [Google Scholar] [CrossRef]
- Headley, J.V.; McMartin, D.W. A review of the occurrence and fate of naphthenic acids in aquatic environments. J. Environ. Sci. Health Part A 2004, 39, 1989–2010. [Google Scholar] [CrossRef] [PubMed]
- Clemente, J.S.; Fedorak, P.M. A review of the occurrence, analyses, toxicity, and biodegradation of naphthenic acids. Chemosphere 2005, 60, 585–600. [Google Scholar] [CrossRef]
- Annweiler, E.; Michaelis, W.; Meckenstock, R.U. Identical ring cleavage products during anaerobic degradation of naphthalene, 2-methylnaphthalene, and tetralin indicate a new metabolic pathway. Appl. Environ. Microbiol. 2002, 68, 852–858. [Google Scholar] [CrossRef] [Green Version]
- Meckenstock, R.U.; Mouttaki, H. Anaerobic degradation of non-substituted aromatic hydrocarbons. Curr. Opin. Biotech. 2011, 22, 406–414. [Google Scholar] [CrossRef]
- Eberlein, C.; Estelmann, S.; Seifert, J.; von Bergen, M.; Mueller, M.; Meckenstock, R.U.; Boll, M. Identification and characterization of 2-naphthoyl-coenzyme A reductase, the prototype of a novel class of dearomatizing reductases. Mol. Microbiol. 2013, 88, 1032–1039. [Google Scholar] [CrossRef]
- Lamorde, U.A.; Parnell, J.; Bowden, S.A. Constraining the genetic relationships of 25-norhopanes, hopanoic and 25-norhopanoic acids in onshore Niger Delta oils using a temperature-dependent material balance. Org. Geochem. 2015, 79, 31–43. [Google Scholar] [CrossRef]
- Huang, H.; Jin, G.; Lin, C.; Zheng, Y. Origin of an unusual heavy oil from the Baiyinchagan depression, Erlian basin, northern China. Mar. Petrol. Geol. 2003, 20, 1–12. [Google Scholar] [CrossRef]
- Sun, P.; Cai, C.; Tang, Y.; Tao, Z.; Zhao, W. A new approach to investigate effects of biodegradation on pyrrolic compounds by using a modified Manco scale. Fuel 2020, 265, 116937. [Google Scholar] [CrossRef]
- Tomczyk, N.A.; Winans, R.E.; Shinn, J.H.; Robinson, R.C. On the nature and origin of acidic species in petroleum. 1. detailed acid type distribution in a california crude oil. Energy Fuels 2001, 15, 1498–1504. [Google Scholar] [CrossRef]
- Vaz, B.G.; Silva, R.C.; Klitzke, C.F.; Simas, R.C.; Lopes Nascimento, H.D.; Pereira, R.C.L.; Garcia, D.F.; Eberlin, M.N.; Azevedo, D.A. Assessing biodegradation in the llanos orientales crude oils by electrospray ionization ultrahigh resolution and accuracy fourier transform mass spectrometry and chemometric analysis. Energy Fuels 2013, 27, 1277–1284. [Google Scholar] [CrossRef]
- Grifoli, M.; Selifonov, S.A.; Chapman, P.J. Transformation of substituted fluorenes and fluorene analogs by Pseudomonas sp. strain F274. Appl. Environ. Microbiol. 1995, 61, 3490–3493. [Google Scholar] [CrossRef] [PubMed] [Green Version]
- Sato, S.I.; Nam, J.W.; Kasuga, K.; Nojiri, H.; Yamane, H.; Omori, T. Identification and characterization of genes encoding carbazole 1,9a-dioxygenase in Pseudomonas sp. strain CA10. J. Bacteriol. 1997, 179, 4850. [Google Scholar]
- Nojiri, H.; Nam, J.W.; Kosaka, M.; Morii, K.I.; Takemura, T.; Furihata, K.; Yamane, H.; Omori, T. Diverse oxygenations catalyzed by carbazole 1,9a-dioxygenase from Pseudomonas sp strain CA10. J. Bacteriol. 1999, 181, 3105–3113. [Google Scholar] [CrossRef] [Green Version]
- Lobastova, T.G.; Sukhodolskaya, G.V.; Nikolayeva, V.M.; Baskunov, B.P.; Turchin, K.F.; Donova, M.V. Hydroxylation of carbazoles by Aspergillus flavus VKM F-1024. FEMS Microbiol. Lett. 2004, 235, 51–56. [Google Scholar] [CrossRef]
- Yamazoe, A.; Yagi, O.; Oyaizu, H. Biotransformation of fluorene, diphenyl ether, dibenzo-p-dioxin and carbazole by Janibacter sp. Biotechnol. Lett. 2004, 26, 479–486. [Google Scholar]
- Seo, J.-S.; Keum, Y.-S.; Kyu Cho, I.; Li, Q.X. Degradation of dibenzothiophene and carbazole by Arthrobacter sp. P1-1. Int. Biodeterior. Biodegrad. 2006, 58, 36–43. [Google Scholar] [CrossRef]
- Kodama, K.; Umehara, K.; Shimizu, K.; Nakatani, S.; Minoda, Y.; Yamada, K. Identification of Microbial Products from Dibenzothiophene and Its Proposed Oxidation Pathway. Agric. Biol. Chem. 1973, 37, 45–50. [Google Scholar]
- Lu, J.; Nakajima-Kambe, T.; Shigeno, T.; Ohbo, A.; Nomura, N.; Nakahara, T. Biodegradation of dibenzothiophene and 4,6-dimethyldibenzothiophene by Sphingomonas paucimobilis strain TZS-7. J. Biosci. Bioeng. 1999, 88, 293–299. [Google Scholar] [CrossRef]
- van Afferden, M.; Schacht, S.; Klein, J.; Trüper, H.G. Degradation of dibenzothiophene by Brevibacterium sp.DO. Arch. Microbiol. 1990, 153, 324–328. [Google Scholar] [CrossRef]
- Gallagher, J.R.; Olson, E.S.; Stanley, D.C. Microbial desulfurization of dibenzothiophene: A sulfur-specific pathway. FEMS Microbiol. Lett. 1993, 107, 31–35. [Google Scholar] [CrossRef] [PubMed]
- Gilbert, S.C.; Morton, J.; Buchanan, S.; Oldfield, C.; McRoberts, A. Isolation of a unique benzothiophene-desulphurizing bacterium, Gordona sp. strain 213E (NCIMB 40816), and characterization of the desulphurization pathway. Microbiology 1998, 144, 2545–2553. [Google Scholar] [CrossRef] [Green Version]
- El-Gendy, N.S.; Nassar, H.N. Microbial attack of organosulfur compounds. In Biodesulfurization in Petroleum Refining; El-Gendy, N.S., Nassar, H.N., Eds.; John Wiley & Sons, Inc.: Hoboken, NJ, USA, 2018; pp. 375–458. [Google Scholar]


| Sample ID | Depth (m) | D29/C30H | C21TT/C24TT | C23TT/C24TT | PM Level |
|---|---|---|---|---|---|
| PL15-1B | 1475–1478 | - | 1.36 | 1.6 | - |
| PL15-1A | 1164–1170 | 0.69 | 1.32 | 1.6 | 7 |
| PL15-8C | 1747–1758 | 6.16 | 0.2 | 0.61 | 8 |
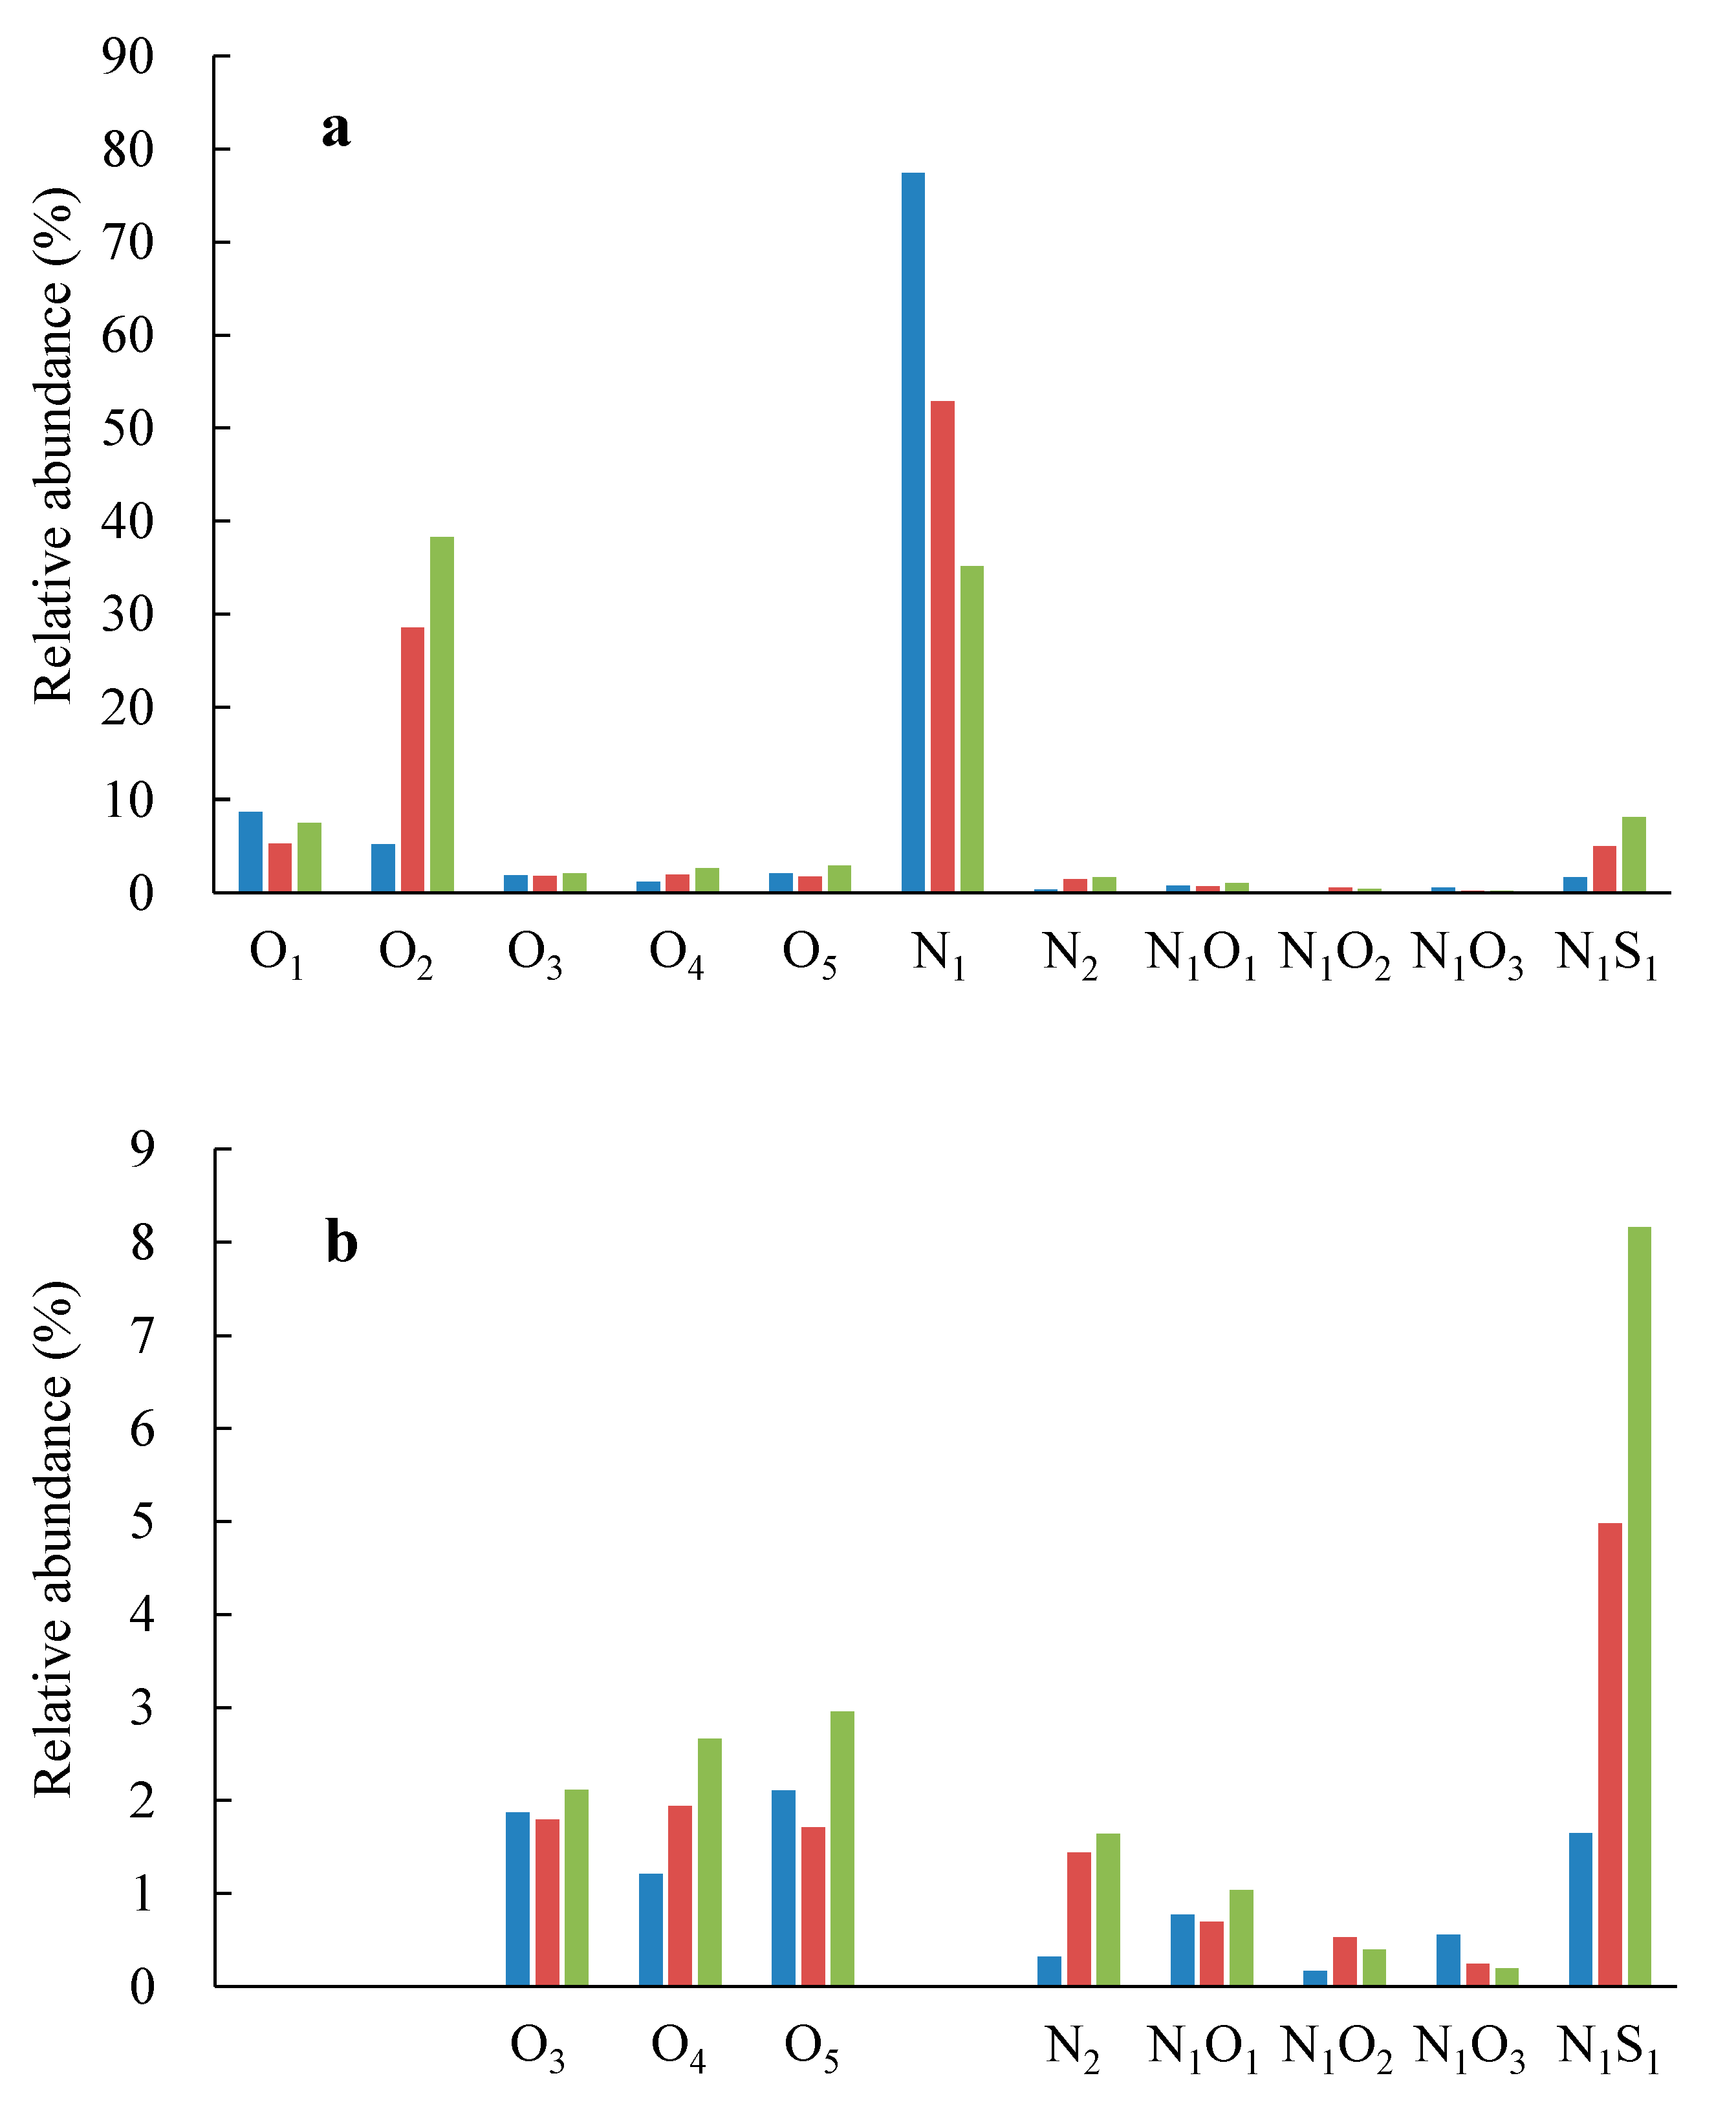
| Species | PL15-1B | PL15-1B | PL15-8C |
|---|---|---|---|
| O1 | 8.7 | 5.3 | 7.5 |
| O2 | 5.2 | 28.5 | 38.2 |
| O3 | 1.9 | 1.8 | 2.1 |
| O4 | 1.2 | 1.9 | 2.7 |
| O5 | 2.1 | 1.7 | 3.0 |
| N1 | 77.4 | 52.9 | 35.1 |
| N2 | 0.32 | 1.4 | 1.6 |
| N1O1 | 0.77 | 0.69 | 1.04 |
| N1O2 | 0.17 | 0.53 | 0.39 |
| N1O3 | 0.56 | 0.24 | 0.19 |
| N1S1 | 1.7 | 5.0 | 8.2 |
Publisher’s Note: MDPI stays neutral with regard to jurisdictional claims in published maps and institutional affiliations. |
© 2021 by the authors. Licensee MDPI, Basel, Switzerland. This article is an open access article distributed under the terms and conditions of the Creative Commons Attribution (CC BY) license (http://creativecommons.org/licenses/by/4.0/).
Share and Cite
Cheng, X.; Hou, D. Characterization of Severely Biodegraded Crude Oils Using Negative-Ion ESI Orbitrap MS, GC-NCD and GC-SCD: Insights into Heteroatomic Compounds Biodegradation. Energies 2021, 14, 300. https://doi.org/10.3390/en14020300
Cheng X, Hou D. Characterization of Severely Biodegraded Crude Oils Using Negative-Ion ESI Orbitrap MS, GC-NCD and GC-SCD: Insights into Heteroatomic Compounds Biodegradation. Energies. 2021; 14(2):300. https://doi.org/10.3390/en14020300
Chicago/Turabian StyleCheng, Xiong, and Dujie Hou. 2021. "Characterization of Severely Biodegraded Crude Oils Using Negative-Ion ESI Orbitrap MS, GC-NCD and GC-SCD: Insights into Heteroatomic Compounds Biodegradation" Energies 14, no. 2: 300. https://doi.org/10.3390/en14020300