Article

Fault Propagation Inference Based on a Graph Neural Network for Steam Turbine Systems

Department of Automation, Shanghai Jiao Tong University, Shanghai 200240, China
*
Author to whom correspondence should be addressed.
These authors contributed equally to this work.
Energies 2021, 14(2), 309; https://doi.org/10.3390/en14020309
Submission received: 4 December 2020 / Revised: 2 January 2021 / Accepted: 5 January 2021 / Published: 8 January 2021

Abstract

:
A fault propagates along physical paths until it reaches the boundary of the equipment or system, which shows as a functional failure. Hence, inferring the fault propagation helps to ensure the normal operation of the industrial system. To infer the fault propagation in the steam turbine system, a graph model is developed. Firstly, a process graph topology is constructed according to the system mechanism, whose nodes and edges represent the equipment and mutual relationships. Meanwhile, a fault graph topology is built, in which nodes indicate potential faults and edges are inferred propagation paths. Then, the representations of fault nodes are realized through a graph neural network. Lastly, link prediction methods based on nodes’ representations are conducted, along with the paths inference results. Consequently, the accuracy of fault propagation inference for the steam turbine system is over 86%.

1. Introduction

As industrial systems are becoming larger, with more strict operating conditions and higher requirements for security, economics, and maintenance, a Distributed Control System for monitoring the system under normal conditions is required for better performance, such as higher precision and shorter action time. On the other hand, the process equipment in a large-scale industrial system is interconnected and the faults can easily propagate from one to another through material or information flow paths [1]. This puts forward higher requirements for fault propagation inference due to several aspects. Firstly, inferring the fault propagation, it is beneficial to take measures in advance to prevent the further spread of the fault in the industrial system from causing a severe accident. Secondly, during the period of system design, finding out the most critical basic faults that affect the occurrence of accidents is conducive to improving the system reliability. Last but not least, fault propagation inference can help to restrain the accident from the root causes, which can be regarded as the fault detection and isolation.
Typical fault propagation inference methods can be divided into three steps: causality identification, causal model description, and propagation path inference [2]. First of all, causality is a physical phenomenon based on the cause-effect relationship between different variables [3], which is the basic fault path mode organizing the complete fault propagation path. Identifying causality usually utilizes structural equation models [4], cross-correlation analysis [5], Granger causality [6], frequency domain methods [7] and information theoretical methods [8]. After that, the causal model is established using the fault tree or the causal graph to represent the identified causalities as well as the process topology, and enable the fault propagation inference. Commonly used fault trees are Fault Tree analysis [9], Failure Mode and Effects Analysis [10] as well as Event Tree Analysis. Fault Tree Analysis infers the faults from top to bottom until the cause is found, and its modeling and applications have been summarized in [11,12]. Failure Mode and Effects Analysis identifies potential failure modes from down to top, which applies to power plants [13], enterprise architecture [14], hospital [15], etc. Event Tree Analysis is a forward logical modeling technology to infer events along the time sequence, which is firstly used in risk assessment for nuclear power plant [16] but is now applied to other industries such as spacecraft [17] and chemical processes [18]. Frequently adopted causal graphs are the signed directed graph [19], the bond graph [20], and the causality graph [21]. The signed directed graph regards nodes and edges as process variables and causalities, respectively. It is widely implemented in fault propagation inference of nuclear power plants [22,23,24], electronic systems [25], and multi-energy systems [26]. The bond graph represents physical dynamic systems graphically, which has applications to vast engineering systems [27]. The causality graph is a kind of directed graph, representing nodes and edges as faults and relationships between faults, which is applied to many complex industrial systems, such as [28,29]. Eventually, after the causal model is created, the graph traversals, such as depth-first search, breadth-first search, and heuristic search, are conducted to find the root causes and infer the fault propagation path.
In this study, a fault propagation inference scheme based on graph neural network is proposed. The graph neural network is the state-of-the-art technology to model relational data and systems. Graph neural networks were firstly proposed in [30] and developing various variants, such as graph convolutional networks [31] and graph autoencoders [32], with applications including but not limited to physics [33], chemistry and biology [34]. Recent overviews of the model and applications are exhibited in [35,36]. Unfortunately, to the best of the authors’ knowledge, there are few studies in the literature that utilize graph neural networks for the fault propagation inference. In this study, a process graph concerning the industrial process whose nodes and edges represent process variables and variables’ relationship, and a fault graph concerning the potential system and equipment faults in which fault nodes between different fault layers are fully connected are built. Then the representation of fault nodes are realized through graph neural networks. Lastly, link prediction methods using the representation of fault nodes residing in neighbor fault layers are adopted to infer the fault propagation paths. In this way, the proposed scheme brings several benefits. First of all, the fault graph is no longer difficult to build since fault nodes are fully connected. Next, the prediction results of graph neural networks and link prediction give the probabilities and uncertainties of the fault propagation paths, which ensure the reliability of the inference. Lastly, the proposed scheme is able to infer fault propagation online once the data of process variables are collected. In this way, the study brings several original and innovative points
(1)
A graph is introduced for the first time to characterize the relationships between process variables and faults.
(2)
A hierarchical framework is, for the first time, established to model the fault propagation paths.
(3)
Score function is, for the first time, applied to evaluate the propagation paths quantitatively.
At the end of this study, a comprehensive numerical example of the fault propagation of the steam turbine leakage has demonstrated the capability of the proposed scheme.
The paper consists of five sections. The first section introduces the research background and significance, and makes a literature review. The second section formulates the problems to be studied in detail. The third section mainly describes the theoretical derivation process of the proposed mathematical model. In section four, an example is given to verify the effectiveness of the proposed model. The last section summarizes the whole paper.

2. Problem Formulation
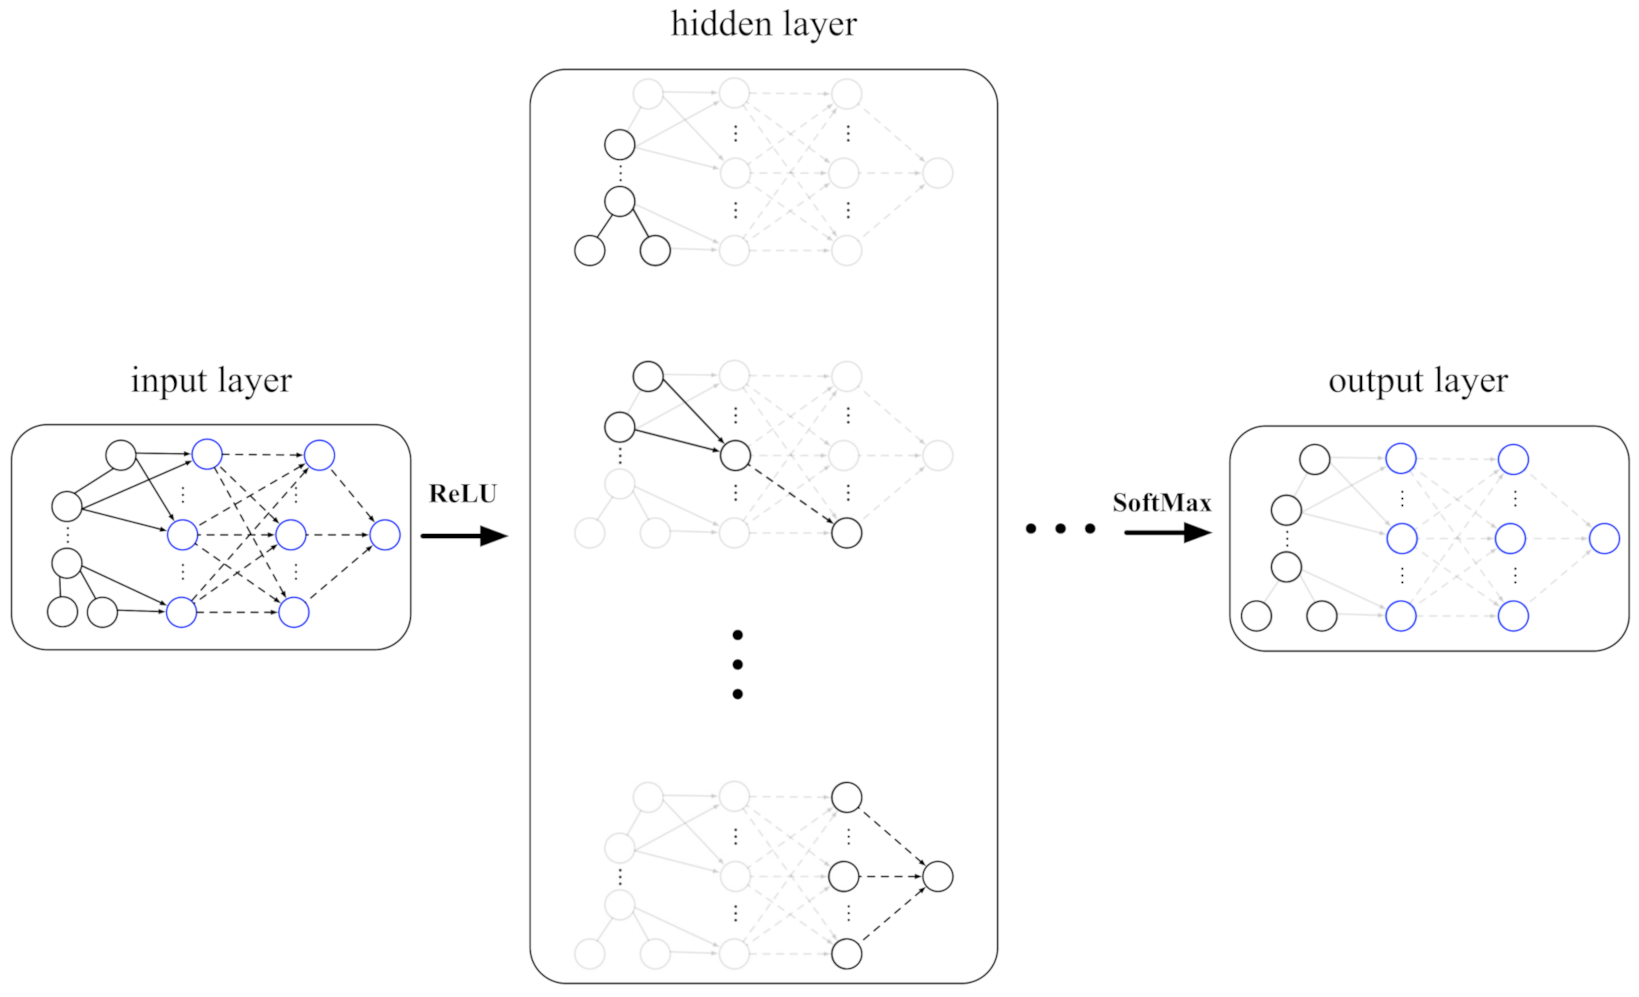
In the industrial system, the fault is the functional failure, which is triggered by an individual event or superposition of multiple events, and propagates to the boundary of the system, equipment, and components [37]. Inferring the fault propagation paths is helpful to take measures in advance to prevent the fault from spreading to the whole system.
For safety-critical industrial systems of greater complexity, the system is composed of several interrelated subsystems, which have the elements of coherence, hierarchy, fault propagation, and uncertainty. It is never an easy task to represent the system in a proper way which can capture these characteristics. Moreover, with the higher requirement for safety, economic and maintenance as well as the more diverse failure modes, proposing a method inferring the fault propagation is significant to prevent the fault to spread to a wider range and detect, isolate, and recover the faults.
Addressing the aforementioned engineering and technological limitations, the fault propagation graph model is proposed, as illustrated in Figure 1. The graph model is a general fault propagation inference model proposed in this paper. The graph is composed of one process layer and K fault layers. The process layer is a graph built according to the practical industrial system. X i and F k j denote the i-th industrial sensor data and the j-th fault in the k-th fault layer. For the faults in the fault layer 1, the individual fault node is connected with the related process variable nodes. For the j-th fault in the fault layer k, i.e., F k j , it is connected to all the fault nodes in the fault layer k 1 , depicted by the dashed lines in Figure 1. Moreover, only one dashed line between adjacent fault layers is selected to be the fault propagation path. All the fault propagation paths between adjacent fault layers organize the final fault propagation path.
The proposed graph model is a promising method for fault propagation inference due to several strengths. Firstly, the nodes in the first fault layer aggregate the information from the fault-related nodes in the process layer and then conduct appropriate nonlinear transformation, which can be regarded as the basic fault indicators indicating whether the variables in the industrial process conform to specified nonlinear constraints. The basic faults propagate to the next fault layers successively until reaching the system boundary. Secondly, the fully connected topology between fault layers avoids the struggle to build fault propagation paths in the existing methods. Last but not least, combining with the link prediction and deep learning technologies, the most exacted fault propagation path among fault layers can be determined and the fault propagation in the whole industrial system can be inferred online. Consequently, the problem can be formulated as: developing a graph model to infer the fault propagation for the industrial systems.

3. Preliminaries

Consider an industrial system to infer fault propagation. The schematic diagram stacking multiple layers of fault propagation graph is illustrated in Figure 2. Suppose that the deep graph model possesses L neural network layers, and the graph possesses 1 process layer and K fault layers in each neural network layer.
Remark 1.
For the industrial process, the sensor data such as temperature, pressure, voltage, flow rate, and their statistics organize the input the graph neural network. In the meantime, faults of components, subsystems, and systems and the propagation paths among faults are observed together with these sensor data, in which the observed propagation paths are regarded as the label of the edges for the fault layers.
The update of such a graph neural network can be divided into the updates of the process layer and fault layers. As for undirected process graph, the typical update derived from graph spectrum is:
h ( l + 1 ) = σ ( L h ( l ) W ( l ) ) ,
where h ( l ) is the feature of the l-th layer. The features for the process nodes are transformed process variable values, and the features for the fault nodes are the quantification of specific faults. σ is the ReLU function, where ReLU ( x ) = max ( 0 , x ) . W ( l ) R d ( l ) × d ( l + 1 ) denotes the network parameters to be optimized and d ( l ) is the feature dimension in the l-th layer. L is the Laplacian matrix:
L = D 1 A ,
where A and D are the adjacent matrix and degree matrix of the graph.
As for the directed or multi-relational process graph, the spectral-based update is no longer sufficient. Fortunately, spatial-based convolution is feasible in this case, which updates the feature of the single node through aggregating the features from the neighborhoods [38]. That is:
h i ( l + 1 ) = σ r R j N i r 1 d i , r h j ( l ) W r ( l ) + h i ( l ) W 0 ( l ) ,
where h i ( l ) is the feature of the i-th node in the l-th layer of the process graph. R is the relations collection. N i r is the set of neighbor nodes of node i under relation r. d i , r denotes the degree of node i. W r ( l ) R d ( l ) × d ( l + 1 ) and W 0 ( l ) R d ( l ) × d ( l + 1 ) represent weight matrices to be optimized of relation r and the node itself, respectively.
As for the fault layers in the graph model, the update for the j-th node in fault layer 1 is:
F ( 1 ) j ( l + 1 ) = σ ( i N j h i ( l ) W i j ( l ) ) ,
where F j ( 1 ) ( l + 1 ) is the j-th node in fault layer 1. W i j ( l ) is the weight matrix between process node i and fault node j. N j is the process nodes set which are related to the fault F ( 1 ) j .
Remark 2.
In (4), the fault node is the linear combination of the fault-related process nodes and then impose a nonlinear activation function, which can represent the nonlinear constraints hidden in the industrial system. Especially, the explicit forms of constraints are not easy to obtain. The general nonlinear formula is suitable to approximate the constraints under the optimized W i j ( l ) .
For the fault layer k from 1 to K 1 , the update for the fault node j in the ( l + 1 ) -th neural network layer is:
F ( k + 1 ) j ( l + 1 ) = σ 1 n k + 1 i = 1 n k F ( k ) i ( l ) W ( k ) j ( l ) + F ( k + 1 ) j ( l ) W ( k ) 0 ( l ) ,
where n k is the number of the fault nodes in the k-th fault layer, and W ( k ) j ( l ) is the parameters to be optimized. Obviously, the fault node share the same learnable parameters, which reduce the complexity and the overfitting probability of the graph neural network.
After successive stacking of graph neural network layers, the final fault node features for different fault layers are obtained in the L-th network layer. The edge with the highest score between fault layer k and k + 1 is the fault propagation path. The score function is adopted following DistMult factorization [39].
f ( F ( k ) i , F ( k + 1 ) j ) = F ( k ) i T R ( k + 1 ) j F ( k + 1 ) j ,
where F ( k ) i R d ( k ) denotes the i-th fault node of the k-th fault layer in the output layer of graph neural network. R ( k + 1 ) j R d ( k ) × d ( k + 1 ) is the score matrix mapping the features of fault nodes to the score of the path. The score is normalized using SoftMax function:
f ( F ( k ) i , F ( k + 1 ) j ) = exp ( F ( k ) i T R ( k + 1 ) j F ( k + 1 ) j ) / i = 1 n k exp ( F ( k ) i T R ( k + 1 ) j F ( k + 1 ) j )
where Softmax ( x k ) = exp ( x k ) k = 1 K exp ( x k ) , and K is the total class number.
Remark 3.
Similar to the Fault Tree Analysis, the fault propagation paths are inferred from the top event to the basic event. The difference is that the proposed graph neural network is unnecessary to build the exact propagation paths in advance, it only needs to select the most probable paths through the result of the score function.
From the top event to the bottom event, suppose that the j-th fault emerges in the k + 1 -th fault layer. The loss function of k + 1 -th fault layer is:
L ( k + 1 ) = i = 1 n k Y ( k + 1 ) i ln f ( F ( k ) i , F ( k + 1 ) j ) ,
where Y ( k + 1 ) i denotes the one-hot encoding label of the edge connecting the i-th fault in fault layer k and the j-th fault in the fault layer k + 1 . Consequently, the loss function for the whole graph neural network is:
L = k = 2 K L k .

4. Numerical Examples

Consider an industrial steam turbine to detect the steam leakage fault. The steam turbine is one of the most critical equipment in the power plant, whose operation conditions directly influence the efficiency of power generation, the system security, and the safety of the surrounding environment and operators. For typical steam turbine systems, the water in the boiler is heated to high temperature and high pressure steam. The steam successively flows through the high pressure casing (HP), reheater (RH), intermediate pressure casing (IP), pipe, and low pressure casing (LP), whose flow rate is controlled by control valves (CV). The steam expands in the interstage nozzle to obtain high speed to drive the turbine blades and the shaft to rotate and then drive the generator to generate electric power. Eventually, the exhausted steam that has completed work enters the condenser to condense into water and returns to the boiler for heating. The process graph of the steam turbine systems with 18 nodes and 21 edges is depicted in Figure 3a, where edges with different colors represent different types of relations, including relations of the Distributed Control System, relations of the governing stages, relations of the high pressure turbine, relations of the intermediate pressure turbine and reheater, and relations of the pipe and the low pressure turbine.
The governing stage is the most critical component to convert thermal energy to mechanical energy, as illustrated in Figure 4 [40].
The steam leakage in the interstage severely reduces the workable steam and affects the efficiency of the steam turbine. To relieve this phenomenon, glands are utilized to provide a steam seal between the stator parts and the rotor parts. In the interstage, three typical glands are mounted in the gap. Firstly, the tip gland arises from steam passing through the small clearance required between the moving blade tip and the casing. Secondly, the root gland controls the steam leakage in the axial space between the diaphragm and the rotating disk near the blade root. Thirdly, the diaphragm gland is designed to prevent steam leakage between the diaphragm and the shaft.
In addition to the three kinds of interstage glands, the shaft gland is located at the each end of the inner casing and outer casing of HP, IP and LP. The aim of the shaft gland in HP and IP is to prevent the steam from leaking out through the casing, while the aim in LP is preventing the air in the atmosphere from leaking into the casing, which leads to a loss of vacuum.
In practical industrial applications, the types of interstage glands and shaft glands are labyrinth glands, which are widely used in turbo machine to reduce leakage flow [41]. Many factors have influence on the efficiency of labyrinth glands, including but not limited to tooth bending damage and tooth mushrooming damage on seal leakage [42]. The defect of the glands will lead to a larger amount of steam leakage, resulting in larger steam consumption in order to generate the required power, that is, the specific steam consumption. Correspondingly, the fault propagation inference graph where faults propagate from the basic event of the gland defect to the top event of steam consumption increase is illustrated in Figure 3b. Different from the fully connected form in Figure 1, the first fault layer and the second fault layer in the steam leakage fault propagation graph are partly connected, due to the gland defects in HP, IP and LP are independent. In this case, the nodes number in the fault layers are n 1 = 6 , n 2 = 3 , n 3 = 1 . Since the fault of HP has nothing to do with IP and LP, the node of the fault layer 1 can be set as n 1 = 2 .
Actually, the process graph was connected with the basic fault nodes in the fault graph in Figure 3, such as the connection form shown in Figure 1. Here, the HP interstage gland and HP shaft gland nodes, the IP interstage gland and IP shaft gland nodes, and the LP interstage gland and LP shaft gland nodes in the process graph are connected with the HP power and HP flow nodes, the IP power and IP flow nodes, and the LP power and LP flow nodes in the fault graph respectively.
Referring to the supercritical steam turbine in [43], a steam turbine power and pressure regulating system is built based on transfer function in Matlab/Simulink. In order to simulate the steam leakage fault causing the steam consumption increase, we assume the steam supply will increase by 20% and 5% in case of the interstage gland defect and the shaft gland defect, respectively. After that, the time series with 4800 time steps is collected with regard to the 18 nodes in the process graph. For each time series attached with the node, it is cut into overlapped sub-time series with a length of 50 time steps and stride of 20 time steps. Statistics concerning the sub-time series are calculated to serve as the input for the graph neural network, which includes the mean, the variance, the median, the skewness, and the kurtosis. Eventually, 70% and 30% of the total samples are used for training and testing the graph neural network.
For the configurations of the graph neural network, three graph convolution hidden layers are adopted with dimensions of 8, 4, and 2. The learning rate and learning epochs are set to 0.005 and 1000. To avoid over fitting, L2 regularization is used with a coefficient of 0.01. Consequently, the training accuracy and test accuracy versus the epochs are depicted in Figure 5.
It can be inferred from the training and test curves that the graph neural network converges with high train and test accuracy, which prove the applicability of the graph neural network to the fault propagation inference. Moreover, the fault propagation paths inference precisions on test samples for HP, IP and LP are listed in Table 1, Table 2 and Table 3, respectively.
It can be inferred from the three precision tables that the proposed model is reliable for fault propagation inference with respect to steam leakage and satisfies the requirement of industrial applications.
In addition, the average scores of the transition between fault nodes are listed in Table 4. The first row of the table represent the root cause of steam consumption increasing. The first column stands for the transition between nodes, that is, the fault propagation path. The total scores of row 2, row3, and row 4 in the table for each root cause is 1. And the sum of scores of row 5 and row 6 is 1. Moreover, the corresponding maximum score corresponds to the fault propagation path. For example, when the HP interstage gland has a leakage fault, and causing the steam consumption increasing, then the score of ’HP steam leakage→Steam consumption increasing’, together with ’Interstage gland→steam leakage’ are the maximum score, which means the fault propagation path is ’HP interstage gland→HP steam leakage→Steam consumption increasing’.
In addition, we simulate the leakage condition of different interstage gland leakage under the condition of 20% shaft gland leakage. The fault propagation inference accuracy are shown in Figure 6a. The minimum, average, and maximum accuracy all increase with the increase of leakage. This is because the more serious the fault is, the easier it is to be detected. Moreover, the results of different shaft gland leakage under the condition of 5% interstage gland leakage are illustrated in Figure 6b.
Moreover, apart from the qualitative analysis method, we compare the proposed graph model with principle component analysis (PCA) and multi-layer perceptron (MLP), regarding with the average accuracy under different interstage gland leakages and shaft gland leakages. The results are exhibited in Figure 7. Obviously, it can be concluded from the comparison of the three methods that the proposed graph model has the best average detection performance, PCA is slightly lower than the graph model, and MLP has the worst performance. The excellent performance of graph model is due to its strong ability of relationship representation, which can express the nonlinear relationship between the process and the equipment performance. PCA is more suitable for describing a linear relationship, and MLP does not characterize this kind of relationship.

5. Conclusion Remarks

In this study, the fault propagation inference for the steam turbine system is conducted utilizing graph neural network, combining with the graph link prediction technology. The scheme is mainly divided into three steps: constructing the process and fault graph topology according to steam turbine system mechanism, learning the representation of fault graph nodes using graph neural network, and predicting the fault graph edges, which indicate the fault propagation paths. The high prediction accuracy and low miss/false alarm rates all demonstrate the capability of the proposed method in inferring the fault propagation paths for the steam turbine system. Moreover, for other industrial systems, if the process and fault graph topology can be constructed properly, the proposed method must be a promising means of fault propagation inference.

Author Contributions

Conceptualization, L.-S.H. and Y.-J.Z.; methodology, Y.-J.Z.; software, Y.-J.Z.; validation, L.-S.H.; formal analysis, Y.-J.Z.; investigation, Y.-J.Z.; resources, L.-S.H.; data curation, L.-S.H.; writing—original draft preparation, Y.-J.Z.; writing—review and editing, L.-S.H.; visualization, Y.-J.Z.; supervision, L.-S.H.; project administration, L.-S.H.; funding acquisition, no funding. All authors have read and agreed to the published version of the manuscript.

Funding

This research received no external funding.

Institutional Review Board Statement

Not applicable.

Informed Consent Statement

Not applicable.

Acknowledgments

The authors would like to thank Xiaowei Zhou, a experienced engineer devoting decades to the area of system maintenance in a steam turbine company. He provided the work the practical faults faced during the operation of the turbine. In addition, Yi-Jing Zhang wants to thank, in particular, the patience, care and love from Ziyou Zhu over the passed months.

Conflicts of Interest

The authors declare no conflict of interest.

Abbreviations

The following abbreviations are used in this manuscript:
HPHigh Pressure Casing
ESVEmergency Shut Valve
CVControl Valve
IPIntermediate Pressure Casing
LPLow Pressure Casing
RHReheater
MLPmulti-layer perceptron
PCAprinciple component analysis

References

  1. Yang, F.; Xiao, D. Progress in root cause and fault propagation analysis of large-scale industrial processes. J. Control Sci. Eng. 2012, 2012. [Google Scholar] [CrossRef]
  2. Dibowski, H.; Holub, O.; Rojícek, J. Knowledge-based fault propagation in building automation systems. In Proceedings of the 2016 International Conference on Systems Informatics, Modelling and Simulation (SIMS), Riga, Latvia, 1–3 June 2016; pp. 124–132. [Google Scholar]
  3. Pearl, J. Causality; Cambridge University Press: Cambridge, UK, 2009. [Google Scholar]
  4. Bollen, K.A.; Long, J.S. Testing Structural Equation Models; Sage: New York, NY, USA, 1993; Volume 154. [Google Scholar]
  5. Robbins, M.W.; Fisher, T.J. Cross-correlation matrices for tests of independence and causality between two multivariate time series. J. Bus. Econ. Stat. 2015, 33, 459–473. [Google Scholar] [CrossRef]
  6. Friston, K.J.; Bastos, A.M.; Oswal, A.; van Wijk, B.; Richter, C.; Litvak, V. Granger causality revisited. NeuroImage 2014, 101, 796–808. [Google Scholar] [CrossRef] [PubMed] [Green Version]
  7. Bahmani-Oskooee, M.; Chang, T.; Ranjbar, O. Asymmetric causality using frequency domain and time-frequency domain (wavelet) approaches. Econ. Model. 2016, 56, 66–78. [Google Scholar] [CrossRef]
  8. Murari, A.; Peluso, E.; Gelfusa, M.; Garzotti, L.; Frigione, D.; Lungaroni, M.; Pisano, F.; Gaudio, P.; Contributors, J. Application of transfer entropy to causality detection and synchronization experiments in tokamaks. Nucl. Fusion 2015, 56, 026006. [Google Scholar] [CrossRef]
  9. Vesely, W.E.; Goldberg, F.F.; Roberts, N.H.; Haasl, D.F. Fault Tree Handbook; Technical Report; Nuclear Regulatory Commission: Washington, DC, USA, 1981. [Google Scholar]
  10. McDermott, R.; Mikulak, R.J.; Beauregard, M. The Basics of FMEA; SteinerBooks: Hudson, NY, USA, 1996. [Google Scholar]
  11. Ruijters, E.; Stoelinga, M. Fault tree analysis: A survey of the state-of-the-art in modeling, analysis and tools. Comput. Sci. Rev. 2015, 15, 29–62. [Google Scholar] [CrossRef] [Green Version]
  12. Kabir, S. An overview of fault tree analysis and its application in model based dependability analysis. Expert Syst. Appl. 2017, 77, 114–135. [Google Scholar] [CrossRef] [Green Version]
  13. Feili, H.R.; Akar, N.; Lotfizadeh, H.; Bairampour, M.; Nasiri, S. Risk analysis of geothermal power plants using Failure Modes and Effects Analysis (FMEA) technique. Energy Convers. Manag. 2013, 72, 69–76. [Google Scholar] [CrossRef]
  14. Safari, H.; Faraji, Z.; Majidian, S. Identifying and evaluating enterprise architecture risks using FMEA and fuzzy VIKOR. J. Intell. Manuf. 2016, 27, 475–486. [Google Scholar] [CrossRef]
  15. Kumru, M.; Kumru, P.Y. Fuzzy FMEA application to improve purchasing process in a public hospital. Appl. Soft Comput. 2013, 13, 721–733. [Google Scholar] [CrossRef]
  16. Andrews, J.; Moss, T. Risk and Reliability Assessment; John Wiley & Sons: Hoboken, NJ, USA, 1993. [Google Scholar]
  17. Meshkat, L. Probabilistic risk assessment for decision making during spacecraft operations. In Proceedings of the 2009 Annual Reliability and Maintainability Symposium, Forth Worth, TX, USA, 26–29 January 2009; pp. 140–145. [Google Scholar]
  18. Darbra, R.; Palacios, A.; Casal, J. Domino effect in chemical accidents: Main features and accident sequences. J. Hazard. Mater. 2010, 183, 565–573. [Google Scholar] [CrossRef] [PubMed]
  19. Yang, F.; Shah, S.; Xiao, D. Signed directed graph based modeling and its validation from process knowledge and process data. Int. J. Appl. Math. Comput. Sci. 2012, 22, 41–53. [Google Scholar] [CrossRef] [Green Version]
  20. Gawthrop, P.J.; Bevan, G.P. Bond-graph modeling. IEEE Control Syst. Mag. 2007, 27, 24–45. [Google Scholar]
  21. Zhang, Q.; Geng, S. Dynamic uncertain causality graph applied to dynamic fault diagnoses of large and complex systems. IEEE Trans. Reliab. 2015, 64, 910–927. [Google Scholar] [CrossRef]
  22. Liu, Y.K.; Wu, G.H.; Xie, C.L.; Duan, Z.Y.; Peng, M.J.; Li, M.K. A fault diagnosis method based on signed directed graph and matrix for nuclear power plants. Nucl. Eng. Des. 2016, 297, 166–174. [Google Scholar] [CrossRef]
  23. Wu, G.; Zhang, L.; Tong, J. Online Fault Diagnosis of Nuclear Power Plants Using Signed Directed Graph and Fuzzy Theory. In Proceedings of the 2017 25th International Conference on Nuclear Engineering, Shanghai, China, 2–6 July 2017; American Society of Mechanical Engineers Digital Collection: New York, NY, USA, 2017. [Google Scholar]
  24. Wu, G.; Liu, Y.; Peng, M.; Duan, Z.; Xie, C. Research on fault diagnosis based on SDG-QTA in nuclear power plant. At. Energy Sci. Technol. 2016, 50, 1467–1473. [Google Scholar]
  25. Yang, Z.; Zhang, C.; Liu, M.Z.; Yu, Y.; Qiao, L.; Peng, X. Fault propagation characteristics analysis for large-scale electronic system by hierarchical signed directed graph. In Proceedings of the 2015 IEEE Autotestcon, National Harbor, MD, USA, 2–5 November 2015; pp. 219–226. [Google Scholar]
  26. Smaili, R.; El Harabi, R.; Abdelkrim, M. Design of fault monitoring framework for multi-energy systems using Signed Directed Graph. IFAC-PapersOnLine 2017, 50, 15734–15739. [Google Scholar] [CrossRef]
  27. Borutzky, W. Bond Graphs for Modelling, Control and Fault Diagnosis of Engineering Systems; Springer: Berlin/Heidelberg, Germany, 2017. [Google Scholar]
  28. Dong, C.; Zhao, Y.; Zhang, Q. Assessing the influence of an individual event in complex fault spreading network based on dynamic uncertain causality graph. IEEE Trans. Neural Netw. Learn. Syst. 2016, 27, 1615–1630. [Google Scholar] [CrossRef]
  29. Dong, J.; Wang, M.; Zhang, X.; Ma, L.; Peng, K. Joint data-driven fault diagnosis integrating causality graph with statistical process monitoring for complex industrial processes. IEEE Access 2017, 5, 25217–25225. [Google Scholar] [CrossRef]
  30. Scarselli, F.; Gori, M.; Tsoi, A.C.; Hagenbuchner, M.; Monfardini, G. The graph neural network model. IEEE Trans. Neural Networks 2008, 20, 61–80. [Google Scholar] [CrossRef] [Green Version]
  31. Kipf, T.N.; Welling, M. Semi-supervised classification with graph convolutional networks. arXiv 2016, arXiv:1609.02907. [Google Scholar]
  32. Kipf, T.N.; Welling, M. Variational graph auto-encoders. arXiv 2016, arXiv:1611.07308. [Google Scholar]
  33. Battaglia, P.; Pascanu, R.; Lai, M.; Rezende, D.J.; Kavukcuoglu, K. Interaction networks for learning about objects, relations and physics. In Proceedings of the Advances in Neural Information Processing Systems, Barcelona, Spain, 5–10 December 2016; pp. 4502–4510. [Google Scholar]
  34. Duvenaud, D.K.; Maclaurin, D.; Iparraguirre, J.; Bombarell, R.; Hirzel, T.; Aspuru-Guzik, A.; Adams, R.P. Convolutional networks on graphs for learning molecular fingerprints. In Proceedings of the Advances in Neural Information Processing Systems, Montreal, QC, Canada, 7–12 December 2015; pp. 2224–2232. [Google Scholar]
  35. Wu, Z.; Pan, S.; Chen, F.; Long, G.; Zhang, C.; Yu, P.S. A comprehensive survey on graph neural networks. arXiv 2019, arXiv:1901.00596. [Google Scholar] [CrossRef] [PubMed] [Green Version]
  36. Zhou, J.; Cui, G.; Zhang, Z.; Yang, C.; Liu, Z.; Wang, L.; Li, C.; Sun, M. Graph neural networks: A review of methods and applications. arXiv 2018, arXiv:1812.08434. [Google Scholar]
  37. Kurtoglu, T.; Tumer, I.Y. A graph-based fault identification and propagation framework for functional design of complex systems. J. Mech. Des. 2008, 130. [Google Scholar] [CrossRef]
  38. Schlichtkrull, M.; Kipf, T.N.; Bloem, P.; Van Den Berg, R.; Titov, I.; Welling, M. Modeling relational data with graph convolutional networks. In Proceedings of the European Semantic Web Conference, Crete, Greece, 3–7 June 2018; Springer: Berlin/Heidelberg, Germany, 2018; pp. 593–607. [Google Scholar]
  39. Yang, B.; Yih, W.t.; He, X.; Gao, J.; Deng, L. Embedding entities and relations for learning and inference in knowledge bases. arXiv 2014, arXiv:1412.6575. [Google Scholar]
  40. Golinkin, S.; Lipski, M.; Luker, J.; Al-Jaafari, R. Modernization of Steam Turbine Diaphragms for the Saudi Aramco Gas Plants. In Proceedings of the Middle East Turbomachinery Symposia, Doha, Qatar, Texas A&M Engineering Experiment Station, College Station, TX, USA, 13–16 February 2013. Turbomachinery Laboratory. [Google Scholar]
  41. Kirk, R.; Gao, R. Analysis of rotordynamic forces for high inlet pre-swirl rate labyrinth seals. In Proceedings of the 10th International Conference on Vibrations in Rotating Machinery, London, UK, 11–13 September 2012; Woodhead Publishing: Cambridge, UK, 2012; pp. 467–476. [Google Scholar] [CrossRef]
  42. Xu, J. Effects of Operating Damage of Labyrinth Seal on Seal Leakage and Wheelspace Hot Gas Ingress. Ph.D. Thesis, Texas A&M University, College Station, TX, USA, 2007. [Google Scholar]
  43. Xia, B. On Modeling and Safety Analysis of Large Size Ultra Supercritial Steam Turbines. Master’s Thesis, Shanghai Jiao Tong University, Shanghai, China, 2015. [Google Scholar]
Figure 1. Fault propagation graph.
Energies 14 00309 g001
Figure 2. Fault propagation scheme based on graph neural network.
Energies 14 00309 g002
Figure 3. Process graph and fault propagation graph for steam turbine systems.The process graph contains 18 physical variables of steam turbine, and different colored nodes and edges represent different relationships. There are three layers in the fault graph, which respectively show the gland fault, the steam leakage and the steam consumption rate rise.
Energies 14 00309 g003
Figure 4. Interstage glands of the steam turbine.
Energies 14 00309 g004
Figure 5. Train and test accuracy curves for the graph neural netwrok.
Energies 14 00309 g005
Figure 6. Fault propagation accuracy under different steam leakage.
Energies 14 00309 g006
Figure 7. Average accuracy comparison of graph model, PCA and MLP.
Energies 14 00309 g007
Table 1. High pressure (HP) fault propagation inference precisions.
PathHP Interstage GlandHP Shaft GlandHP Steam Leakage
→HP Steam Leakage→HP Steam Leakage→Steam Consumption Increase
Accuracy/%88.4686.9697.91
Miss alarm rate/%11.5413.042.09
False alarm rate/%13.0411.542.08
Table 2. Intermediate pressure (IP) fault propagation inference precisions.
PathHP Interstage GlandHP Shaft GlandHP Steam Leakage
→HP Steam Leakage→HP Steam Leakage→Steam Consumption Increase
Accuracy/%97.6297.6299.49
Miss alarm rate/%2.3800.51
False alarm rate/%02.383.26
Table 3. Low pressure (LP) fault propagation inference precision.
PathlP Interstage GlandLP Shaft GlandLP Steam Leakage
→LP Steam Leakage→LP Steam Leakage→Steam Consumption Increase
Accuracy/%96.0896.0899.47
Miss alarm rate/%03.920.53
False alarm rate/%3.9201.01
Table 4. Average scores of the transition between fault nodes.
Fault Root Cause of Steam
Consumption Increasing
HP Interstage
Gland
HP Shaft
Gland
IP Interstage
Gland
IP Shaft
Gland
LP Interstage
Gland
LP Shaft
Gland
HP steam leakage→
Steam consumption increasing
0.870.920.100.100.110.01
IP steam leakage→
Steam consumption increasing
0.080.040.880.850.120.05
LP steam leakage→
Steam consumption increasing
0.150.040.020.050.770.94
Interstage gland→
steam leakage
0.980.160.930.010.890.17
Shaft gland→
steam leakage
0.020.840.070.990.110.83
Publisher’s Note: MDPI stays neutral with regard to jurisdictional claims in published maps and institutional affiliations.

