Article

A Study on the Numerical Performances of Diffuse Interface Methods for Simulation of Melting and Their Practical Consequences

by
Andreas König-Haagen
1,2,*,
Erwin Franquet
3,
Moritz Faden
1 and
Dieter Brüggemann
1
1
Chair of Engineering Thermodynamics and Transport Processes (LTTT), Center of Energy Technology (ZET), University of Bayreuth, 95440 Bayreuth, Germany
2
ENEDI Research Group, Faculty of Engineering of Bilbao, University of the Basque Country UPV/EHU, 48013 Bilbao, Spain
3
Polytech’Lab, Université Côte d’Azur, 06200 Nice, France
*
Author to whom correspondence should be addressed.
Energies 2021, 14(2), 354; https://doi.org/10.3390/en14020354
Submission received: 16 November 2020 / Revised: 15 December 2020 / Accepted: 23 December 2020 / Published: 11 January 2021
(This article belongs to the Special Issue Numerical Simulation of Convective Heat Transfer)

Abstract

:
This work is the final one in a series of three papers devoted to shedding light on the performance of fixed grid methods, also known as enthalpy methods, for the modeling and the simulation of solid/liquid phase transition. After a detailed analysis of five of the most common enthalpy methods for conductive-dominated and conductive-convective problems and then a study concerning the formulation of the advective term in the energy balance equation, the aim of the present paper is to extend the above-mentioned studies by an investigation of the numerical performance. Such a goal is achieved by comparing the required iterations and, even if it is shown to be only a rough guide, the simulation time of each method, for a great variety of parameter variations. In terms of contribution, the main conclusions of this overall work are to demonstrate that almost all solvers give similar results when stable. However, there are still distinctive deviations with the experiments, highlighting the need for a proper validation experiment. The second important assessment concerns resilience: almost all solvers work well, with only the applied apparent heat capacity method being the major exception as it often leads to unrealistic results. As a rule of thumb, models are more resilient when only the sensible enthalpy is advected. As far as the average of the required iterations is concerned, the so-called optimum approach needs the least. The order of the other solvers depends on the advective formulation, whereas source-based methods perform averagely and the tested apparent heat capacity method poorly. Cases with only sensible enthalpy advected need fewer iterations for four of the five solvers and less computational time for all solvers.

1. Introduction

Since energy storage and more specifically thermal energy storage (TES) is going to play a significant role in the future energy transition, from the current paradigm to a more sustainable one, the use of numerical simulations for the design, management or reverse engineering of such technologies should be more and more widespread. Among the various available TES —an overview can be found in [1]—latent heat thermal energy storage (LHTES) appears as an interesting candidate. However, it involves solid/liquid phase change phenomena whose modeling is known to be tricky, despite the attention of many researchers [2,3,4,5,6].
Surprisingly enough and contrary to many other fields, e.g., turbulent or compressible flows, the level of validation of such modelings remains undeniably low [7,8]. Thus, for natural convection dominated solid/liquid transition, benchmarks or validation exercises (on a rigorous numerical basis) remain scant, be it for melting [7,9,10,11] or for solidification [8,12,13]. Conductive-dominated situations apart, which are presented in [6], the first real attempt to compare different methods for the modeling of fusion was proposed by Lacroix and Voller [9]. The prediction of the interface position was investigated, with a transformed grid method and a fixed grid method. Then, Viswanath and Voller [10] extended this work for studying solidification of tin and fusion of gallium. The front positions were compared, as well as the experimental and numerical liquid temperatures at three different heights. Nonetheless, despite having the primacy, the previous studies were limited for two important reasons: (i) the comparisons were mainly qualitative; and (ii) the varied parameters or conditions were too few to allow for general conclusions. Since then, a very large effort has been made by several groups gathered in an international program to tackle the first issue. Thus, two major contributions were performed by Bertrand et al. [11] and Gobin et al. [7] to propose a benchmark for the simulation of two materials (with low and high Prandtl numbers, i.e., tin and octadecane). In each case, two Rayleigh numbers were investigated. Despite being purely numerical, these tests were systematically reviewing the temporal evolution of the average Nusselt number and of the liquid fraction, while interface positions were screened at four different times. To the best of the authors’ knowledge, this was the first time that dispersion between the results was studied from a quantitative point of view. Similarly, for solidification processes, a quantitative comparison of FEM and FVM was first performed by Ahmad et al. for Pb-Sn alloys [12] and then extended into a benchmark for columnar solidification of another Pb-Sn alloy by Combeau et al. in a larger international group [8]. In both cases, deviations between the numerical results and behavioral differences were systematically analyzed and comparison with experiments was performed. Despite the large efforts made, these works have shown that, even if rather high agreement was generally observed (with some minor exceptions), there were still notable caveats that hampered the reliability and confidence in the numerical codes. To summarize, this drawback principally lies in the liquid region, in the vicinity of the interface. For example, once discarded the unrealistic results, the best agreement for the interface location was only ± 15 % for fusion of gallium [7]; similarly, the number of channels and the intensity of segregation inside could vary greatly [8]. More recently, the authors continued this work for melting in presence of natural convection [6]. Thus, they studied five different formulations of the energy equation and performed as well an exhaustive analysis of several parameters. Following the advice raised in the conclusions of Bertrand et al. [11] and Gobin et al. [7], convergence and accuracy of the methods were analyzed, together with grids and time steps dependency, respectively. At the same time, the pure conduction limit was investigated. In addition, the same group extended this work to consider the role of the convective term (for the enthalpy) involved in the energy equation [14].
As mentioned above, numerical performances of the aforementioned models have not raised so much attention [9,15,16], although it is clear that speed will be a paramount factor when performing such simulations. In the former case, transformed grid methods and fixed grid methods were finally said to be comparable when large time steps are used; for lower time steps, the fixed grid methods use less computational time. In the latter one, the comparison is more limited since only the energy equation is solved, convection being handled by an effective thermal heat conductivity approach. Unfortunately, this is possibly a limiting flaw since calculation costs seem to be highly correlated with the interaction of the melt with the liquid zone [7]. Furthermore, the comparisons proposed are also done with different computers and with various implementations of different methods, e.g., Matlab optimized code with an enthalpy or source term method against a non-optimized in-house C++ code for a heat capacity method. Finally, when using a coarse grid, Swaminathan and Voller showed that the source-term method was rather slow for isothermal phase change but also that an optimal formulation could limit these caveats [15].
In the sequel of these preliminary studies, the main goal of the present work is to further improve the analysis of the five fixed grid methods (all iterated until convergence) studied by the authors earlier [6,14]. After the detailed assessment of their results with each other and experimental results, their numerical performances is handled in the current contribution. Since most of the solvers provide similar results, a comparison of the numerical performance helps the user to select a solver and the convection term formulation for his case. For each of the five enthalpy methods, two formulations for the enthalpy convecting term, with either all enthalpy (AE) or only sensible enthalpy (SE), are considered. Eventually, an exhaustive numerical experiment plan is considered once again, with variations of several main parameters.
The paper is organized as follows. The physical and numerical modeling are presented in Section 2 and the retained test case for the benchmark is described in Section 3. Then, Section 4 and Section 5 are devoted to the presentation of the entire set of results, together with the associated discussions as well as the practical consequences. Lastly, some final conclusions and perspectives are discussed in Section 6.

2. Problem Statement

2.1. Flow Modeling

In the sequel of the aforementioned studies [6,14], this study concerns laminar incompressible flows of Newtonian fluids, under the Boussinesq approximation. The canceling of the solid velocity is achieved by the classic Darcy approach, which adds a damping term in the momentum equation [17,18,19,20,21]. The fluid motion equations are as follows:
· V = 0
ρ V t + V · V = P + · μ V A V + ρ β T T ref g
where A denotes the porosity function, which follows a Carman–Kozeny type relation:
A = C 1 α l 2 α l 3 + q
Concerning the values of the porosity function, its parameters are set to C = 9.7488 × 10 9 k g m 3 s 1 which is the value of Brent et al. [21] times the density and q = 10 3 [6,14].

2.2. Thermal Modeling

Here, five different formulations are tested. Two of them are based on enthalpy formulations, while the others are temperature formulations. In all cases, it is assumed that viscous dissipation and pressure works are negligible. Moreover, for all the various formulations, two cases are considered: either all the enthalpy (AE) or only the sensible enthalpy (SE) is convected [14].
The energy equation being somehow written in terms of the temperature, the equation of state, i.e., the thermodynamical behavior of the material, must be defined. To be as general as possible, both pure substance and mixture behaviors are considered. In this latter case, it is nevertheless assumed that a linear variation holds for the enthalpy–temperature relation during the phase change. In summary, the enthalpy function follows the profiles depicted in Figure 1.
Given the previous remarks, the energy equation will be written under five different ways, with two supplementary variations each time. The associated taxonomy is based on the one used in the former papers [6,14]. All methods are corrected and iterated until the change in the liquid fraction was less than 10 6 in consecutive iterations. Here, only a brief description of the solvers is given. More details can be found in the work of König-Haagen et al. [14].
  • Happarent solver [22,23] corresponds to the usual energy equation, written either for AE (Equation (4a)) or for SE (Equation (4b)):
    ρ h t + V · h = · λ T
    ρ h t + c V · T = · λ T
  • Hsource solver [24] relies on writing Fourier’s law in terms of the enthalpy, which leads to the following variants for AE (Equation (5a)) and SE (Equation (5b)):
    ρ h t + V · h = · λ c h λ c L Δ α l
    ρ h t + c V · T = · λ c h λ c L Δ α l
  • Tapparentlinear solver uses a modified specific capacity to take into account the latent effects. AE (Equation (6a)) and SE (Equation (6b)) cases lead to:
    ρ c app T t + V · h = · λ T
    ρ c app T t + c V · T = · λ T
    In Equation (6a), the enthalpy is used in the convective term as a formulation with the temperature and the apparent heat capacity leading to an unstable behavior [6]. Among the variable possibilities, the expression for the apparent heat capacity is the one of Morgan et al. [25]:
    c app = h n h n 1 T n T n 1
  • Tlinear solver [26] is based on Equations (4a) and (4b) and uses a Taylor expansion of enthalpy. This results in a correction directly on the enthalpy/temperature curve with an apparent heat capacity corresponding to the old iteration step.
  • Tsource solver [27] is based on the splitting of the enthalpy into its sensible and latent parts and becomes Equations (8a) and (8b) for AE and SE respectively.
    ρ c T t + V · T = · λ T ρ L α l t + V · α l
    ρ c T t + V · T = · λ T ρ L α l t

2.3. Numerical Implementation

Calculations are done with OpenFOAM 2.2.2, a finite-volume method open source CFD code [28]. Since we deal with incompressible Navier–Stokes equations, the classic PISO-SIMPLE algorithm is used for the pressure–velocity coupling. Convective and diffusive fluxes are computed with upwind and linear schemes and Euler implicit integration is taken for the time. Interested readers are referred to [6,14] for more details, especially the discrete formulations and their OpenFOAM implementation.

2.4. Threshold and Evaluation

A filter is used to exclude crashed simulations and simulations with clearly wrong results that would influence the evaluation of the numerical performance. For this purpose, upper and lower thresholds of the final liquid fraction are introduced and simulations with results outside the thresholds are not considered in the performance evaluation. Based on the results of resilient solvers, the thresholds were set to 60% and 70%. It is important to note that a fully mesh-independent solution can lie outside these thresholds. Therefore, these thresholds should only be seen as a guide for the parameters used in this study.
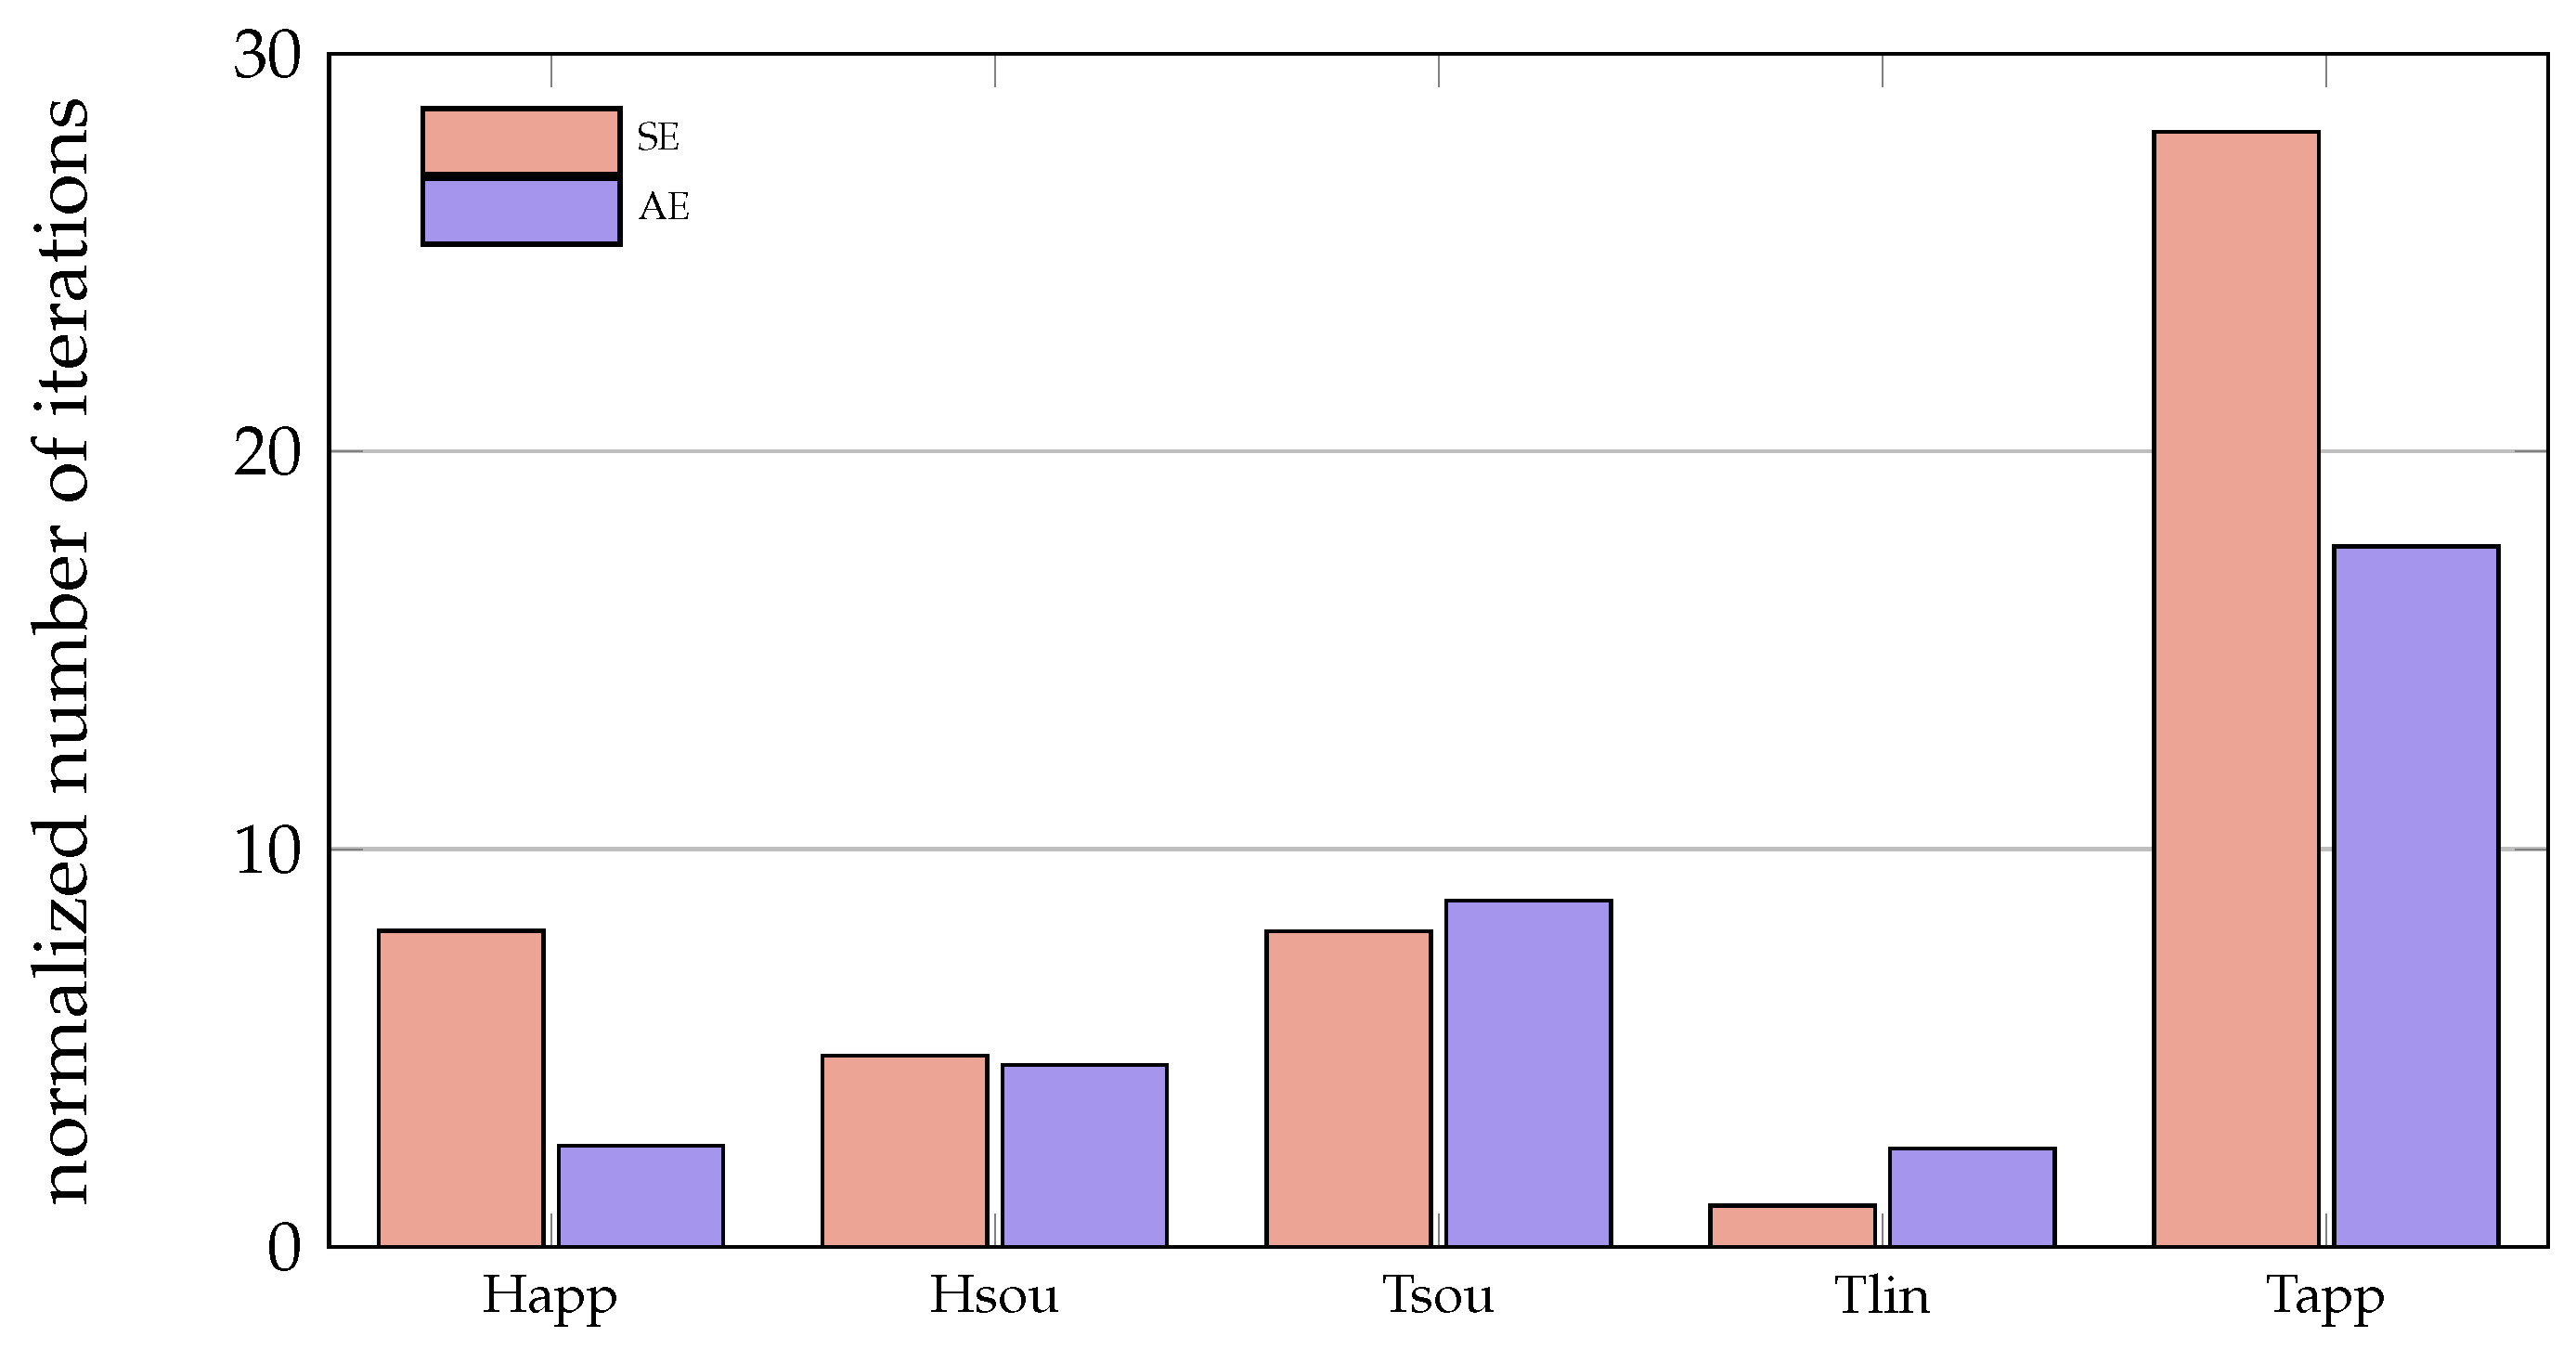
Within this paper, the number of iterations required is also presented. Here, the difficulty arises that the results of simulations with many iterations dominate those with fewer iterations (e.g., with fine and coarse grids). For this reason, the iterations are also given in normalized form. Thereby, the normalization is always related to the solver with the fewest iterations per parameter combination.

3. Test Case

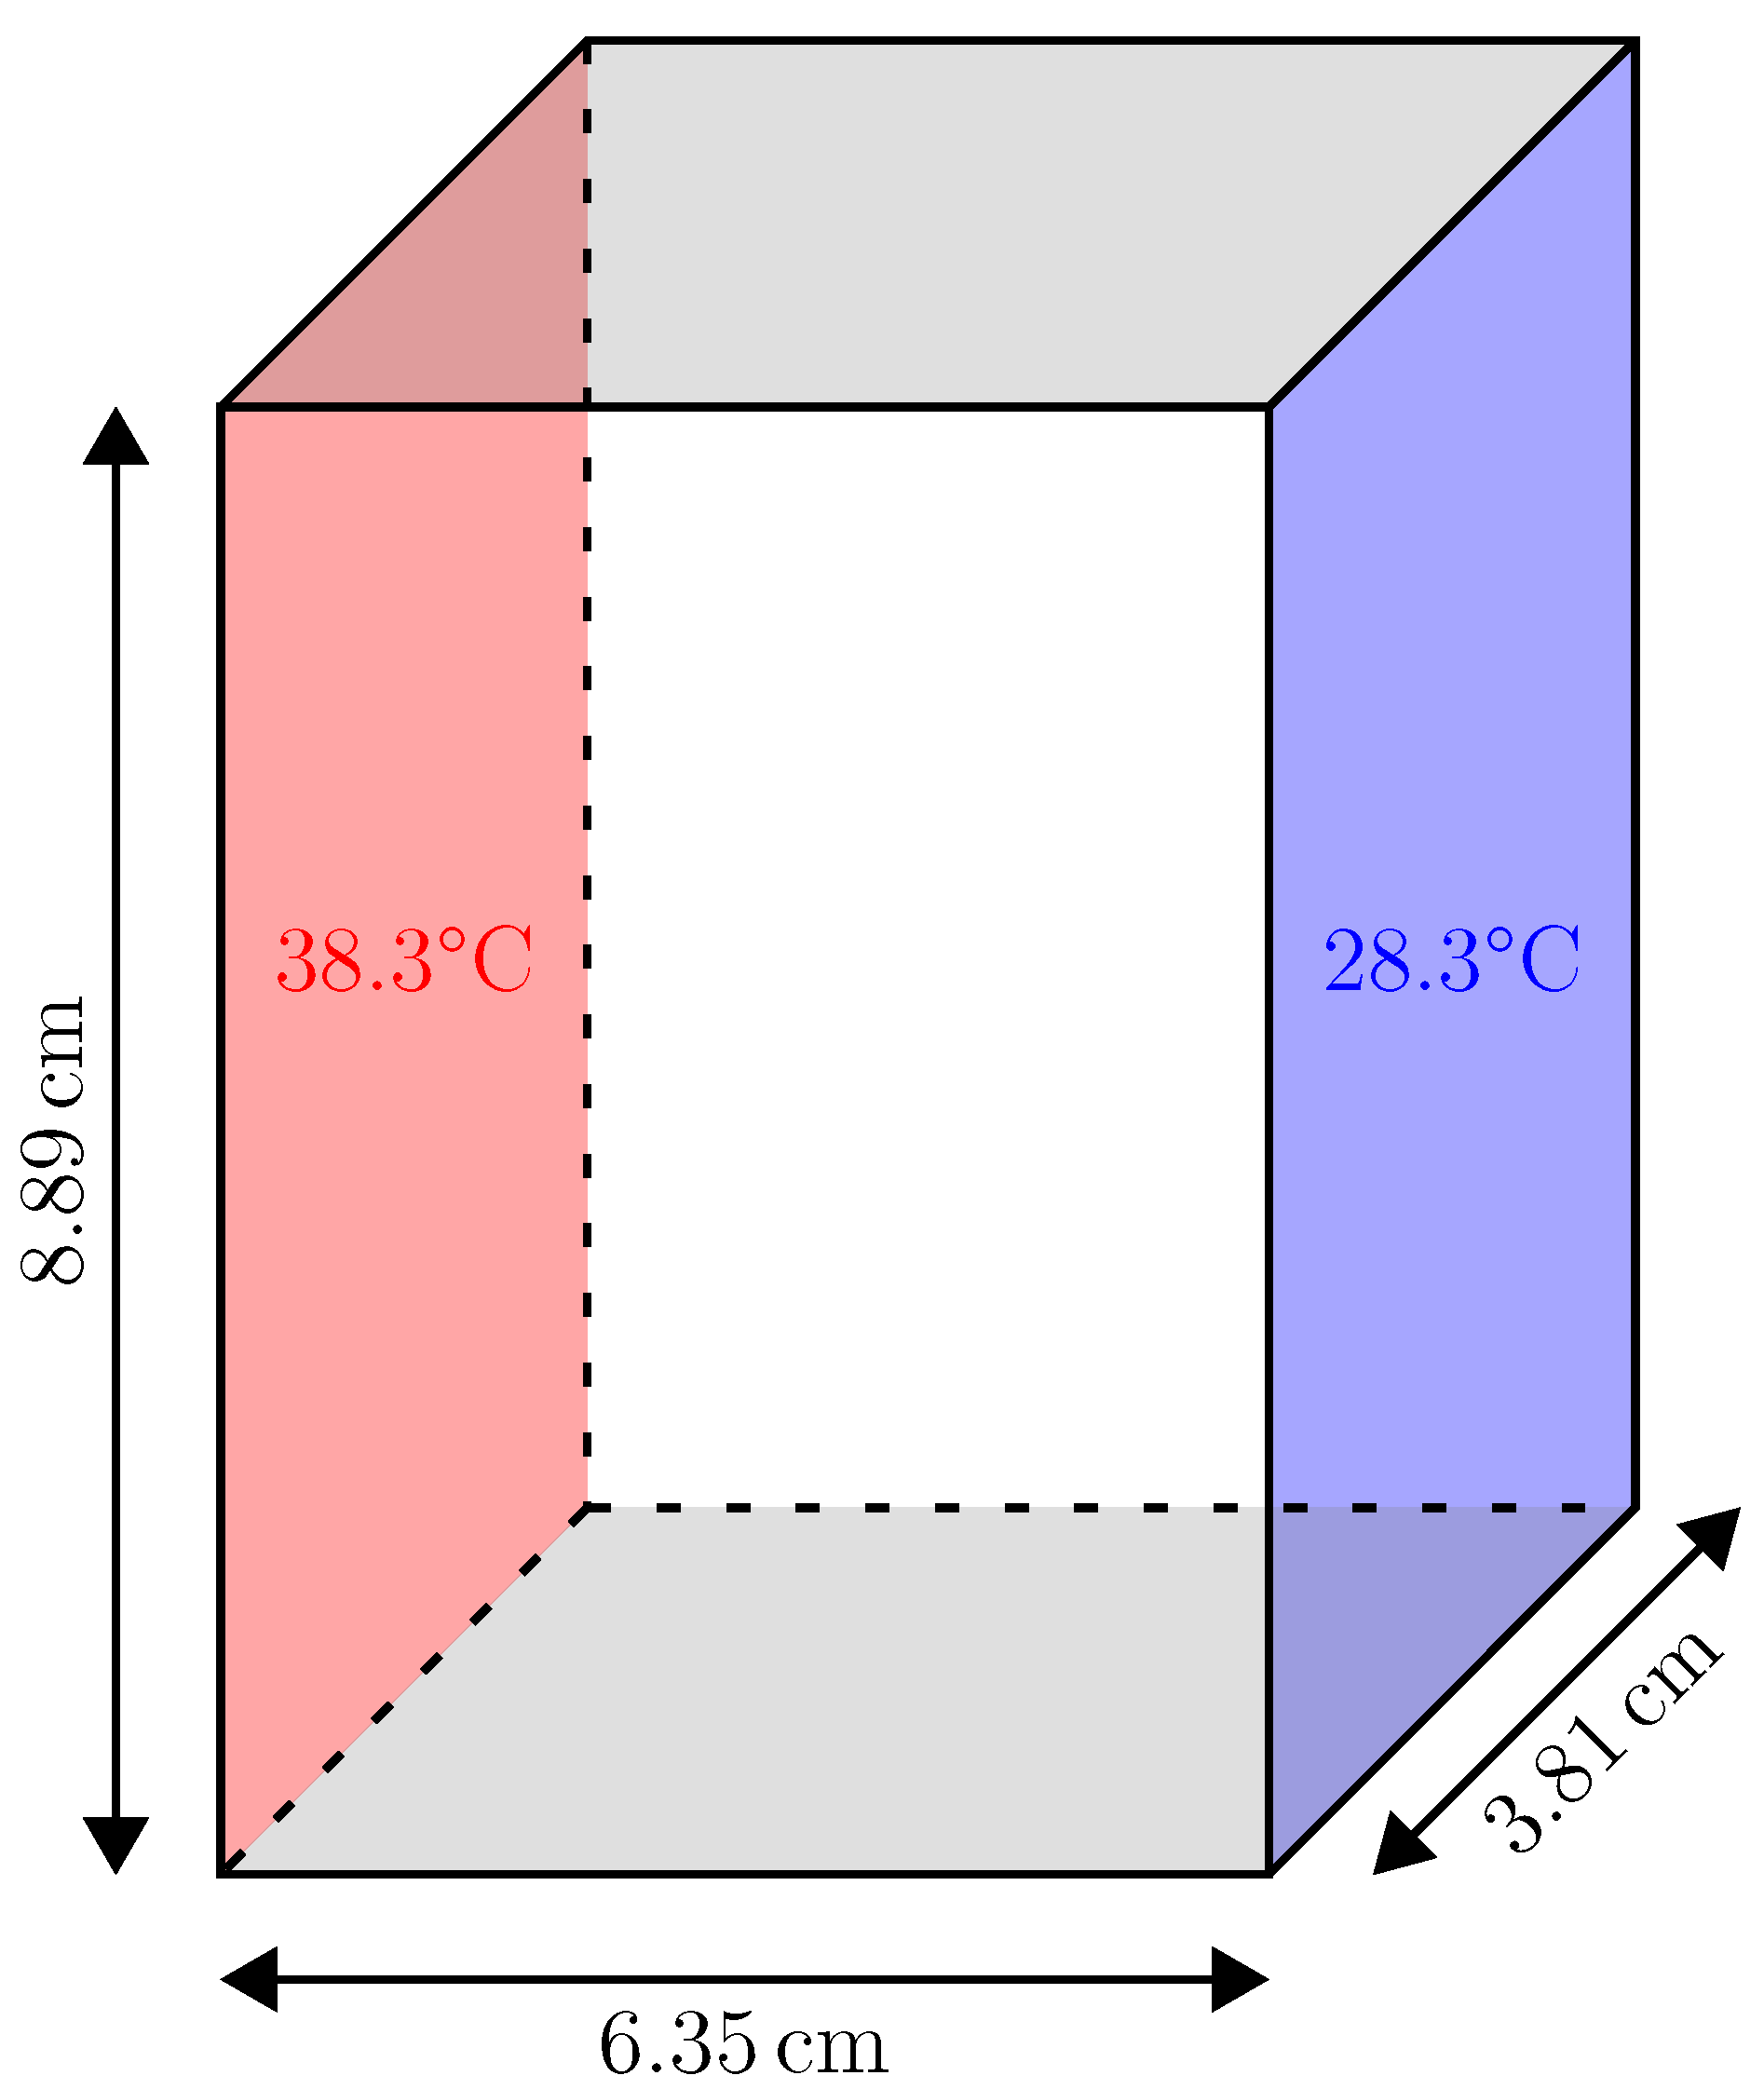
In the same way as the previous studies [6,14], the present benchmark deals with the fusion of gallium in a rectangular cavity ( 8.89   c m × 6.35   c m × 3.81   c m ), heated and cooled on its left and right parts, respectively (other walls being adiabatic) [29]. The corresponding setting temperatures are T h = 38.0   ° C and T c = 28.3   ° C . The setup is shown in Figure 2. Initially, the temperature is fixed at 28.3   ° C in the entire domain. To perform the current simulations, the adopted thermophysical properties for gallium, based on literature review [6], are those summarized in Table 1. C = 9.7488 × 10 9 k g   m 3   s 1 q = 10 3 [6,14].
The underrelaxation factor for updating the temperature or enthalpy is initially set to 1.0 for every simulation and divided by ten when required, i.e., when convergence was not reached. Then, the simulation is restarted with the new underrelaxation factor. Besides, a structured mesh with equidistant cell length is used. Finally, the parameters and their variations within this work are given in Table 2. This analysis thus involves more than 2000 simulations. This simulations were performed on a workstation with two Intel(R) Xeon(R) CPU E5-2643 v2 @ 3.50 GHz. About 20 simulations were run in parallel; however, the number fluctuated, especially towards the end of a set of simulations. Therefore, long running simulations were more likely to run in parallel with fewer other simulations.

4. Results

An overview of which simulations are affected by the chosen threshold (see Section 2.4) is shown in Table 3 in Section 4.1 and subsequently the performance of the different solvers is presented. Here, the results are shown starting with the number of required iterations and ending with the vague computational time and the required underrelaxation. For a more detailed evaluation of the liquid fraction and a representation of the phase front profile, the reader is referred to our previous publications [6,14].

4.1. Summary of the Liquid Fraction Evaluation

Only Hsource-AE, Hsource-SE and Tlinear-SE provide results within the thresholds for all parameter combinations (Table 3). On the contrary, for Tapparentlinear-AE and -SE, a large part of calculations is always disregarded. The other methods lie between these, although distinctly closer to the resilient ones. In addition, more simulations are disregarded for AE than for SE.

4.2. Total Iterations

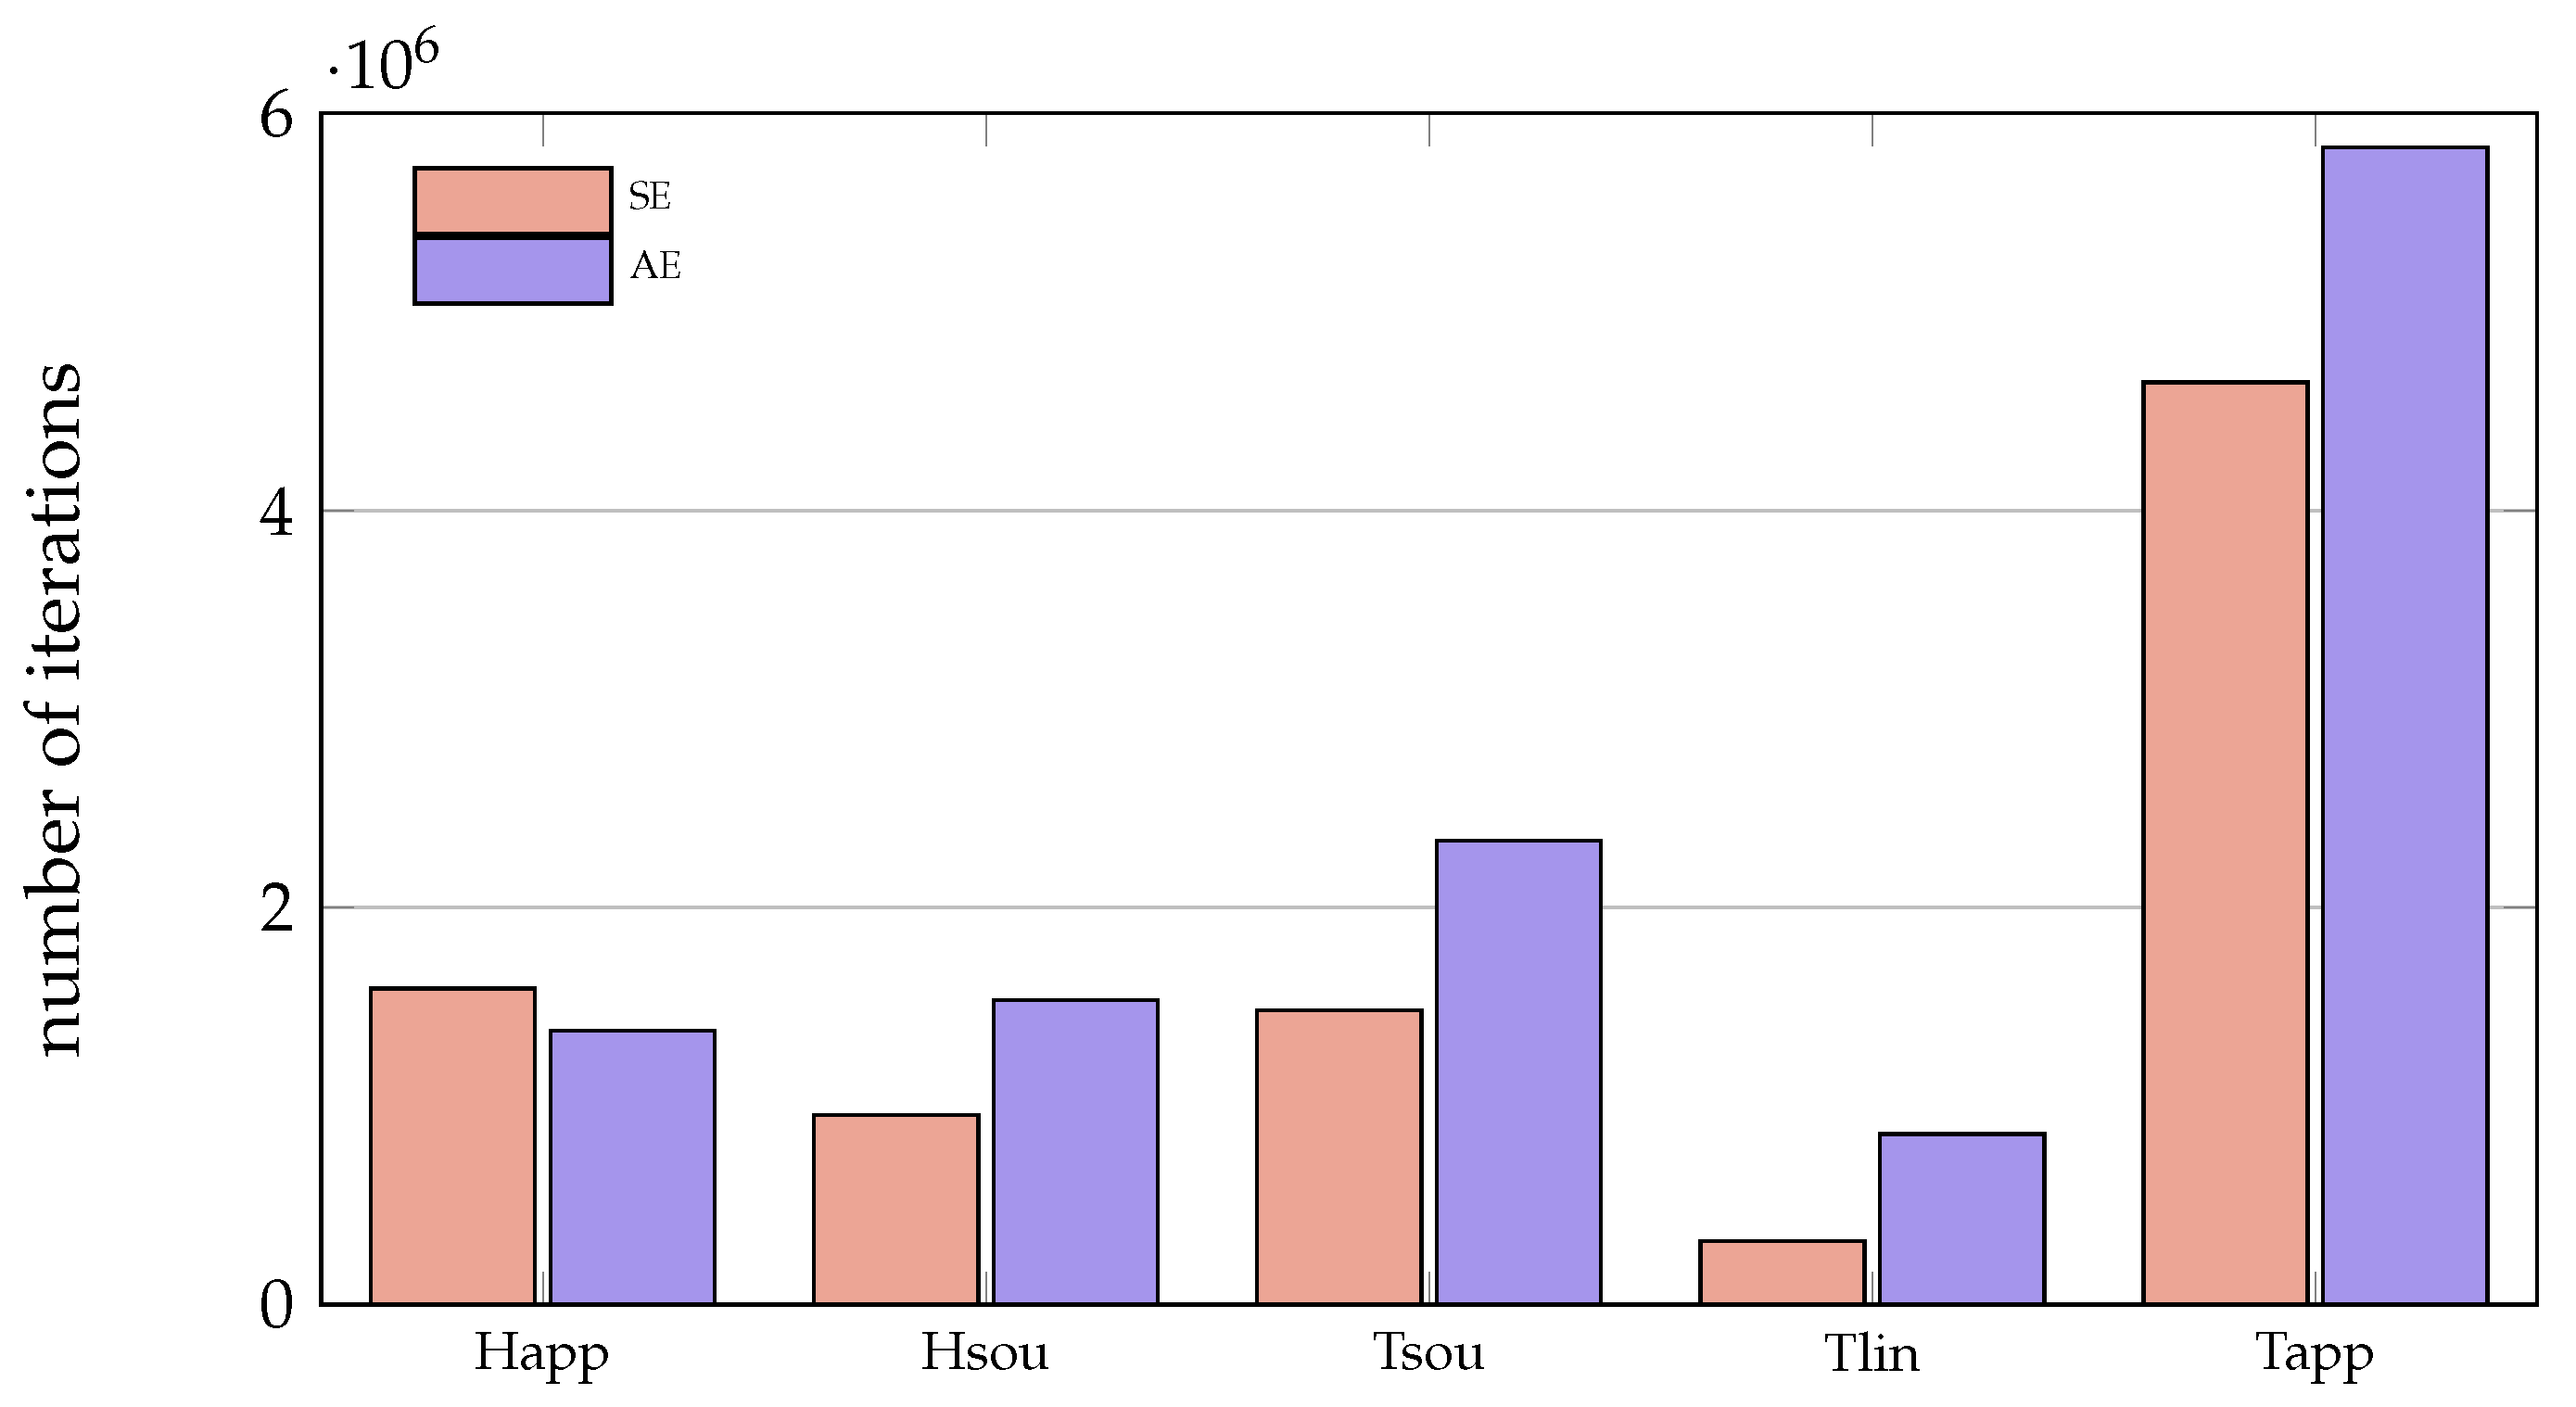
The most important results for the number of required iterations are as follows (Figure 3):
  • On average, SE needs fewer iterations than AE except for Happarent where AE needs slightly fewer than SE.
  • The differences between the minimum and the maximum number of iterations within one solver, but for different parameter combinations are between one and two orders of magnitude.
  • For SE, the ranking is in ascending order: Tlinear, Hsource, Tsource, Happarent, Tapparentlinear.
  • For AE, the ranking is in ascending order: Tlinear, Happarent, Hsource, Tsource, Tapparentlinear.
On average, both Tlinear formulations require fewer iterations than any other solver and Tlinear-SE—which had about 0.32 × 10 6 iterations on average—needs less than 50% of the iterations of Tlinear-AE. Tapparentlinear needs on average ( 4.65 × 10 6 for SE and 5.83 × 10 6 for AE) more than twice as many iterations than the solver with the second most iterations, whatever the regarding convective formulation. The results for the normalized iterations (the procedure is explained in Section 2.4) are depicted in Figure 4 and Table 4. When analyzing these values, one has to keep in mind that, for Tlinear and Tapparentlinear, the normalizing and averaging were performed for six different mushy zone widths instead of three. Therefore, the comparison of all five solvers together is best done for a mushy zone width of 2 K , 0.2 K or 0 K . Again Tlinear-SE shows the best performance, followed by Happarent-AE and Tlinear-AE. For SE as well as AE, Tapparentlinear performs by far the worst.
The influence of the time step on the average number of iterations is depicted in Figure 5a. In general, a smaller time step leads to more iterations, except for Happarent-SE and Tlinear-SE. Apart from Happarent-SE and Tapparentlinear-SE the influence of the time step is rather small. The tolerance has only a small influence on Happarent-SE, Tlinear and Tapparentlinear-SE. A tighter tolerance increases the number of iterations for Happarent-AE and Hsource and decreases the number of iterations for Tsource and Tapparentlinear-AE (Figure 5b). In general, a smaller CFL results in more iterations, except for Hsource-AE and Tlinear. For Hsource, Happarent-AE and Tsource-SE, the influence is minor (Figure 5c).
For all solvers, a finer mesh leads to a lot of more iterations (Figure 5d). On average, a larger Δ T requires fewer iterations for all solvers. Only with Tlinear-SE there is almost no influence of Δ T on the iterations and for Tapparentlinear-SE there is an exception for 2 K (Figure 5e).

4.3. Iterations per Time Step

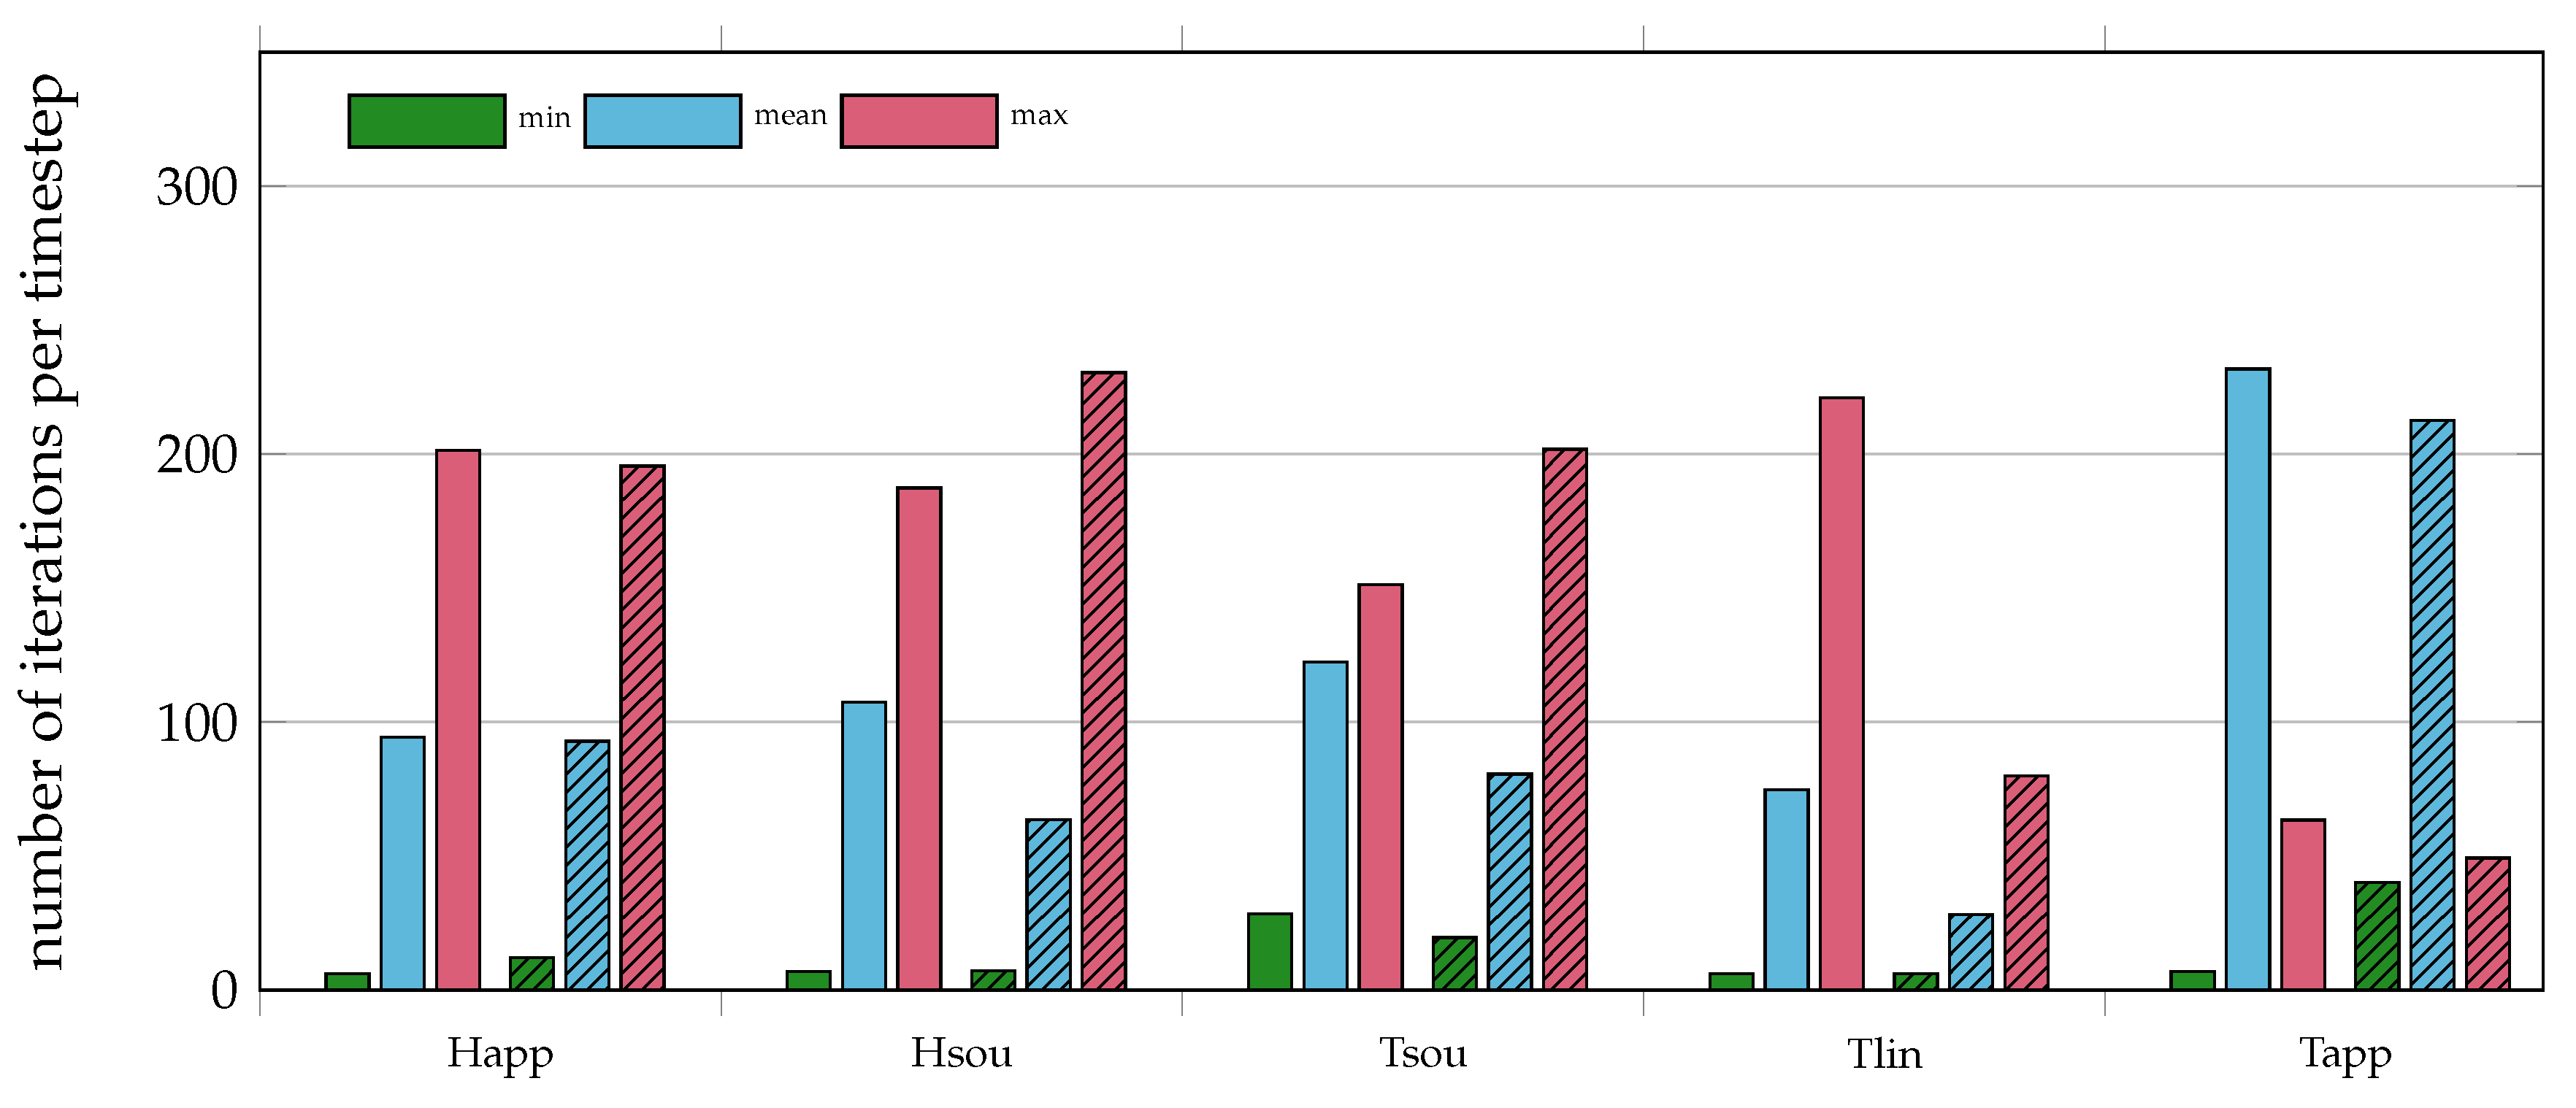
The min, mean and max of the iterations needed per time step can be seen for all solvers and convective formulations in Figure 6.
For the mean values, the overall picture is very similar to the one of the total number of iterations. Shifts should only occur when simulations are not considered due to the threshold. In general, SE requires on average fewer iterations per time step than AE, except for Happarent and Tapparentlinear, where slightly more iterations are needed. Tlinear-SE needs the fewest iterations per time step (34.1 on average), followed by Hsource-SE (70.7 on average) and Tlinear-AE (80.7 on average). Tapparentlinear needs more than 235 iterations per time step on average and the remaining solvers require about 100–150 iterations accordingly. Since there are two external iterations with at least 3 and at most 151 internal iterations each, the theoretical minimum of iterations per time step is 2 × 3 iterations and the theoretical maximum is 2 × 151 iterations. All solvers except Tlinear-SE need at least once more than 300 iterations per time step and all solvers except for Happarent-AE, Tsource and Tapparentlinear-AE obtain at least once close to the minimum of six iterations per time step.

4.4. Computational Time

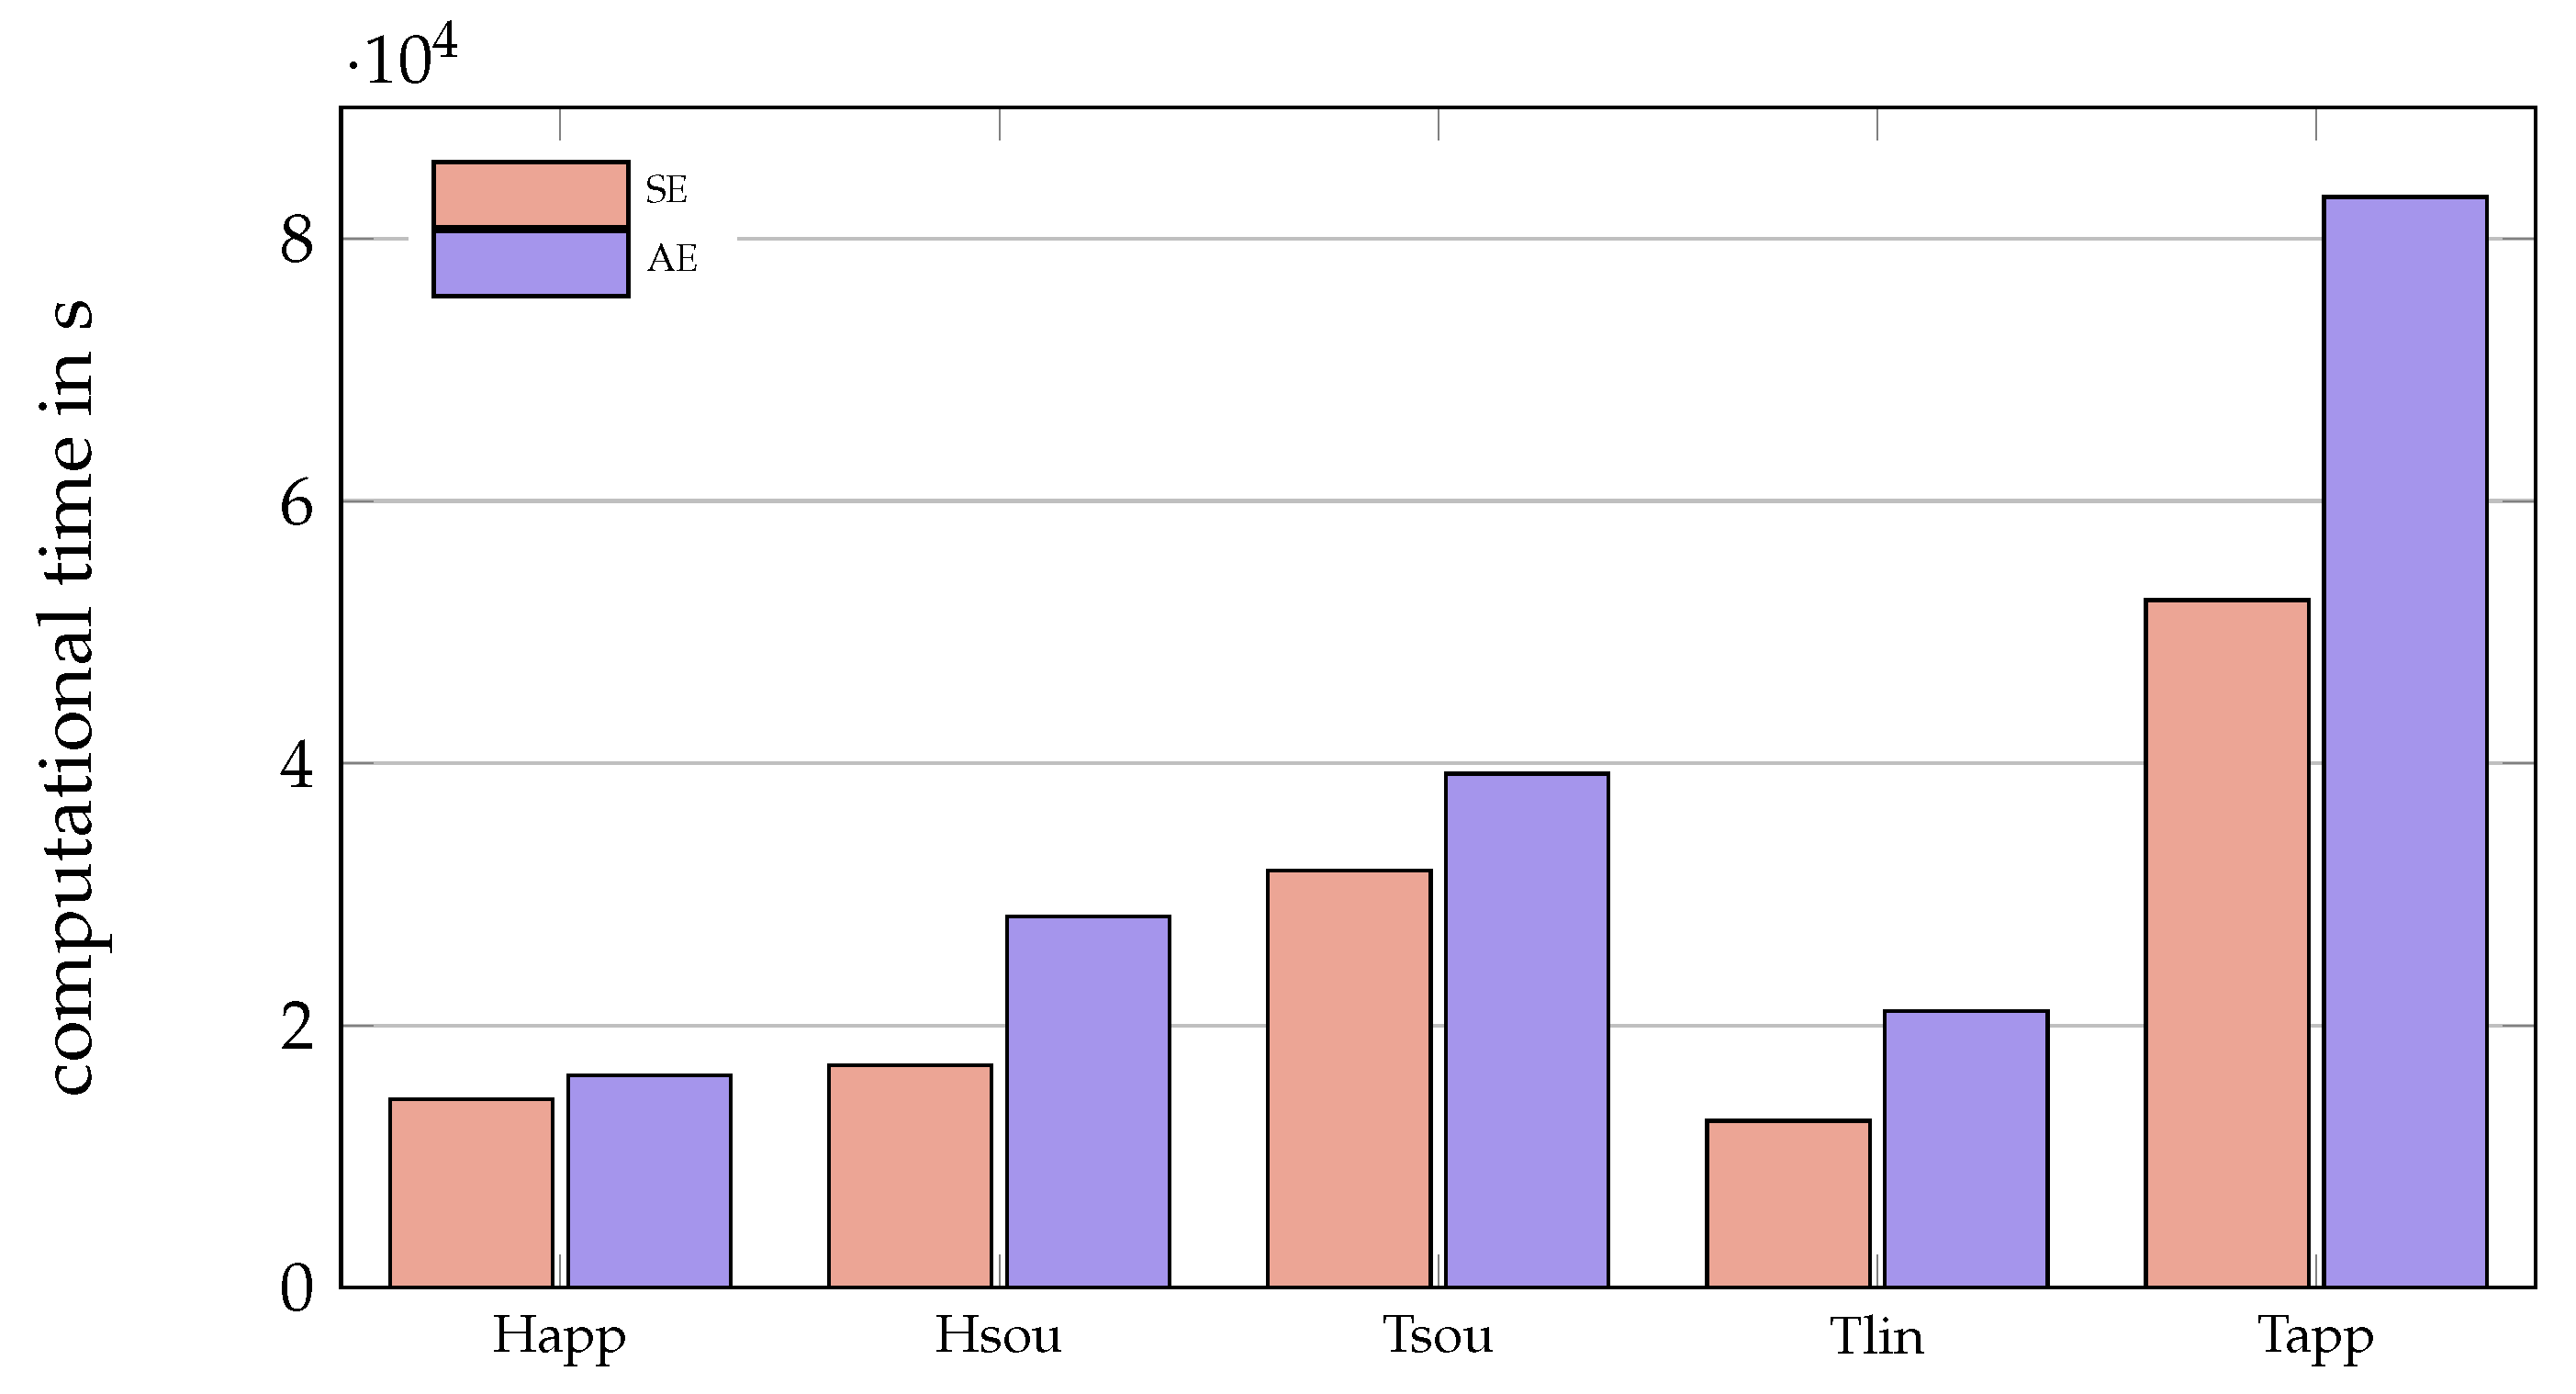
The mean computational time needed for one simulation can be seen for all solvers and convective formulations in Figure 7. Comparing the computational time is very vague due to at least the following reasons. First, the simulations were run in parallel with a slightly varying number of parallel simulations. Second, the implementation and the hardware affect the simulation time. Third, the calculations that are not considered due to the threshold have an influence on the average simulation time—e.g., simulations with a fine mesh take much longer than calculations on a coarse mesh. For all solvers, the SE formulation is on average faster than the AE formulation. However, the maximum simulation time may appear for SE. The fastest solver is on average Tlinear-SE followed by Happarent, Hsource-SE and Tlinear-AE. The slowest solver is clearly Tapparentlinear-AE followed by Tapparentlinear-SE. The average computing time for Tlinear-SE was about 3.5 h, while for Tapparentlinear-AE it was almost one day.

4.5. Computational Time per Iteration

The mean of the computational time needed per iteration, which is the computational time required divided by the number of iterations, can be seen for all solvers and convective formulations in Figure 8. Due to the aforementioned points regarding the computing time and the influence of sections of the solver that are not part of the calculation of the energy conservation, the computational time per iteration is very vague, too. For Hsource, Tsource and Tapparentlinear, the computational time is on average 0.01–0.015 s. For Hsource and Tsource, one cannot detect large differences between both formulations (AE and SE). Happarent-SE is on average the fastest solver per iteration with 6.8 × 10 6 s and Happarent-AE, Tlinear-AE and Tlinear-SE are much slower with computational times per iterations of 0.026, 0.031 and 0.045 s, respectively. Possible reasons for the high computational time per iteration for Tlinear are the rather high number of steps performed within one iteration and the small number of iterations needed (other time-consuming parts within the solver have a higher impact on the computational time per iteration for less iterations). The difference between Tlinear-SE and Tlinear-AE might be explained by the simulations that are not considered for AE due to the threshold. These calculations always had a fine mesh and in consequence a rather long computational time per iteration, which leads to a reduced average computational time for the remaining simulations. One reason for the large difference between Happarent-AE and Happarent-SE could be that Happarent-SE is solved completely explicitly within one iteration (no matrix equation system has to be solved), whereas Happarent-AE has an implicitly formulated convective term.

4.6. Underrelaxation

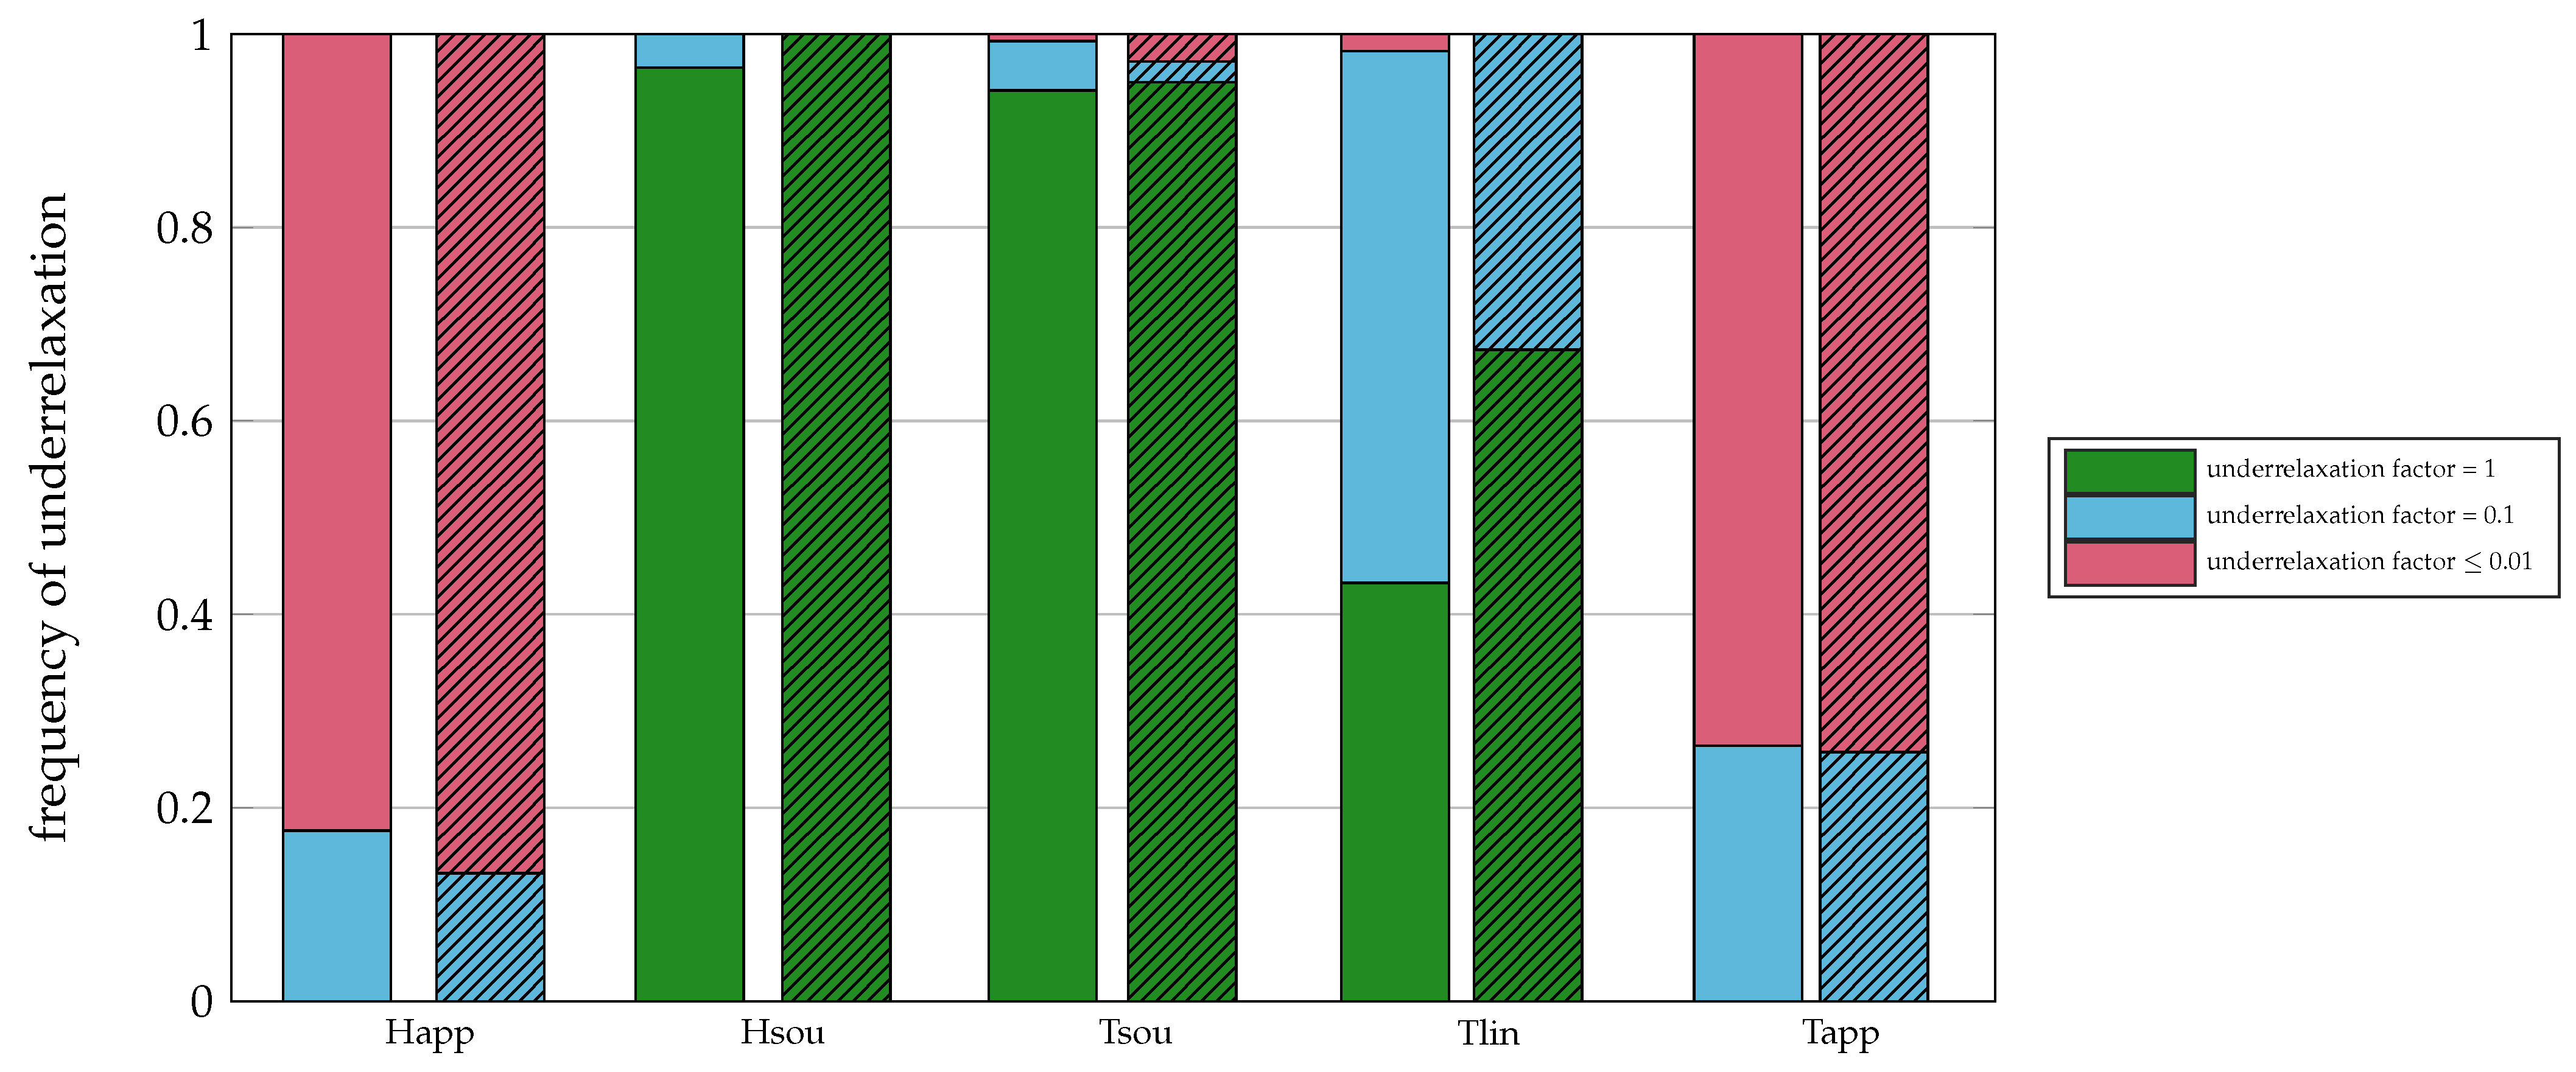
A histogram of the underrelaxation for the different solvers and convective formulations can be seen in Figure 9. Hsource-AE requires no underrelaxation and Hsource-SE as well as Tsource need for more than 90% of the cases no underrelaxation. Happarent got the strongest underrelaxation with more than 80% of underrelaxation factors ≤0.01, followed by Tapparentlinear. Both solvers always depend on underrelaxation. Tlinear-SE is underrelaxed in about 1/3 of the cases and an underrelaxation of 0.1 is always sufficient. Tlinear-AE requires underrelaxation in slightly more than 50% of the cases and only a very few times an underrelaxation factor of ≤0.01 is needed.

5. Discussion

5.1. General Results

Four of the five tested solvers give stable and very similar results over a broad range of parameters. Only Tapparentlinear gives strongly divergent results for the majority of simulations. Hsource and Tlinear-SE are the most resilient solvers—no simulations returned a final liquid fraction outside the chosen threshold of 60–70%. As highlighted above, these thresholds only refer to the chosen conditions and a mesh independent solution might give different results. On average, the SE formulation leads to slightly more resilient simulations than the AE formulation. Tlinear, especially Tlinear-SE, clearly requires the fewest iterations. On the contrary, Tapparentlinear needs by far the most iterations. The remaining solvers lie in between and perform more or less similarly to each other. For a more detailed analysis, the underrelaxation factors would have to be varied at finer intervals than here. Except for Happarent, the SE formulation requires fewer iterations than AE, and the difference in the liquid fraction between both formulations decreases with finer meshes [14]. Therefore, the SE formulation is recommended unless there are physical reasons for applying AE. The simulation time, which is very vague due to many reasons, cannot be used as a reliable and detailed criterion for the solver performance. However, one can see that Tlinear has rather a long calculation time per iteration, whereas Happarent-SE requires a relatively short time. An overview of the resilience, the numerical performance, the implementation effort and the underrelaxation is given for every solver in Table 5.

5.2. Solver Specific Analysis

In the following, a discussion is conducted on the solvers by discussing each solver separately.
  • Happarent was resilient for AE as well as SE for a broad range of parameters. Although it needed the strongest underrelaxation, it required one of the fewest iterations for AE and was in midfield of needed iterations for SE. The SE formulation of Happarent is the only solver not relying on the solving of a matrix equation system for the energy equation—resulting in the shortest mean simulation time per iteration. The implementation of Happarent is very simple so that it is the easiest solver to program.
  • Hsource was the most resilient solver for the tested conditions; for both formulations, no simulations gave results outside the chosen thresholds of a final liquid fraction from 60% to 70%. It is also the solver that was the least dependent on underrelaxation—only the AE formulation needs underrelaxation in very few cases. In terms of simulation time and required iterations, Hsource is within the average of the resilient solvers. The implementation of Hsource is moderately complex.
  • Tsource has proven to be resilient for a wide range of parameters and only in very few cases underrelaxation was needed. Tsource is within the average of the resilient solvers concerning the simulation time and required iterations. In addition, the implementation of Tsource is moderately complex.
  • Tlinear AE was resilient and Tlinear SE was the most resilient together with Hsource—no simulation gave results that were outside the chosen threshold of a final liquid fraction from 60% to 70%. It should be mentioned that a parallel study [30] indicates that an additional linearization of the convection term in the case of the AE formulation would increase its resilience. Underrelaxation was necessary in roughly 50% of the cases. Tlinear SE needed clearly the fewest iterations of all solvers followed by Tlinear AE. The fact that Tlinear needs fewer iterations than other solvers confirms results in the literature [26]. On the other hand, the calculation time for one iteration was long compared to the other solvers. The implementation of Tlinear is the most complex one of all solvers tested.
  • Tapparentlinear in its present implementation (using the approach of Morgan et al. [25] with additional iterative correction of the apparent heat capacity) performed by far the worst and cannot be recommended. It was found that the apparent heat capacity correction can be trapped in between several points for this formulation [14]. However, it should be mentioned that many different apparent heat capacity methods exist and it is conceivable that others work better.

6. Conclusions

The present work is devoted to the analysis of the numerical performances of various fixed grid methods used for the simulation of melting. Five of the most encountered and famous approaches applying an iterative correction until convergence are considered, thus studying both enthalpy and temperature formulations. Meanwhile, the modeling of the advective term in the energy balance equation is involved in the discussion. The investigated parameters are the computational times and number of iterations, be it their total number per iteration or time step. They are scrutinized—in function of the space and time discretizations—together with the temperature range on which the phase change occurs, as well as CFL and the residual of the energy equation.
After an extensive analysis, it is shown that all resilient solvers give almost identical solutions for identical parameters. Nevertheless, the resilience differs strongly depending on the retained formulation. In fact, the apparent heat capacity method tested regularly leads to wrong results and all solvers are less resilient when the advective term of the energy equation also contains the latent part of the enthalpy. In addition, the so-called optimum approach needs the least iterations and the tested apparent heat capacity method needs the most iterations. However, the optimum approach seems to have a rather long computational time per iteration, which reduces its advantage somewhat. In general, the formulation of the advective term of the energy equation that includes the latent part of the enthalpy needs more iterations and computational time than the formulation that only advects sensible enthalpy. Finally, an important deviation is always observed with the reference experiment [6,14]. Following this, a specific discussion is necessary on the development of an experimental reference solution and how it should be conducted. In summary, it would have to contain specific thermal characterization of the involved PCM, as well as thorough measurement of both the initial and boundary conditions. Moreover, uncertainties accompanying all these measurements should be provided.
Finally, we plan to study the influence of different switch-off techniques as well as the influence of temperature dependent material properties on melting processes.

Author Contributions

Conceptualization, A.K.-H. and E.F.; methodology, A.K.-H., E.F. and M.F.; software, A.K.-H. and M.F.; validation, A.K.-H, E.F. and M.F.; investigation, A.K.-H., E.F. and M.F.; data curation, A.K.-H., E.F. and M.F.; Writing—Original draft preparation, A.K.-H. and E.F.; Writing—Review and editing, A.K.-H., E.F., M.F. and D.B.; visualization, A.K.-H. and E.F.; and supervision, E.F. and D.B. All authors have read and agreed to the published version of the manuscript.

Funding

This publication was funded by the German Research Foundation (DFG) and the University of Bayreuth in the funding program Open Access Publishing.

Informed Consent Statement

Not applicable.

Conflicts of Interest

The authors declare no conflict of interest.

Nomenclature

Latin letters
A porosity function ( kg m 3 s 1 )
cspecific capacity ( J K 1 kg 1 )
CDarcy constant ( kg m 3 s 1 )
ggravity acceleration ( m s 2 )
hspecific enthalpy ( J kg 1 )
Llatent heat ( kJ kg 1 )
Ppressure ( Pa })
qsmall Darcy constant (–)
Ttemperature ( K })
V velocity ( m s 1 )
ttime (s)
Greek letters
α volume fraction (–)
β volumetric coefficient of thermal expansion ( K 1 )
ϵ tolerance (–)
λ thermal conductivity ( W K 1 m 1 )
ρ density ( kg m 3 )
μ dynamic viscosity ( kg m 1 s 1 )
ν kinematic viscosity ( m 2 s 1 )
Exponents and subscripts
appapparent
lliquid
liqliquidus
Mmelting
refreference
ssolid
solsolidus
Acronyms
AEall enthalpy convection
CFLCourant–Friedrichs–Lewy
DIMdiffuse interface method
FGMfixed grid method
HappHapparent
HsouHsource
SEsensible enthalpy convection
TappTapparentlinear
TlinTlinear
TsouTsource

References

  1. Stadler, I.; Hauer, A.; Bauer, T. Thermal Energy Storage. In Handbook of Energy Storage; Springer Vieweg: Berlin/Heidelberg, Germany, 2019; pp. 563–609. [Google Scholar]
  2. Fukusako, S.; Seki, N. Fundamental aspects of analytical and numerical methods on freezing and melting heat-transfer problems. In Annual Review of Heat Transfer; Begell: New York, NY, USA, 1987; Volume 1, pp. 351–402. [Google Scholar]
  3. Basu, B.; Date, A. Numerical modelling of melting and solidification problems—A review. Sadhana 1988, 13, 169–213. [Google Scholar] [CrossRef]
  4. Voller, V.R.; Swaminathan, C.R.; Thomas, B.G. Fixed grid techniques for phase change problems: A review. Int. J. Numer. Methods Eng. 1990, 30, 875–898. [Google Scholar] [CrossRef]
  5. Hu, H.; Argyropoulos, S.A. Mathematical modelling of solidification and melting: A review. Model. Simul. Mater. Sci. Eng. 1996, 4, 317. [Google Scholar] [CrossRef] [Green Version]
  6. König-Haagen, A.; Franquet, E.; Pernot, E.; Brüggemann, D. A comprehensive benchmark of fixed-grid methods for the modeling of melting. Int. J. Therm. Sci. 2017, 118, 69–103. [Google Scholar] [CrossRef]
  7. Gobin, D.; Le Quéré, P. Melting from an isothermal vertical wall. Synthesis of a numerical comparison exercise. Comput. Assist. Mech. Eng. Sci. 2000, 7, 289–306. [Google Scholar]
  8. Combeau, H.; Bellet, M.; Fautrelle, Y.; Gobin, D.; Arquis, E.; Budenkova, O.; Dussoubs, B.; Terrail, Y.D.; Kumar, A.; Gandin, C.A.; et al. Analysis of a numerical benchmark for columnar solidification of binary alloys. IOP Conf. Ser. Mater. Sci. Eng. 2012, 33, 012086. [Google Scholar] [CrossRef]
  9. Lacroix, M.; Voller, V.R. Finite difference solutions of solidification phase change problems: Transformed versus fixed grids. Numer. Heat Transf. Part B Fundam. 1990, 17, 25–41. [Google Scholar] [CrossRef]
  10. Viswanath, R.; Jaluria, Y. A comparison of different solution methodologies for melting and solidification problems in enclosures. Numer. Heat Transf. Part B Fundam. 1993, 24, 77–105. [Google Scholar] [CrossRef]
  11. Bertrand, O.; Binet, B.; Combeau, H.; Couturier, S.; Delannoy, Y.; Gobin, D.; Lacroix, M.; Quéré, P.L.; Médale, M.; Mencinger, J.; et al. Melting driven by natural convection A comparison exercise: First results. Int. J. Therm. Sci. 1999, 38, 5–26. [Google Scholar] [CrossRef]
  12. Ahmad, N.; Rappaz, J.; Desbiolles, J.L.; Jalanti, T.; Rappaz, M.; Combeau, H.; Lesoult, G.; Stomp, C. Numerical simulation of macrosegregation: A comparison between finite volume method and finite element method predictions and a confrontation with experiments. Metall. Mater. Trans. A 1998, 29, 617–630. [Google Scholar] [CrossRef]
  13. Kosec, G.; Založnik, M.; Šarler, B.; Combeau, H. A Meshless Approach Towards Solution of Macrosegregation Phenomena. Comput. Mater. Contin. 2011, 22, 169–195. [Google Scholar]
  14. König-Haagen, A.; Franquet, E.; Faden, M.; Brüggemann, D. Influence of the convective energy formulation for melting problems with enthalpy methods. Int. J. Therm. Sci. 2020, 106477. [Google Scholar] [CrossRef]
  15. Swaminathan, C.R.; Voller, V.R. On the enthalpy method. Int. J. Numer. Methods Heat Fluid Flow 1993, 3, 233–244. [Google Scholar] [CrossRef]
  16. Pointner, H.; de Gracia, A.; Vogel, J.; Tay, N.; Liu, M.; Johnson, M.; Cabeza, L.F. Computational efficiency in numerical modeling of high temperature latent heat storage: Comparison of selected software tools based on experimental data. Appl. Energy 2016, 161, 337–348. [Google Scholar] [CrossRef] [Green Version]
  17. Mehrabian, R.; Keane, M.; Flemings, M. Interdendritic fluid flow and macrosegregation; influence of gravity. Metall. Mater. Trans. A 1970, 1, 1209–1220. [Google Scholar] [CrossRef]
  18. Bennon, W.; Incropera, F. A continuum model for momentum, heat and species transport in binary solid-liquid phase change systems—I. Model formulation. Int. J. Heat Mass Transf. 1987, 30, 2161–2170. [Google Scholar] [CrossRef]
  19. Voller, V.R.; Cross, M.; Markatos, N.C. An enthalpy method for convection/diffusion phase change. Int. J. Numer. Methods Eng. 1987, 24, 271–284. [Google Scholar] [CrossRef]
  20. Voller, V.R.; Prakash, C. A fixed grid numerical modelling methodology for convection-diffusion mushy region phase-change problems. Int. J. Heat Mass Transf. 1987, 30, 1709–1719. [Google Scholar] [CrossRef]
  21. Brent, A.D.; Voller, V.R.; Reid, K.J. Enthalpy-porosity technique for modeling convection-diffusion phase change: Application to the melting of a pure metal. Numer. Heat Transf. Part A Appl. 1988, 13, 297–318. [Google Scholar]
  22. Eyres, N.R.; Hartree, D.R.; Ingham, J.; Jackson, R.; Sarjant, R.J.; Wagstaff, J.B. The Calculation of Variable Heat Flow in Solids. Philos. Trans. R. Soc. Lond. Ser. A Math. Phys. Sci. 1946, 240, 1–57. [Google Scholar]
  23. Rose, M.E. A Method for Calculating Solutions of Parabolic Equations with a Free Boundary. Math. Comput. 1960, 14, 249–256. [Google Scholar] [CrossRef]
  24. Cao, Y.; Faghri, A.; Chang, W. A numerical analysis of Stefan problems for generalized multi-dimensional phase-change structures using the enthalpy transforming model. Int. J. Heat Mass Transf. 1989, 32, 1289–1298. [Google Scholar] [CrossRef]
  25. Morgan, K.; Lewis, R.W.; Zienkiewicz, O.C. An improved algrorithm for heat conduction problems with phase change. Int. J. Numer. Methods Eng. 1978, 12, 1191–1195. [Google Scholar] [CrossRef]
  26. Swaminathan, C.; Voller, V. A general enthalpy method for modeling solidification processes. Metall. Trans. B 1992, 23, 651–664. [Google Scholar] [CrossRef]
  27. Rolph, W.D.; Bathe, K.J. An efficient algorithm for analysis of nonlinear heat transfer with phase changes. Int. J. Numer. Methods Eng. 1982, 18, 119–134. [Google Scholar] [CrossRef] [Green Version]
  28. Weller, H.G.; Tabor, G.; Jasak, H.; Fureby, C. A tensorial approach to computational continuum mechanics using object-oriented techniques. Comput. Phys. 1998, 12, 620–631. [Google Scholar] [CrossRef]
  29. Gau, C.; Viskanta, R. Melting and solidification of a pure metal on a vertical wall. ASME J. Heat Transf. 1986, 108, 174–181. [Google Scholar] [CrossRef]
  30. Faden, M.; König-Haagen, A.; Brüggemann, D. An Optimum Enthalpy Approach for Melting and Solidification with Volume Change. Energies 2019, 12, 868. [Google Scholar] [CrossRef] [Green Version]
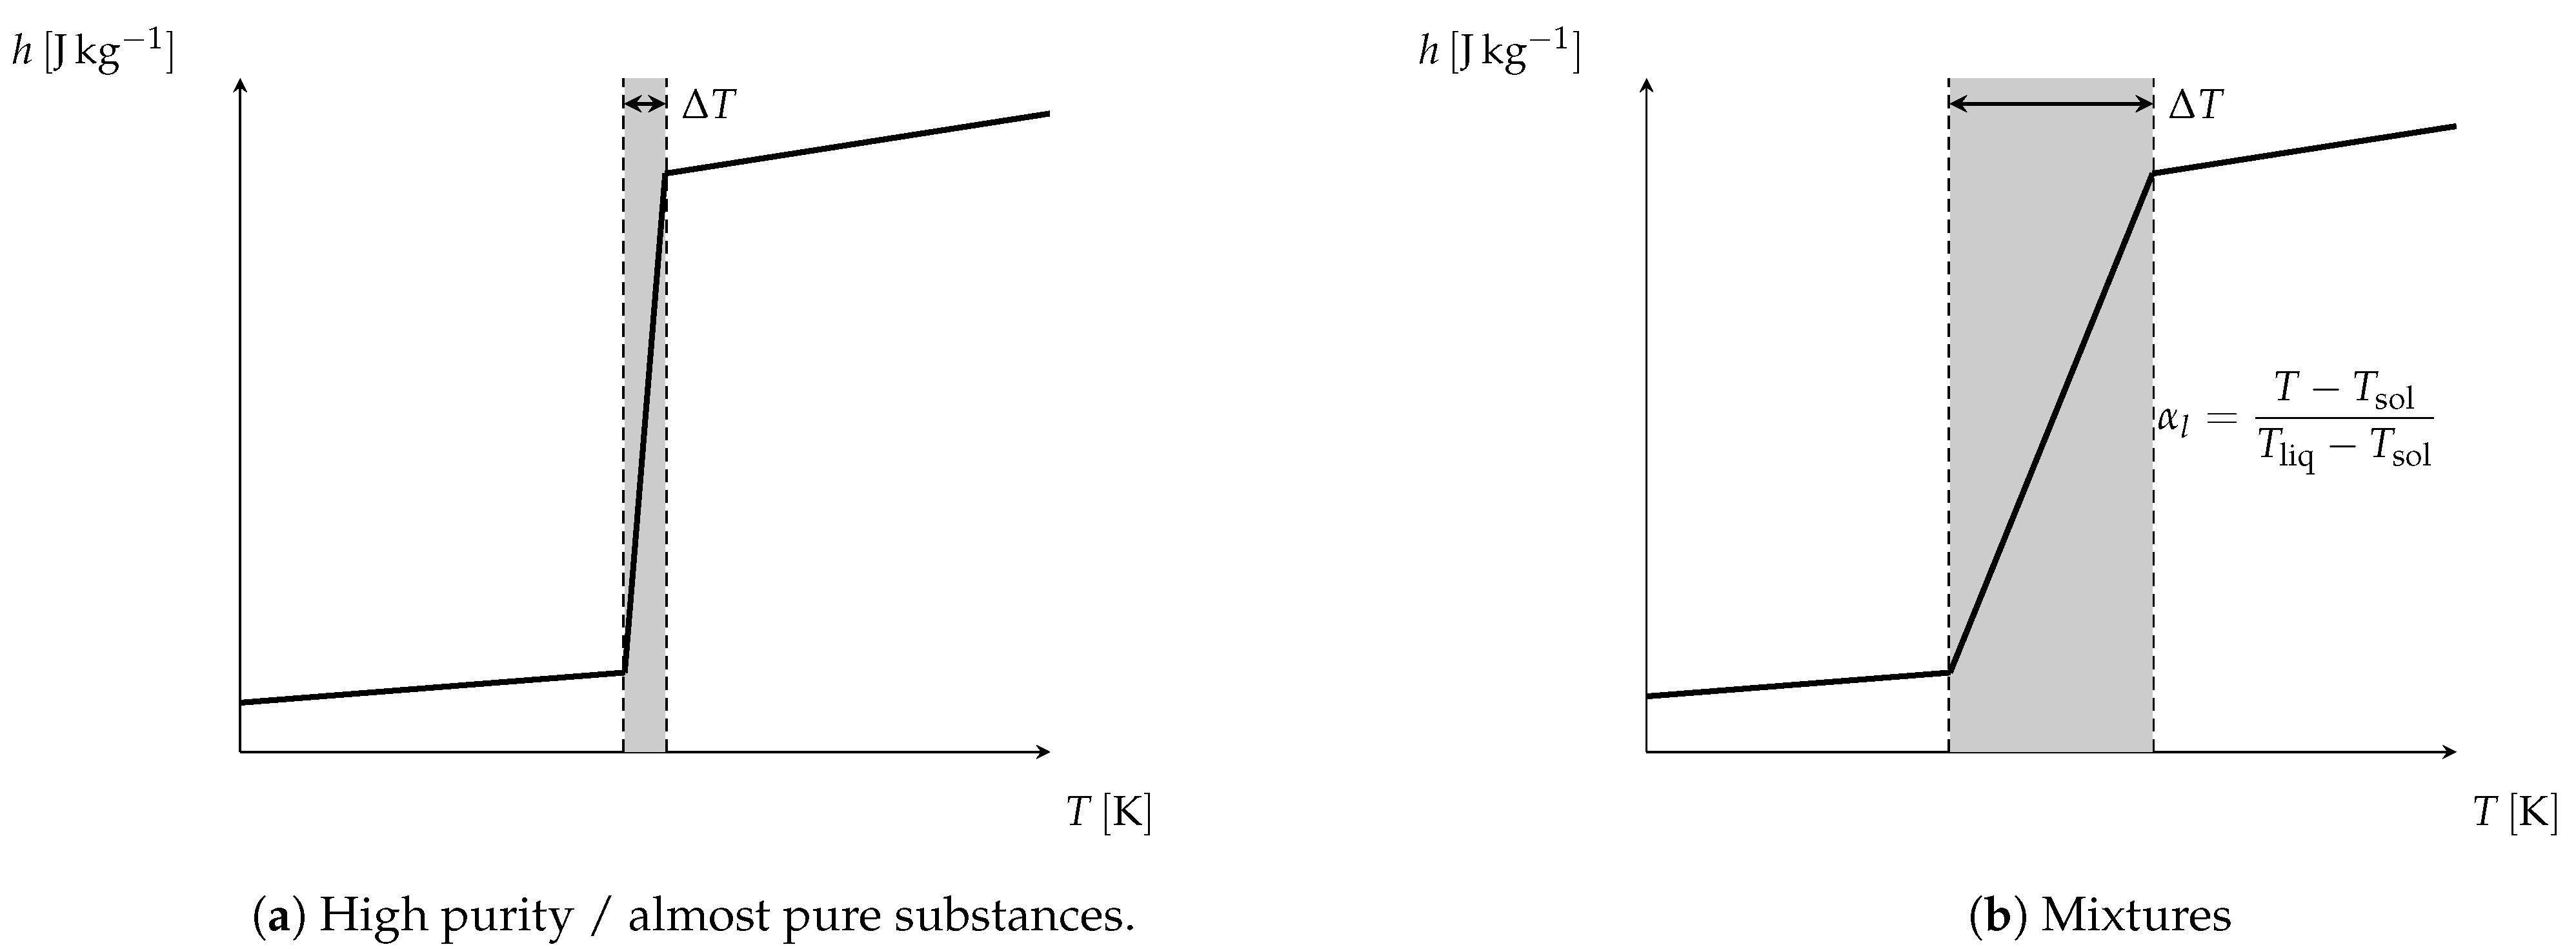
Figure 1. Examples of the enthalpy formulation [14].
Energies 14 00354 g001
Figure 2. Sketch of the simulated experiment.
Energies 14 00354 g002
Figure 3. Mean values of the number of iterations for each solver.
Energies 14 00354 g003
Figure 4. Mean of the normalized iterations for different formulations.
Energies 14 00354 g004
Figure 5. Mean number of iterations in function of the various parameters for the AE and the SE case (clear and striped, respectively).
Energies 14 00354 g005
Figure 6. Min, mean and max number of iterations per time step for the AE and the SE case (clear and striped respectively).
Energies 14 00354 g006
Figure 7. Mean values of the computational time for each solver.
Energies 14 00354 g007
Figure 8. Mean values of time per iteration for each solver.
Energies 14 00354 g008
Figure 9. Underrelaxation factors for the AE and the SE case (clear and striped, respectively).
Energies 14 00354 g009
Table 1. Thermophysical properties for gallium.
PropertyValueUnit
ρ s 6093kg m−3
ρ l 6093kg m−3
c s 381.5J K−1 kg−1
c l 381.5J K−1 kg−1
λ s 32W K−1 m−1
λ l 32W K−1 m−1
T M 29.78°C
L80 160J kg−1
μ 1.81 × 10 3 kg m−1 s−1
ν 0.29706 × 10 6 m2 s−1
β 1.2 × 10 4 K−1
Table 2. Overview of the varied parameters.
VariableRemarksVariationUnit
Δ T Tlinear, Tapparentlinear 10 2 , 10 1 , 2 × 10 1 , 5 × 10 1 , 1 , 2 K
Tsource 10 2 , 2 × 10 1 , 2 K
Happarent, Hsource 0 , 2 × 10 1 , 2 K
Δ x number of cells50 × 50, 100 × 100, 150 × 150, 200 × 200
Δ t time step0.1, 1 s
CFL 1, 4, 8
tol tolerance for the energy equation 10 6 , 10 10
form formulation of the convective termAE, SE
Table 3. Ratio of simulations with a final liquid fraction from 60% to 70%.
ParameterAESE
VariationHappHsouTsouTlinTappHappHsouTsouTlinTapp
Δ x 50 × 501.0001.0001.0001.0000.3061.0001.0001.0001.0000.597
100 × 1001.0001.0001.0001.0000.3751.0001.0001.0001.0000.569
150 × 1501.0001.0000.9440.9720.3471.0001.0000.9721.0000.431
200 × 2000.7781.0000.8610.9440.1810.7781.0000.9171.0000.236
Δ t 1 s0.8891.0000.9310.9720.2640.8891.0000.9441.0000.403
0.1 s1.0001.0000.9720.9860.3401.0001.0001.0001.0000.514
ϵ 10 6 0.9441.0000.9170.9580.2570.9441.0000.9441.0000.396
10 10 0.9441.0000.9861.0000.3470.9441.0001.0001.0000.521
CFL11.0001.0001.0001.0000.4381.0001.0001.0001.0000.542
40.9171.0001.0000.9690.2500.9171.0001.0001.0000.427
80.9171.0000.8540.9690.2190.9171.0000.9171.0000.406
Δ T 2 K1.0001.0000.9581.0000.6881.0001.0000.9581.0000.708
1 K---1.0000.521---1.0000.458
0.5 K---1.0000.521---1.0000.604
0.2 K0.9171.0000.9581.0000.0830.9171.0000.9791.0000.646
0.1 K---1.0000.000---1.0000.333
0 K0.9171.0000.9380.8750.0000.9171.0000.9791.0000.000
Table 4. Mean values of the normalized iterations.
ParameterAESE
VariationHappHsouTsouTlinTappHappHsouTsouTlinTapp
Δ x 50 × 501.8782.4184.2621.63832.0112.8972.4033.7451.06727.470
100 × 1002.9363.9688.1912.80810.9776.3604.0346.5181.04827.007
150 × 1502.5586.53212.1413.5279.49712.2286.0059.5091.01623.352
200 × 2002.7895.40110.3721.70816.65310.5836.80812.0491.01230.389
Δ t 1 s2.5964.0187.1521.96614.7288.8084.0106.7821.06917.906
0.1 s2.4845.14110.1372.92119.1747.0405.6158.9091.00234.894
ϵ 10 6 1.3706.13914.8634.31930.6598.6723.1899.4281.06834.982
10 10 3.7133.0203.0141.01410.7177.2206.4366.5021.00325.128
CFL13.5563.7208.9481.00931.2527.9713.6546.4501.00040.446
42.1234.9649.8693.4048.32911.3177.73612.5191.07025.253
81.9455.0557.2902.9988.6964.5503.0484.8261.03818.398
Δ T 2 K2.7262.8165.9082.71311.8196.8343.4976.3801.1506.775
1 K---1.00716.747---1.00030.995
0.5 K---1.00017.355---1.00035.913
0.2 K2.2745.3249.5724.17838.3207.0615.1527.8331.03935.391
0.1 K---1.000NaN---1.00031.088
0 K2.6255.59910.6264.923NaN9.9435.7899.5811.025NaN
Table 5. Solver specific summary of the overall results including practical aspects. The characters indicate how the solvers perform in each area. The order is ++, +, o, - and --, where ++ is the most favorable rating.
AE SE
HappHsouTsouTlinTappHappHsouTsouTlinTapp
resilience+++++--++++++--
iterationsoo-+--o+o++--
time per iteration-oo-o+oo-o
numerical implementation+oo-o+oo-o
underrelaxation--++o----+++o--
Publisher’s Note: MDPI stays neutral with regard to jurisdictional claims in published maps and institutional affiliations.