Article

Life Cycle Assessment of Municipal Wastewater Treatment Processes Regarding Energy Production from the Sludge Line

by
Paulina Szulc
1,2,
Jędrzej Kasprzak
3,
Zbysław Dymaczewski
2,* and
Przemysław Kurczewski
3
1
Aquanet S.A., 61-491 Poznań, Poland
2
Institute of Environmental Engineering and Building Installations, Faculty of Environmental Engineering and Energy, Poznan University of Technology, 60-965 Poznań, Poland
3
Institute of Transport, Faculty of Civil and Transport Engineering, Poznan University of Technology, 60-965 Poznań, Poland
*
Author to whom correspondence should be addressed.
Energies 2021, 14(2), 356; https://doi.org/10.3390/en14020356
Submission received: 30 November 2020 / Revised: 2 January 2021 / Accepted: 7 January 2021 / Published: 12 January 2021
(This article belongs to the Special Issue Wastewater Treatment and Resource Recovery)

Abstract

:
The efficient and timely removal of organic matter and nutrients from water used in normal municipal functions is considered to be the main task of wastewater treatment plants (WWTPs). Therefore, these facilities are considered to be essential units that are required to avoid pollution of the water environment and decrease the possibility of triggering eutrophication. Even though these benefits are undeniable, they remain at odds with the high energy demand of wastewater treatment and sludge processes. As a consequence, WWTPs have various environmental impacts, which can be estimated and categorized using Life Cycle Assessment (LCA) analysis. In this study, a municipal WWTP based in Poznań, Poland, was examined using the method defined in ISO 14040. ReCiPe Endpoint and Midpoint (v1.11), in a hierarchical approach, were used to evaluate the environmental impacts regarding 18 different categories. All calculations were conducted using a detailed database from 2019, which describes each chosen facility. It was found that the energy component, related to the wastewater treatment process demand and electricity production, is the main determinant of the sum of the environmental impact indicators in light of the modelled energy mix. Therefore, it determines the entire process as an environmentally friendly activity.

1. Introduction

A conventional wastewater treatment (WWT) process, based on the activated sludge method, has been considered to be an environmentally friendly action since the beginning of the twentieth century. WWT technology development, driven by unrestrained urban areas expansion, has successively broadened the municipal wastewater treatment plant’s (MWWTP’s) area of operation, from achieving a better quality of treated effluents to more advanced solutions where the used water stream is seen as a source of valuable materials and energy. With growing awareness of the multidimensionality of today’s large WWT facility profiles, based on the generation of various bioproducts (i.e., biosolids, biopolimers), as well as energy production that can be levelled even higher than the plant’s energy consumption, there are many alternatives available to improve their ecological and economic capability [1].
Balance between resource consumption and recovery, which will ensure the maximum possible limitation of an MWWTP’s environmental impact, is undoubtedly an indication of the ultimate effectiveness of the facility.
Therefore, the overall efficiency of the WWT facility should be examined as a multifactor problem in a complex way in order to ensure that the holistic perspective is achieved [2]. Life Cycle Assessment (LCA) is a suitable tool that can be applied in this field for the evaluation of environmental aspects [3]. LCA allows us to compare different systems, products, and processes regarding the production and self-usage of energy and the extraction of the raw materials included in various treatment unit combinations [4] to find the best process scenario available [5]. Since the 1990s, different WWT topics have been examined in several previous LCA studies [6]: plant modifications and operations [7,8,9,10,11,12], modeling [13,14,15,16,17,18,19], sludge processes [11,20,21,22], greenhouse gas (GHG) emissions [4,23,24], rainfall impact [6,25], and uncertainty [5,26,27,28].
Hence, the main goal of this paper is to estimate the overall environmental impacts of a large WWTP based in Poznań, Poland, by the development of a data inventory. The different approach, in comparison to previous work published [24,29,30,31], lies in the provision of a detailed and widely operational WWTP database that allowed us to describe the WWT process. In this publication, for the very first time, just such a complex LCA analysis was conducted on a facility based in Poland. Some attempts and analyses for Polish conditions have already been presented (see [29,30,31], mentioned above), but these usually concern small installations that are utilized for domestic purposes or are mainly based on simulation data. Moreover, in the findings described in [32], as in most of the studies, a volume unit (m3, for example) is acquired as the functional unit, which makes a direct comparison of the results of individual studies difficult.

2. Materials and Methods

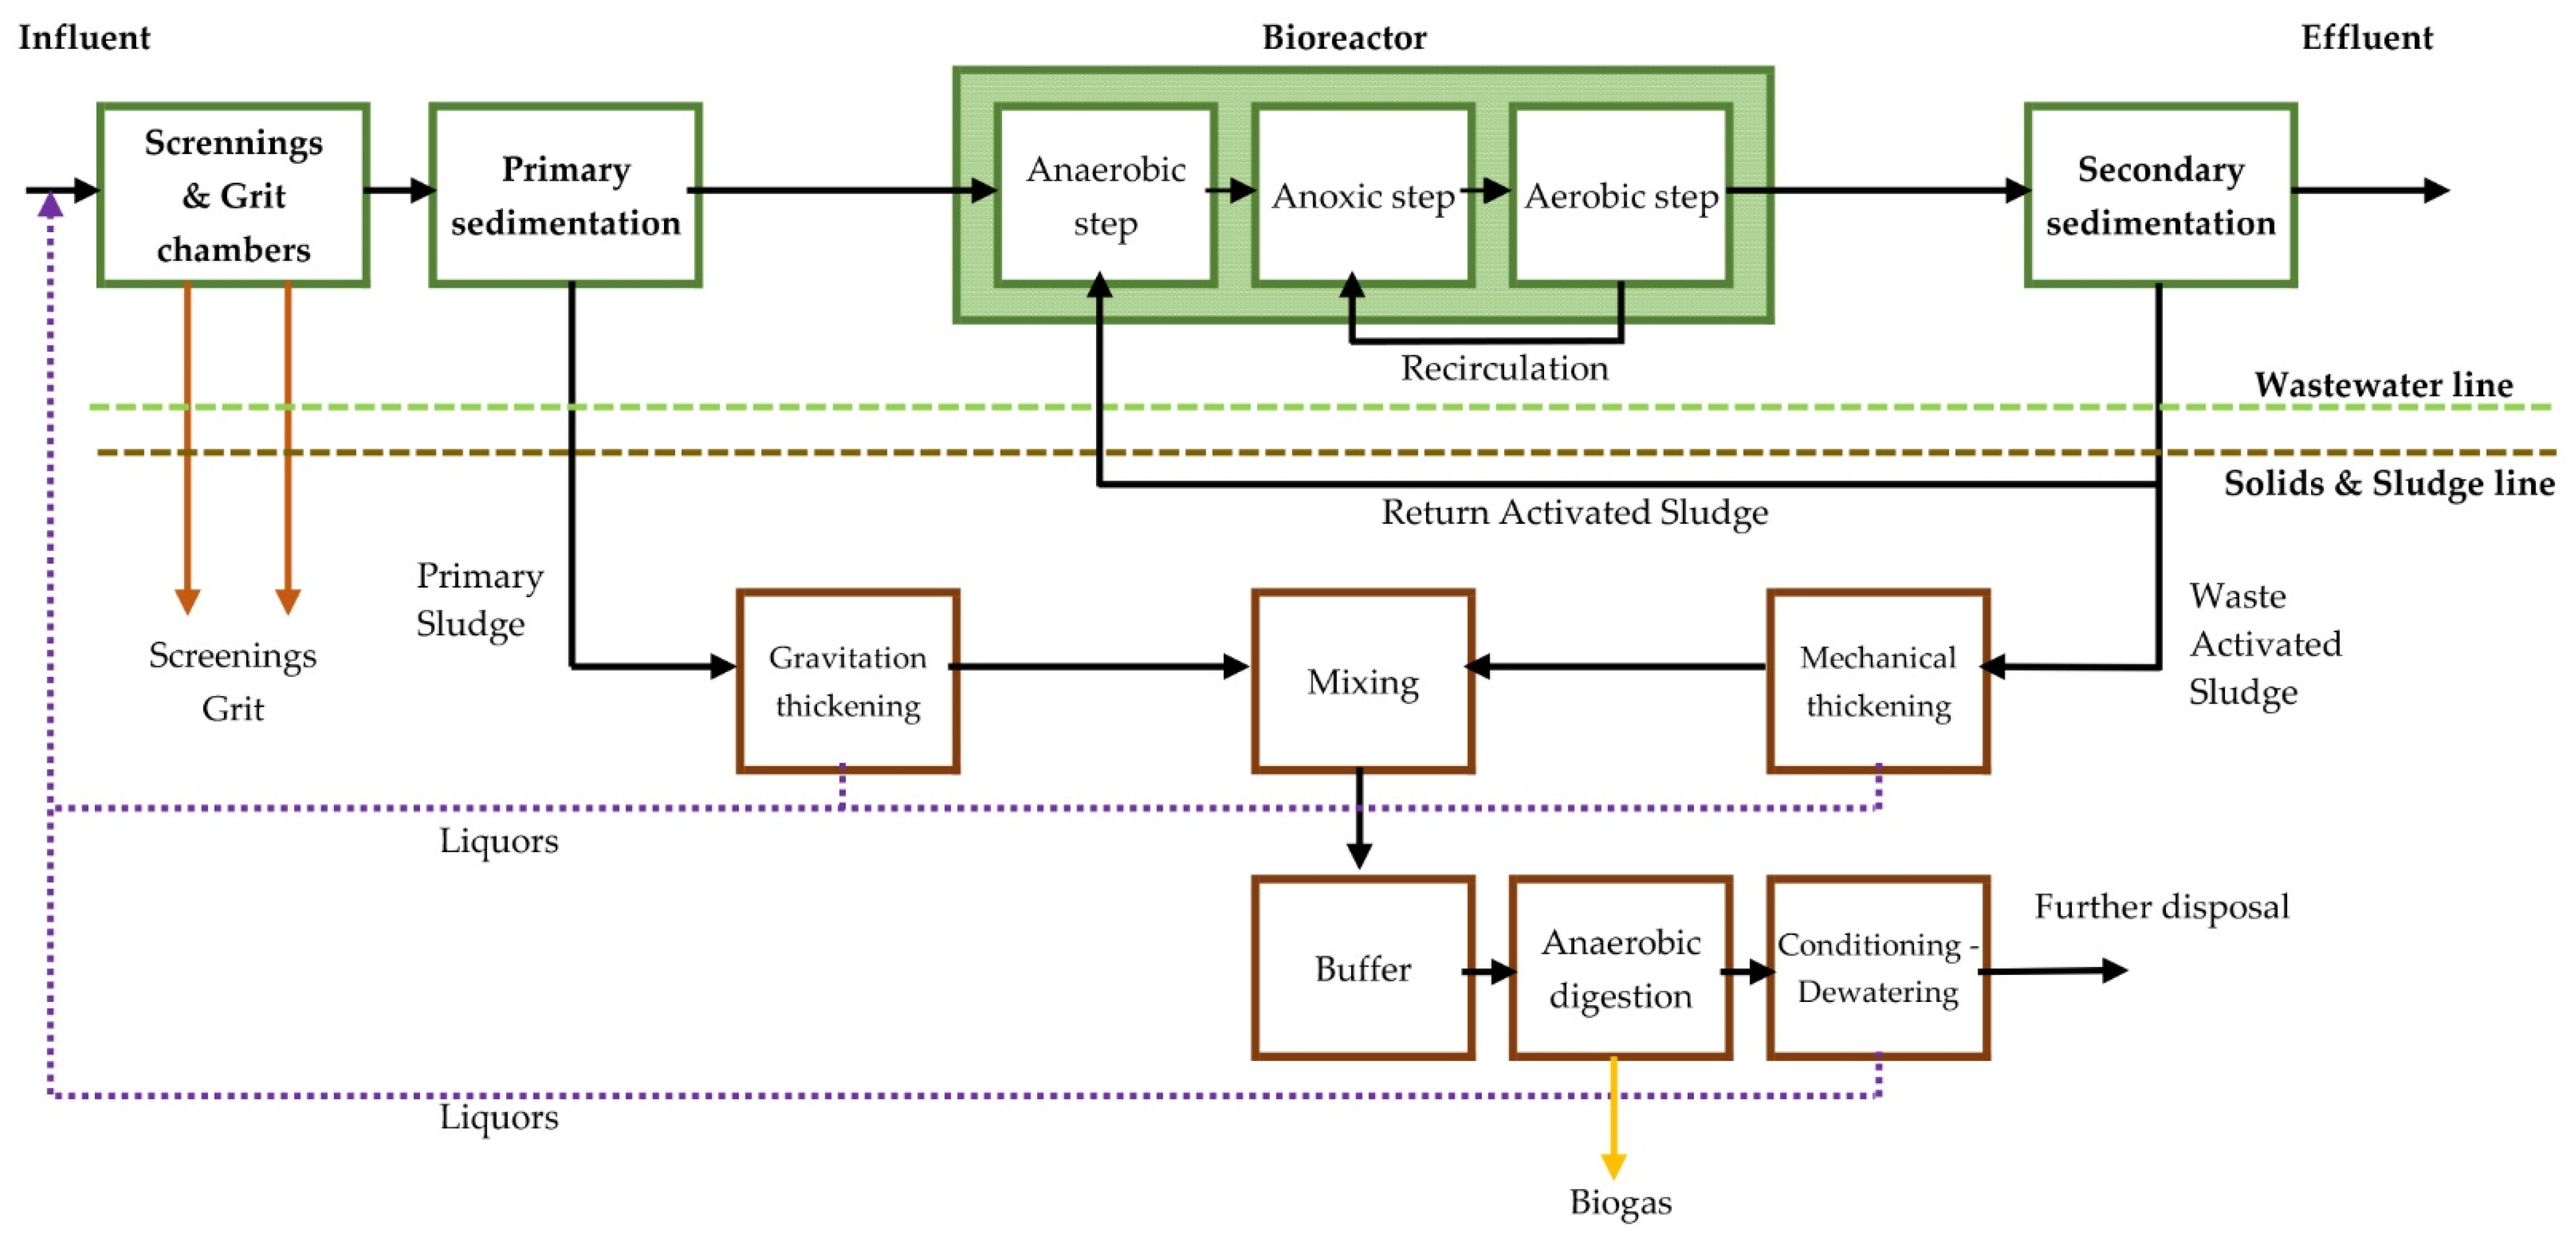
2.1. WWTP Description

The municipal WWTP in this study is located in Kozieglowy, on the right bank of the Warta river, nearby Poznań, the capital city of the Greater Poland region. It is called the Central WWTP (CWWTP). The facility treats wastewater originating from Poznań and the neighboring settlements at a volume of ca. 100,000 m3 and 1,000,000 population equivalent (PE) based on Biochemical Oxygen Demand (BOD) per day (2019 data). The processing method used to achieve the required standards of wastewater effluent, discharged to the Warta river, is based on biological nutrient removal (BNR) via activated sludge held in modified Bardenpho system bioreactor chambers (6 × 25,500 m3) with secondary clarifiers (6 × 9500 m3), preceded by screenings and mechanical separation of solids suspended in the raw used water stream, maintained in aerated horizontal grit traps followed by circular preliminary settling tanks (4 × 6500 m3).
Gravitationally thickened primary sludge ((PS); 5% dry solids (DS)) and waste activated sludge ((WAS); 6% DS), conditioned via belt compactor application as a side-products of the WWT process, both with high bio-potential, are mixed together in the proportion 2:1 and delivered to feed anaerobic digesters (ADs). This contributes to an organic loading rate of 1.7 kg vs. m−3d−1 (i.e., added per reactor volume; 6 × 4960 m3). There, in mesophilic conditions of ca. 35 °C with 26 days of average sludge retention time, biogas is constantly produced in the volume of 21,250 m3, daily. While pre-treated bio-methane, captured within the process at the level of 64% concentration in the raw stream, is transferred via generating sets into electricity, the digestate (3% DS), after being buffered for gas stripping in the tanks (6 × 500 m3), is dewatered in centrifuges (23% DS) for final disposal, which is carried out outside the plant system boundaries alongside other WWT by-products such as separated grit and compacted screenings. Two of the buffer tanks mentioned are dedicated to the digested sludge pumped to the CWWTP from another facility, the left river bank WWTP (LWWTP). The main wastewater and sludge characterizations of the CWWTP in Poznań, Koziegłowy, is included in Table 1 and Table 2.
In order to guarantee the stability of phosphorus removal during the winter season, an aqueous solution of iron (III) sulphate (PIX113) is dosed periodically up to the level of P-precipitation need. The PIX113 used in the biological part of the WWTP in Koziegłowy is also used to prevent struvite crystallization in digestate transportation lines in combination with other antiscalant agents. To maintain the best environment for flocculation during thickening and dewatering, different chosen polyelectrolyte solution complexes are used. Facilitation of the final sludge, collected from centrifuges, is provided by using a polymer solution. During intensive fermentation periods, antifoaming supplements are dosed. All these chemical agents were taken into consideration during the analysis (see Section 2.2.3).
Configuration of the main wastewater treatment technology practiced in the CWWTP, Poznań, Koziegłowy, is presented in Figure 1.

2.2. Methods

2.2.1. Background

Analysis of the environmental impacts carried out in accordance with the Life Cycle Assessment (LCA) methodology is the main part of the research material. This method is defined in detail in ISO 14040 as the process of evaluating the effects that a product (or, in this case, a process) exerts on the environment throughout its entire life, by increasing the efficient use of resources and reducing the burden on the environment (liabilities). LCA is regarded as a “from cradle to grave” analysis. This method is more widely defined in many source publications. J. Fava [33] describes it as a technique aimed at assessing the environmental hazards associated with a product system or operation, both by identifying and quantifying the materials and energy used and the waste released into the environment, as well as assessment of the environmental impact of these materials, energy, and waste. It covers the entire life cycle of a product or activity, from the extraction and processing of mineral resources, product manufacturing processes, distribution, use, re-use, maintenance, recycling, and end-use, along with transportation. The purpose of the LCA is the study of the environmental impacts of manufacturing systems on the ecosystem, human health, and used resources. W. Klöpfer [34] states that the basic idea of the LCA is that the environmental burden associated with a product or service is assessed in terms of the cycle of material acquisition to final disposal. In this sense, the term “LCA life cycle assessment” is more precise than the German “Ökobilanz” or the French “ecobilan”, meaning eco-balance. The main idea is undoubtedly correct, and the LCA is the only environmental assessment tool that avoids (false) positive assessment results due to migration/displacement of various types of impacts. The LCA methodology is consistent with the principles and guidelines of ISO 14040: 2006 [35] and ISO 14044: 2006 [36], and it consists of four main steps: defining goal and scope, inventory analysis, impact assessment, and interpretation. The internal modelling involves the following steps [37]:
  • Selection and definition of impact categories: The purpose of this step is to select the impact categories that will be considered as part of the overall LCA. It should be completed as part of the initial goal and scope definition phase to guide the LCI (Life Cycle Inventory) data collection process and requires reconsideration following the data collection phase. The items identified in the LCI have potential human health and environmental impacts;
  • Classification: Its purpose is to organize and possibly combine the LCI results into impact categories. For LCI items that contribute to only one impact category, the procedure is a straightforward assignment. For example, carbon dioxide emissions can be classified into the global warming category;
  • Characterization: This step uses science-based conversion factors, called characterization factors, to convert and combine the LCI results into representative indicators of impacts on human and ecological health. Characterization factors are also commonly referred to as equivalency factors. Characterization provides a way to directly compare the LCI results within each impact category. In other words, characterization factors translate different inventory inputs into directly comparable impact indicators;
  • Normalization: This is an LCIA (Life Cycle Impact Assessment) tool used to express impact indicator data in a way that can be compared between impact categories. This procedure normalizes the indicator results by dividing by a selected reference value;
  • Grouping: This step assigns impact categories into one or more sets to better facilitate the interpretation of the results into specific areas of concern;
  • Weighting: This is sometimes also referred to as valuation of an LCIA, and it assigns weights or relative values to the different impact categories based on their perceived importance or relevance. Weighting is important because the impact categories should also reflect study goals and stakeholder values.
ReCiPe Endpoint and Midpoint in version 1.11, in a hierarchical approach (H) were used in this analysis for the calculation procedures in order to estimate the environmental impacts. The Endpoint version was chosen to determine the general trends related to the proportions of the size of the environmental impacts of individual treatment process components listed in Section 2.1. The Midpoint version was used to determine the absolute size of the environmental loads for the individual components of the treatment process, within the impact categories specified in the method. The ReCiPe procedure is one of the latest and most widely used life cycle assessment practices. It has been defined with a detailed breakdown into the impact categories at work [37], and its last methodological modifications are described in the paper [38].
A complete list of impact categories includes:
  • Climate change—unit: kg CO2 eq;
  • Ozone depletion—unit: kg CFC-11 eq;
  • Terrestrial acidification—unit: kg SO2 eq;
  • Freshwater eutrophication—unit: kg P eq;
  • Marine eutrophication—unit: kg N eq;
  • Human toxicity—unit: kg 1,4-DB eq;
  • Photochemical oxidant formation—unit: kg NMVOC eq;
  • Particulate matter formation—unit: kg PM10 eq;
  • Terrestrial ecotoxicity—unit: kg 1,4-DB eq;
  • Freshwater ecotoxicity—unit: kg 1,4-DB eq;
  • Marine ecotoxicity—unit: kg 1,4-DB eq;
  • Ionizing radiation—unit: kBq U235 eq;
  • Agricultural land occupation—unit: m2a;
  • Urban land occupation—unit: m2a;
  • Natural land transformation—unit: m2;
  • Water depletion—unit: m3;
  • Metal depletion—unit: kg Fe eq;
  • Fossil fuel depletion—unit: kg oil eq.
In the description of the analytical procedure, zero values of standardization factors were found for the impact category “water depletion”; therefore, it is not included in the final evaluation at the weighting stage (ReCiPe Endpoint).

2.2.2. Goal and Scope of Analysis

Definition of the Analysis Goal

The aim of the analysis was to assess the environmental impact of the process of wastewater stream management in the period under consideration (January–December 2019) compared to the “baseline” process, as implemented at the CWWTP in the period under consideration.

Functional Unit

The volume of wastewater managed during the reference year (2019), broken down into individual months, was assumed to be the functional unit. This volume was 38,325,867 m3. Changes in the volume of the managed wastewater in particular months are shown in Figure 2.

System Boundaries, Assumptions and Limitations

Based on the data provided (limited to 2019), a model of the wastewater treatment system was proposed. It is assumed that a stream of raw sewage is directed to the treatment system and, after passing through all stages of the technological process, is directed to a receiver (environment) as a stream of treated wastewater. The treatment process itself was assumed to be indivisible due to the fact that it is not possible to include division into individual treatment stages in the analysis (the input data are not grouped in this way). Therefore, only parameters of process input and output streams were modelled (Figure 3).
In Figure 3, the process inputs are the raw wastewater stream at the plant’s input, electrical power fed to the treatment system from external sources, and additional (chemical) substances used in the used water treatment process. Process outputs are divided into two groups:
  • As sources of environmental loads adopted: (a) A treated wastewater stream that, although characterized by significantly lower values of the analyzed parameters determining the harmfulness of the wastewater (concentrations), still contains substances that have a negative impact on the environment; (b) The so-called “screenings”, i.e., macro-pollutants separated by means of mechanical separators (screens), which were not taken into account at all in the preliminary analysis and at this stage were treated as waste to be treated; and (c) Sewage sludge, which is then directed to anaerobic digesters and serves to produce the methane-rich biogas, which is next used to produce the energy used in the process of wastewater treatment; this way of generating energy and its use in the process of wastewater treatment also has a negative environmental impact (e.g., emissions during biogas combustion, etc.),
  • As sources of the indirect environmental benefits: (a) Grit (mineral by-products that consists mostly of sand collected from the streets), recovered from the mechanical separation processes and treated as a product for later release and use; (b) The avoided impacts resulting from differences in the values of standardized parameters characterizing wastewater streams, raw and treated; and (c) the amount of avoided environmental impacts resulting from the production of energy from the plant’s own sources, which in turn allows for the avoidance of consumption of an equivalent amount of energy from external sources.
Thus, such a structure of the inputs and outputs was conditioned by the structure of the data; no intermediate data from successive steps in the wastewater treatment process is available.
Wastewater streams (at process input and output) were modelled based on a set of standardized parameters characterizing wastewater streams, including:
  • COD;
  • BOD5;
  • total suspended solids (TTS);
  • total nitrogen (TN);
  • total phosphorus (TP);
  • arsenic;
  • chromium;
  • zinc;
  • cadmium;
  • copper;
  • nickel;
  • lead;
  • mercury;
  • silver;
  • vanadium;
  • total organic carbon;
  • anionic surfactants;
  • substances extracted with petroleum ether;
  • phenolic index;
  • mineral oil index (C10-C40);
  • chlorides;
  • sulfates;
  • silicon.
Thickening agents and flocculants, dehydrating and anti-foaming agents, and antiscalants (substances preventing struvite formation) have been adopted as additional (chemical) substances, as presented in the breakdown of trade names and quantities of consumed chemical substances. For the purposes of modelling environmental loads related to energy consumption, a profile of electricity production (consumed from the power grid for the purposes of purification processes) was also adopted based on data on the Polish electricity mix for 2019, according to data from PSE (Polish Power Grids). The share of individual energy sources in the mix is shown in Figure 4. This distribution represents the national average.
The data provided show that most of the electrical power used in the wastewater treatment processes came from the company’s own sources. A quantitative breakdown of the energy consumed for these purposes in 2019 is presented in Table 3.

2.2.3. Life Cycle Inventory (LCI)
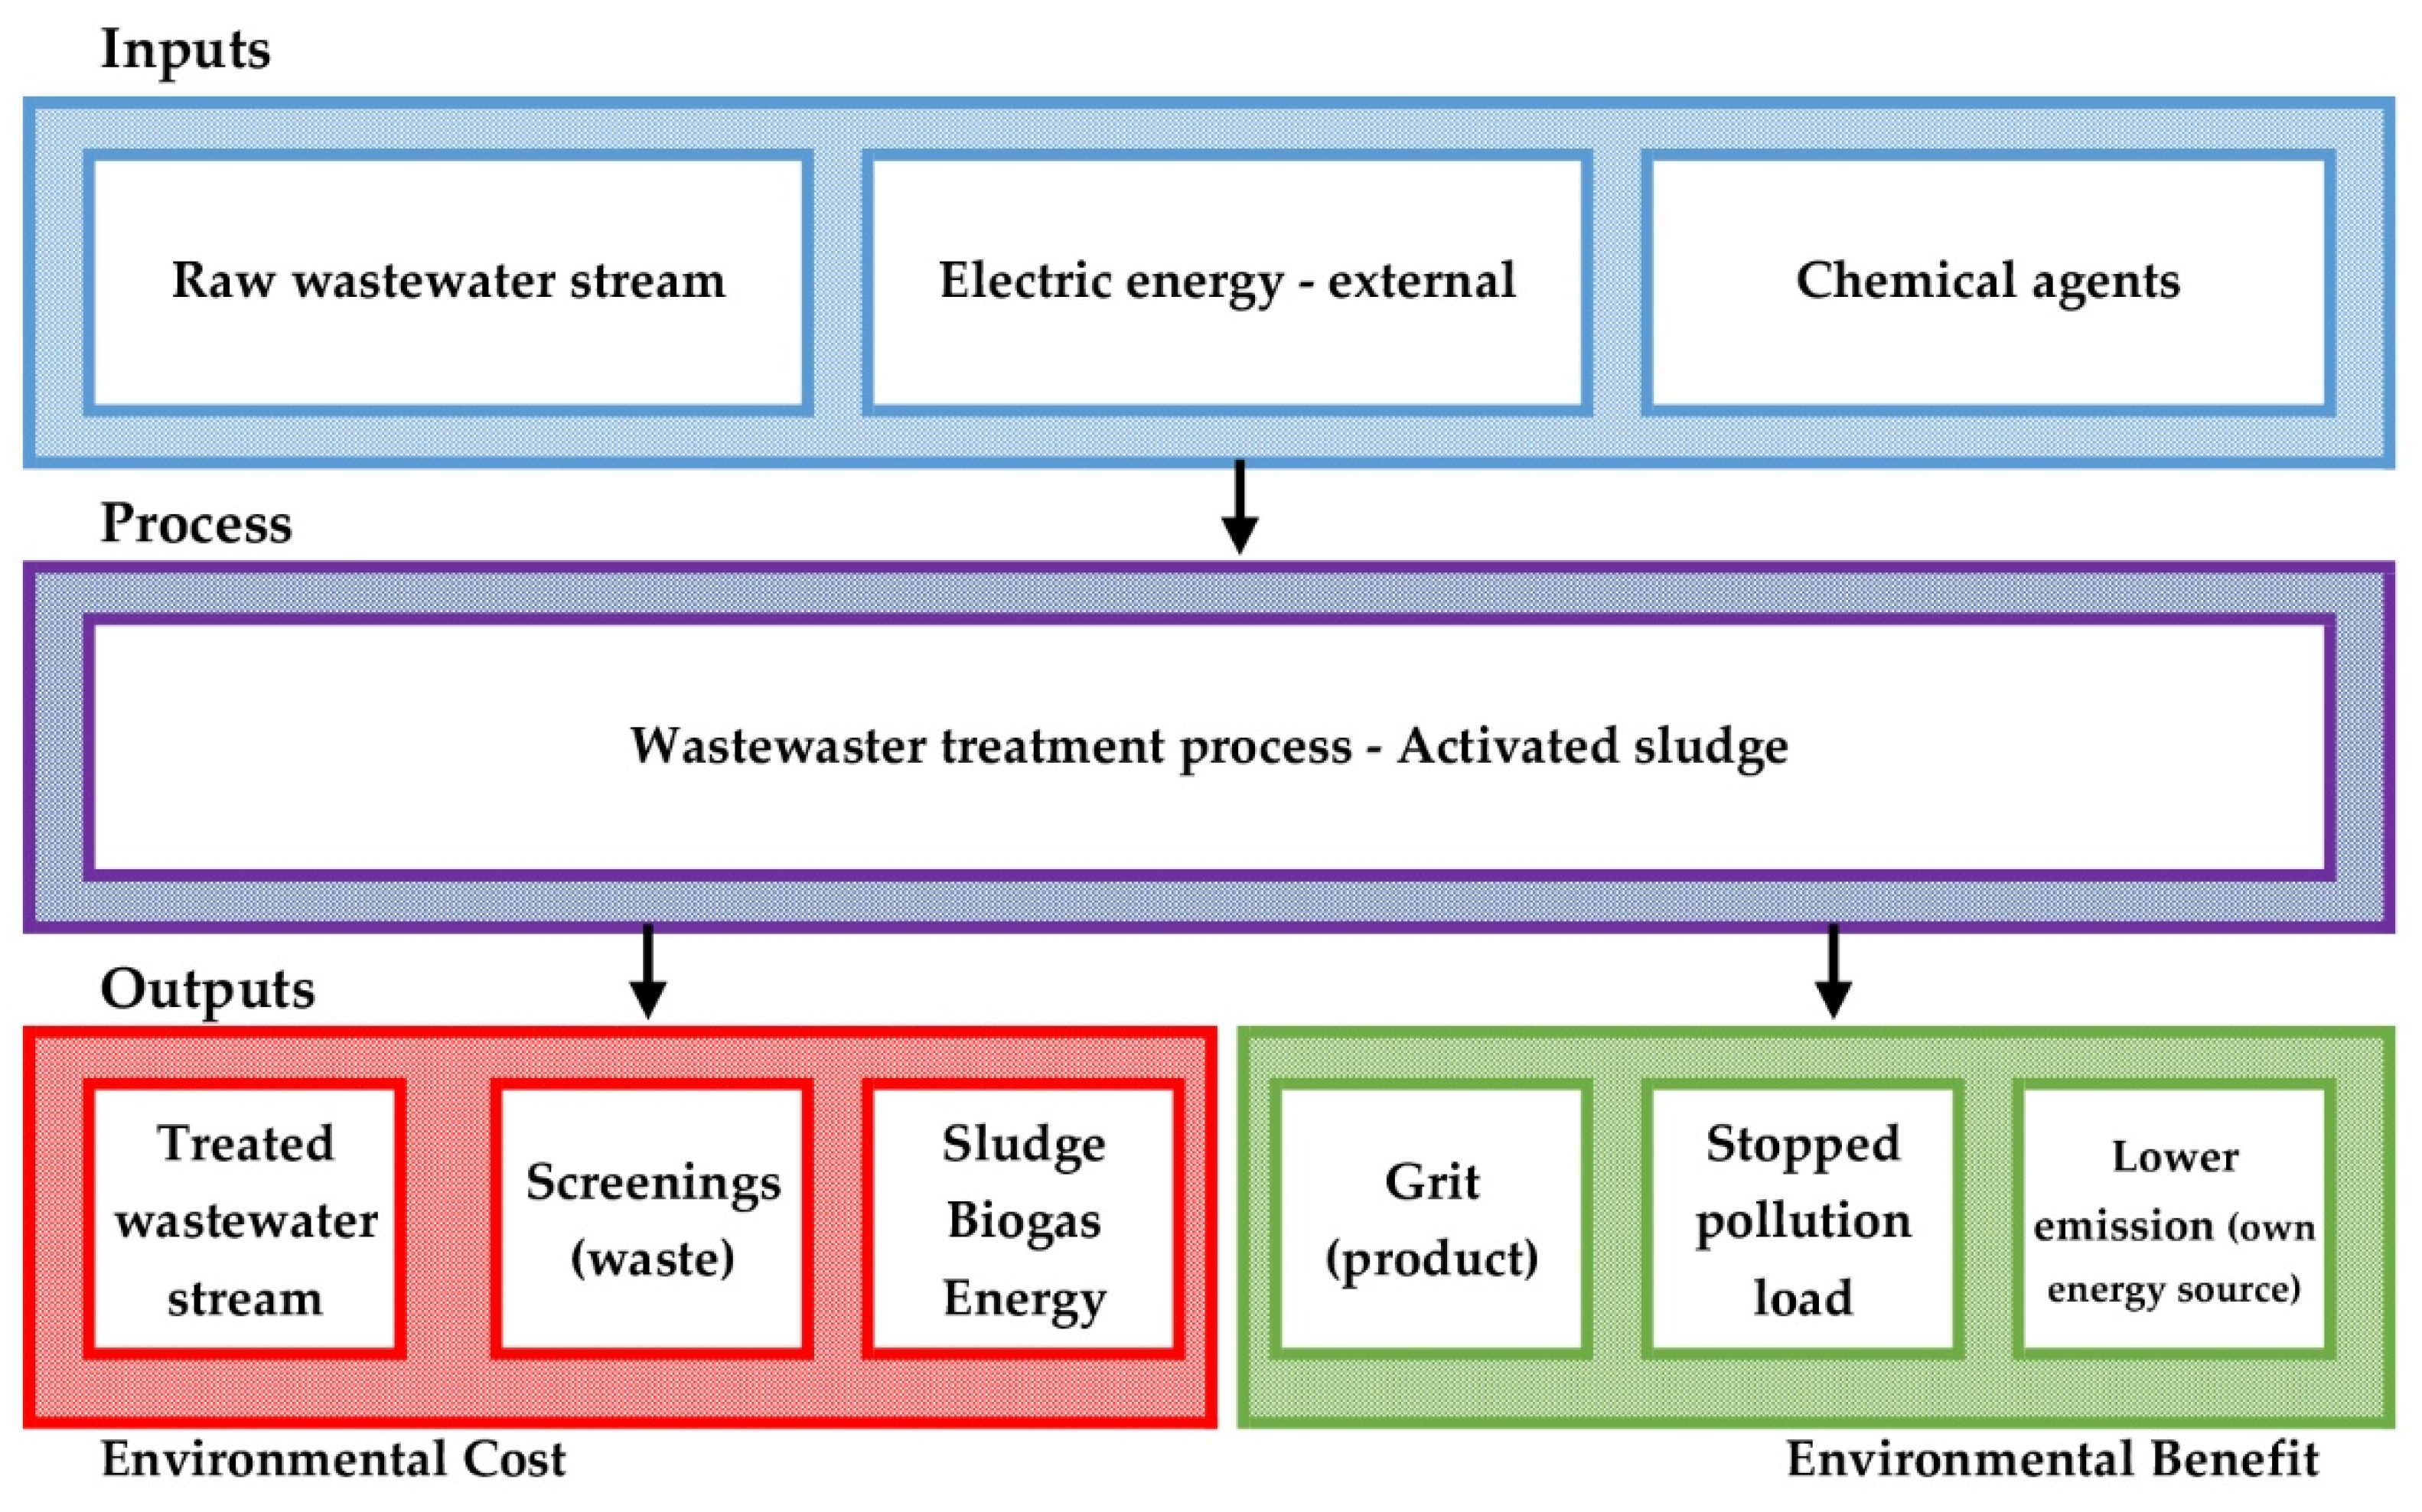
Process Inputs

In the period under analysis, the total wastewater flow through the plant was, as already mentioned in Section 2.2.2 of this study, 38,325,867 m3, broken down into individual months, as shown in Figure 2, and all consumption figures for individual utilities and materials refer to them as reference figures.
As already mentioned, wastewater streams are described with a set of standardized parameters. Their values for raw wastewater streams at the treatment process input are presented in Table 4.
Table 5 presents the values of concentrations of additional substances analyzed in raw wastewater.
The structure of electricity consumption in individual months by source is given in Table 3. It shows that, for the total amount of almost 21 GWh of electricity consumed in 2019, the production from the plant’s own sources (combustion of biogas generated from waste sludge) covered, on average, almost ¾ of the demand, fluctuating at around 62–89%. As a result of adopting the assumption described in Section 2.2.2, the amount of electricity drawn from the municipal grid was assumed to be the process input.
The implementation of treatment processes requires the supply of an appropriate amount of chemical substances that boost the technological processes. Their consumption in the reference period is presented in Table 6.

Process Outputs

The output wastewater stream was characterized by base parameters with values presented in Table 7.
Table 8 presents the values of concentrations of additional substances analyzed in treated wastewater.
As already mentioned in Section 2.2.2 of this study, in the analysis, the indirect environmental benefit of reducing the level of environmental loads as a result of the reduction of basic values and additional parameters analyzed for wastewater streams, and modelled as input, was assumed. These impacts were included in the model as “avoided” and were treated as an environmental benefit. Their magnitude results directly from the difference between the levels of standardized parameters characterizing the input wastewater streams (raw wastewater) and the output (treated wastewater discharged to a receiver) of the wastewater treatment process.
Moreover, grit and screenings (residues from mechanical separation) are also included as outputs from the treatment processes, and their quantities in the individual months of 2019 are given in Table 9.
Sludge is also treated as an output from the processes. Its total quantity, resulting from dewatering, in 2019 was 562,310 m3. The breakdown into individual months is shown in Table 10.
This sludge is provided from the anaerobic digesters (ADs), where biogas is obtained and used as fuel in energy processes. In 2019, about 7,755,000 m3 of biogas was produced, out of which just over 15 GWh of electricity was generated. This energy input is then fed into the wastewater treatment processes and, in our model, it has been treated as:
  • Electricity produced from ADs taking into account the environmental costs (emissions during production and combustion);
  • Electricity, whose consumption from the grid has been avoided, together with the environmental loads associated with its generation in accordance with the Polish electricity mix, as shown in Figure 4.
No other sewage sludge treatment options have been considered in this modelling phase.
As has been previously mentioned, the main limitations of the analysis are related to the time constraints (2019), the process model adopted (no intermediate data available), generalization of the sources of energy supported from the grid (Polish energy mix), and exclusion of sludge (mixture of dewatered PS and WAS) digestation, other than for use in internal energy production processes.

3. Results—Life Cycle Impact Assessment (LCIA)

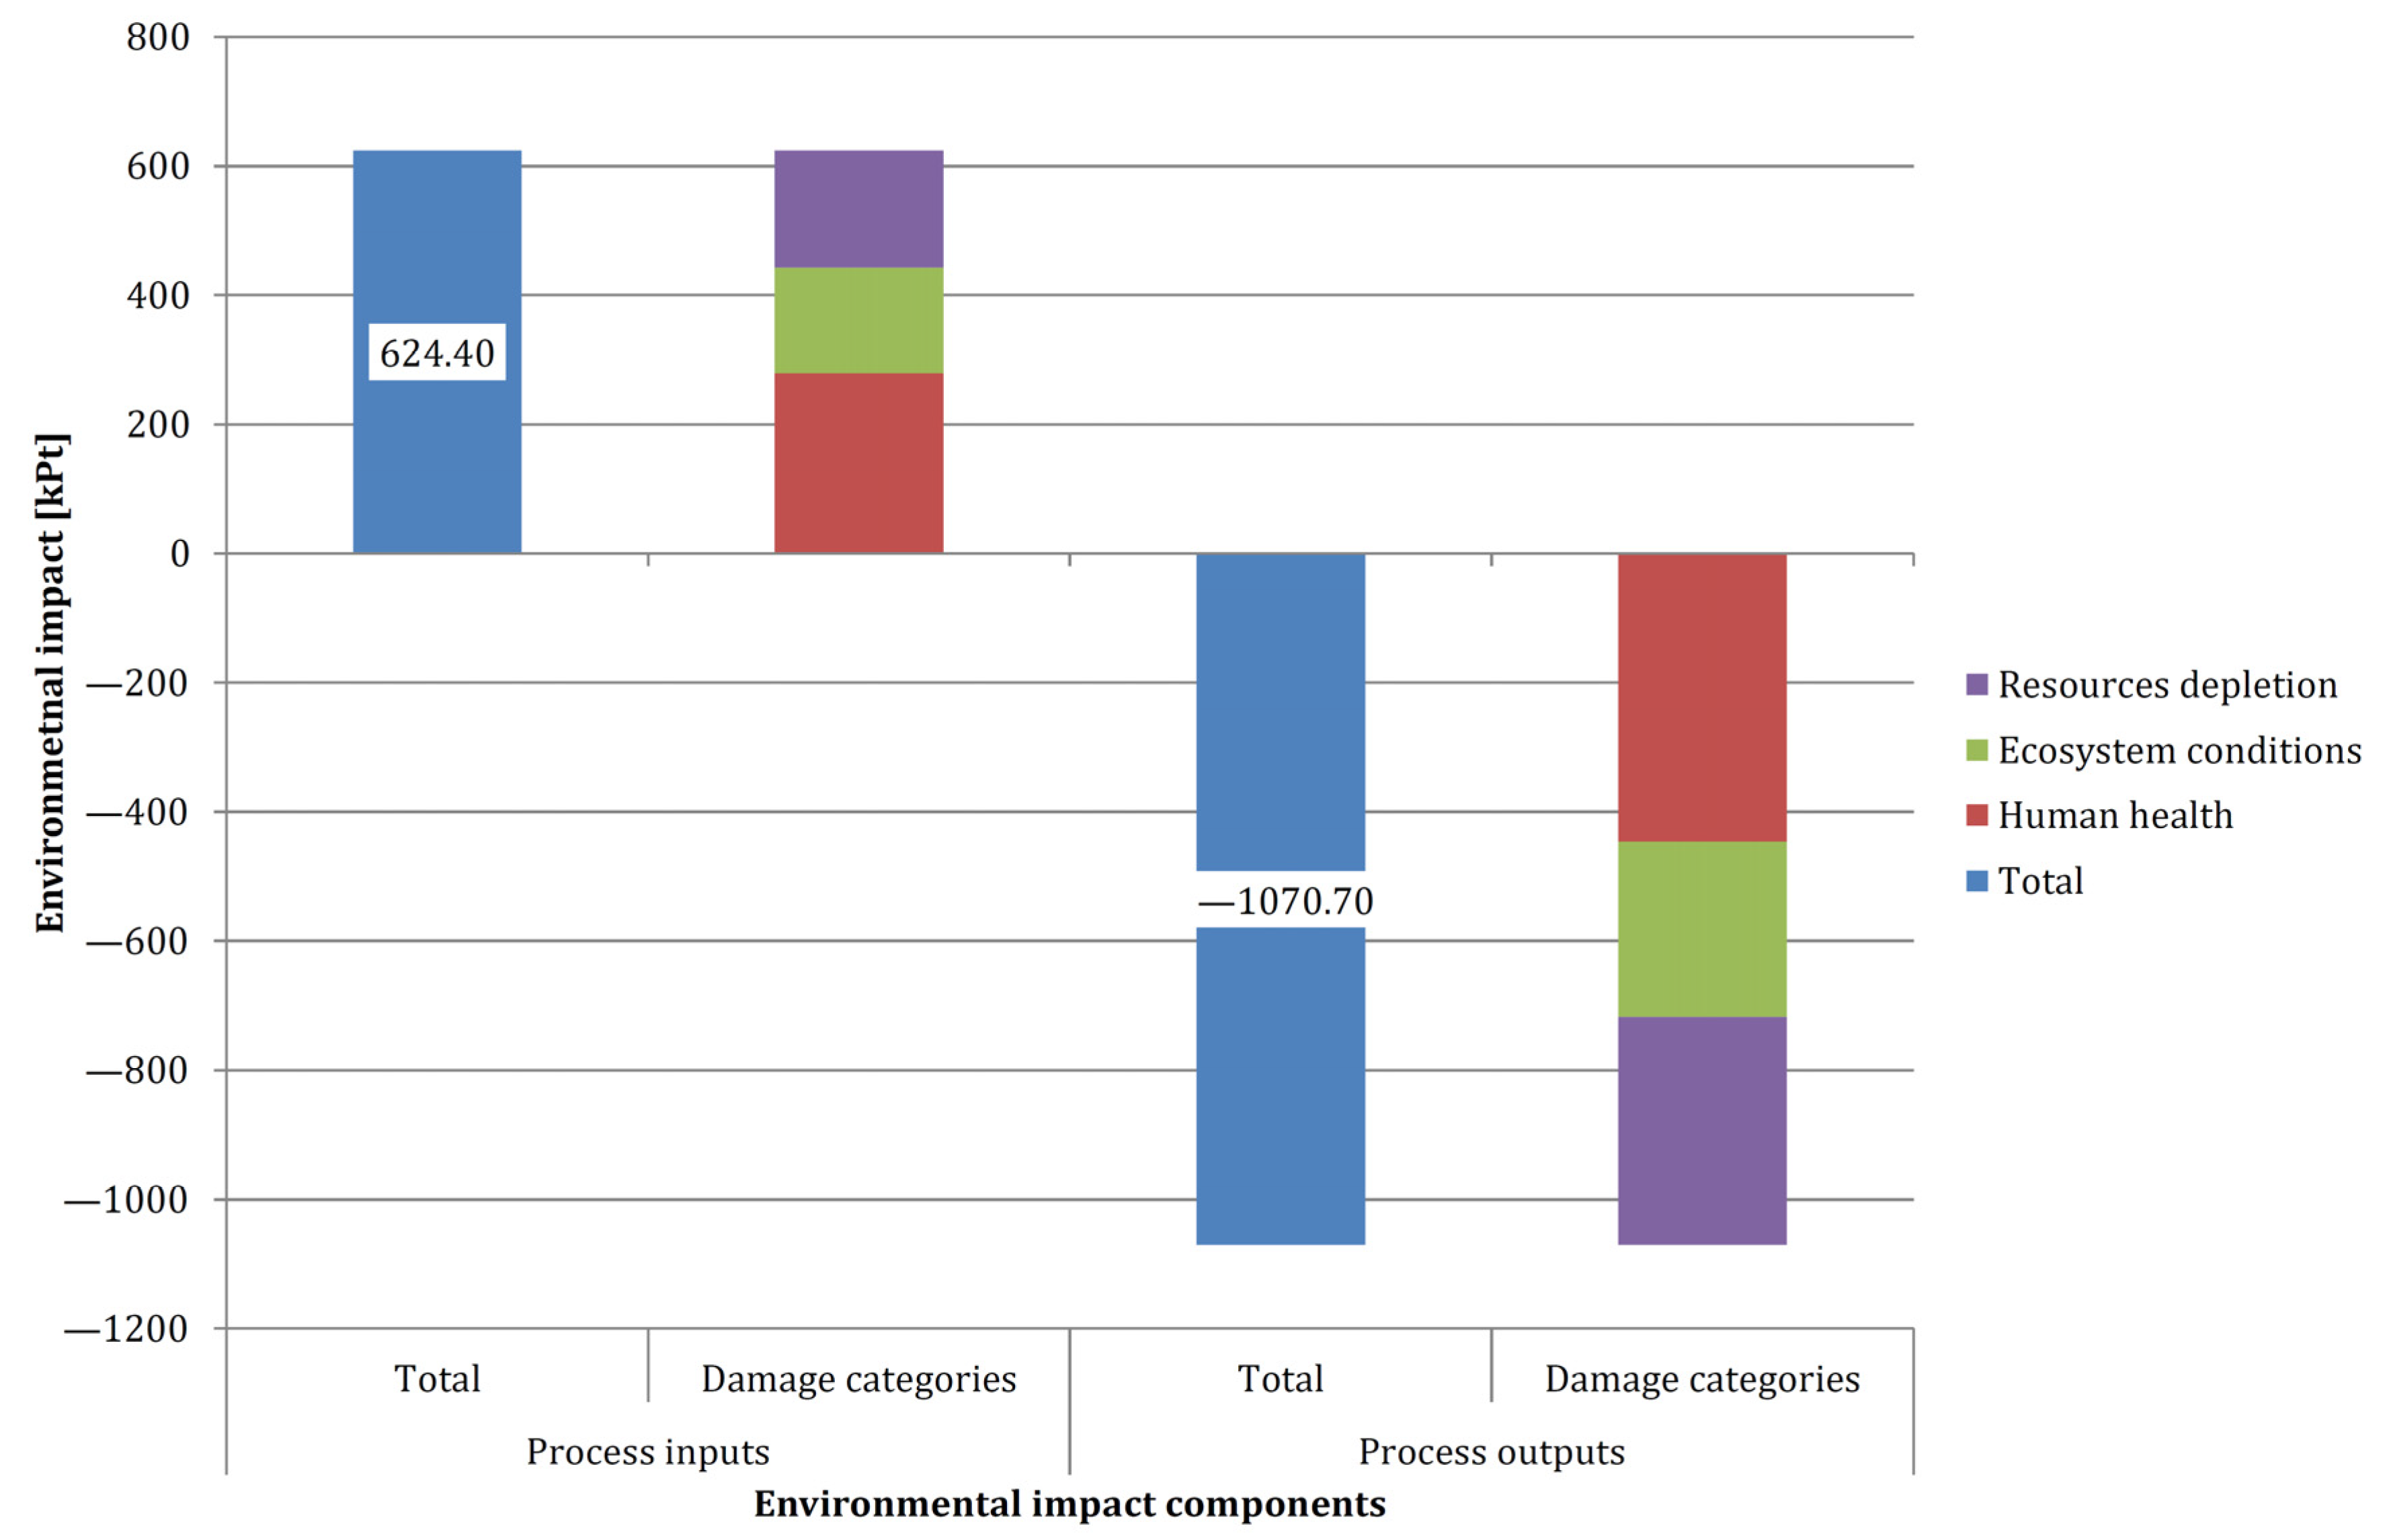
3.1. Overall Results—Comparison of Environmental Impacts for Process Inputs and Outputs

The results of environmental calculations for the wastewater treatment process at the CWWTP were first analyzed using a point scale (ReCiPe Endpoint (H) V.1.11/Europe ReCiPe H/A/Single score) to determine:
(a)
Aggregate values of total environmental impact indicators for the process under consideration in terms of (1) inputs (supplied resources) into the process and (2) outputs (received resources and environmental benefits) from the process;
(b)
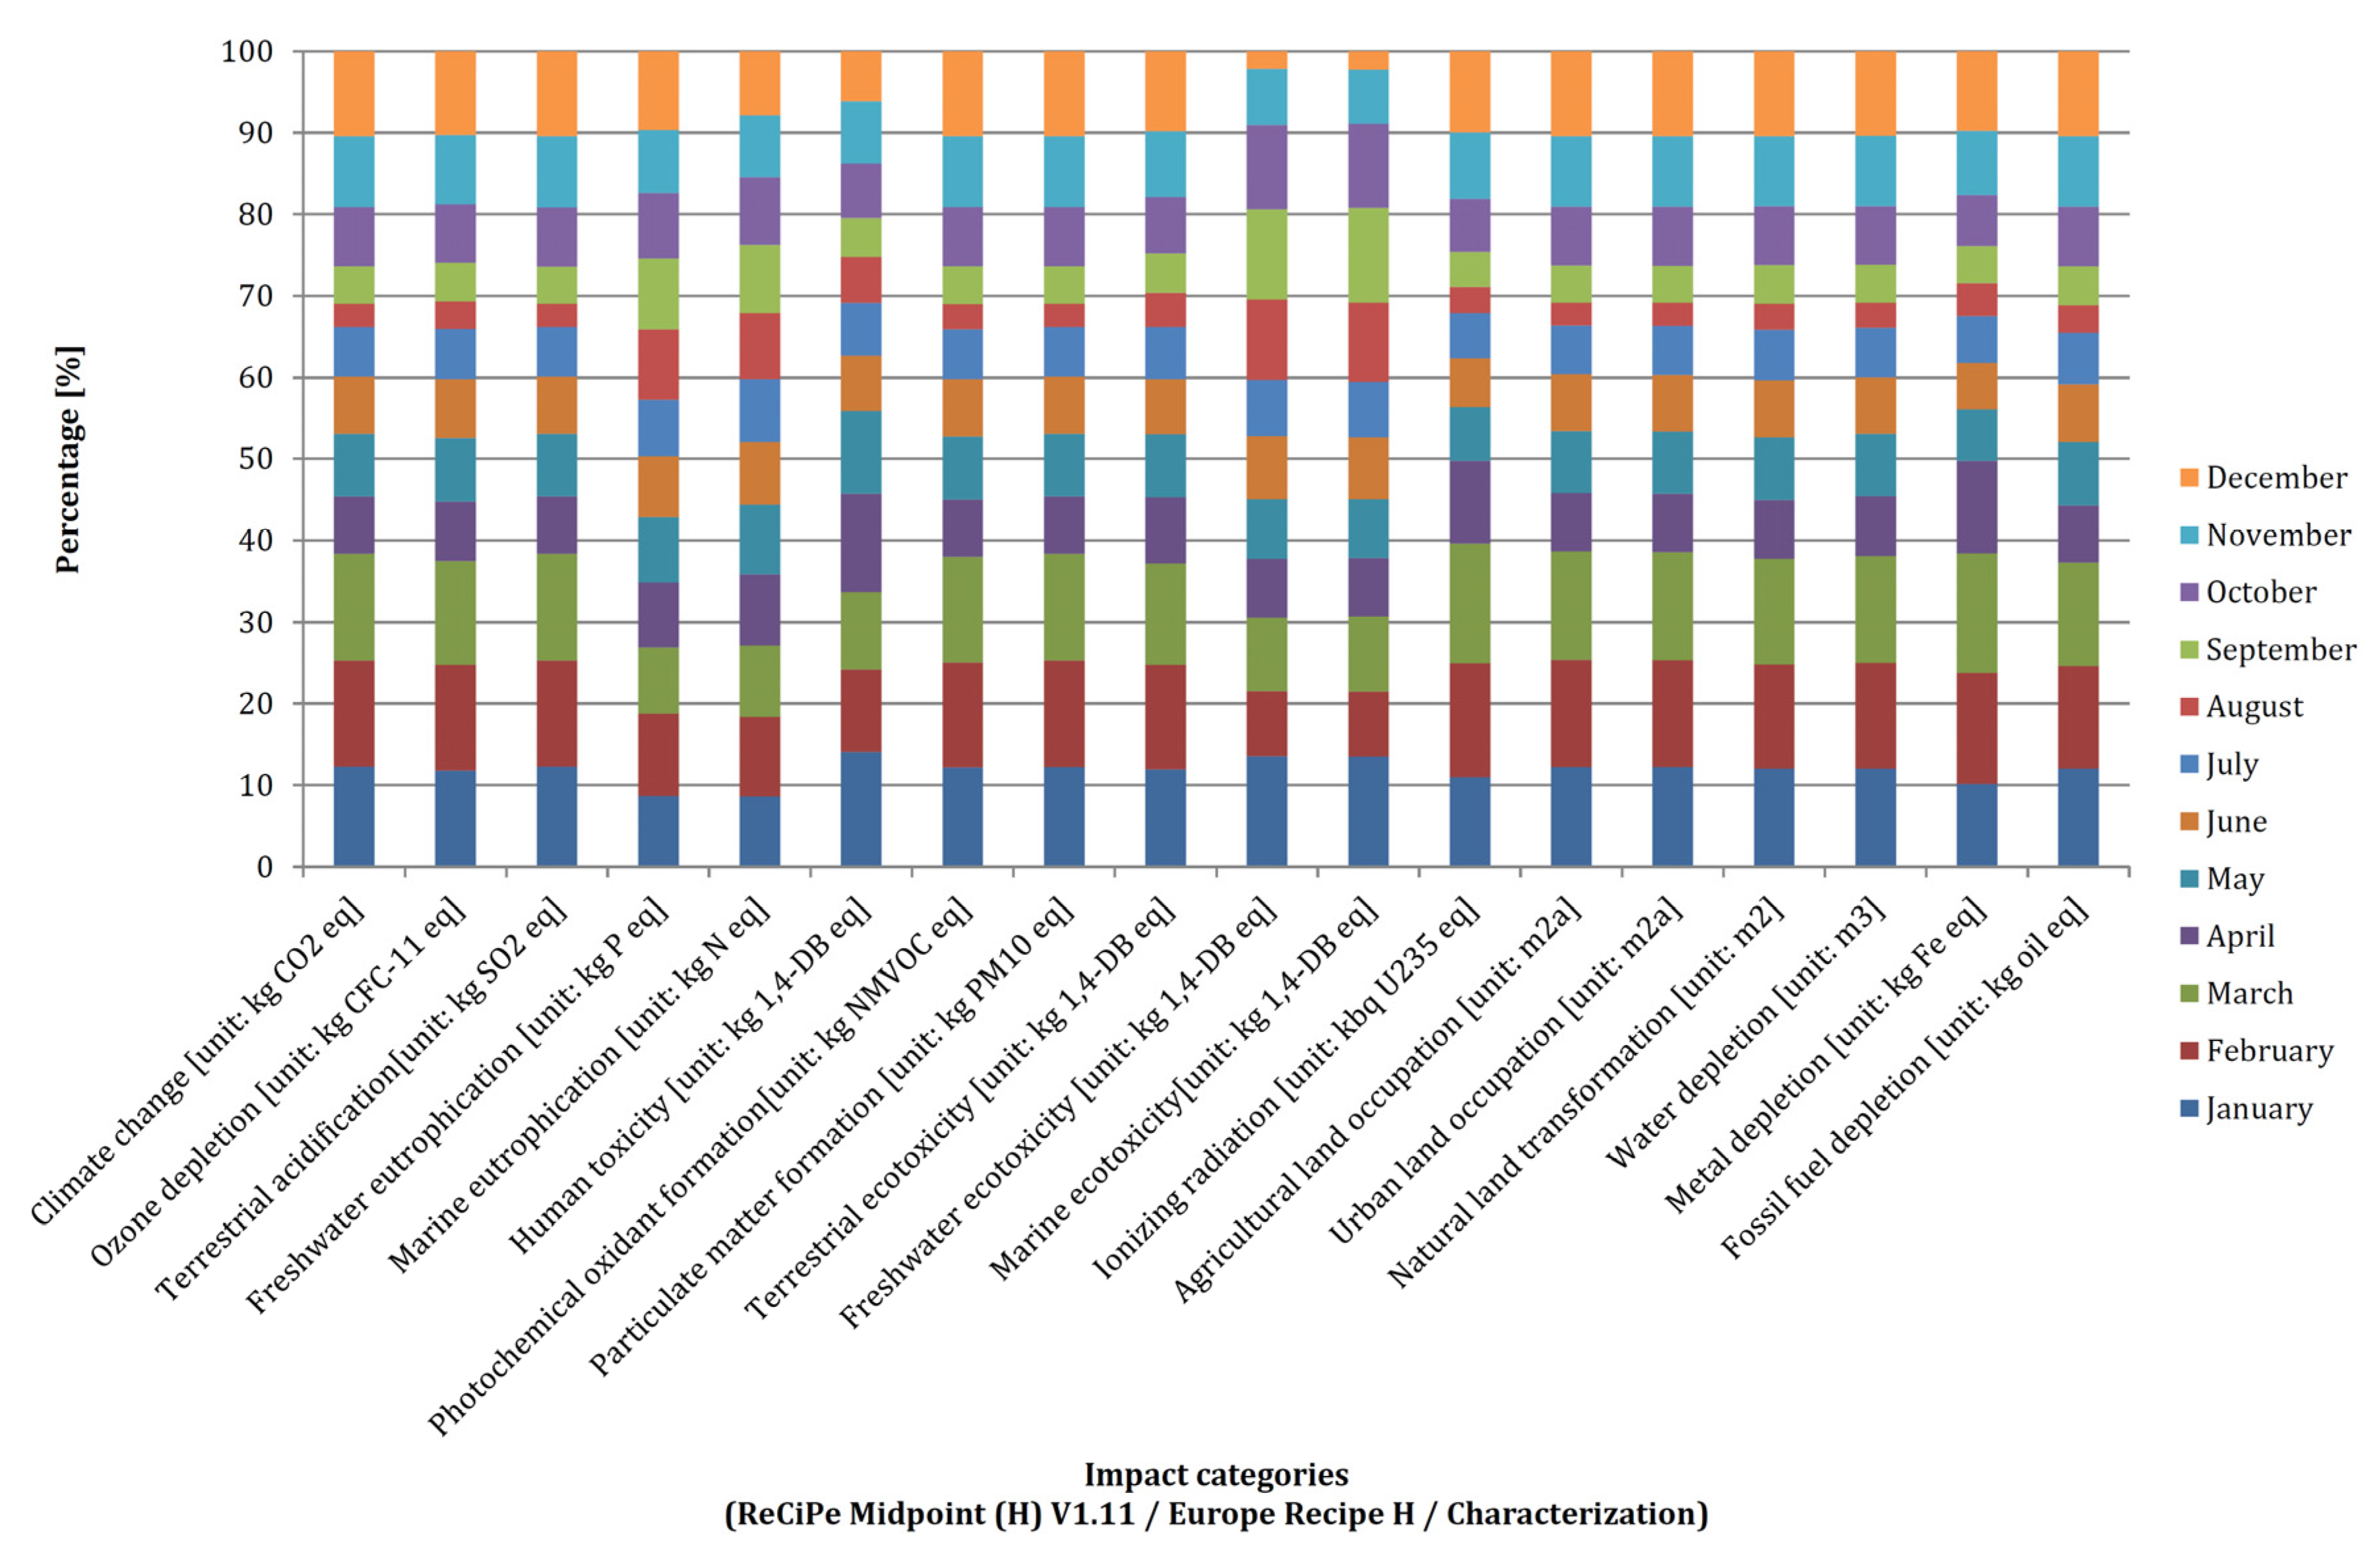
Distribution of environmental impacts in individual months of the analyzed period (separately for inputs and outputs);
(c)
Detailed determinant(s) of environmental costs and benefits.
Figure 5 shows the values of the total environmental impact indicators for general inputs and outputs of the wastewater treatment process. The list shows that the impacts of the inputs to the wastewater treatment process are actually loads (a positive value of the environmental impact indicator is recorded), while the impacts of the outputs from the wastewater treatment process are environmental benefits (negative value of the environmental impact indicator). Moreover, the figure shows the general environmental impact profile of the process inputs and outputs. It should be noted that the overall profile is dominated by impacts related to human health (almost 45% of the total for process inputs and just over 41% of the total for process outputs). Impacts related to resource depletion account for 29% of the total for process inputs and 33% of the total for process outputs.
When breaking down the damage categories into individual impact categories (detailed profile, Figure 6), it can be seen that a significant part of the impacts (almost 42% for process inputs and more than half for process outputs) is related to climate change (these impacts, according to the adopted calculation procedure, ReCiPe, are broken down into damage to human health and ecosystems). A significant share of impacts is associated with the depletion of fossil fuel resources (about 30% in the case of inputs and outputs) as well as burdens associated with human toxicity and the formation of particulate matter. Such a structure of both profiles is clearly indicative of the dominance of the energy intensive processes based on an energy mix typical for the combustion of fossil solid fuels.
Figure 7 presents the monthly distribution of total environmental impact indicators related to inputs to the wastewater treatment process. The breakdown shows that a significantly higher level of environmental loads is generated in the winter months and early spring (December–January). As the temperature rises in the following months, the level of loads connected to the process inputs decreases to reach the lowest values in the summer months (July–September). The general environmental impact profile for the breakdown of environmental impacts associated with inputs to the WWT process in individual month is also shown. Constant levels in the relationships between the different categories in the profiles can be observed. The general profile is dominated by impacts related to influence on the human health (41–49%); impacts within the other damage categories are lower: resource depletion 25–41% and ecosystem quality 24–33%.
The detailed profile of environmental impacts associated with wastewater treatment process inputs in individual months (Figure 8) is dominated by the burdens related to climate change (in terms of emissions of substances harmful to human health and ecosystems), depletion of fossil fuel resources and human toxicity. As already mentioned, this distribution of impact profiles is indicative of the decisive influence of the energy-intensity component.
Figure 9 shows the monthly distribution of total impact indicators related to outputs from the wastewater treatment process. Above all, please note that the indicators take negative values, which is equivalent to the potential environmental benefits from the implementation of this process. Besides, the behavior of indicator values in individual months is much more similar than for input entrances (the differences merely achieve 17%, while, for inputs, a three-fold difference was observed). What is more, the differences in the indicator values are not correlated to the season of the year (total indicators take the lowest values in December, February, and June, and the highest values are in April, May, and August). Additionally, for the general and detailed environmental profiles of wastewater outputs shown in Figure 9 and Figure 10, a behavior analogous to that described in Figure 7 and Figure 8 can be observed in individual months with the predominant mix-based energy consumption component, in which fossil fuels play a significant role.

3.2. Components of Environmental Impacts for Inputs and Outputs of the Wastewater Treatment Process

Characteristics of environmental impacts for individual components of the wastewater treatment process at the CWWTP (data for 2019) are presented below, grouped by inputs and outputs of the wastewater treatment process, in general, without a breakdown into data from individual months. It can be seen that the environmental impacts for the process inputs take positive values (they are thus environmental burdens), and for the process outputs they appear as negative values (thus being a manifestation of environmental benefits).

3.2.1. Components of Environmental Impacts for Inputs to Treatment Processes

Figure 11 shows the total values of environmental impact indicators for individual inputs to the wastewater treatment process. As already described in Section 2.2.2, it is assumed that the process inputs include the used water stream at the inflow to the process along with its characteristic values of loads, concentrations, quantities of the relevant additional analyzed substances, chemical agents supplied to the process to ensure its correct implementation, and electricity supplied to the process from external sources (from the municipal grid, generated based on the energy mix given in Figure 4).
From the general data presented in Figure 11, it can be seen that the consumption of energy from external sources is characterized by the highest values of environmental impact indicators. As mentioned in Section 2.2.2, consumption of electricity from external sources for the process needs ranged from 11 to 38% (depending on the month, being the highest in February and the lowest in August), which translated into consumption of about 5.75 GWh from the grid. With the assumptions resulting from the structure of the energy mix, such an amount translates into an environmental impact indicator of just over 500 kPt. The remaining input components have indicators with much lower values (pollutant loads in wastewater at the inlet with slightly over 90 kPt and total chemicals with less than 30 kPt). A decomposition of the general environmental impact indicator values for WWT inputs broken into individual damage categories (general profile) and into impact categories (detailed profile, Figure 12) is also shown. Significant differences in the behavior of profiles for the main process input components can be observed. The shape of the environmental impact profiles characterizing the electricity generated on the basis of the mix presented in Figure 4 is described in Section 3.1. Burdens associated with the impact on climate change dominate (in terms of human health and ecosystems). Moreover, the contribution of burdens associated with the depletion of fossil fuel resources is also noticeable.
A different environmental impact profile pattern can be observed for the remaining process inputs. For the wastewater stream at process input (characterized by the parameters described in Section 2.2.3), some of the environmental burdens relevant for the ReCiPe procedure were not observed at all (e.g., no impacts were found under the resources depletion-related damage category and for several other impact categories). The dominant burdens are those related to impacts on the (quality of) ecosystems (especially in terms of aquatic eutrophication) and impacts on human health (notably by emissions of toxic substances).
What can be observed in the behavior of the environmental impact profiles related to the use of chemicals in wastewater treatment; there is a very strong dominance of burdens resulting from the depletion of fossil fuel resources (almost 2/3 of the total impact), climate change directly affecting human health (about 15%), and ecosystems (about 9%). Such behavior of environmental impact profiles is characteristic for the dominant share of substances originating from the chemical industry (especially the petrochemical branch).

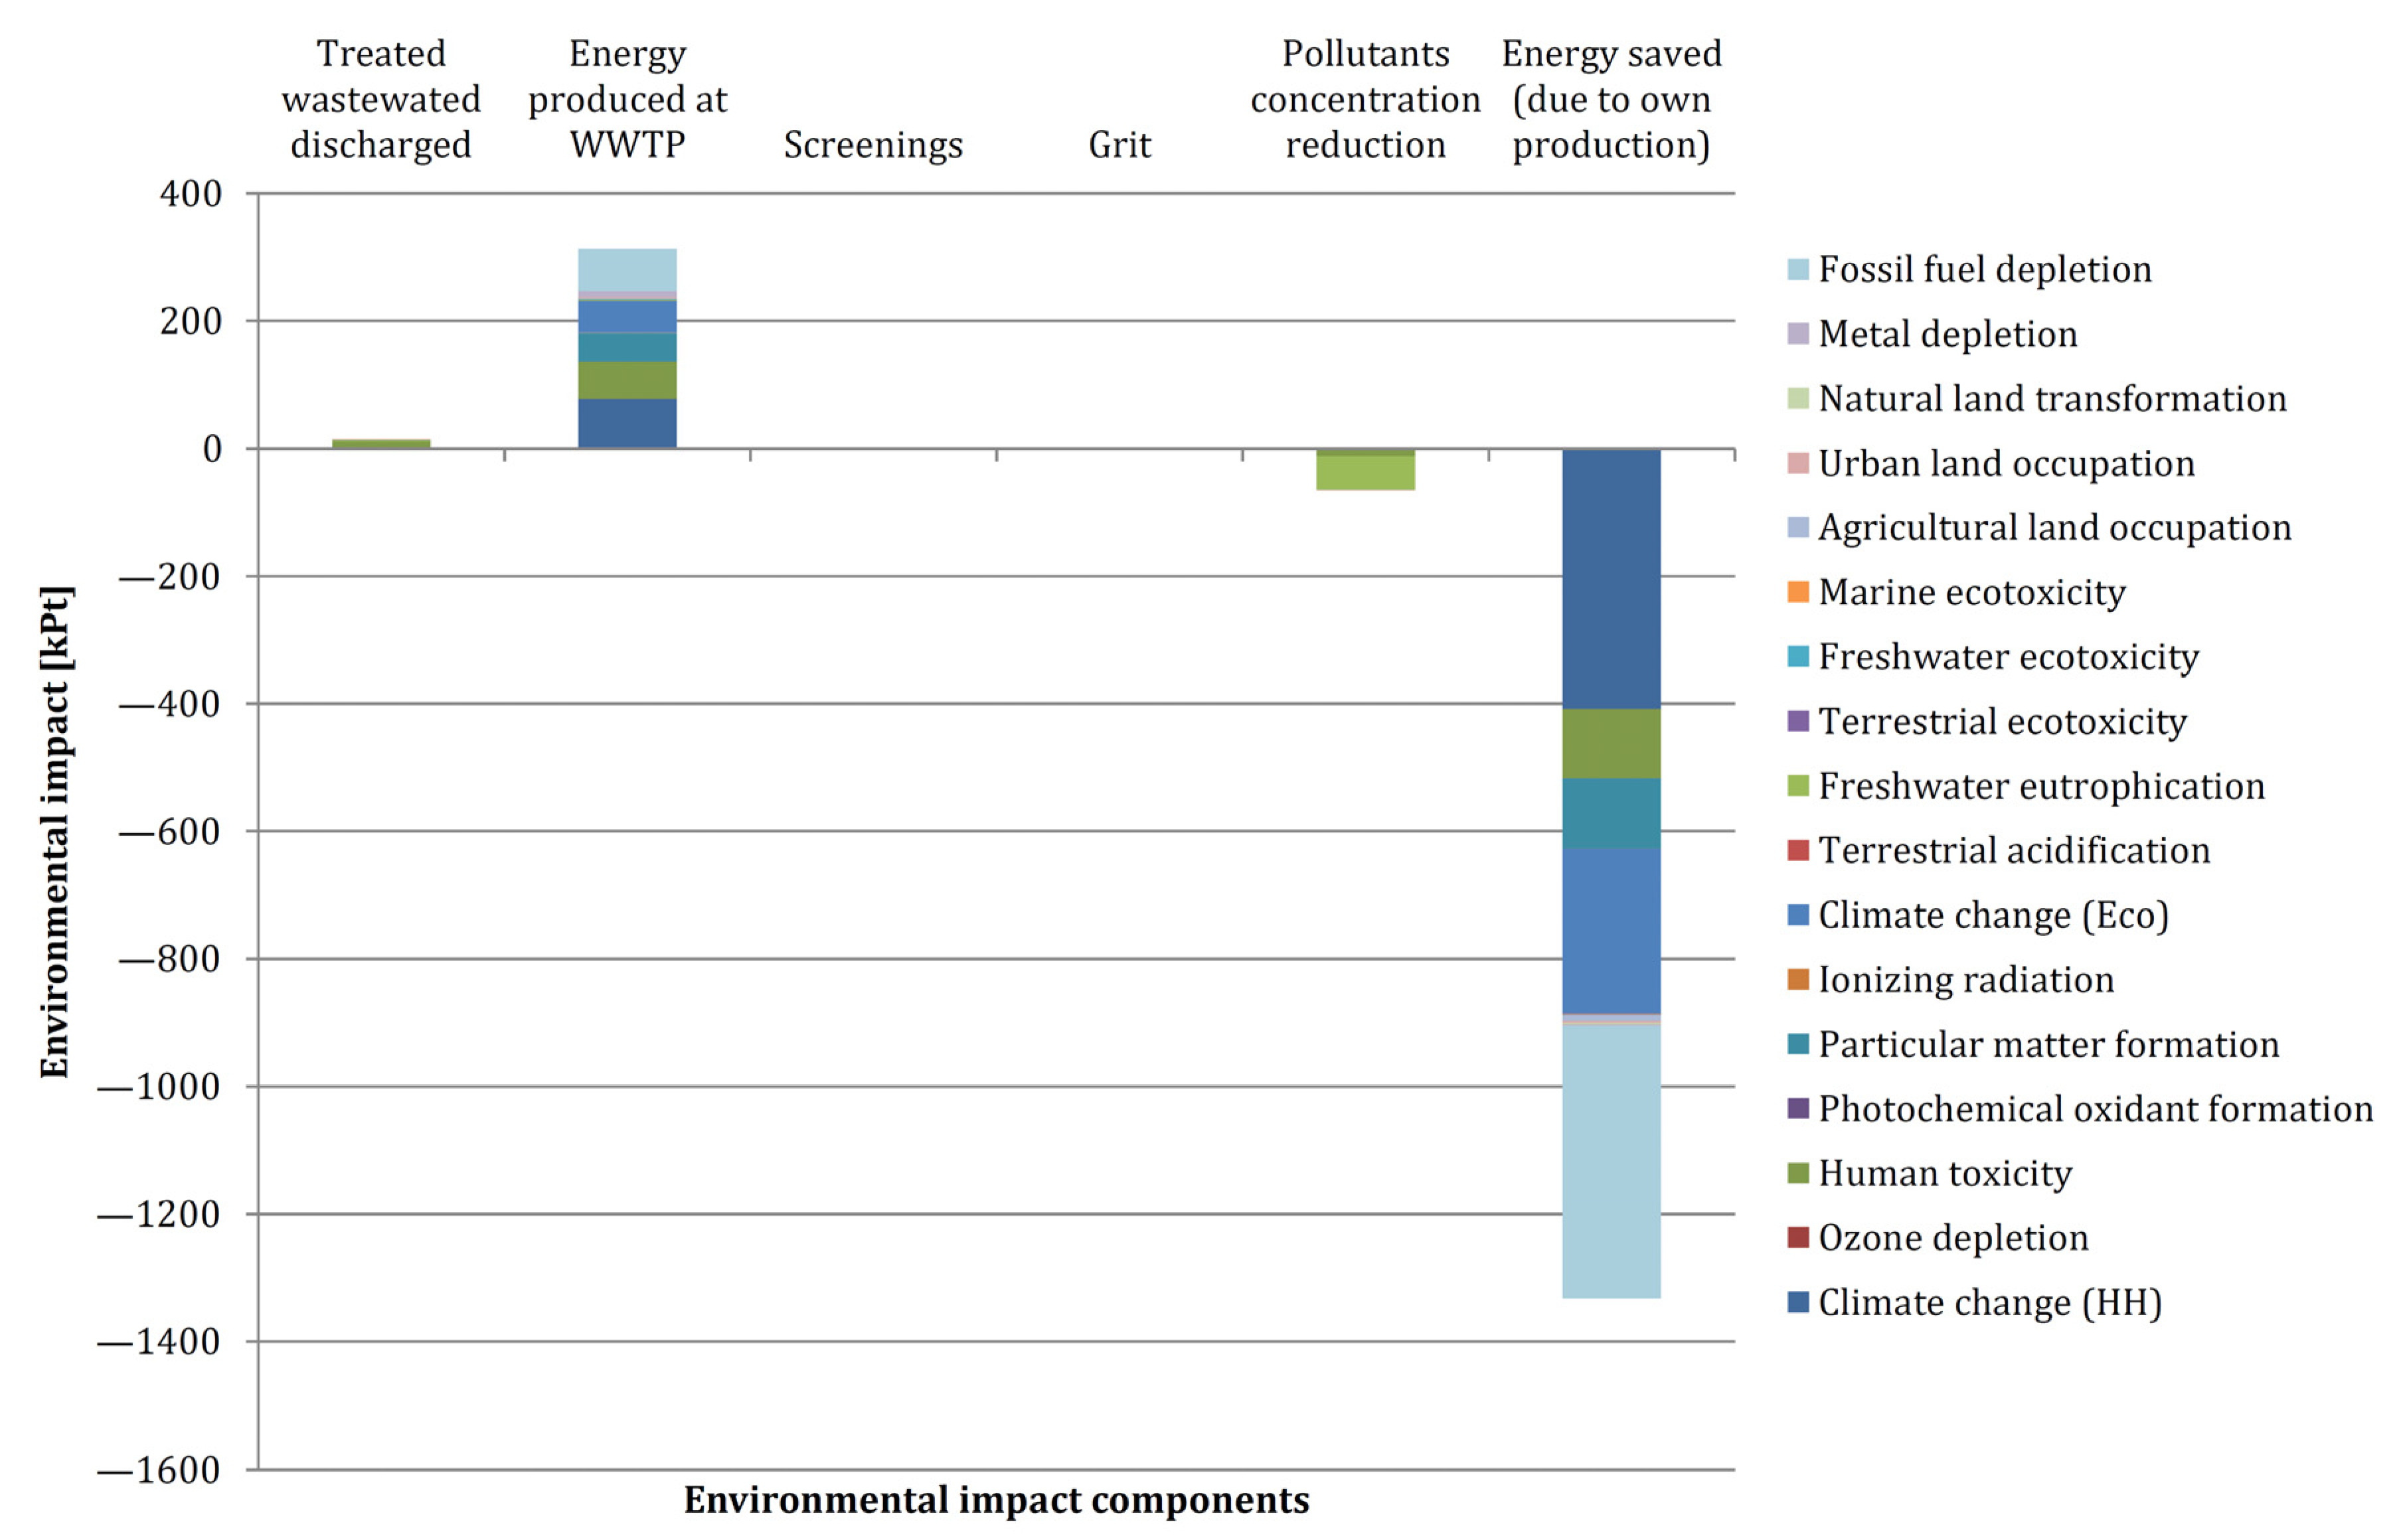
3.2.2. Components of Environmental Impacts for Outputs from Treatment Processes

Similarly, as for the information presented above, Figure 13 presents the general values of environmental impact indicators and the general environmental impact profiles for wastewater treatment outputs. As presented in Section 2.2.3, the stream of treated wastewater directed to the receiver (environment), grit and screenings as derivatives of mechanical and physical separation, and energy produced on the basis of the plant’s own sources (combustion of biogas produced in the anaerobic digesters (ADs) during sewage sludge digestion) were assumed to be direct process outputs. “Avoided” environmental impacts have also been assumed to be indirect outputs: reduction of concentrations (characteristic parameters) of substances (the difference between the concentrations at the process input and output) and emissions avoided as a result of energy production from own sources, and consequently avoidance of the corresponding energy consumption from external sources (produced on the basis of the mix shown in Figure 4).
It can be seen that all direct outputs (except grit) are characterized by positive (and therefore harmful from the environmental point of view) values of impact indicators. This state of affairs is commented fully in Section 4, with an emphasis on the reasons and consequences.
Negative values of environmental impact indicators (reflecting environmental benefits) mainly result from “avoided” emissions (directly by the reduction of concentrations and indirectly by avoiding electricity consumption).
Regarding the general and detailed (Figure 14) environmental impact profiles of WWT outputs, some of the profile components have already been discussed (e.g., wastewater concentrations and electricity produced based on the mix shown in Figure 4). It should be noted that the shape of the environmental impact profiles for energy produced based on sewage sludge fermentation in the SFC differs to some extent from the shape of impact profiles for energy generated based on the Polish energy mix. Compared to this, the environmental impact profiles for energy produced based on the plant’s own sources exhibits a significantly lower share of impacts related to climate change (in both aspects) and depletion of fossil fuel resources, while the share of impacts related to the emission of substances toxic to humans (from 8 to 19% of the total) and formation of particulate matter (from 8 to 14% of the total) increases.
The environmental impact profiles for mechanically separated solid waste (screenings, grit) are dominated by impacts related to greenhouse gas emissions (in both aspects), depletion of fossil fuel resources, and emissions of particulate matter, which is indicative of the energy intensity of the separation processes. Additionally, impacts associated with the transformation of natural land is clearly visible and also account for a significant portion of the general impact (about 10%), because grit resulting from mechanical separation can be managed whole (e.g., used for construction purposes), which in turn makes it unnecessary to source a similar amount of this raw material directly from the environment.

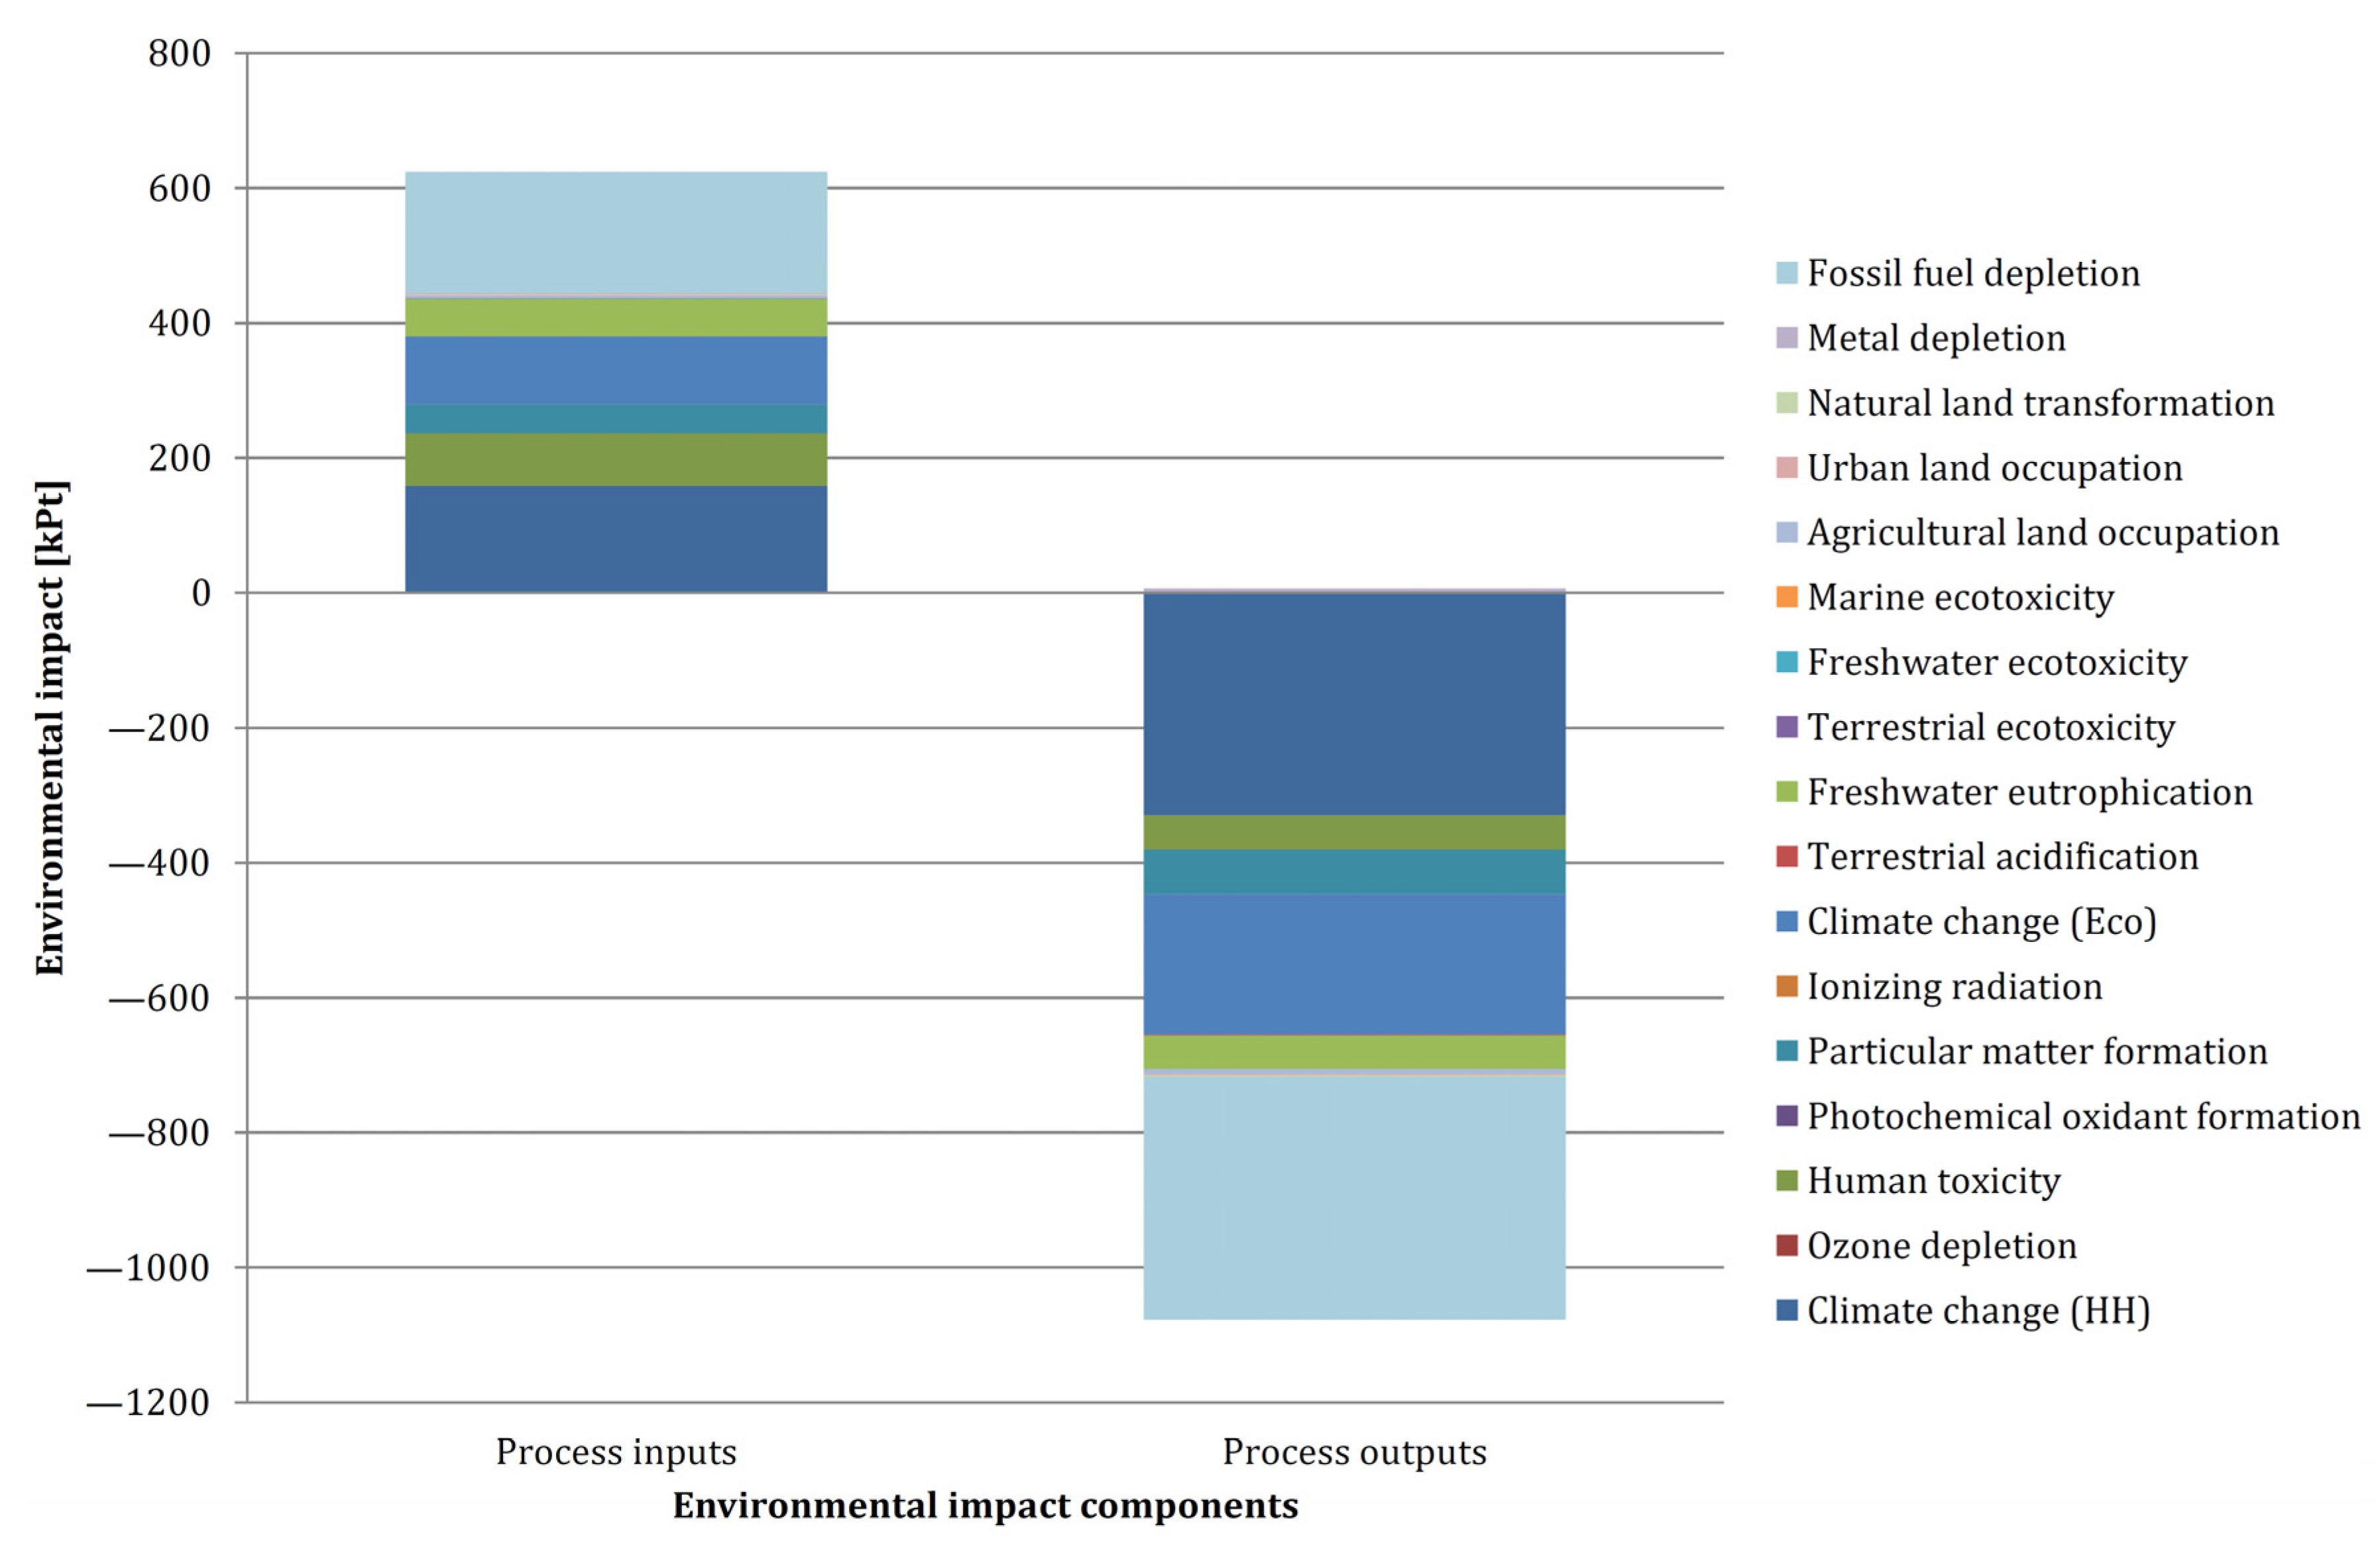
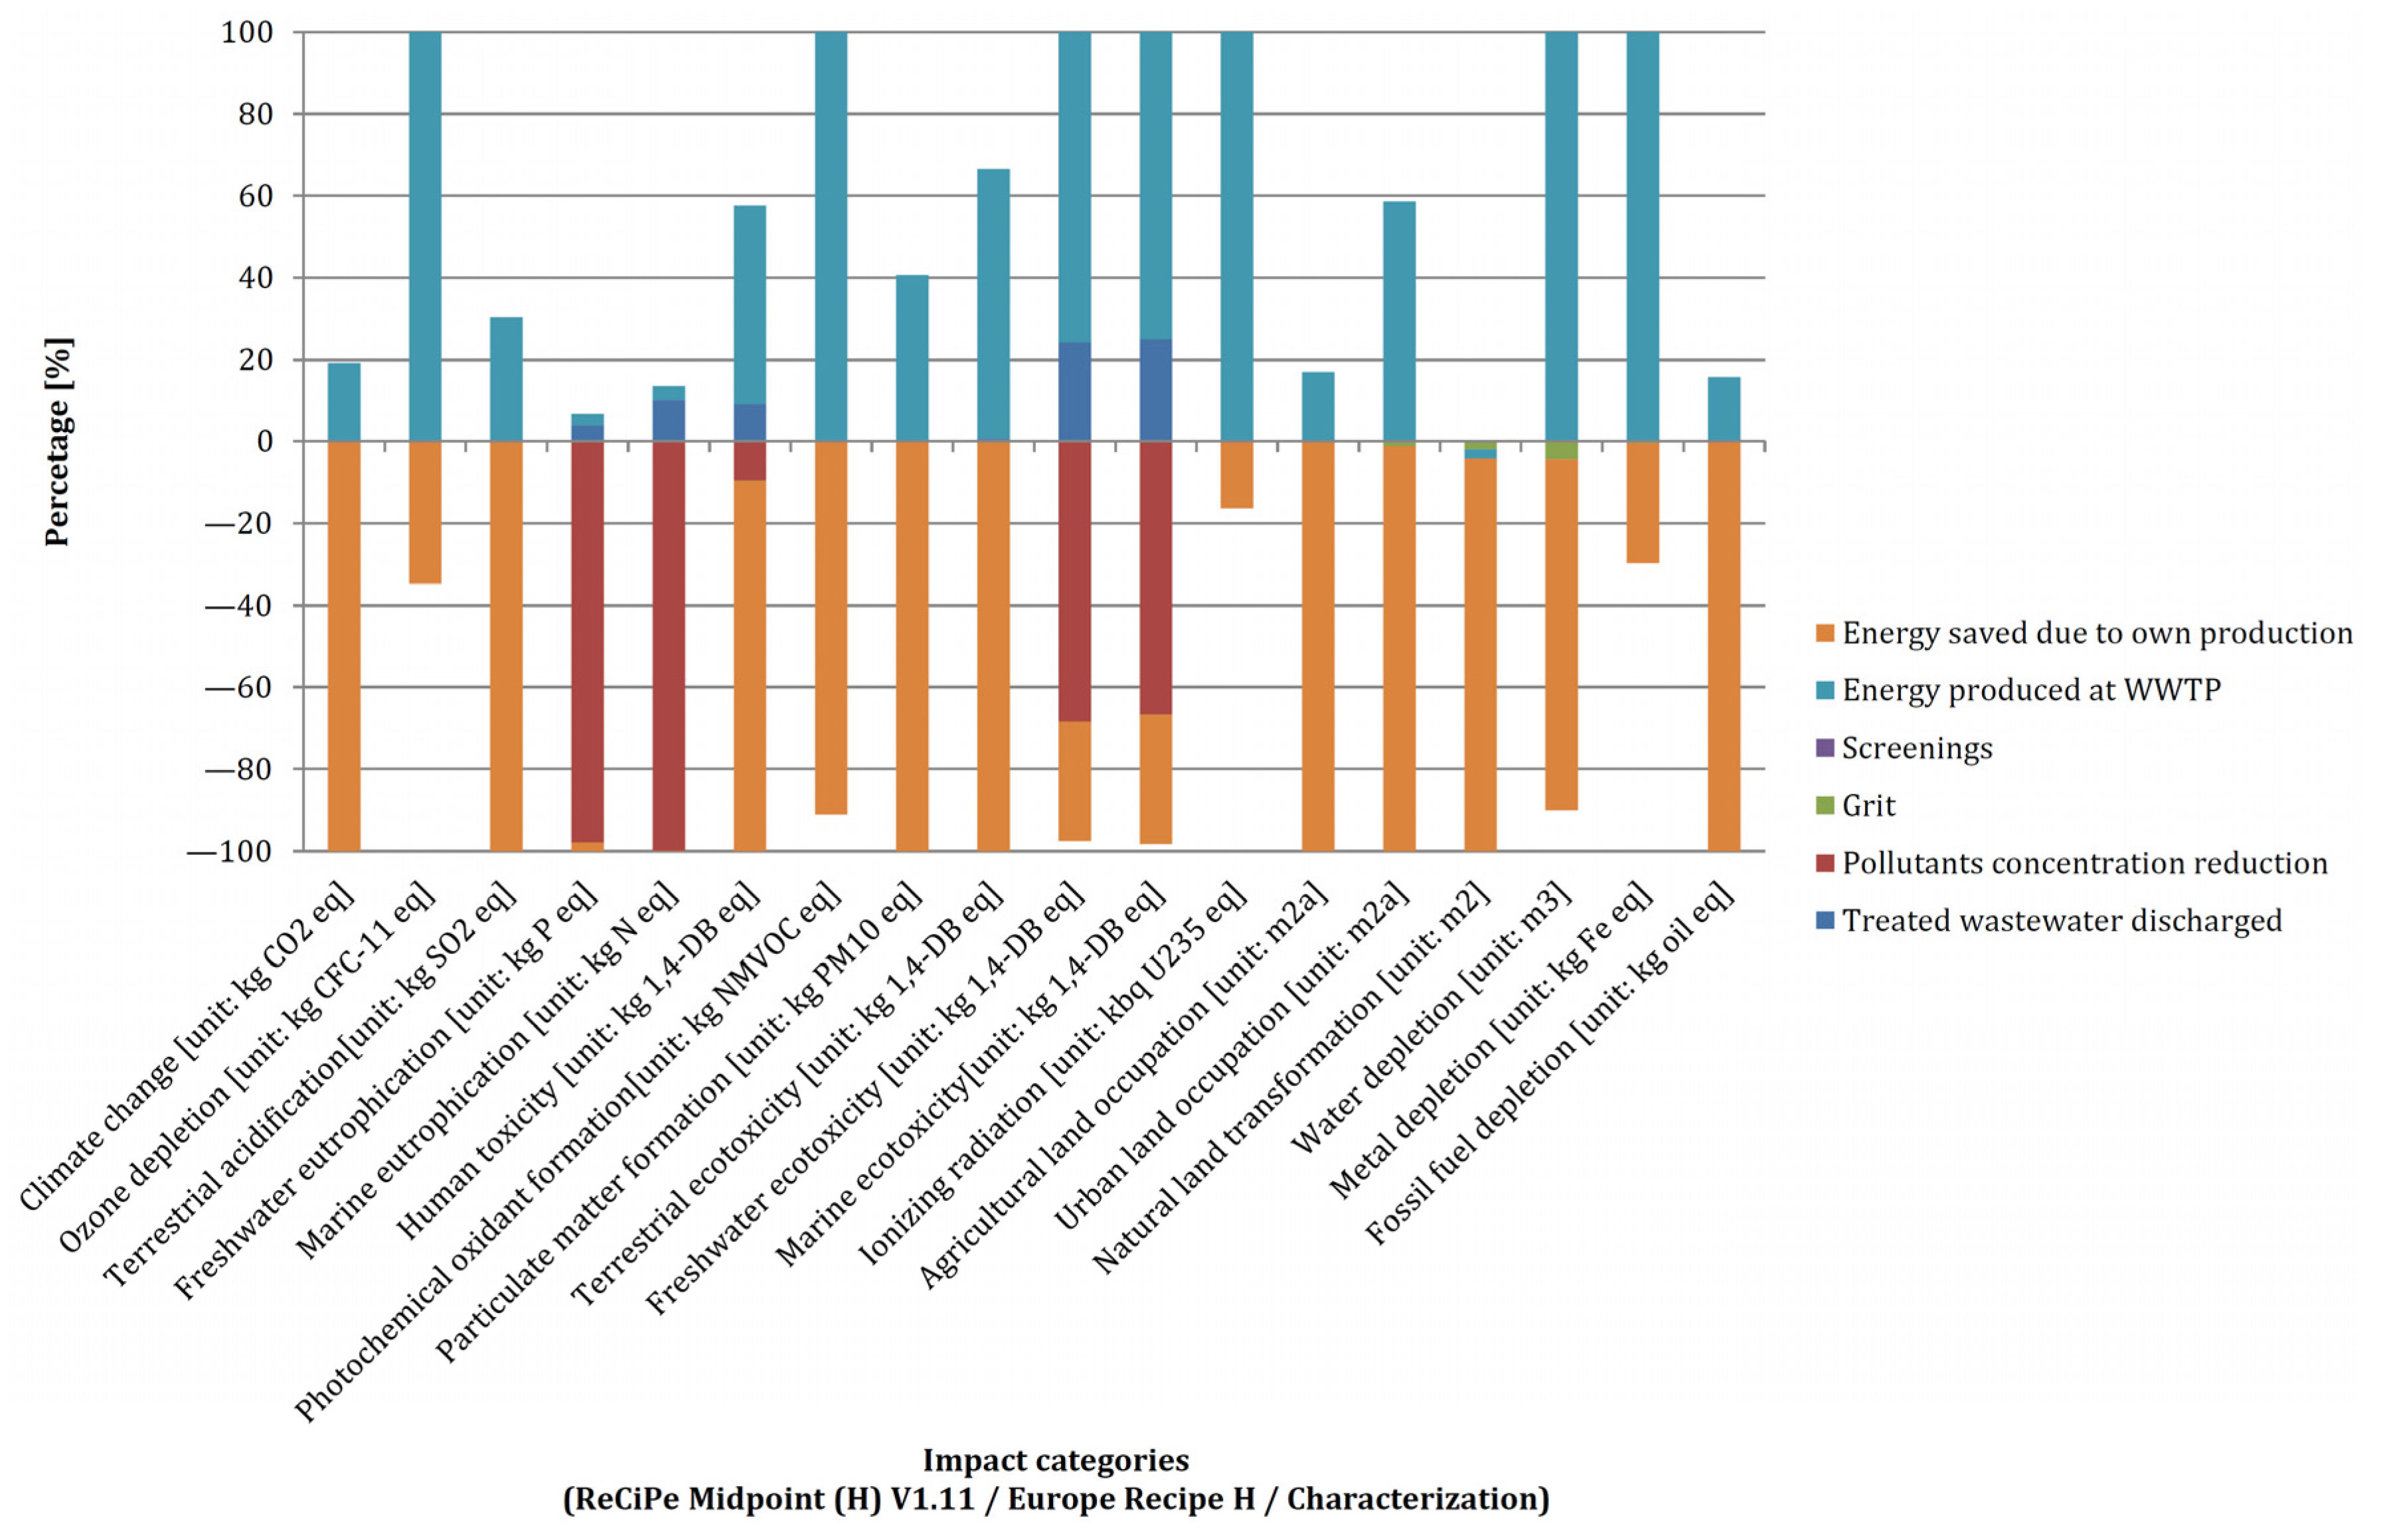
3.3. Analysis Results—Detailed Environmental Impact Profiles

Basic results of the characterization stage for wastewater management processes at the CWWTP for the 2019 data are described below. The characterization is the first stage in life cycle assessment, in which all interactions with the life cycle environment of the analyzed facility, or process, as in this case, are classified and divided into so-called impact categories (for the ReCiPe procedure used in this analysis, the list of impact categories is presented in Section 2.2.1). Each impact category represents a group of environmental impacts with a common mechanism of interaction with the environment. A common physical impact unit (the so-called equivalent) can be established for them, such as, e.g., kg CO2 eq. (equivalent kg of CO2 emissions) for an impact category relating to climate change, i.e., greenhouse gas emissions (for each substance in the group of greenhouse gases, the so-called CO2 equivalent is determined, i.e., the relevant number of kg of CO2 emissions that cause the same environmental harm as 1 kg of the substance in question).

3.3.1. Components of the Environmental Impacts for Inputs to the Treatment Process

Figure 15 shows a summary of the characterization stage results for inputs to the treatment process, with a breakdown into individual months of 2019. It should be noted that impacts are not evenly distributed over individual months; there is significant variability depending on the category under investigation. Impacts related to water ecotoxicity and ionizing radiation are characterized by the highest variability (range, 2.2–14.7%), whereas impacts related to eutrophication of water resources are the most stable (range, 7–10%). To analyze the causes of such a variety in environmental impact values for process inputs over individual months, a correlation with monthly values of flows together with the analysis of variability of characteristic parameters, consumption of energy, and chemicals would be needed.
Figure 16 shows the results of characterization for inputs to the wastewater treatment process for the individual components. For most of the impact categories, the impact of the energy-intensive component is decisive. However, for four impact categories (related to eutrophication and water ecotoxicity), the impact of harmful substances contained in the wastewater stream, together with their parameters, prove particularly significant. The impact of chemicals used in the wastewater treatment processes is particularly significant for impacts related to the depletion of metal and fossil fuel resources and ionizing radiation and destruction of the ozone layer, but it never exceeds 50%.

3.3.2. Components of Environmental Impacts for Outputs from the Treatment Process

Figure 17 shows a summary of the characterization stage results for outputs from the treatment process, with a breakdown into individual months of 2019. It is noticeable that, for most impact categories (regardless of the nature of the impact), the distribution of impacts over individual months follows a similar pattern, with the variability generally not exceeding 1% (with the exception of April and May, where variability within individual categories is slightly higher but still does not exceed 5%).
Only for two impact categories related to water ecotoxicity do the characterization results behave differently. Both positive and negative impacts fall within these impact categories and are the manifestations of:
  • Environmental damage/burdens for the quantities characterizing the wastewater stream at the outlet to the receiver;
  • Environmental benefits for quantities characterizing the reduction in the values of the characteristic parameters between the wastewater streams at the process inlet and outlet to the receiver.
For these two impact categories, the sign of the general environmental impact indicator changes over individual months; in January, February, June, August, October, and November, it takes negative values whereas, in the remaining months, it takes positive values. This state of affairs is related to the different volume structures of the individual impact components, particularly the values related to the stream of treated wastewater released to the receiver characterized by high variability (annual value: 13.4 kPt, monthly average value: 1.11 kPt, with a spread of 2.12 kPt).
Figure 18 shows the results of characterization for outputs from the wastewater treatment process for individual components. Please note that, for most impact categories, it is the share of the energy intensity component that is decisive:
  • In terms of direct environmental nuisance, the energy produced from the plant’s own sources and the combustion of biogas generated during sewage sludge fermentation in bioreactors;
  • In terms of potential environmental benefits, the avoided emissions associated with electrical power not consumed from external sources.
Only for the impact categories related to water eutrophication and ecotoxicity (fresh and marine water) could an indirect positive impact on the environment related to the reduction in the burdens of the environmentally harmful substances contained in wastewater streams be observed.
For most impact categories, potential indirectly beneficial environmental impacts prevail. In three cases (ozone depletion, emission of ionizing radiation, and depletion of metal resources), the impact is clearly negative, while for four (formation of photochemical oxidants, ecotoxicity, and depletion of water resources), burdens and benefits are balanced.

3.4. Uncertainty Analysis—Elements

It is obvious in the analytical works involving the live cycle models, that all the data are characterized by different levels of uncertainty, mainly resulting from variation/instability of the data and possible incompleteness or representativeness of the model acquired. In order to avoid the possible ambiguity resulting from the data variability and uncertainty, Monte Carlo analyses have been applied. The small volume of this paper does not allow us to present the full results of the uncertainty analysis; however, an example for process inputs is shown in Figure 19. For the round of 1000 runs and a confidence interval of 95%, it was noticed that the calculated impact was 624,400 Pt (624.4 kPt—please see Figure 5), the mean was 625,000 Pt (dashed red line), the median was 621,000 Pt (solid red line), the standard deviation (SD) value was 58,700 Pt, the coefficient of variation (CV) value was 9.37%, and the standard error of mean was 0.00297.

4. Discussion and Major Conclusions

The subject of the analysis included the environmental impacts arising from the implementation of the wastewater treatment process at the CWWTP (based on data from the period January–December, 2019). The analyzed data included inputs and outputs from the process under consideration, including:
  • Levels of relevant parameter values characteristic of the wastewater streams: raw and treated before release to the environment;
  • The chemical additives (chemical agents and reagents) needed for the process;
  • Electricity supplied to the wastewater treatment process from the outside, modelled on the Polish electrical power generation mix (according to the structure shown in Figure 4);
  • By-products of a wastewater treatment process seen as waste (screenings) or as a regular replacement for a product directly sourced from the environment (grit as sand), which can then be used in construction;
  • Energy generated from the plant’s own sources (combustion of biogas produced during sludge fermentation in bioreactors).
Moreover, two types of indirect environmental benefits associated with the implementation of the wastewater treatment process at the CWWTP were also taken into account. These were the impacts “avoided” as a result of:
  • Reduction of burdens from the wastewater as a result of the treatment process (the difference between the values of characteristic parameters at process input and output);
  • The absence of environmental burdens as a result of preventing the need for supplying (based on the above-mentioned energy mix) electrical power in an amount equal to that produced from the plant’s own sources.
As mentioned previously, at the stage of the analysis presented in the study, only the method of sewage sludge management by processing it in bioreactors and producing biogas for energy purposes is taken into account; this process is simplified, and the amount of electricity produced was assumed to be its result.
The environmental impact levels (on a relative point scale and as results of characterization as physical units—see Section 3.3) were estimated in total (annual perspective), and monthly distribution was calculated for:
  • Inputs to the wastewater treatment process;
  • Outputs from the wastewater treatment process.
The analysis of the results obtained allows us to conclude that:
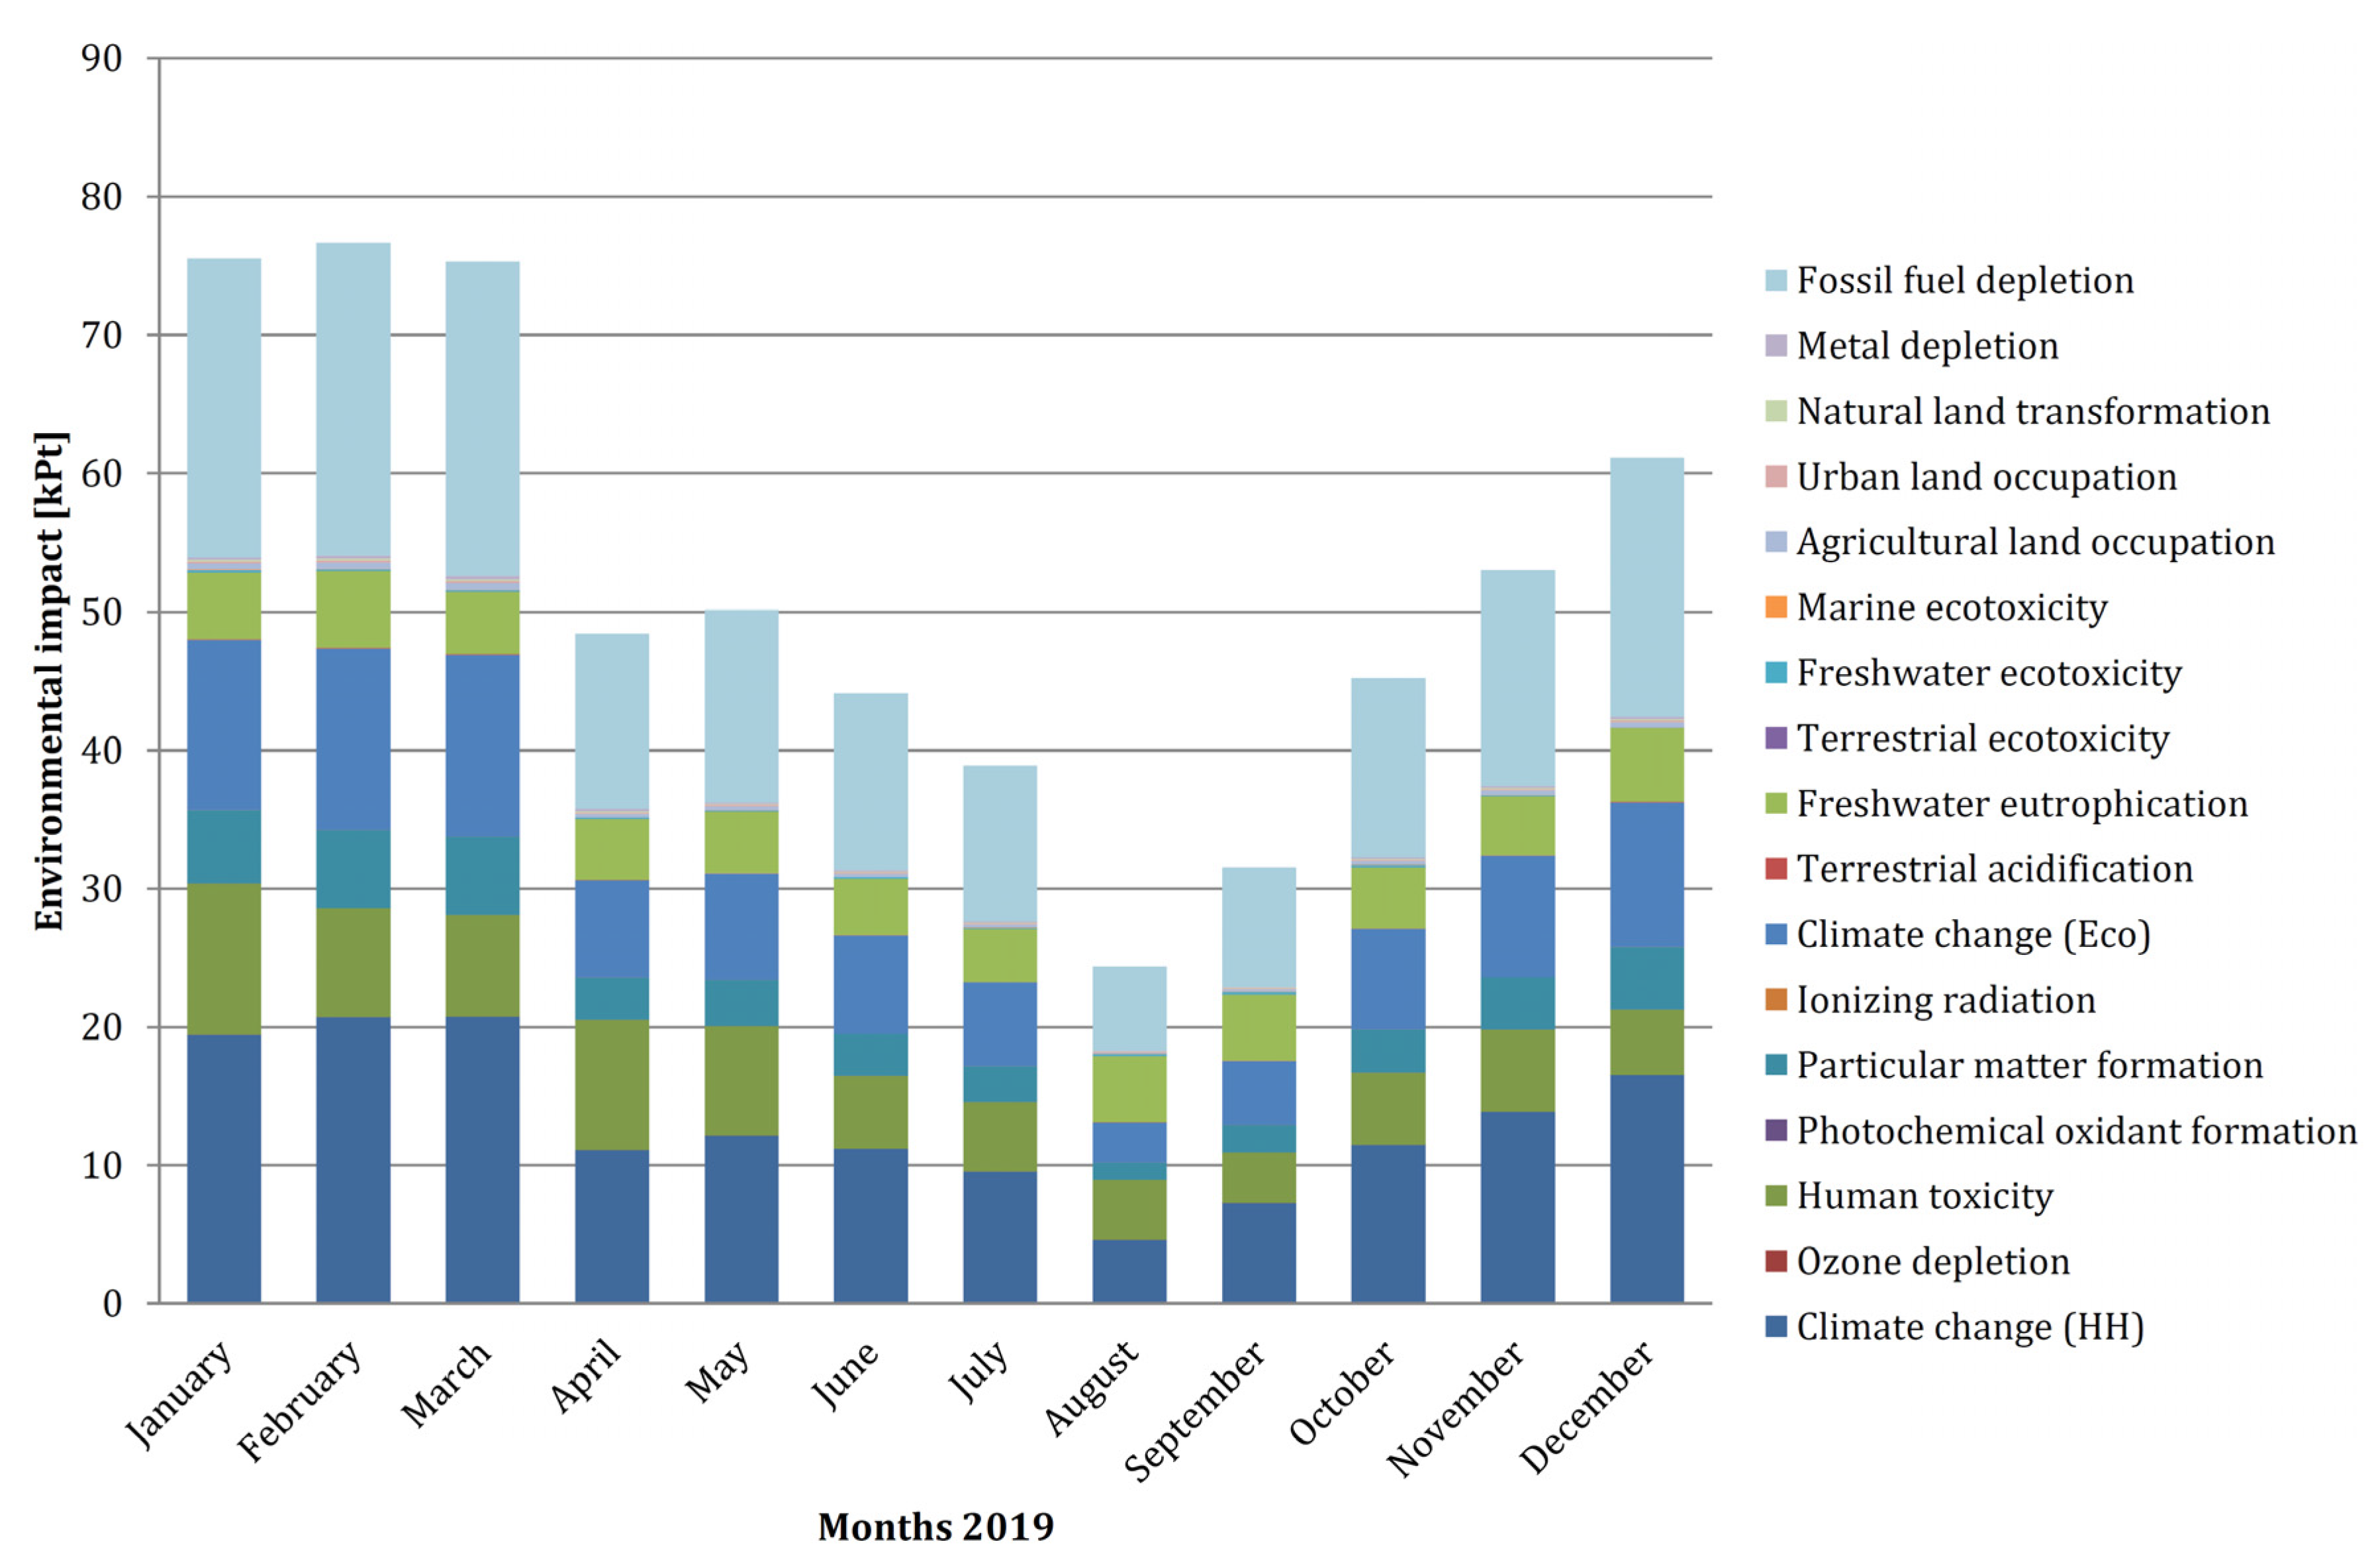
  • Estimated environmental impacts for the inputs to the wastewater treatment process are environmental loads. They take positive values for all components of the process inputs: the raw wastewater stream that fed into the process, the chemical reagents used, and the electricity supplied from external sources.
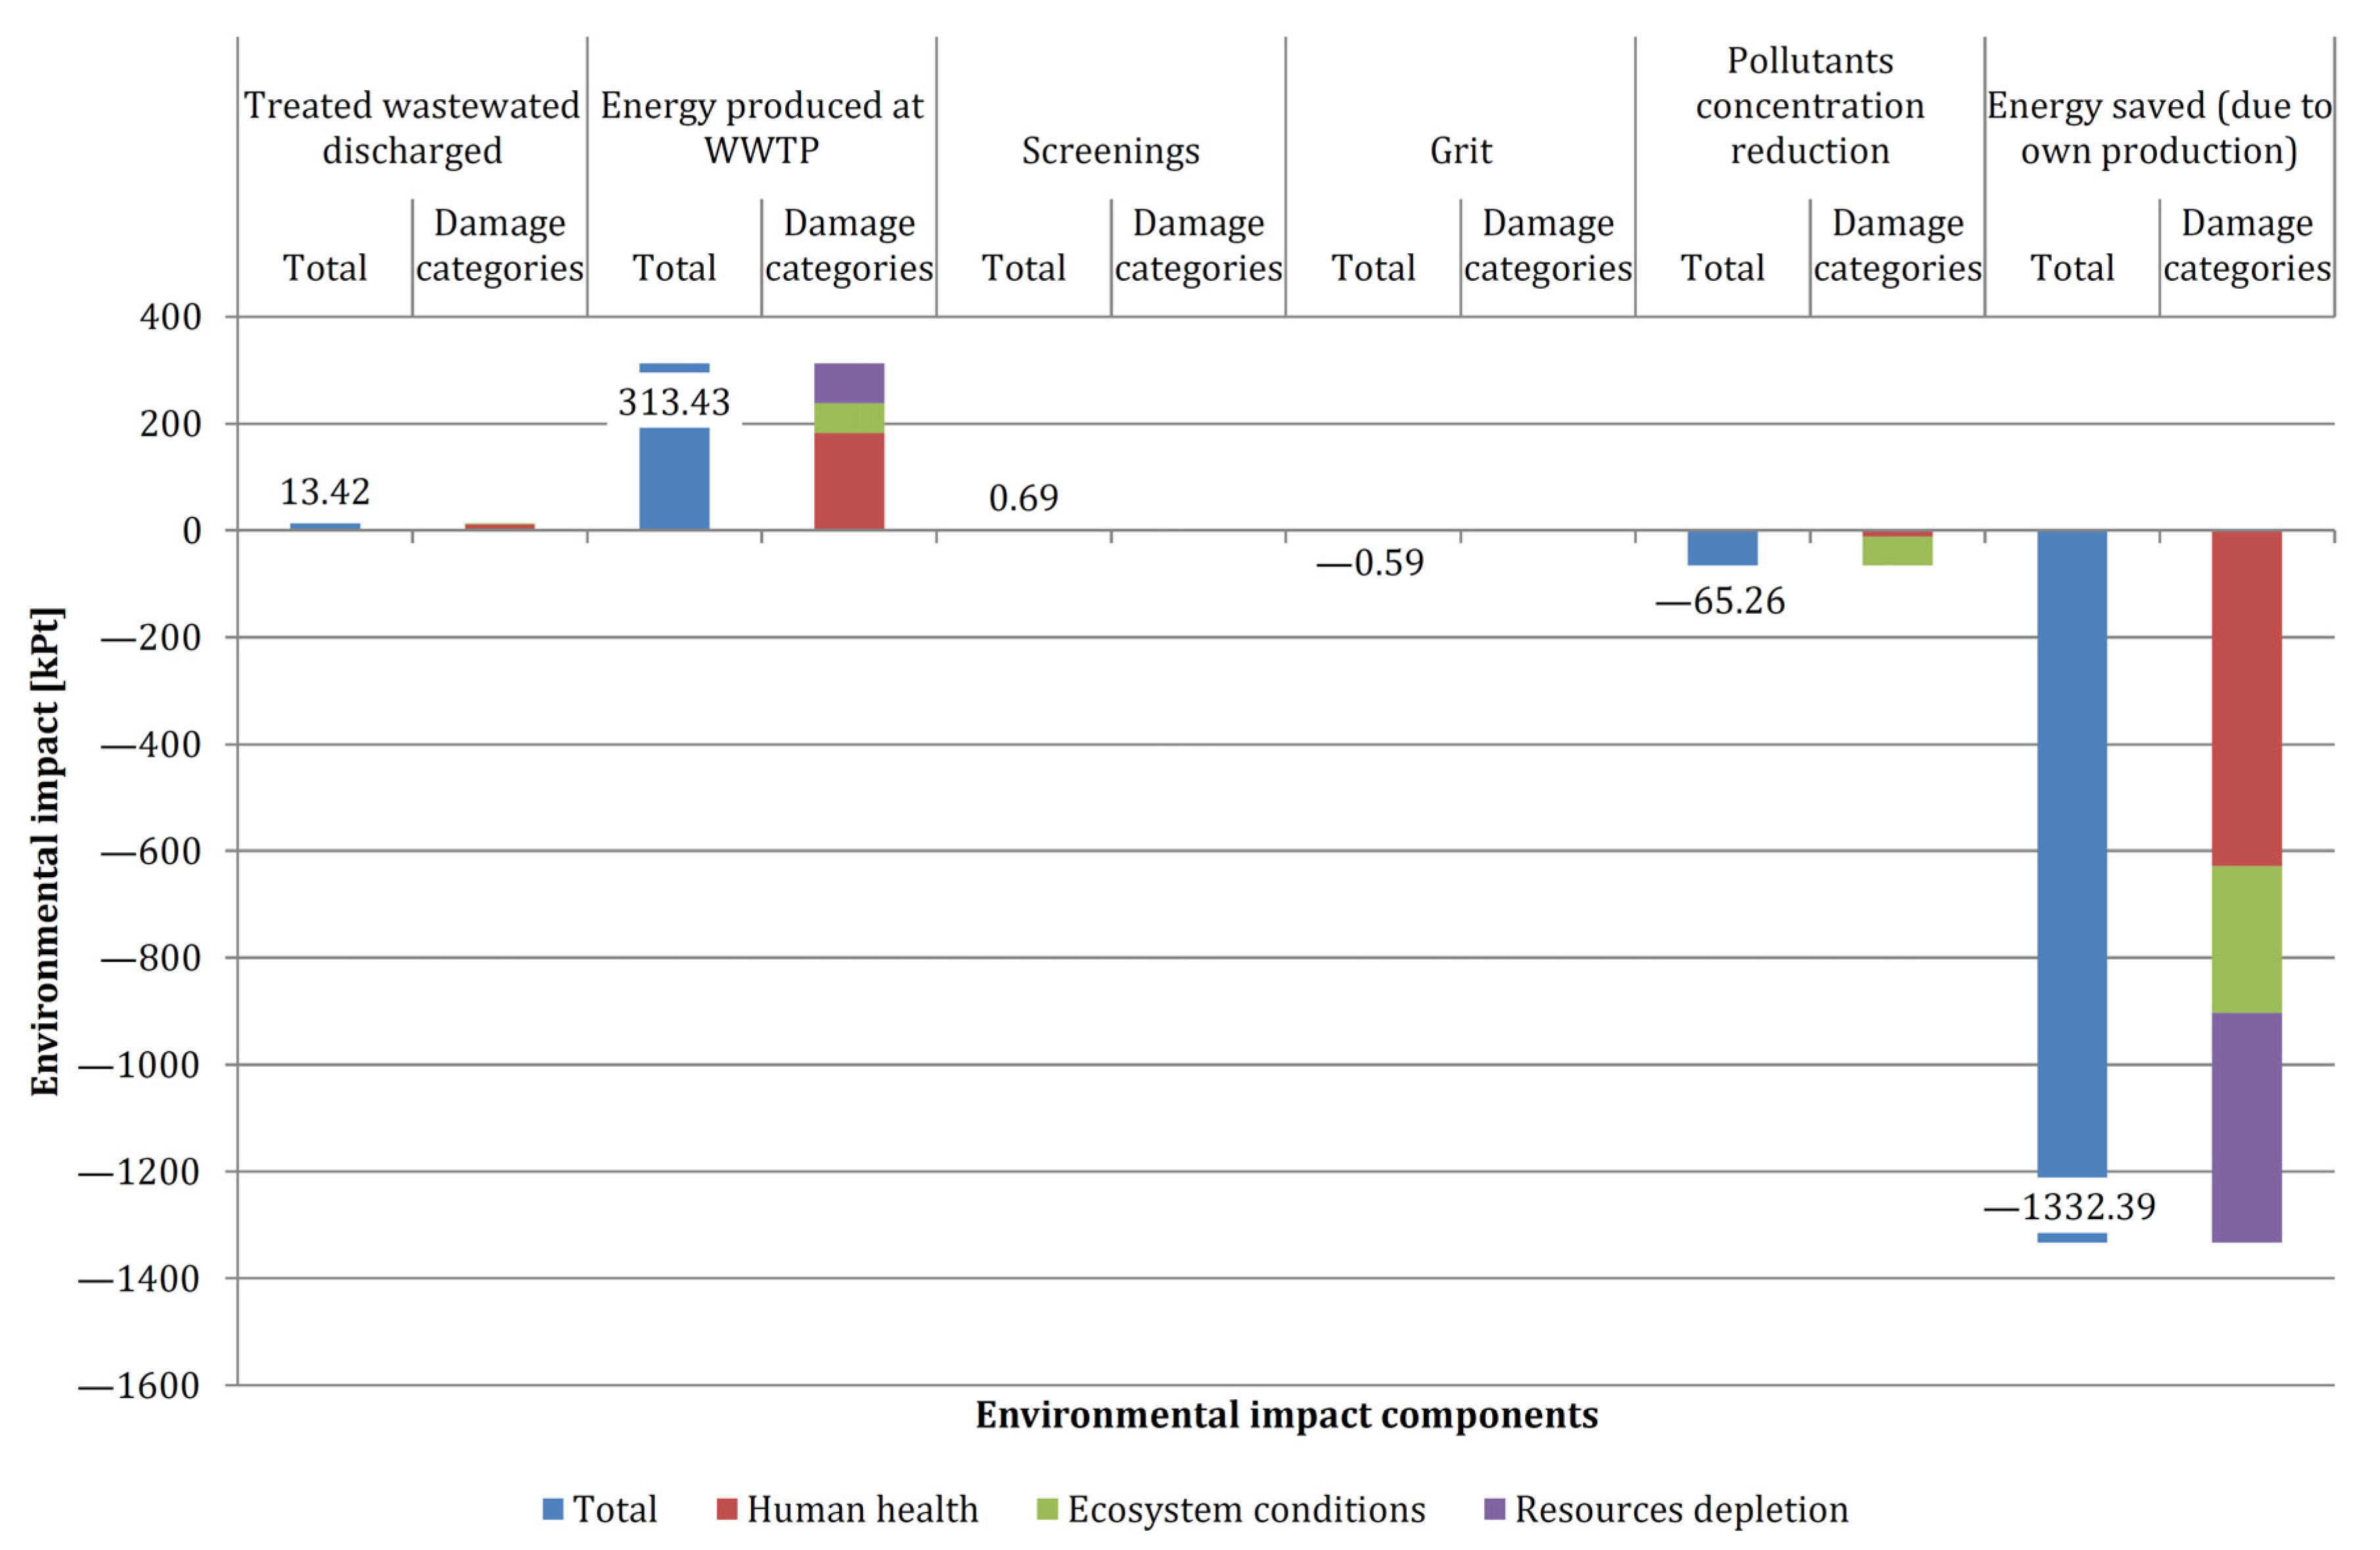
  • All direct outputs (except grit) are characterized by positive (and therefore harmful, environmentally) values of impact indicators. This is due to the following:
    o
    The wastewater stream at the process outlet leading to the receiving body (environment) contains certain quantities of characteristic, environmentally harmful, substances, and it is required by the relevant standards to determine their levels; these quantities have been significantly reduced (at least to the level required by law), but these substances are present in the treated wastewater, which, once directed to the environment, must be re-treated to be suitable for use;
    o
    Screenings (solid residues from mechanical separation processes) were modelled only as waste; the reason for adopting such a modelling approach was the impossibility of standardizing the composition of the screenings and the preliminary lack, at this stage of modelling, of options for unambiguous determination of the usefulness of these screenings, which would allow us to treat them as a fully-fledged by-product of the treatment process;
    o
    Energy from bioreactors is produced as a result of a physico-chemical process of sewage sludge fermentation in digesters, where a certain amount of biogas is released; this biogas is then incinerated and the energy obtained from this process is used in wastewater treatment processes. The share of energy from the plant’s own sources varied, depending on the month, between 62 and 89% of the total energy used.
  • The estimated environmental impacts for the remaining wastewater treatment outputs and grit and intermediate outputs are environmental benefits (negative values assumed). For all the environmental benefits, this is due to the fact that there are so-called “avoided” impacts, i.e., indirect environmental benefits compared to obtaining an equivalent effect using primary environmental resources. This finding fully corresponds to the overall tendencies in the results obtained from other Polish studies [28,29,30]. For environmental benefits arising from the implementation of the wastewater management process in question, the “avoided” impacts concerned are:
    o
    Grit—All grit shown in Table 9 can be treated as a fully valuable product ready for use in the relevant industries (e.g., as a raw material in the construction industry), which in turn eliminates the need to obtain the same amount of sand from primary sources, i.e., from the environment;
    o
    Diminution of pollutant concentrations—The environmental benefit results from the fact that the measured values of parameters describing the content of harmful substances in wastewater are reduced from their top levels, characterizing the stream of raw wastewater at the process inflow to a lower level, and characterizing the stream of treated wastewater ready to be released to the receiver (environment); this parameter illustrates the amount of “avoided” environmental loads resulting from the wastewater with the original concentration of harmful substances not being released to the environment;
    o
    “Saved” energy—In this case, the environmental benefit results from the fact that the energy required for the wastewater treatment process, in an amount equal to the amount of energy that was produced in the plant from its own resources, was not taken from external sources.
  • It was found, in the case of both process inputs and outputs, that the energy component, related to the energy intensity of the processes themselves, as well as the “avoided” environmental loads, is the main determinant of the magnitude of the generated impacts (the value of total environmental impact indicators). This finding supports the point of view of the case studies presented in [32]. Moreover, it can be noted that the amount of “avoided” emissions from electricity generated based on the modelled energy mix determines the negative value of the overall environmental impact indicator of the whole process (as the main factor, it determines the environmental friendliness of the process); the calculated overall environmental impact indicator of the process, including process inputs and outputs modelled according to the assumptions described in Section 2.2.2, is −446 kPt.
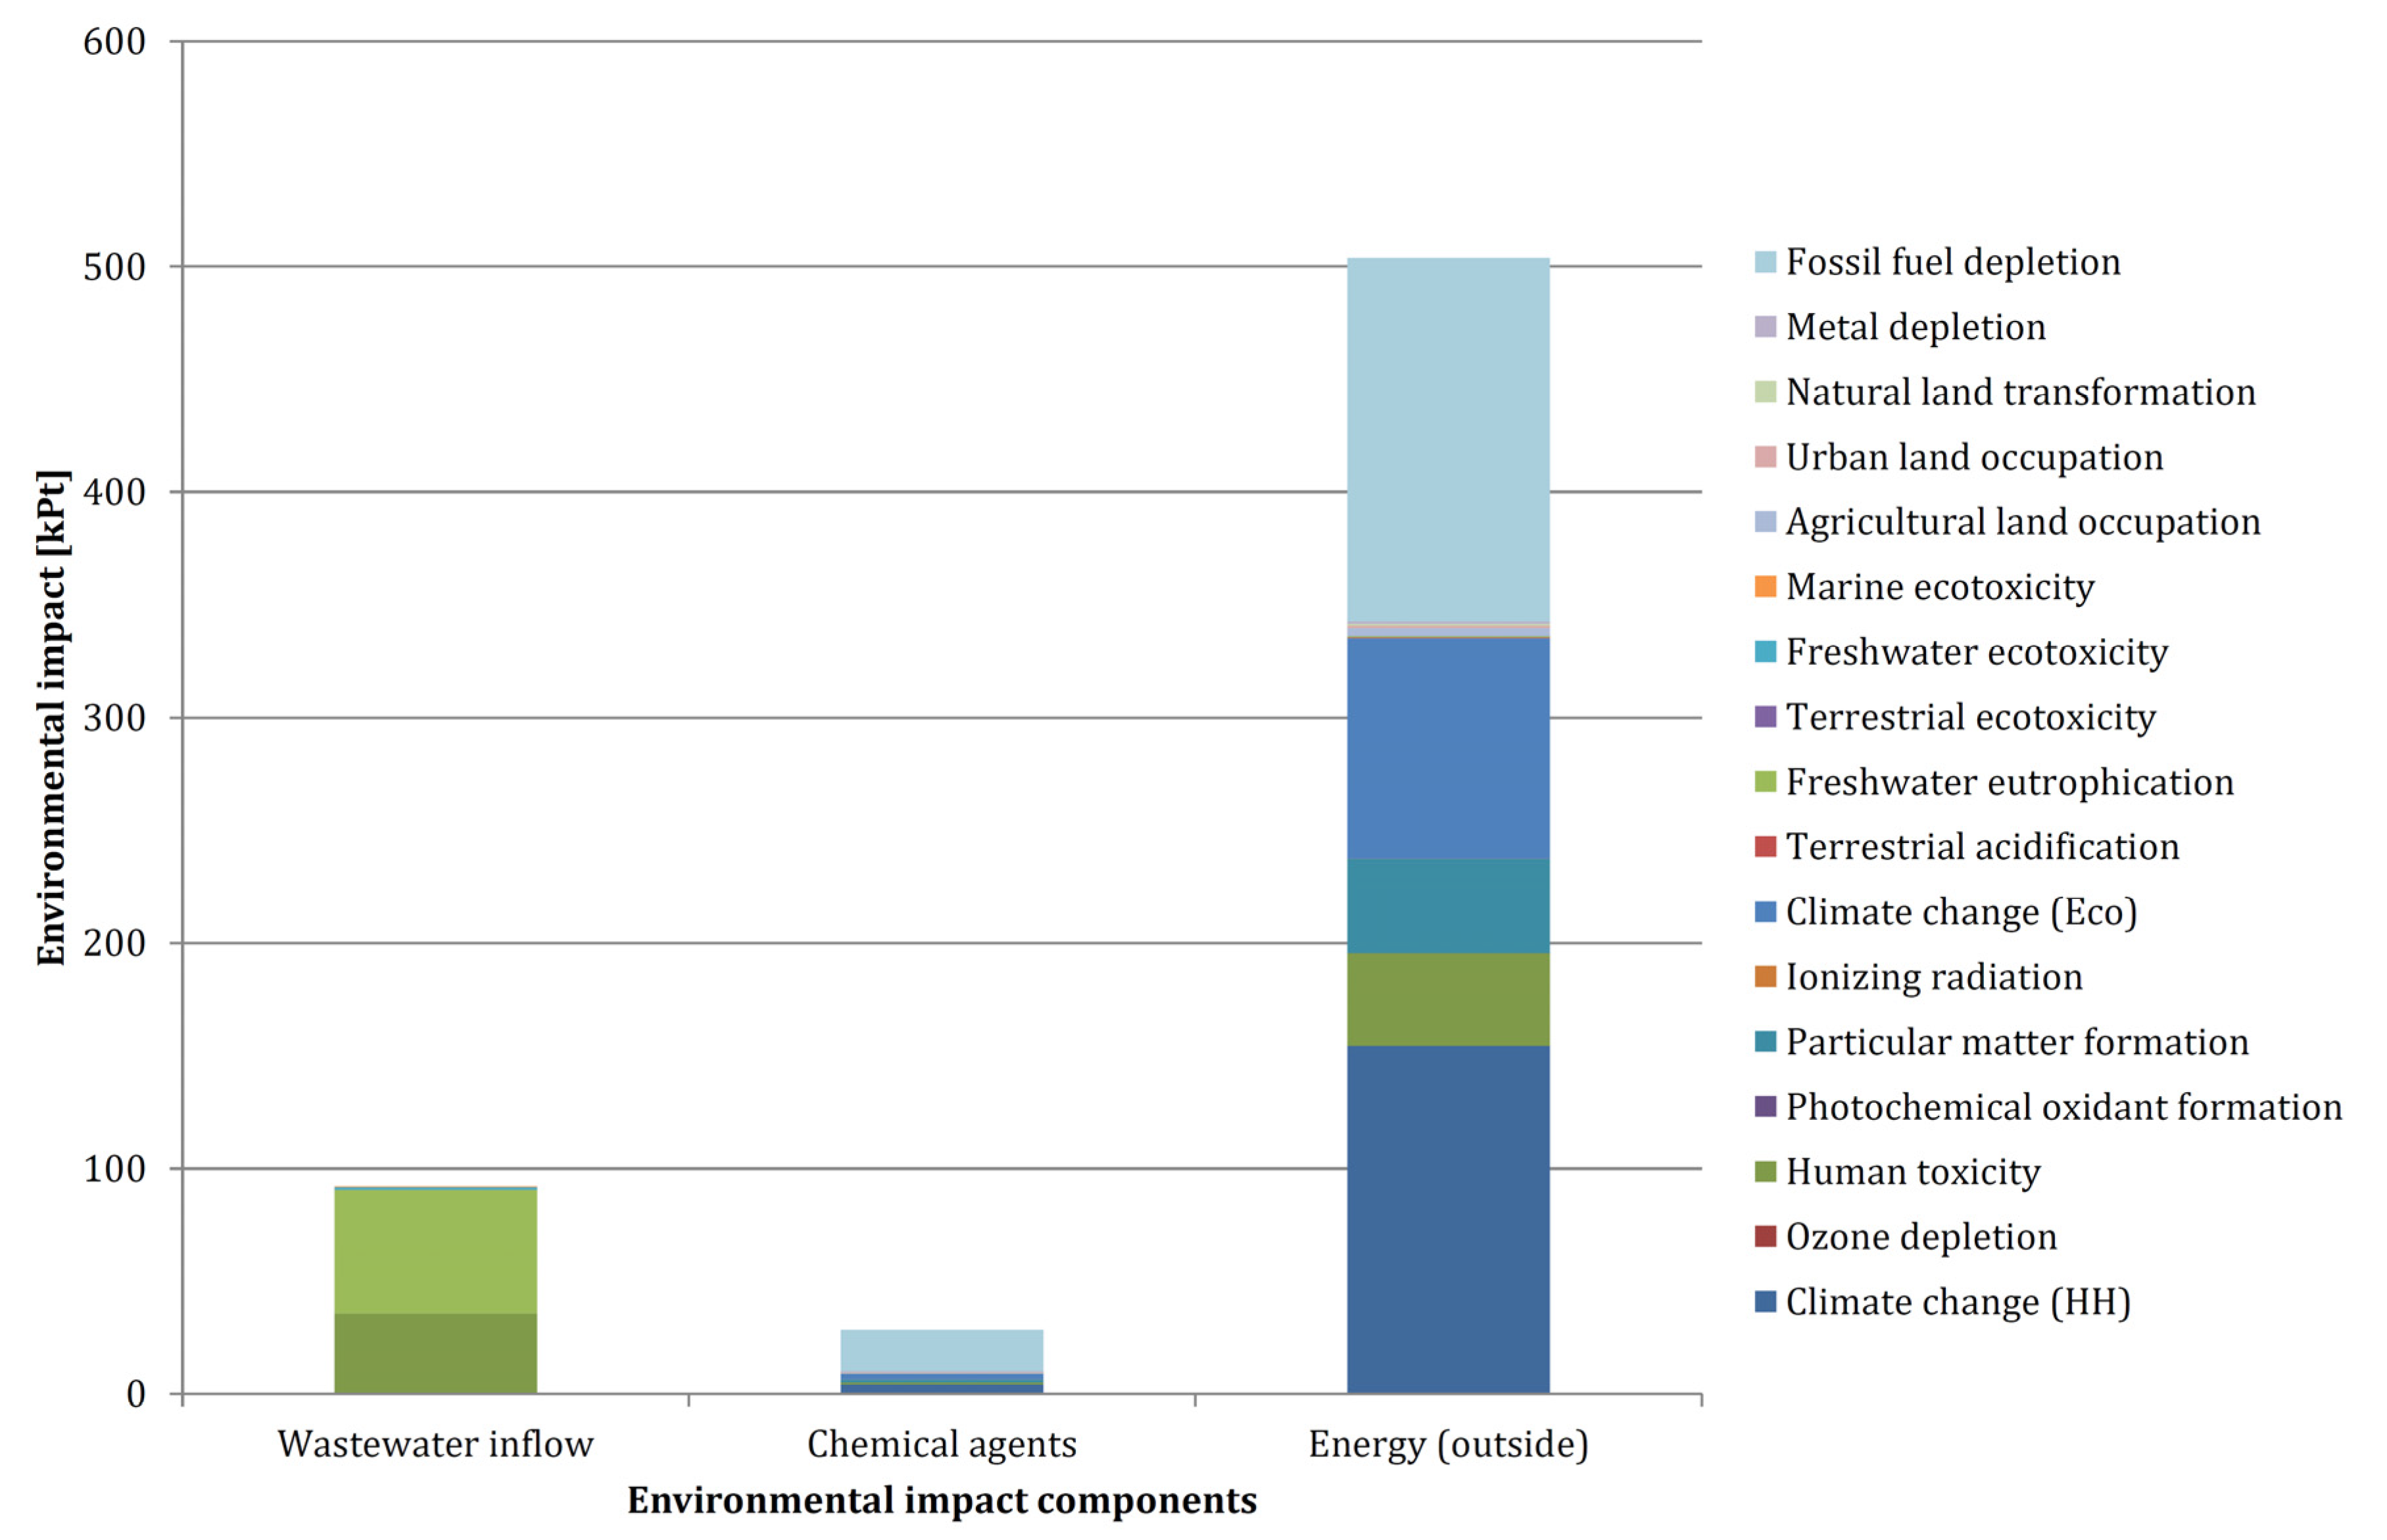
  • Analysis of the structure of environmental impacts included in the detailed impact profiles, characterization, and weighting results allows us to conclude that, for the energy-intensive component and the chemical agent used, loads connected with the following phenomena account for the largest share:
    o
    Depletion of fossil fuels;
    o
    Climate change (in terms of harm to humans and ecosystems);
    o
    Human toxicity;
    o
    The formation of particulate matter in the atmosphere.
    Furthermore, for the component related to the use of chemicals in wastewater treatment, depletion of metal resources also constitutes a significant burden.
  • With regard to the quantities of harmful substances tested (according to the set of parameters given in Table 4, Table 5, Table 6, Table 7 and Table 8) in raw and treated wastewater streams, a different distribution of environmental impact profiles was found. Only some impact categories are present there, of which the most significant ones are:
    o
    Eutrophication of freshwater: about 55% of the total impact for the raw wastewater stream and about 16% of the total impact for the treated wastewater stream;
    o
    Human toxicity: about 39% of the total impact for the raw wastewater stream and about 82% of the total impact for the treated wastewater stream,
    o
    Freshwater ecotoxicity: about 1–2% of the total impact.
    Besides these, yet another, though much smaller, impact was discovered, associated with marine and soil ecotoxicity.
  • With regard to the variability of the environmental impacts across individual months, it should be noted that:
    o
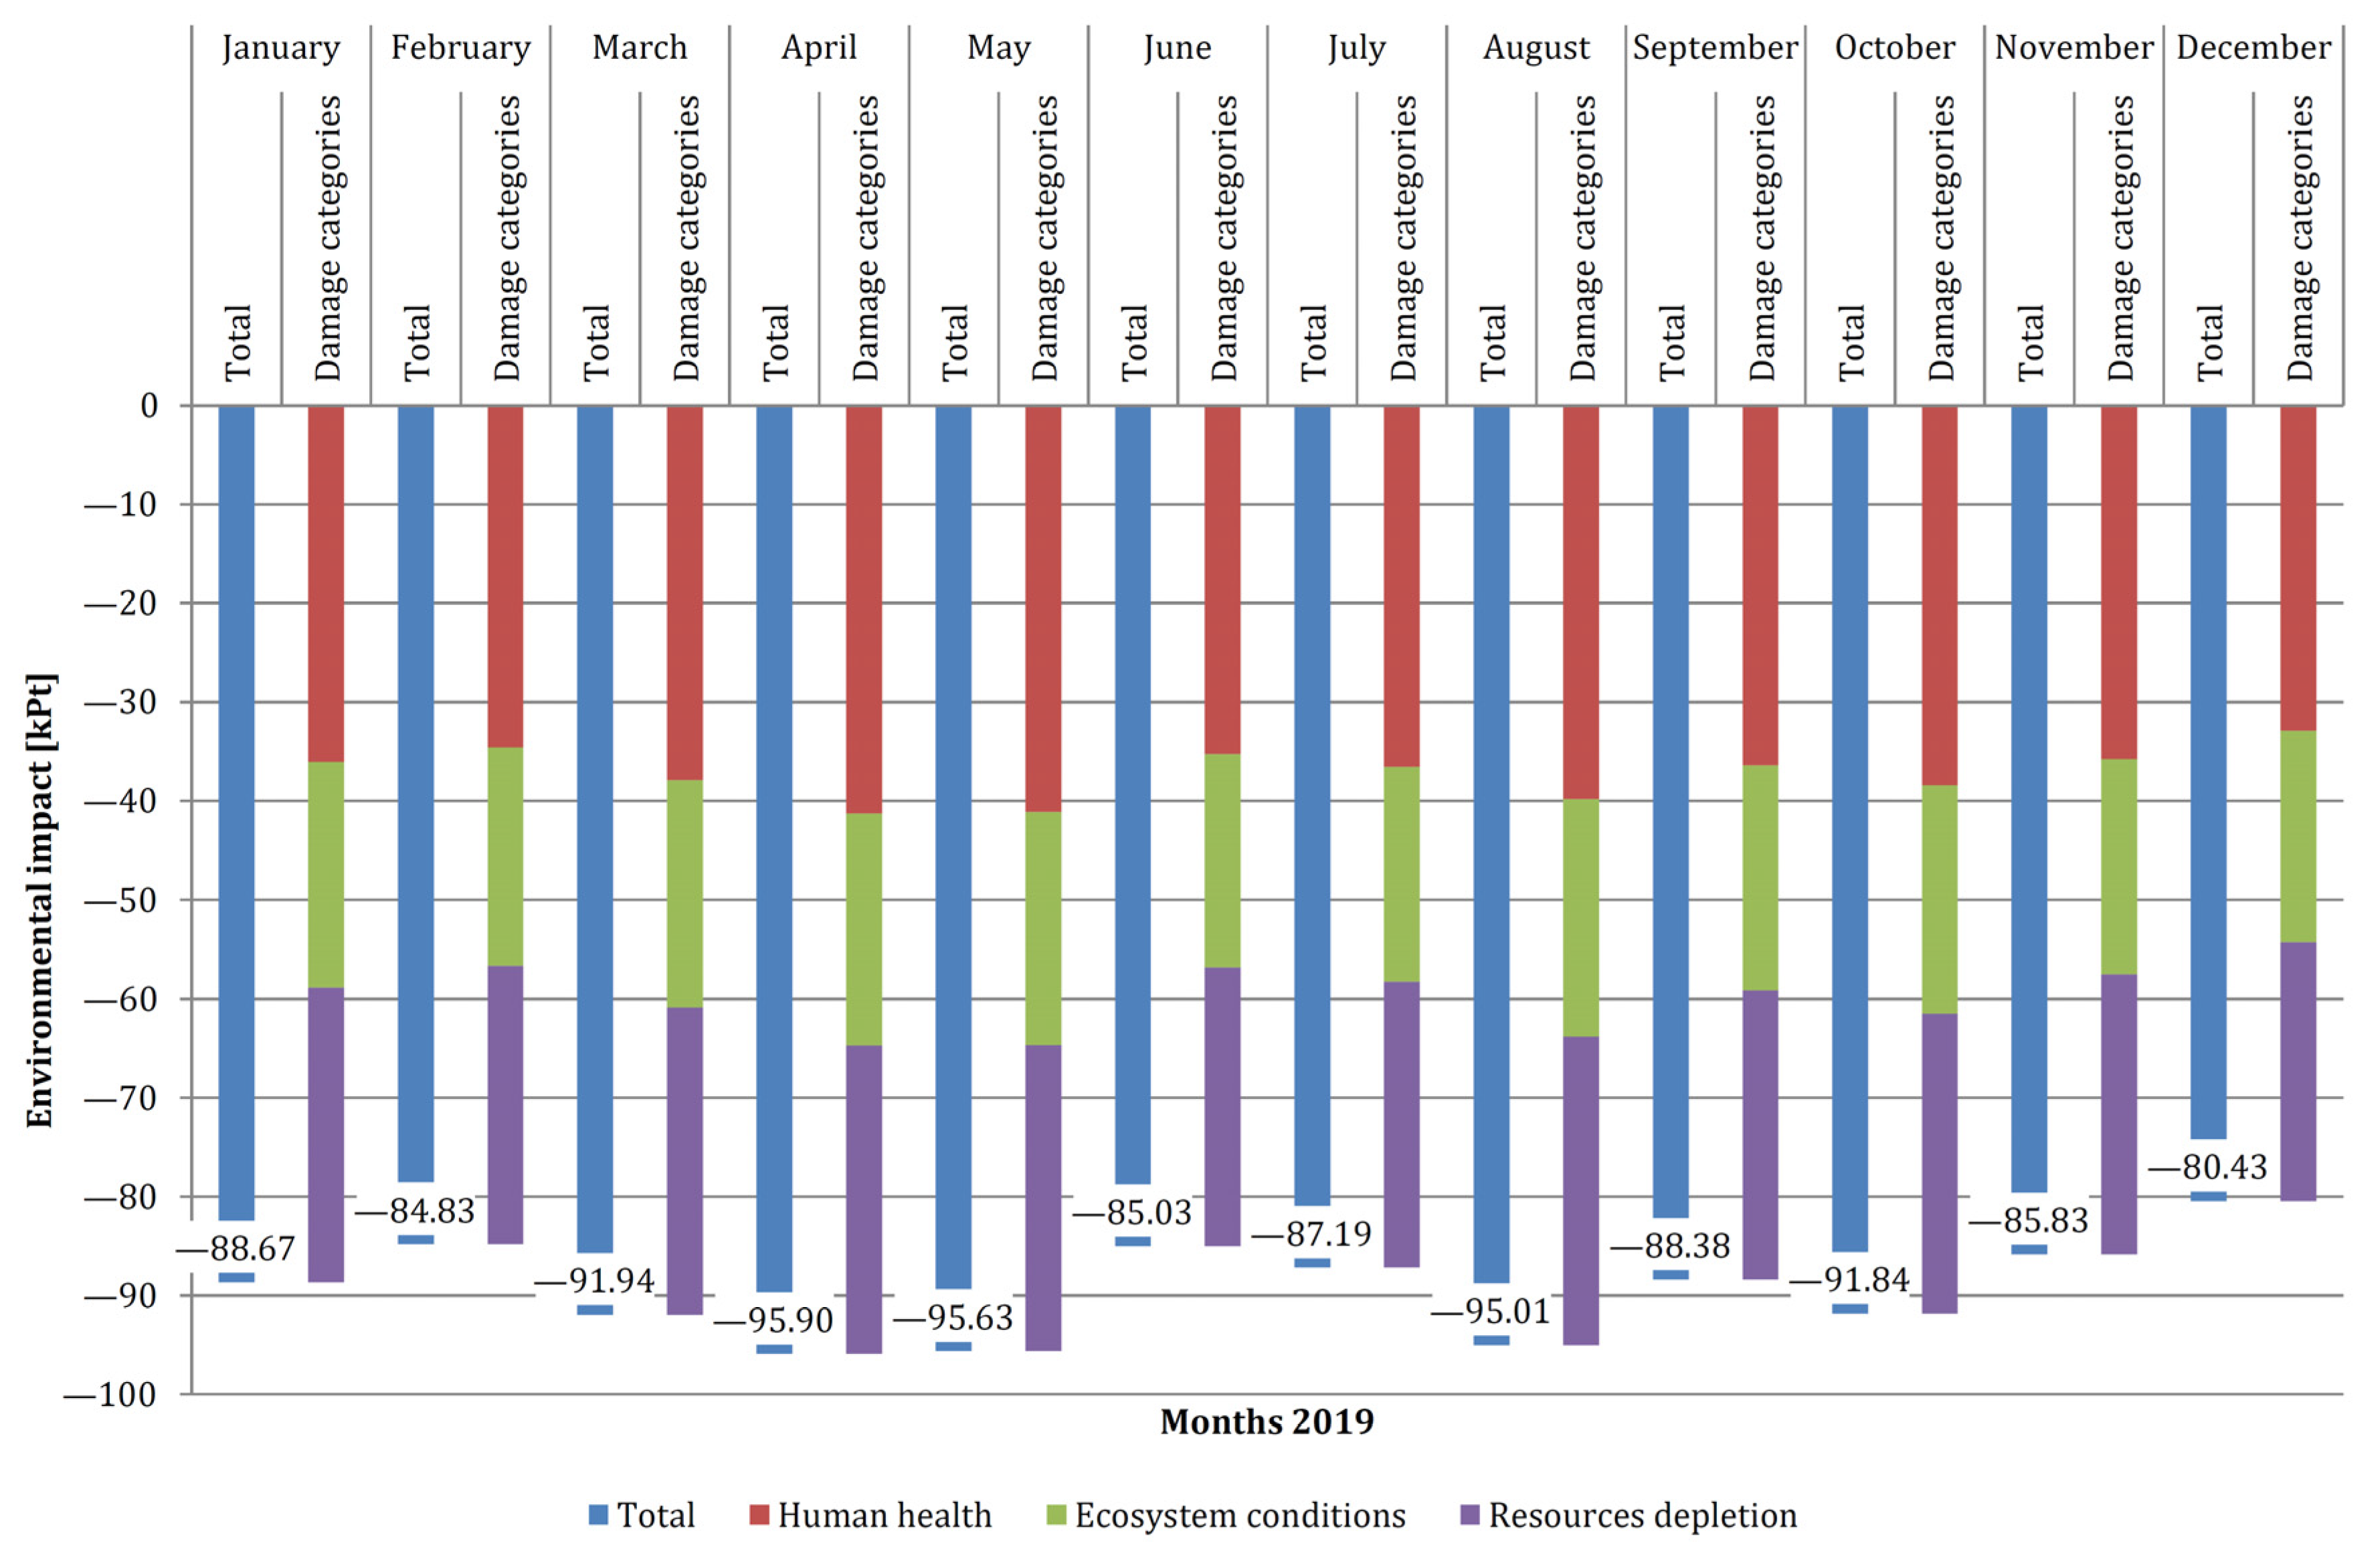
    Environmental loads from wastewater treatment inputs are subject to considerable variability over individual months. The discrepancies reach 300%; the top load level was recorded in February (76.7 kPt) and the lowest in August (24.3 kPt);
    o
    Environmental impacts from wastewater treatment outputs are characterized by much lower variability (differences between individual months do not exceed 20%).
  • Due to the fact that, in previous publications, available system boundaries and analysis assumptions, as well as the choice of functional units, were done arbitrarily, straightforward comparisons between the results are possible; nevertheless, tendency evaluation still can be done:
    o
    The major inference based on the statement that the energy component, related to the balance between WWT process demand and electricity production, is the main contributor to the environmental impact indicator sum remains, along with conclusions made by other authors [1,3,6,30];
    o
    Moreover, the statement made in this paper that the energy mix for the so-called conventional electricity source has the most significant contribution to the overall environmental impact indicator of the whole process is valid, and has been noticed, not only in the area of municipal WWTs, but also in industrial facilities [40],
    o
    Interestingly, it has been confirmed that the LCA results reveal concise areas of environmental optimization for large WWTPs (>50,000 PE), which was also noticed in the results of a case study done on 113 treatment facilities across Spain [9]; bigger facilities, although maintaining high treatment efficiency standards, present poorer environmental profiles than the plants that have a lack of careful continuous monitoring infrastructure. Therefore, LCA appears to be an even more crucial evaluation tool for scheduling future and holistic-approach optimization scenarios for WWTP significant stream volumes.
  • For further analysis stages, we postulate that this study’s limitations must be considered. Thus, the following is necessary:
    o
    Clarifying the wastewater treatment model and modelling the flow of environmental impacts between individual process stages;
    o
    Taking into account inputs and outputs omitted at the described stage, output modelling of sewage sludge, and perhaps a separate environmental analysis of sludge use.

Author Contributions

Conceptualization, P.S., J.K., Z.D., and P.K.; methodology, P.S., J.K., Z.D., and P.K.; software, J.K.; validation, P.S., J.K., Z.D., and P.K.; formal analysis, P.S., J.K., Z.D., and P.K.; investigation, P.S., J.K., Z.D., and P.K.; resources, P.S.; data curation, P.S., J.K., Z.D., and P.K.; writing—original draft preparation, P.S., J.K., Z.D., and P.K.; writing—review and editing, P.S., J.K., Z.D., and P.K.; visualization, P.S. and J.K.; supervision, Z.D. and P.K.; project administration, J.K., Z.D., and P.K.; funding acquisition, J.K., Z.D., and P.K. All authors have read and agreed to the published version of the manuscript.

Funding

This research was funded by POZNAN UNIVERSITY OF TECHNOLOGY, grant number 504101/0713/SBAD/0937 and grant number POIR.04.01.04-00-0060/18-00. The APC was funded by POIR.04.01.04-00-0060/18-00.

Institutional Review Board Statement

Not applicable.

Informed Consent Statement

Not applicable.

Data Availability Statement

General basic data is contained within this article. Restrictions apply to the availability of other detailed data used in the case study. Data was obtained from Aquanet S.A.

Conflicts of Interest

The authors declare no conflict of interest.

References

  1. Ontiveros, G.A.; Campanella, E.A. Environmental performance of biological nutrient removal processes from a life cycle perspective. Bioresour. Technol. 2015, 150, 506–512. [Google Scholar] [CrossRef] [PubMed]
  2. Revollar, S.; Vilanova, R.; Vega, P.; Francisco, M.; Meneses, M. Wastewater treatment plant operation: Simple control schemes with a holistic perspective. Sustainability 2020, 12, 768. [Google Scholar] [CrossRef] [Green Version]
  3. De Feo, G.; Ferrara, C. Investigation of the environmental impacts of municipal wastewater treatment plants through a Life Cycle Assessment software tool. Environ. Technol. 2017, 38, 1943–1948. [Google Scholar] [CrossRef] [PubMed]
  4. Nguyen, T.K.L.; Ngo, H.H.; Guo, W.S.; Chang, S.W.; Nguyen, D.D.; Nghiem, L.D.; Nguyen, T.V. A Critical Review on Life Cycle Assessment and Plant-Wide Models towards Emission Control Strategies for Greenhouse Gas from Wastewater Treatment Plants. J. Environ. Manag. 2020, 264, 110440. [Google Scholar] [CrossRef]
  5. Alyaseri, I.; Zhou, J. Handling uncertainties inherited in life cycle inventory and life cycle impact assessment method for improved life cycle assessment of wastewater sludge treatment. Heliyon 2019, 5. [Google Scholar] [CrossRef]
  6. Rashid, S.S.; Liu, Y.-Q. Assessing environmental impacts of large centralized wastewater treatment plants with combined or separate sewer systems in dry/wet seasons by using LCA. Environ. Sci. Pollut. Res. 2020, 27, 15674–15690. [Google Scholar] [CrossRef] [Green Version]
  7. Vidal, N.; Poch, M.; Martí, E.; Rodríguez-Roda, I. Evaluation of the environmental implications to include structural changes in a wastewater treatment plant. J. Chem. Technol. Biotechnol. 2002, 77, 1206–1211. [Google Scholar] [CrossRef]
  8. Wu, J.G.; Meng, X.Y.; Liu, X.-M.; Liu, X.-W.; Zheng, Z.-X.; Xu, D.-Q.; Sheng, G.-P.; Yu, H.-Q. Life Cycle Assessment of a Wastewater Treatment Plant Focused on Material and Energy Flows. Environ. Manag. 2010, 46, 610–617. [Google Scholar] [CrossRef]
  9. Lorenzo-Toja, Y.; Vázquez-Rowe, I.; Chenel, S.; Marín-Navarro, D.; Moreira, M.T.; Feijoo, G. Eco-efficiency analysis of Spanish WWTPs using the LCA + DEA method. Water Res. 2015, 68, 651–666. [Google Scholar] [CrossRef]
  10. Lijó, L.; Malamis, S.; González-García, S.; Moreira, M.T.; Fatone, F.; Katsou, E. Decentralised schemes for integrated management of wastewater and domestic organic waste: The case of a small community. J. Environ. Manag. 2017, 203, 732–740. [Google Scholar] [CrossRef] [Green Version]
  11. Lam, K.L.; Zlatanović, L.; van der Hoek, J.P. Life cycle assessment of nutrient recovery from wastewater—current methodological practices. In Proceedings of the 10th IWA Symposium on Modelling and Integrated Assessment, Copenhagen, Denmark, 1–4 September 2019; pp. 1–4. [Google Scholar]
  12. Tua, C.; Ficara, E.; Mezzanotte, V.; Rigamonti, L. Integration of a side-stream microalgae process into a municipal wastewater treatment plant: A life cycle analysis. J. Environ. Manag. 2020, 111605. [Google Scholar] [CrossRef] [PubMed]
  13. Houillon, G.; Jolliet, O. Life cycle assessment of processes for the treatment of wastewater urban sludge: Energy and global warming analysis. J. Clean. Prod. 2005, 13, 287–299. [Google Scholar] [CrossRef]
  14. Foley, J.; Yuan, Z.; Keller, J.; Senante, E.; Chandran, K.; Willis, J. N2O and CH4 Emission from Wastewater Collection and Treatment Systems; Technical Report; GlobalWater Research Coalition: London, UK, 2011. [Google Scholar]
  15. Arnell, M. Performance Assessment of Wastewater Treatment Plants: Multi-Objective Analysis Using Plant-Wide Models. Ph.D. Thesis, Lund University, Lund, Sweden, 16 December 2016. [Google Scholar]
  16. Wang, X.; Ratnaweera, H.; Holm, J.A.; Olsbu, V. Statistical monitoring and dynamic simulation of a wastewater treatment plant: A combined approach to achieve model predictive control. J. Environ. Manag. 2017, 193, 1–7. [Google Scholar] [CrossRef] [PubMed]
  17. Santelmann, M.; Hulse, D.; Wright, M.; Enright, C.; Branscomb, A.; Tchintcharauli-Harrison, M.; Bolson, J. Designing and modeling innovation across scales for urban water systems. Urban Ecosyst. 2019, 22, 1149–1164. [Google Scholar] [CrossRef] [Green Version]
  18. Vicentin, R.; Fdz-Polanco, F.; Fdz-Polanco, M. Energy integration in wastewater treatment plants by anaerobic digestion of urban waste: A process design and simulation study. Int. J. Chem. Eng. 2019, 1–11. [Google Scholar] [CrossRef]
  19. Arias, A.; Behera, C.R.; Feijoo, G.; Sin, G.; Moreira, M.T. Unravelling the environmental and economic impacts of innovative technologies for the enhancement of biogas production and sludge management in wastewater systems. J. Environ. Manag. 2020, 270, 110965. [Google Scholar] [CrossRef]
  20. Hospido, A.; Moreira, T.; Martín, M.; Rigola, M.; Feijoo, G. Environmental evaluation of different treatment processes for sludge from urban wastewater treatments: Anaerobic digestion versus thermal processes. Int. J. Life Cycle Assess. 2005, 10, 336–345. [Google Scholar] [CrossRef]
  21. Hong, J.; Hong, J.; Otaki, M.; Jolliet, O. Environmental and economic life cycle assessment for sewage sludge treatment processes in Japan. Waste Manag. 2009, 29, 696–703. [Google Scholar] [CrossRef]
  22. Kalavrouziotis, I.; Filintas, A.; Koukoulakis, P.H.; Hatzopoulos, J. Application of multicriteria analysis in the management and planning of treated municipal wastewater and sludge reuse in agriculture and land development: The case of Sparti’s wastewater treatment plant, Greece. Fresenius Environ. Bull. 2011, 20, 287–295. [Google Scholar]
  23. Cao, Y.; Pawłowski, A. Life cycle assessment of two emerging sewage sludge-to-energy systems: Evaluating energy and greenhouse gas emissions implications. Bioresour. Technol. 2013, 127, 81–91. [Google Scholar] [CrossRef]
  24. Zaborowska, E.; Czerwionka, K.; Mąkinia, J. Integrated plant-wide modelling for evaluation of the energy balance and greenhouse gas footprint in large wastewater treatment plants. Appl. Energy 2021, 282, 116126. [Google Scholar] [CrossRef]
  25. Saraiva, A.; Presumido, P.; Silvestre, J.; Feliciano, M.; Rodrigues, G.; Silva, P.O.; Damásio, M.; Ribeiro, A.; Ramôa, S.; Ferreira, L.; et al. Water footprint sustainability as a tool to address climate change in the wine sector: A methodological approach applied to a portuguese case study. Atmosphere 2020, 11, 934. [Google Scholar] [CrossRef]
  26. Sweetapple, C.; Fu, G.; Butler, D. Identifying key sources of uncertainty in the modelling of greenhouse gas emissions from wastewater treatment. Water Res. 2013, 47, 4652–4665. [Google Scholar] [CrossRef] [PubMed] [Green Version]
  27. Niero, M.; Pizzol, M.; Bruun, H.G.; Thomsen, M. Comparative life cycle assessment of wastewater treatment in Denmark including sensitivity and uncertainty analysis. J. Clean. Prod. 2014, 68, 25–35. [Google Scholar] [CrossRef]
  28. Thonemann, N.; Schulte, A.; Maga, D. How to conduct prospective life cycle assessment for emerging technologies? A systematic review and methodological guidance. Sustainability 2020, 12, 1192. [Google Scholar] [CrossRef] [Green Version]
  29. Burchart-Korol, D.; Zawartka, P. Determinants of environmental assessment of Polish individual wastewater treatment plants in a life cycle perspective. Arch. Environ. Prot. 2019, 45, 44–54. [Google Scholar] [CrossRef]
  30. Burchart-Korol, D.; Zawartka, P. Environmental life cycle assessment of septic tanks in urban wastewater system—A case study for Poland. Arch. Environ. Prot. 2019, 45, 68–77. [Google Scholar] [CrossRef]
  31. Zawartka, P.; Burchart-Korol, D.; Blaut, A. Model of carbon footprint assessment for the life cycle of the system of wastewater collection, transport and treatment. Sci. Rep. 2020, 10, 5799. [Google Scholar] [CrossRef]
  32. Corominas Ll Foley, J.; Guest, J.S.; Hospido, A.; Larsen, H.F.; Morera, S.; Shaw, A. Life cycle assessment applied to wastewater treatment: State of the art. Water Res. 2013, 47, 5480–5492. [Google Scholar] [CrossRef]
  33. Fava, J. Society of Environmental Toxicology and Chemistry. A Technical Framework for Life-Cycle Assessment; SETAC and SETAC Foundation for Environmental Education: Washington, DC, USA, 1991. [Google Scholar]
  34. Klöpffer, W. Life cycle assessment. Environ. Sci. Pollut. Res. 1997, 4, 223–228. [Google Scholar] [CrossRef]
  35. International Organization for Standardization. Environmental Management—Life Cycle Assessment—Principles and Framework; ISO 14040:2006; ISO: Geneva, Switzerland, 2006. [Google Scholar]
  36. International Organization for Standardization. Environmental Management—Life Cycle Assessment—Requirements and Guidelines; ISO 14044:2006; ISO: Geneva, Switzerland, 2006. [Google Scholar]
  37. Goedkoop, M.; Heijungs, R.; Huijbregts, M.; De Schryver, A.; Struijs, J.; Van Zelm, R. ReCiPe 2008: A life cycle impact assessment method which comprises harmonised category indicators at the midpoint and the endpoint level. Report 2009, 1, 1–126. Available online: https://www.leidenuniv.nl/cml/ssp/publications/recipe_characterisation.pdf (accessed on 3 October 2020).
  38. Huijbregts, M.A.; Steinmann, Z.J.; Elshout, P.M.; Stam, G.; Verones, F.; Vieira, M.; Zijp, M.; Hollander, A.; van Zelm, R. ReCiPe2016: A harmonised life cycle impact assessment method at midpoint and endpoint level. Int. J. Life Cycle Assess. 2017, 22, 138–147. [Google Scholar] [CrossRef]
  39. PSE Polskie Sieci Elektroenergetyczne. Available online: https://pse.pl/dane-sytemowe (accessed on 21 April 2020).
  40. Takeshita, S.; Farzaneh, H.; Dashti, M. Life-cycle assessment of the wastewater treatment technologies in Indonesia’s fish-processing industry. Energies 2020, 13, 6591. [Google Scholar] [CrossRef]
Figure 1. The CWWTP in Koziegłowy—configuration of technology.
Energies 14 00356 g001
Figure 2. Actual wastewater flows in 2019 at the CWWTP, broken down by months.
Energies 14 00356 g002
Figure 3. Model boundaries.
Energies 14 00356 g003
Figure 4. Adopted electricity mix [34,39].
Energies 14 00356 g004
Figure 5. Comparison of inputs and outputs to the wastewater treatment process at the CWWTP in 2019—Total environmental impact indicators and general environmental impact profiles broken down into damage categories.
Energies 14 00356 g005
Figure 6. Comparison of inputs and outputs to the wastewater treatment process at the CWWTP in 2019—Detailed environmental impact profiles broken down into impact categories.
Energies 14 00356 g006
Figure 7. Monthly distribution of environmental impacts for inputs to the wastewater management processes at the CWWTP in 2019—Total environmental impact indicators and general environmental impact profiles broken down into damage categories.
Energies 14 00356 g007
Figure 8. Monthly distribution of environmental impacts for inputs to the wastewater management processes at the CWWTP in 2019—Detailed environmental impact profiles broken down into impact categories.
Energies 14 00356 g008
Figure 9. Monthly distribution of environmental impacts for outputs from the wastewater management processes at the CWWTP in 2019—Total environmental impact indicators and general environmental impact profiles broken down into damage categories.
Energies 14 00356 g009
Figure 10. Monthly distribution of environmental impacts for outputs from the wastewater management processes at the CWWTP in 2019—Detailed environmental impact profiles broken down into impact categories.
Energies 14 00356 g010
Figure 11. Breakdown of environmental impact components for inputs to the wastewater management processes at the CWWTP in 2019—Total environmental impact indicators and general environmental impact profiles broken down into damage categories.
Energies 14 00356 g011
Figure 12. Breakdown of environmental impact components for inputs to the wastewater management processes at the CWWTP in 2019—Detailed environmental impact profiles broken down into impact categories.
Energies 14 00356 g012
Figure 13. Breakdown of environmental impact components for outputs from the wastewater management processes at the CWWTP in 2019—Total environmental impact indicators and general environmental impact profiles broken down into damage categories.
Energies 14 00356 g013
Figure 14. Breakdown of environmental impact components for outputs from the wastewater management processes at the CWWTP in 2019—Detailed environmental impact profiles broken down into impact categories.
Energies 14 00356 g014
Figure 15. Results of the characterization stage for inputs to the wastewater treatment process at the CWWTP—A monthly perspective.
Energies 14 00356 g015
Figure 16. Results of the characterization stage for inputs to the wastewater treatment process at the CWWTP—Broken down into individual impacts.
Energies 14 00356 g016
Figure 17. Results of the characterization stage for environmental benefits from the wastewater treatment process at the CWWTP—A monthly perspective.
Energies 14 00356 g017
Figure 18. Results of the characterization stage for environmental benefits from the wastewater treatment process at the CWWTP—Broken down into individual impacts.
Energies 14 00356 g018
Figure 19. An example of the uncertainty analysis results for process inputs for the wastewater management at the CWWTP in 2019.
Energies 14 00356 g019
Table 1. Operation parameters of the Central Wastewater Treatment Plant (CWWT) in Poznań, Koziegłowy, 2019—wastewater characterization.
ParameterValueUnits
Capacity
Population (served in 2019)920,471PE (1)
Population (maximum designed)958,000PE
wastewater treatment plant (WWTP) Inflow
Mean daily (2019, average)100,832m3 day−1
WWTP flow (maximum designed)200,000m3 day−1
Peak flow (2019)149,792m3 day−1
Peak flow (maximum designed)260,000m3 day−1
Organic Pollution Loading and Concentration (2019—average)
BOD5 (2)—influent594g m−3
60,000kg day−1
(designed)57,500kg day−1
BOD5—effluent3.7g m−3
BOD5—maximum required limit15.0g m−3
COD (3)1239g m−3
138,000kg day−1
(designed)125,000kg day−1
COD—effluent49.9g m−3
COD—maximum required limit125.0g m−3
Total Suspended Solids (TSS)571g m−3
57,670kg day−1
(designed)60,000kg day−1
TSS—effluent6.4g m−3
TSS—maximum required limit35.0g m−3
Total Nitrogen (TN)103g m−3
10,400kg day−1
(designed)11,000kg day−1
TN—effluent9.4g m−3
TN—maximum required limit10g m−3
Total Phosphorus (TP)7g m−3
1515kg day−1
(designed)1400kg day−1
TP—effluent0.6g m−3
TP—maximum required limit1.0g m−3
(1) PE—population equivalents based on daily BOD5 load; 1 PE = 60gO2d−1; (2) BOD5—Biochemical Oxygen Demand [gO2 m−3]; (3) COD—Chemical Oxygen Demand [gO2 m−3].
Table 2. Operation parameters of the CWWTP in Poznań, Koziegłowy, 2019—sludge characterization.
ParameterValueUnits
Thickened PS (2019—average)
Volume960m3 day−1
Dry solids content5.2%DS
Organic matter as % of dry solids content76.6%
Thickened WAS (2019—average)
Volume480m3 day−1
Dry solids content5.7%DS
Organic matter as % of dry solids content78.6%
Digestate (2019—average)
Volume1540m3 day−1
Dry solids content3.0%DS
Organic matter as % of dry solids content63.3%
Dewatered Sludge (2019—average)
Volume (calculated)190m3 day−1
Dry solids content22.8%DS
Organic matter as % of dry solids content69.2%
Table 3. Electricity consumption at the CWWTP in 2019, broken down by sources.
MonthEnergy Consumption—TOTALEnergy Consumption—from External SourceEnergy Consumption—Produced from BiogasCovered from Own Source
kWhkWhkWh%
January1,991,072709,4811,281,59164
February1,965,577755,4871,210,09062
March2,091,587755,7441,335,84364
April1,735,742396,5031,339,23977
May1,770,691441,1401,329,55175
June1,618,724405,6591,213,06575
July1,585,674342,8971,242,77778
August1,497,973158,6771,339,29689
September1,515,407259,7231,255,68483
October1,720,319416,9441,303,37576
November1,719,799503,3191,216,48071
December1,723,640599,6451,123,99565
Average1,744,684478,7681,265,91673
TOTAL20,936,2055,745,21915,190,986
Table 4. Actual concentration values of standardized parameters in raw wastewater in 2019.
MonthPollutant Concentration
g m−3
CODBOD5TSSTNTP
January1326.9468.7688.798.214.6
February1258.8548.4537.1111.917.1
March1288.6567.5682.798.913.5
April1254.0505.5631.2113.415.4
May971.1458.8371.096.913.4
June1144.0477.2581.799.314.3
July1213.7531.5608.9104.714.0
August1428.1681.5667.5109.817.4
September1231.3579.6518.8104.216.1
October1245.9557.5443.799.214.2
November1241.0621.4531.492.013.9
December1263.5595.0588.3104.319.0
Average1238.9549.4570.9102.715.2
Table 5. Actual concentrations of additional substances parameters in raw wastewater in 2019.
ParameterPollutant Concentration
g m−3
IIIIIIIVVVIVIIVIIIIXXXIXII
Arsenic0.00680.00190.00170.00300.00160.00220.00210.00220.00160.00130.00200.0002
Chrome0.01600.01200.01900.02100.01300.01200.01700.03300.02600.04900.01700.0060
Zinc0.28000.18000.03500.28000.20000.27000.23000.39000.20000.37000.37000.0270
Cadmium0.00050.00000.00590.00020.00020.00020.00010.00020.00000.00020.00020.0000
Copper0.17000.09000.09600.08500.08300.11000.11000.15000.06900.10000.08400.0180
Nickel0.04400.02500.05000.03300.02400.01700.01500.03700.16000.05800.00000.0043
Lead0.00460.00300.01300.37000.27000.03900.05500.06000.01000.04100.02600.0011
Mercury0.00050.00060.00030.00090.00040.00020.00050.00080.00030.00020.00010.0002
Silver0.00160.00070.00070.00160.00130.00200.00060.00220.00040.00550.00290.0002
Vanadium0.00130.00080.0060.00160.00070.00200.00140.00270.00170.00130.00130.0001
Total organic carbon—TOC *245.000xx174.000xx156.000xx88.800xx
Anionic surfactants *2.5600xx1.6200xx2.0500xx0.0700xx
Substances that extract with petroleum ether *76.0000xx69.2000xx58.0000xx27.6000xx
Phenol index0.18000.19000.16000.26000.17000.16000.44000.10000.11000.12000.12000.1200
Mineral oil index (C10-C40) *0.3200xx0.3100xx0.2200xx0.2300xx
Chlorides245.00216.00225.00263.00321.00227.00413.00173.00235.00215.00211.00232.00
Sulphates126.00109.00121.00126.00121.00144.0093.0088.00122.00129.00139.00120.00
Silicon *8.5000xx10.0000xx8.1000xx9.3000xx
* Parameters tested on a quarterly basis.
Table 6. Consumption of chemical agents for the needs of wastewater treatment in 2019.
MonthChemical Agents
Thickening AgentDewatering Agent I—CWWTPDewatering Agent I—LWWTPAnti-Foam AgentPIX113 (P-Percipitation)PIX113 (Antiscalant)Anti-Scalant IAnti-Scalant II
kg mth−1dm3 mth−1dm3 mth−1dm3 mth−1dm3 mth−1dm3 mth−1cm3 mth−1dm3 mth−1
January5937.67157.922,789.3682.018,400.029.2762.00.0
February3653.85140.817,105.20.074,957.022.3551.0550.0
March4824.44318.318,600.00.088,650.024.4621.00.0
April5290.86360.018,348.00.090,425.024.2617.0100.0
May6596.06398.420,280.20.02587.025.4637.0200.0
June4219.06375.019,038.00.00.022.3543.0325.0
July5281.35598.623,197.30.04995.025.2726.00.0
August6179.06014.021,669.00.08150.026.0901.00.0
September5012.69984.018,300.00.03449.026.41057.00.0
October3869.77257.117,756.80.08306.022.4931.00.0
November5905.97431.018,924.0600.018,685.041.7993.00.0
December6736.05908.625,482.0620.025,322.024.61285.00.0
Average5292.26495.320,124.2158.528,660.526.2802.097.9
TOTAL63,506.177,943.7241,489.81902.0343,926.0314.29624.01175.0
Table 7. Actual concentration values of standardized parameters in treated wastewater in 2019.
MonthPollutant Concentration
g m−3
CODBOD5TSSTNTP
January51.04.15.68.00.9
February70.75.413.29.61.5
March72.56.614.29.91.3
April69.44.713.810.40.6
May43.33.34.310.40.2
June52.03.04.28.90.3
July40.42.73.89.00.3
August40.53.33.910.40.4
September42.03.13.610.40.3
October41.13.14.79.30.4
November36.42.22.68.70.3
December39.32.73.17.70.3
Average49.93.76.49.40.6
Table 8. Actual concentration values of additional substances in treated wastewater in 2019.
ParameterPollutant Concentration
mg dm−3
IIIIIIIVVVIVIIVIIIIXXXIXII
Arsenic0.00270.00110.00120.00220.00080.00100.00090.00060.00110.00090.00100.0001
Chrome0.00180.00310.00220.00300.00120.00170.00170.00160.00160.00110.00030.0003
Zinc0.04200.03500.04800.03100.01500.07600.03100.05400.03700.03000.02500.0093
Cadmium0.00010.00000.00000.00000.00000.00000.00000.00000.00000.00000.00000.0000
Copper0.00400.00470.00230.01700.01300.01300.02300.01200.01800.00620.00580.0008
Nickel0.04500.02100.02000.01600.01200.01300.01200.02300.12000.01500.00000.0028
Lead0.00070.00020.00100.00960.01200.01200.00330.00200.00000.00000.00000.0001
Mercury0.00000.00030.00010.00010.00010.00000.00000.00000.00000.00000.00000.0000
Silver0.00020.00010.00600.00000.00050.00130.00000.00020.00000.00550.00250.0002
Vanadium0.00040.00050.00020.00020.00030.00050.00050.00020.00070.00060.00050.0000
Total organic carbon—TOC *13.500xx14.300xx xx xx
Anionic surfactants *0.2100xx0.3200xx0.2100xx0.0100xx
Substances that extract with petroleum ether *1.0000xx1.2000xx1.4000xx1.2000xx
Phenol index0.00960.01520.00440.00880.03240.03240.13600.00720.00440.01000.00800.0084
Mineral oil index (C10-C40) *0.1800xx0.1000xx0.1300xx0.1500xx
Chlorides165.00199.00212.00208.00192.00179.00214.00228.00222.00208.00207.00193.00
Sulphates120.00139.00126.00168.00146.00148.00133.00152.00147.00144.00138.00122.00
Silicon *7.1000xx7.9000xx xx xx
* Parameters tested on a quarterly basis.
Table 9. Amounts of products recovered after mechanical separation in 2019.
MonthGritScreenings
Mg mth−1Mg mth−1
January98.957.8
February92.441.9
March105.948.2
April154.142.5
May195.656.8
June169.742.8
July173.331.4
August145.433.5
September191.338.8
October179.135.6
November248.257.2
December129.656.7
Average156.945.3
TOTAL1883.4543.1
Table 10. Amount of wastewater sludge processed in 2019.
MonthDigestate for Dewatering—CWWTPDigestate for Dewatering—LWWTPTOTAL
m3 mth−1m3 mth−1m3 mth−1
January46,291.09126.055,417
February33,937.04998.038,935
March39,868.07289.047,157
April41,167.09697.050,864
May40,948.08131.049,079
June33,285.08787.042,072
July37,963.07144.045,107
August39,649.07245.046,894
September40,673.08100.048,773
October38,783.07570.046,353
November34,969.07254.042,223
December40,669.08767.049,436
Average39,016.87842.346,859.2
TOTAL468,202.094,108.0562,310.0
Publisher’s Note: MDPI stays neutral with regard to jurisdictional claims in published maps and institutional affiliations.

