Article

Surface Charge Properties of Epoxy Composites under DC Voltage Affected by Surface and Bulk Conductivity

1
State Key Laboratory of Power System and Generation Equipment, Tsinghua University, Beijing 100084, China
2
Hubei Economic Research Institute, State Grid Corporation of China, Wuhan 430000, China
3
Electrical Insulation Research Center, University of Connecticut, Storrs, CT 06269, USA
4
Global Energy Interconnection Research Institute, State Grid Corporation of China, Beijing 102209, China
*
Author to whom correspondence should be addressed.
Energies 2021, 14(2), 370; https://doi.org/10.3390/en14020370
Submission received: 10 December 2020 / Revised: 30 December 2020 / Accepted: 4 January 2021 / Published: 11 January 2021

Abstract

:
As DC transmission voltage increases, the DC wall bushing becomes longer, and a supporting insulator is introduced to keep the conductor straight. Under extremely high electric fields coupled with a thermal gradient, the surface charge of the supporting insulator may distort the field distribution and increase the risk of flashover. In this paper, surface potentials of three model epoxy resin composites were systematically investigated under varied voltage amplitudes, different voltage polarities and electric field distributions. The bulk and surface resistivity of the epoxy resin composites over a broad temperature range were measured to reveal the correlations between surface charge and such basic electrical parameters. The results indicate that the normal-dominated electric field plays the major role in charge accumulation. The processes of surface charge accumulation and dissipation are more closely related to the surface resistivity. As a result, the surface charge properties can be improved by optimizing the electrode structure and resistivity of the epoxy resin composites.

Graphical Abstract

1. Introduction

With the increased demand of power loads, large-capacity power transmission over long distances has developed rapidly in recent years [1,2]. In the meantime, with advances in technology, DC transmission is getting more and more attention from researchers and engineers. Especially when the transmission distance is greater than the economic distance, DC transmission shows a clear advantage in the economical way [2]. However, the higher DC voltage imparts longer DC wall bushings. A ±800 kV DC wall bushing with a length of 21 m is shown in Figure 1. For DC ± 1100 kV ultrahigh voltage transmission projects in China, the length of a bushing reaches up to 30 m [3]. Therefore, a supporting insulator is needed to keep the conductor straight and consequently makes the field distribution inside the bushing more uniform. Meanwhile, charge can accumulate on the insulator surface for long-term operation under the DC electric field [3,4,5,6,7,8]. The electric field generated by the surface charge can distort the initial field and possibly increase the risks of partial discharge or flashover [9,10].
Many researchers from all over the world study the charge properties on the dielectric surface. It is reported that ion pairs generated in gas are the major source of charge accumulation on the insulator surface [9]. Cone-shaped insulators made of Al2O3-filled epoxy resin composites have been used to investigate the surface charge properties [4,5,10] and demonstrate the distortion of electric field distribution and the process of surface flashover [4]. Apart from the bulk effect of insulating materials, surface modification is utilized to generate more surface traps and suppress the charge accumulation [5,10,11,12,13,14,15,16,17,18,19,20]. In addition to the material properties, the influence of voltage type on charge accumulation is also considered [11]. However, in terms of a cylinder-shaped supporting insulator, the influence of surface electric field direction on surface charge accumulation has not been reported [21,22,23,24], but this is beneficial to the further optimization of electrode structure. The surface charge accumulation and dissipation are not yet correlated to the bulk or surface resistivity, which are key factors for modifying the formula of insulator materials.
In this paper, the sample and experimental setups are introduced first. A system was designed to apply a normal-dominated electric field and a tangential electric field, respectively. Then, the test results are shown and analyzed. Bulk and surface resistivity of three model epoxy resin samples were measured over a broad temperature range. Then, surface potential distribution was measured under different voltage amplitudes, voltage polarities and electric field distribution. In addition, charge accumulation under different temperatures was analyzed to better reveal the relation between saturated surface potential and surface resistivity. Finally, the major approach of charge accumulation and dissipation was demonstrated. Several possible modifications for the optimization of the supporting insulator are proposed according to the results.

2. Experimental Setup

2.1. Model Epoxy Resin Composites

The samples used in this paper were flakes with a diameter of 100 mm and a thickness of 1 mm provided by Pinggao Group Co. LTD (Pingdingshan, China). They were made by pouring epoxy resin and Al2O3 composites with three different loadings of Al2O3. Basic properties of the samples are listed in Table 1. It should be noted that the formulas used in this paper were similar to the formulas used in the actual supporting insulator of the UHV DC bushing of a ±1100 project under construction in China.
When the DC bushing is under operation, the internal temperature would be notably higher than the room temperature due to the thermal effect caused by the current. The increase in temperature could have an influence on the bulk resistivity and surface resistivity of the insulation material and, thus, make a difference on the charge accumulation and dissipation process. The lowest glass transition temperature among the three formulas was 115 °C, so the highest temperature investigated in this paper was 110 °C. The bulk resistivity and surface resistivity were measured according to IEC Standard 90093 [12].

2.2. Measurement Setup

The surface potential distribution was measured using an active electrostatic probe connected to the TREK-347 electrometer (Trek, Lockport, USA). The voltage range was 0–3.3 kV, and the accuracy was 1 V. The response time was 3 ms, and the spatial resolution was less than 1 mm.
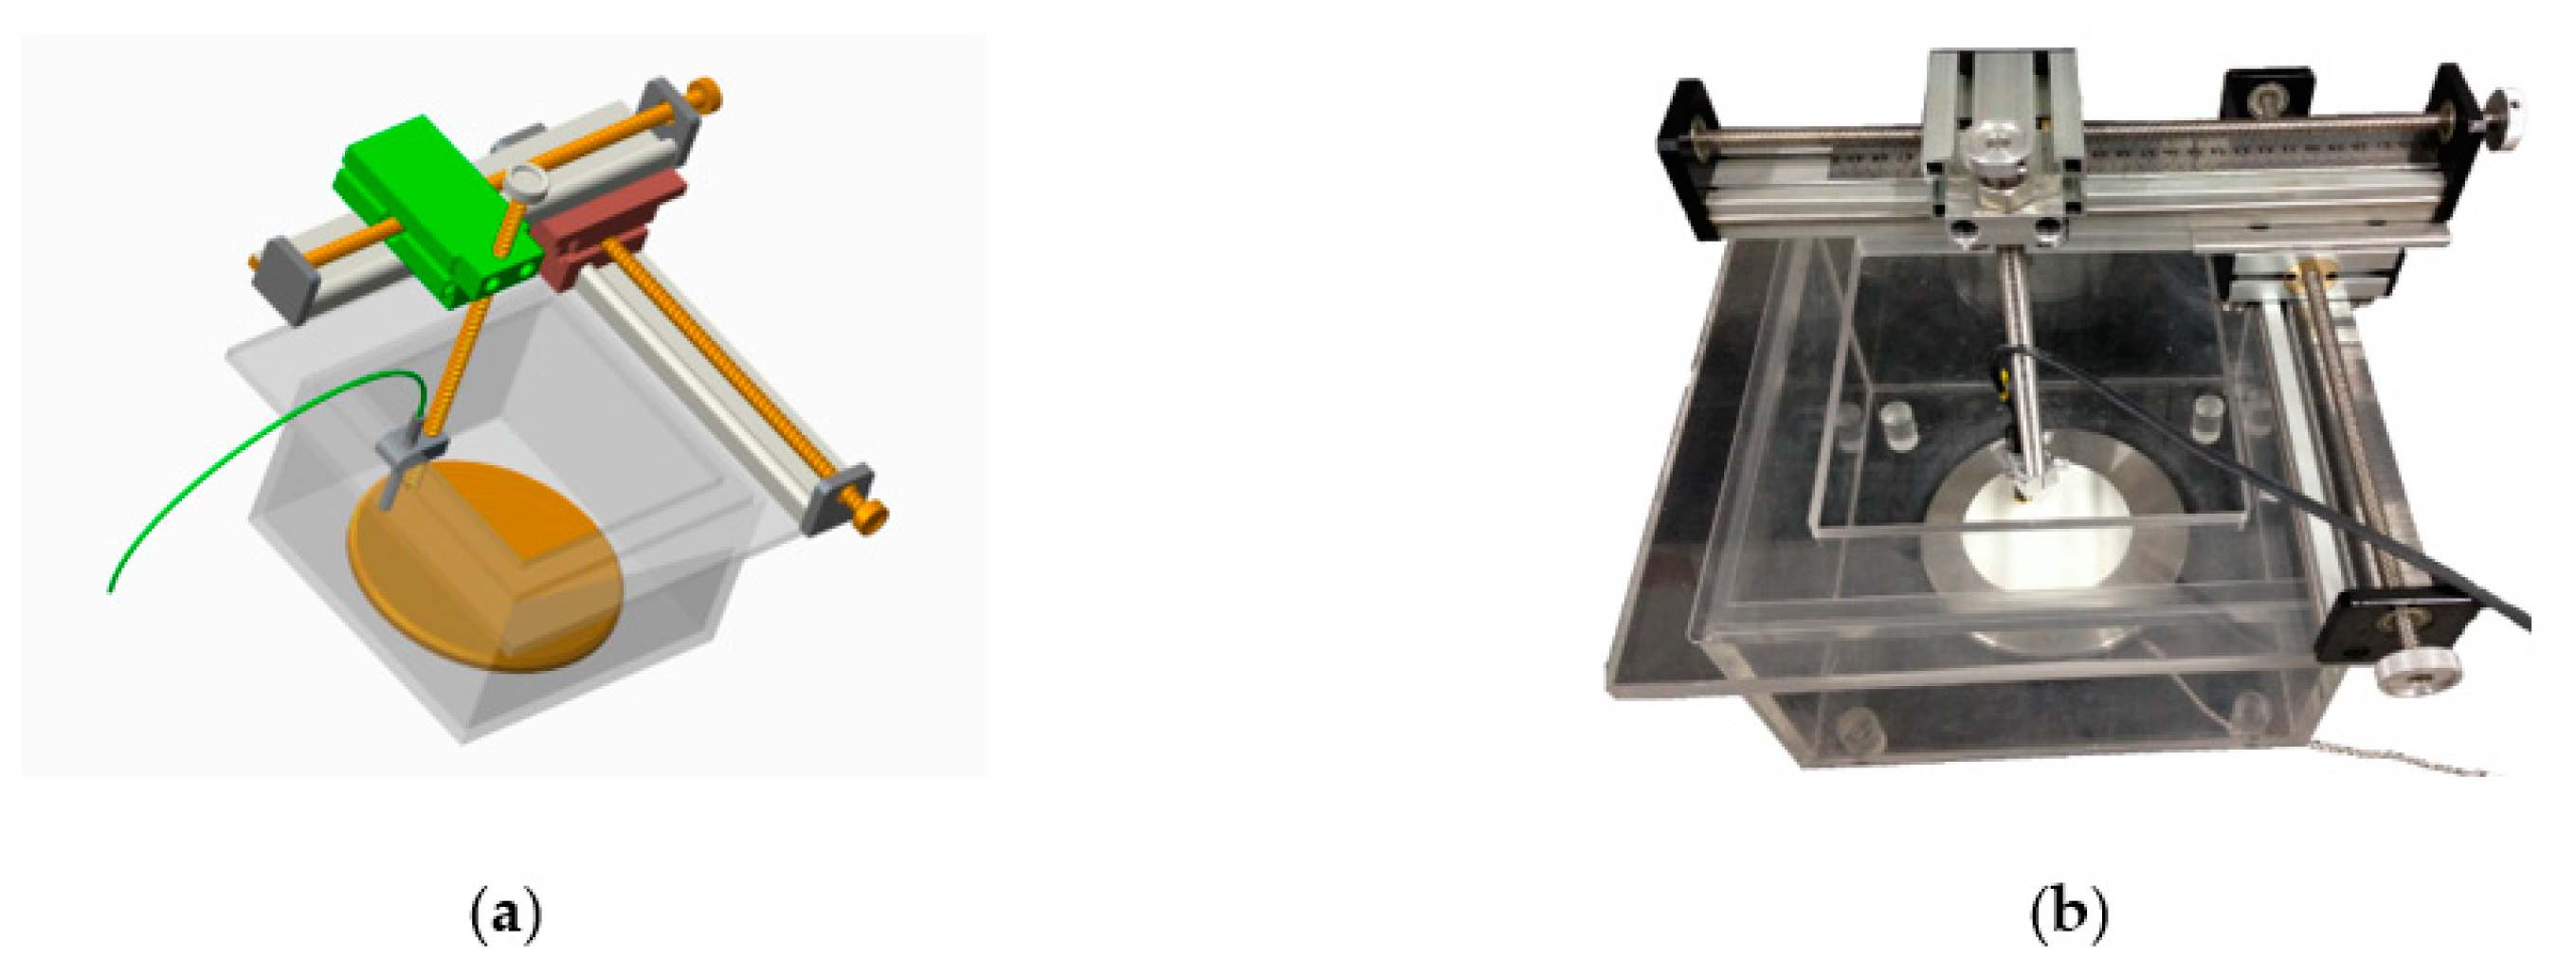
Figure 2 shows the testing system designed for measuring the surface potential. A transparent PMMA (polymethyl methacrylate) open box (300 × 300 × 200 mm) was made with a metal base plate (diameter = 150 mm) on the subface that could be connected to the ground. The probe that connected to the electrometer was fixed to the guide rail and kept vertical to the plate. The gap between the probe and sample was set at 2 mm. The measuring error can be limited within 2% when the gap distance is no more than 3 mm, beyond which the measuring error becomes dramatically higher [13]. The gap distance of not less than 2 mm could effectively avoid discharges between the sample surface and the probe [14]. The rail was marked with a scale, the measuring accuracy of which was 1 mm, adjusted continuously by rotary knobs. In this way, the probe could cover the whole area of the sample with the assistance of the guide rail.
The maximum output of the DC voltage source for the surface charge accumulation was ±60 kV, and the accuracy was 0.1 kV. Calorstat with an accuracy of 1 °C and a preservation range from room temperature to 300 °C was selected to control testing conditions. Amperemeter Keithley 6514 was used to measure the current from 1 fA to 20 mA with the accuracy of 1 fA.
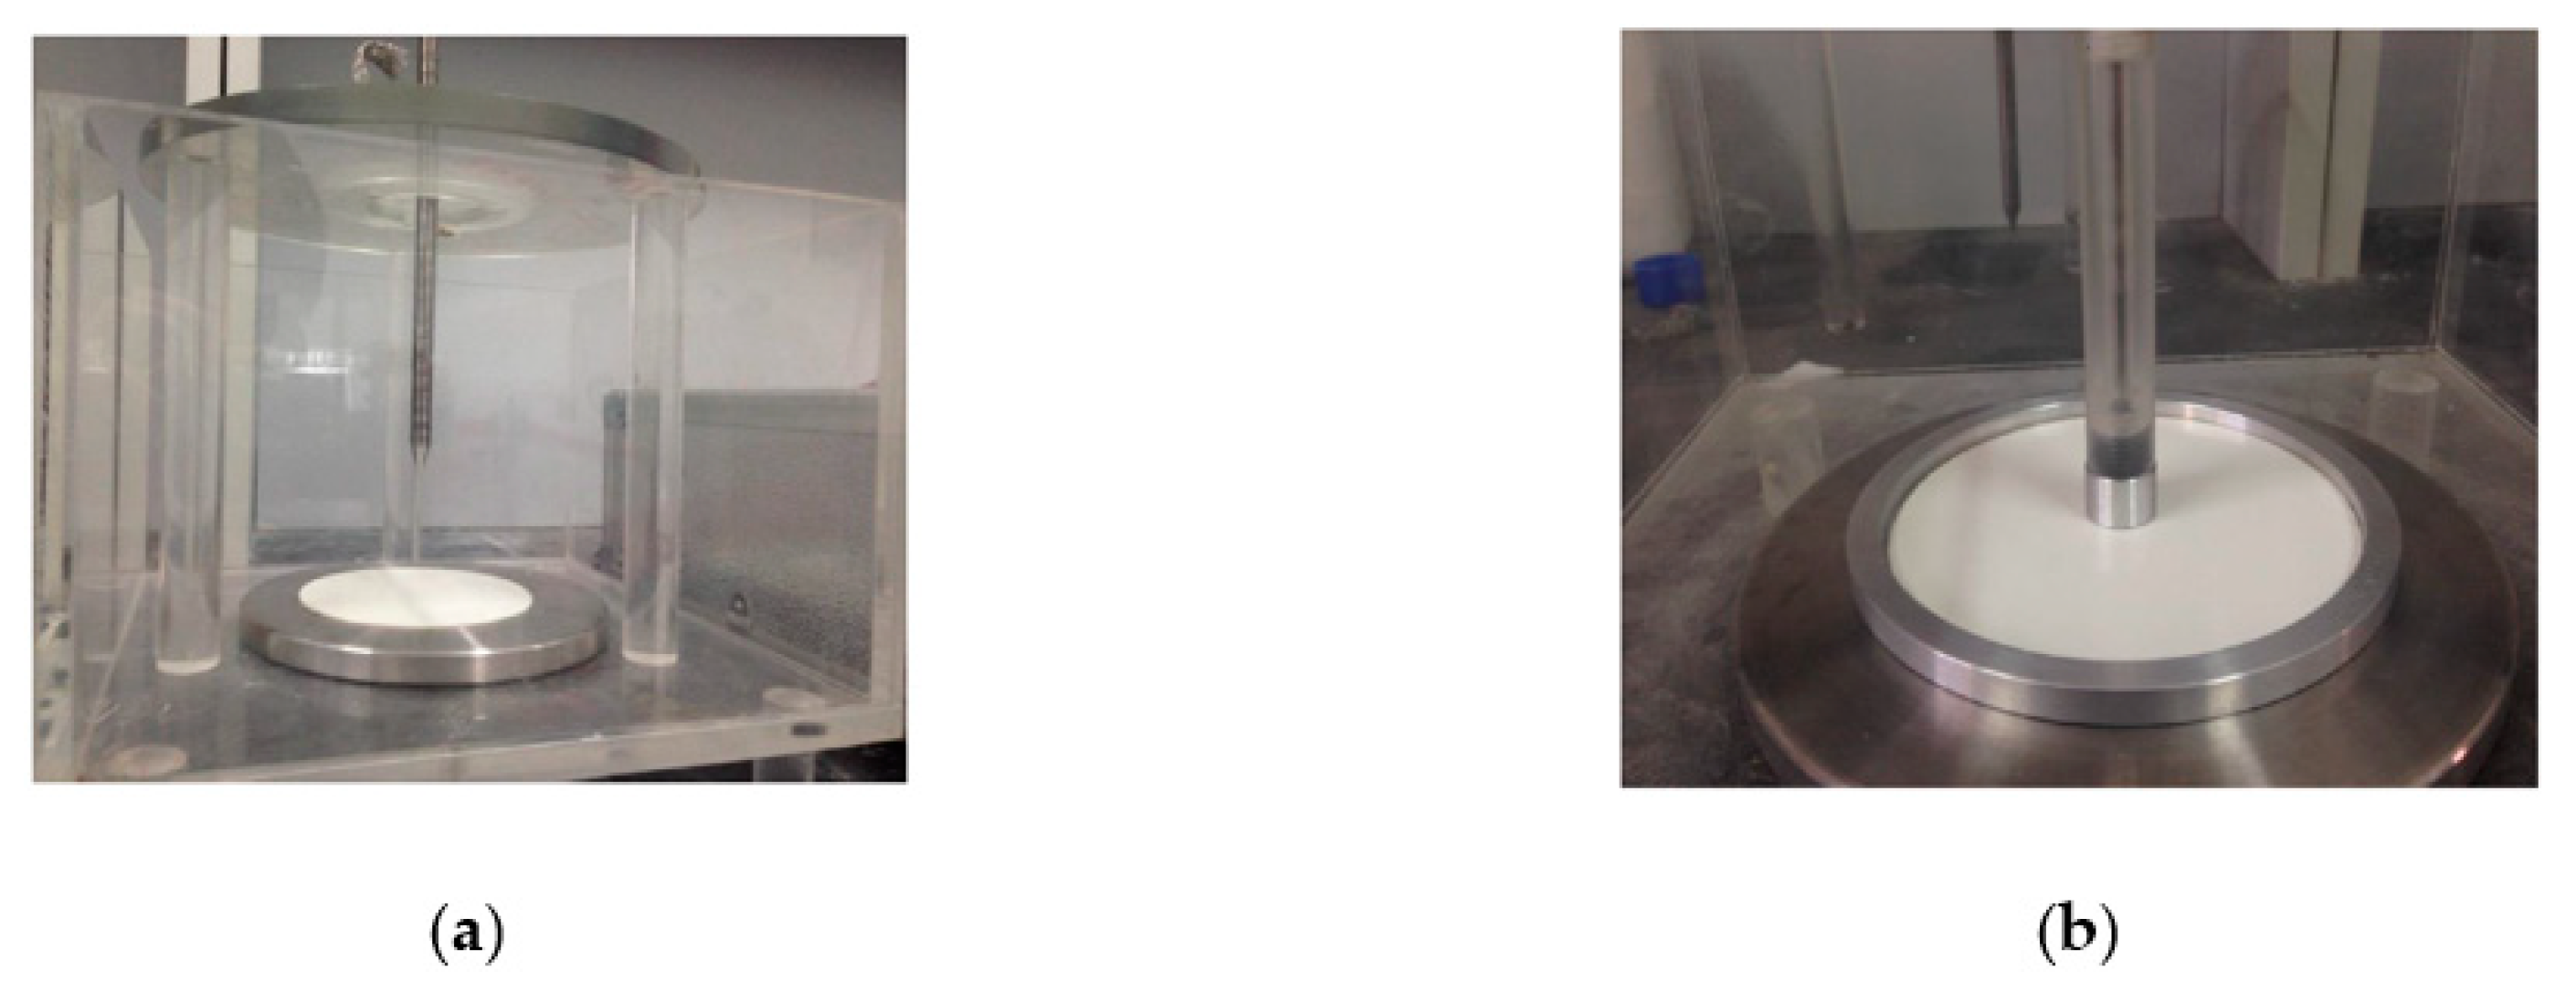
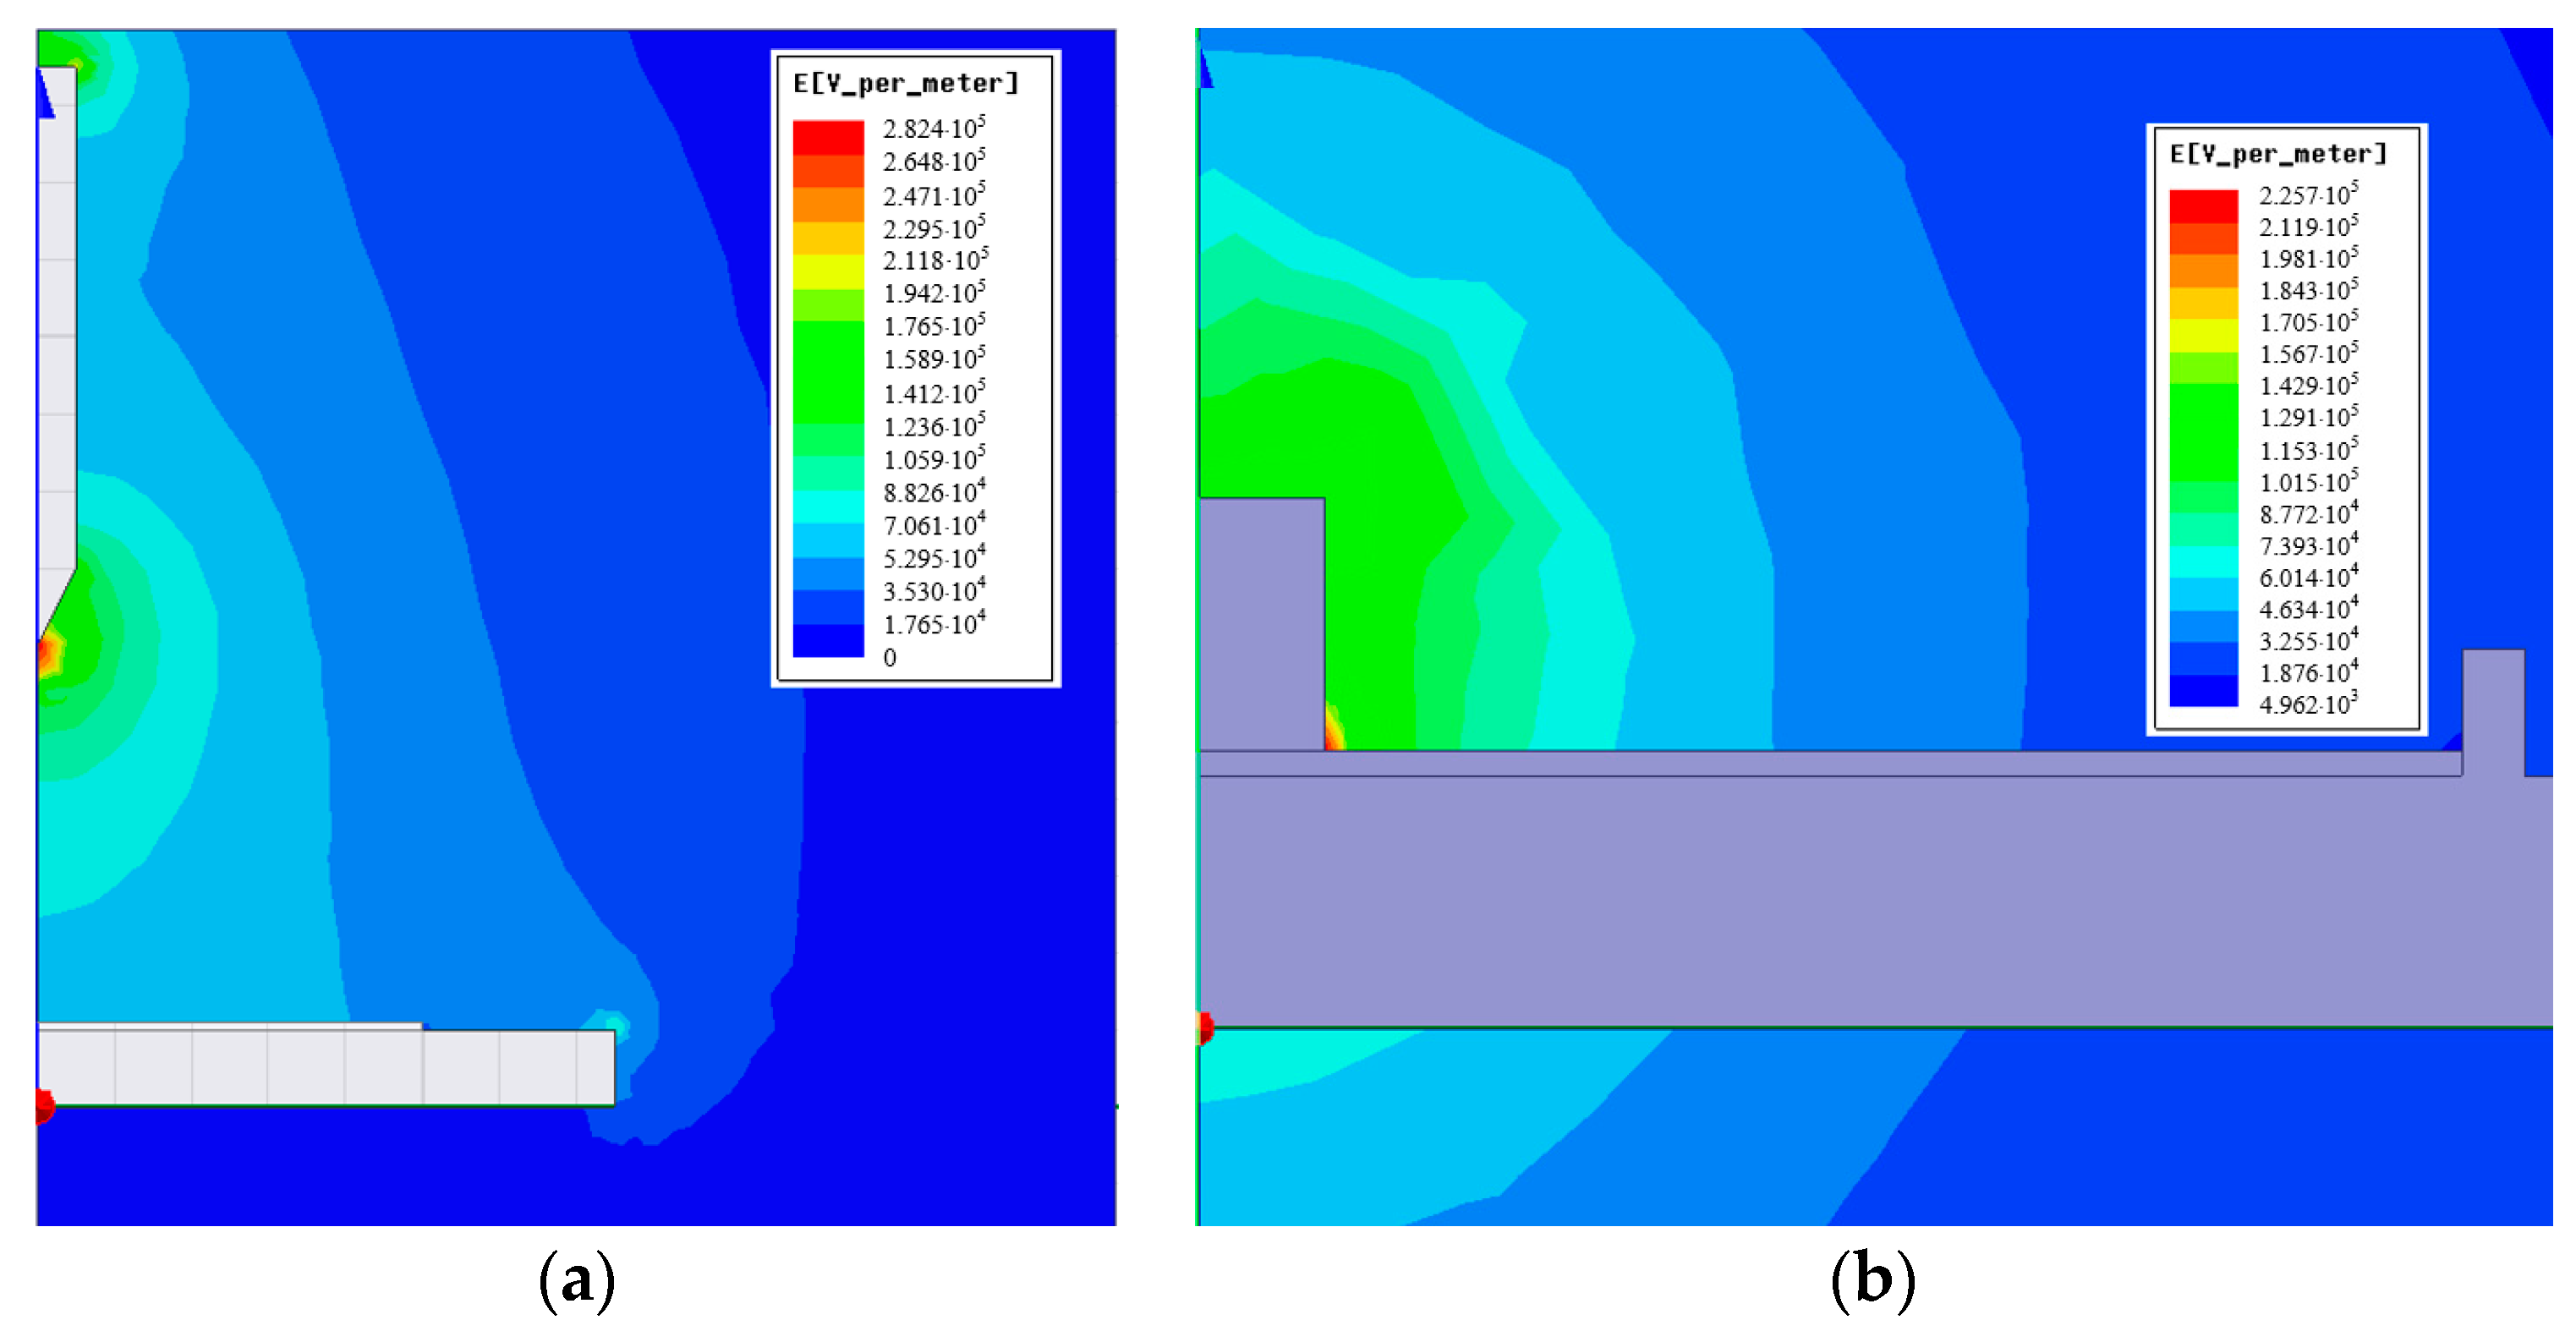
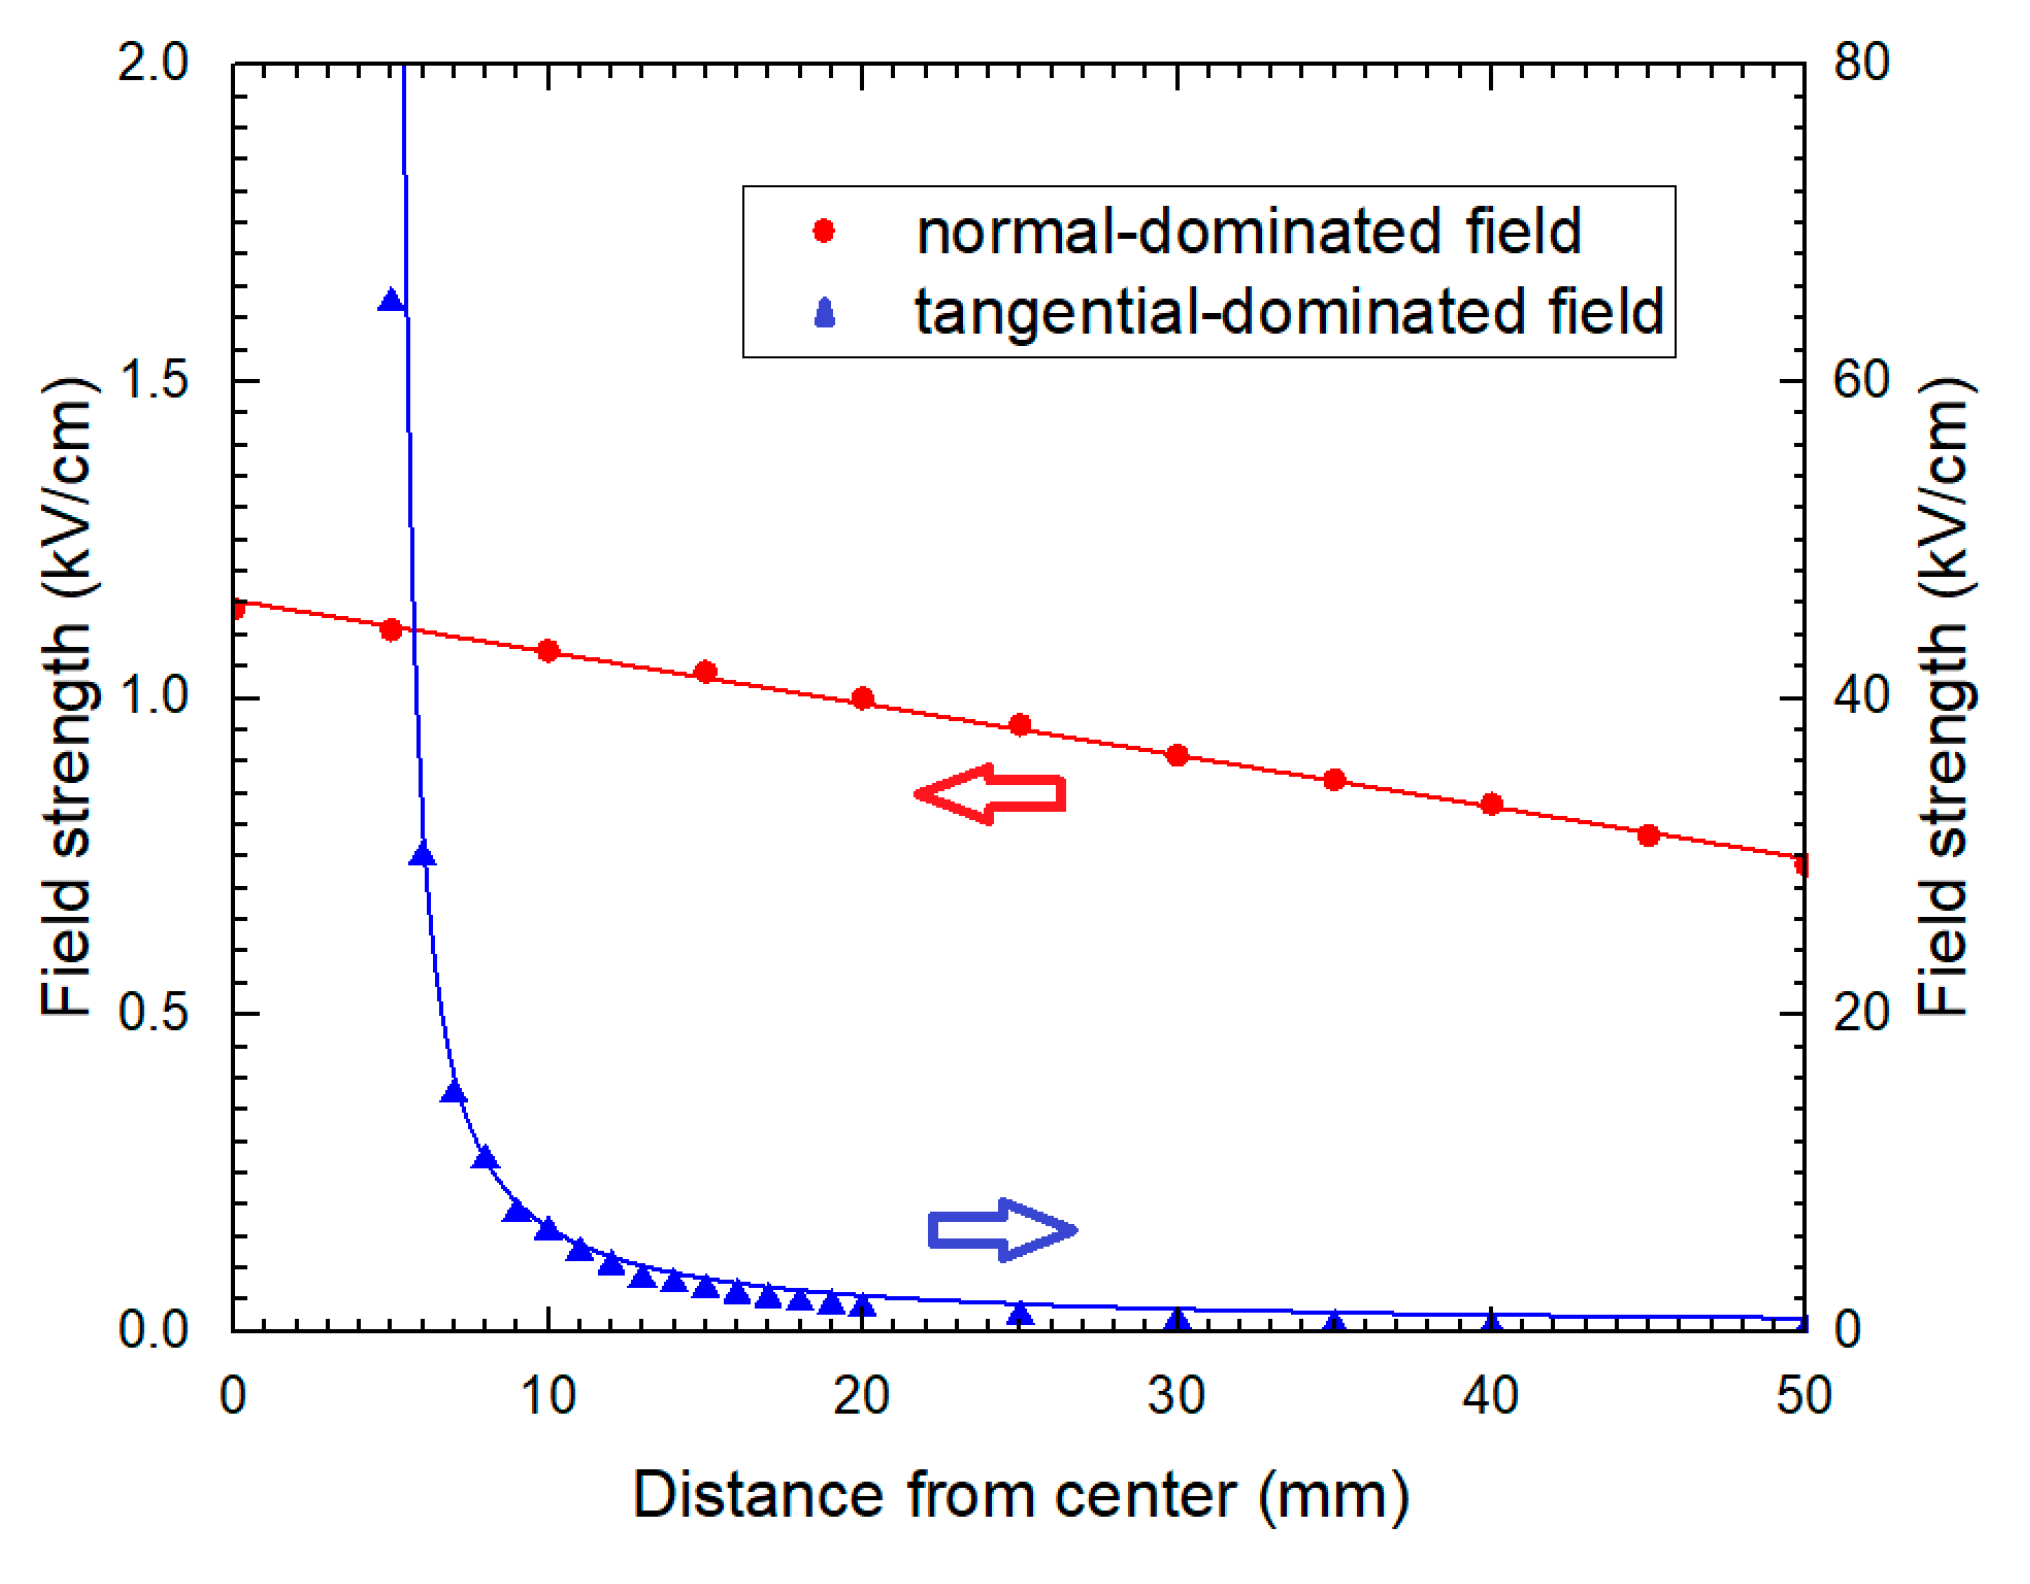
Two sets of different electrode configurations were developed to generate different types of electric fields. The electrodes were first placed on the top of the box to apply a DC electric field for a certain time. Then it was removed, and the measuring system was placed there instead to conduct the measurement. Figure 3 shows the needle-plate electrode designed to generate a normal-dominated electric field and the cylinder-annulus electrode designed to generate a tangential-dominated electric field. Using Maxwell Ansoft, the surface electric field distribution along the radial direction was demonstrated in Figure 4, which was consistent with our expectations. Field strength results near the sample surface were calculated according to finite element simulation and shown in Figure 5. Field strength under a tangential-dominated field is higher but is mainly concentrated in small areas near the inner electrode. While field strength under a normal dominated electric field decreases linearly along the radius.
The sample was put into the Calorstat three hours before the experiment. Then the DC electric field was applied by needle-plate or cylinder-annulus electrode for 10 min. After that, the electrode system was removed and the probe was set to perform the measurement.

3. Results and Discussion

3.1. Bulk and Surface Resistivity

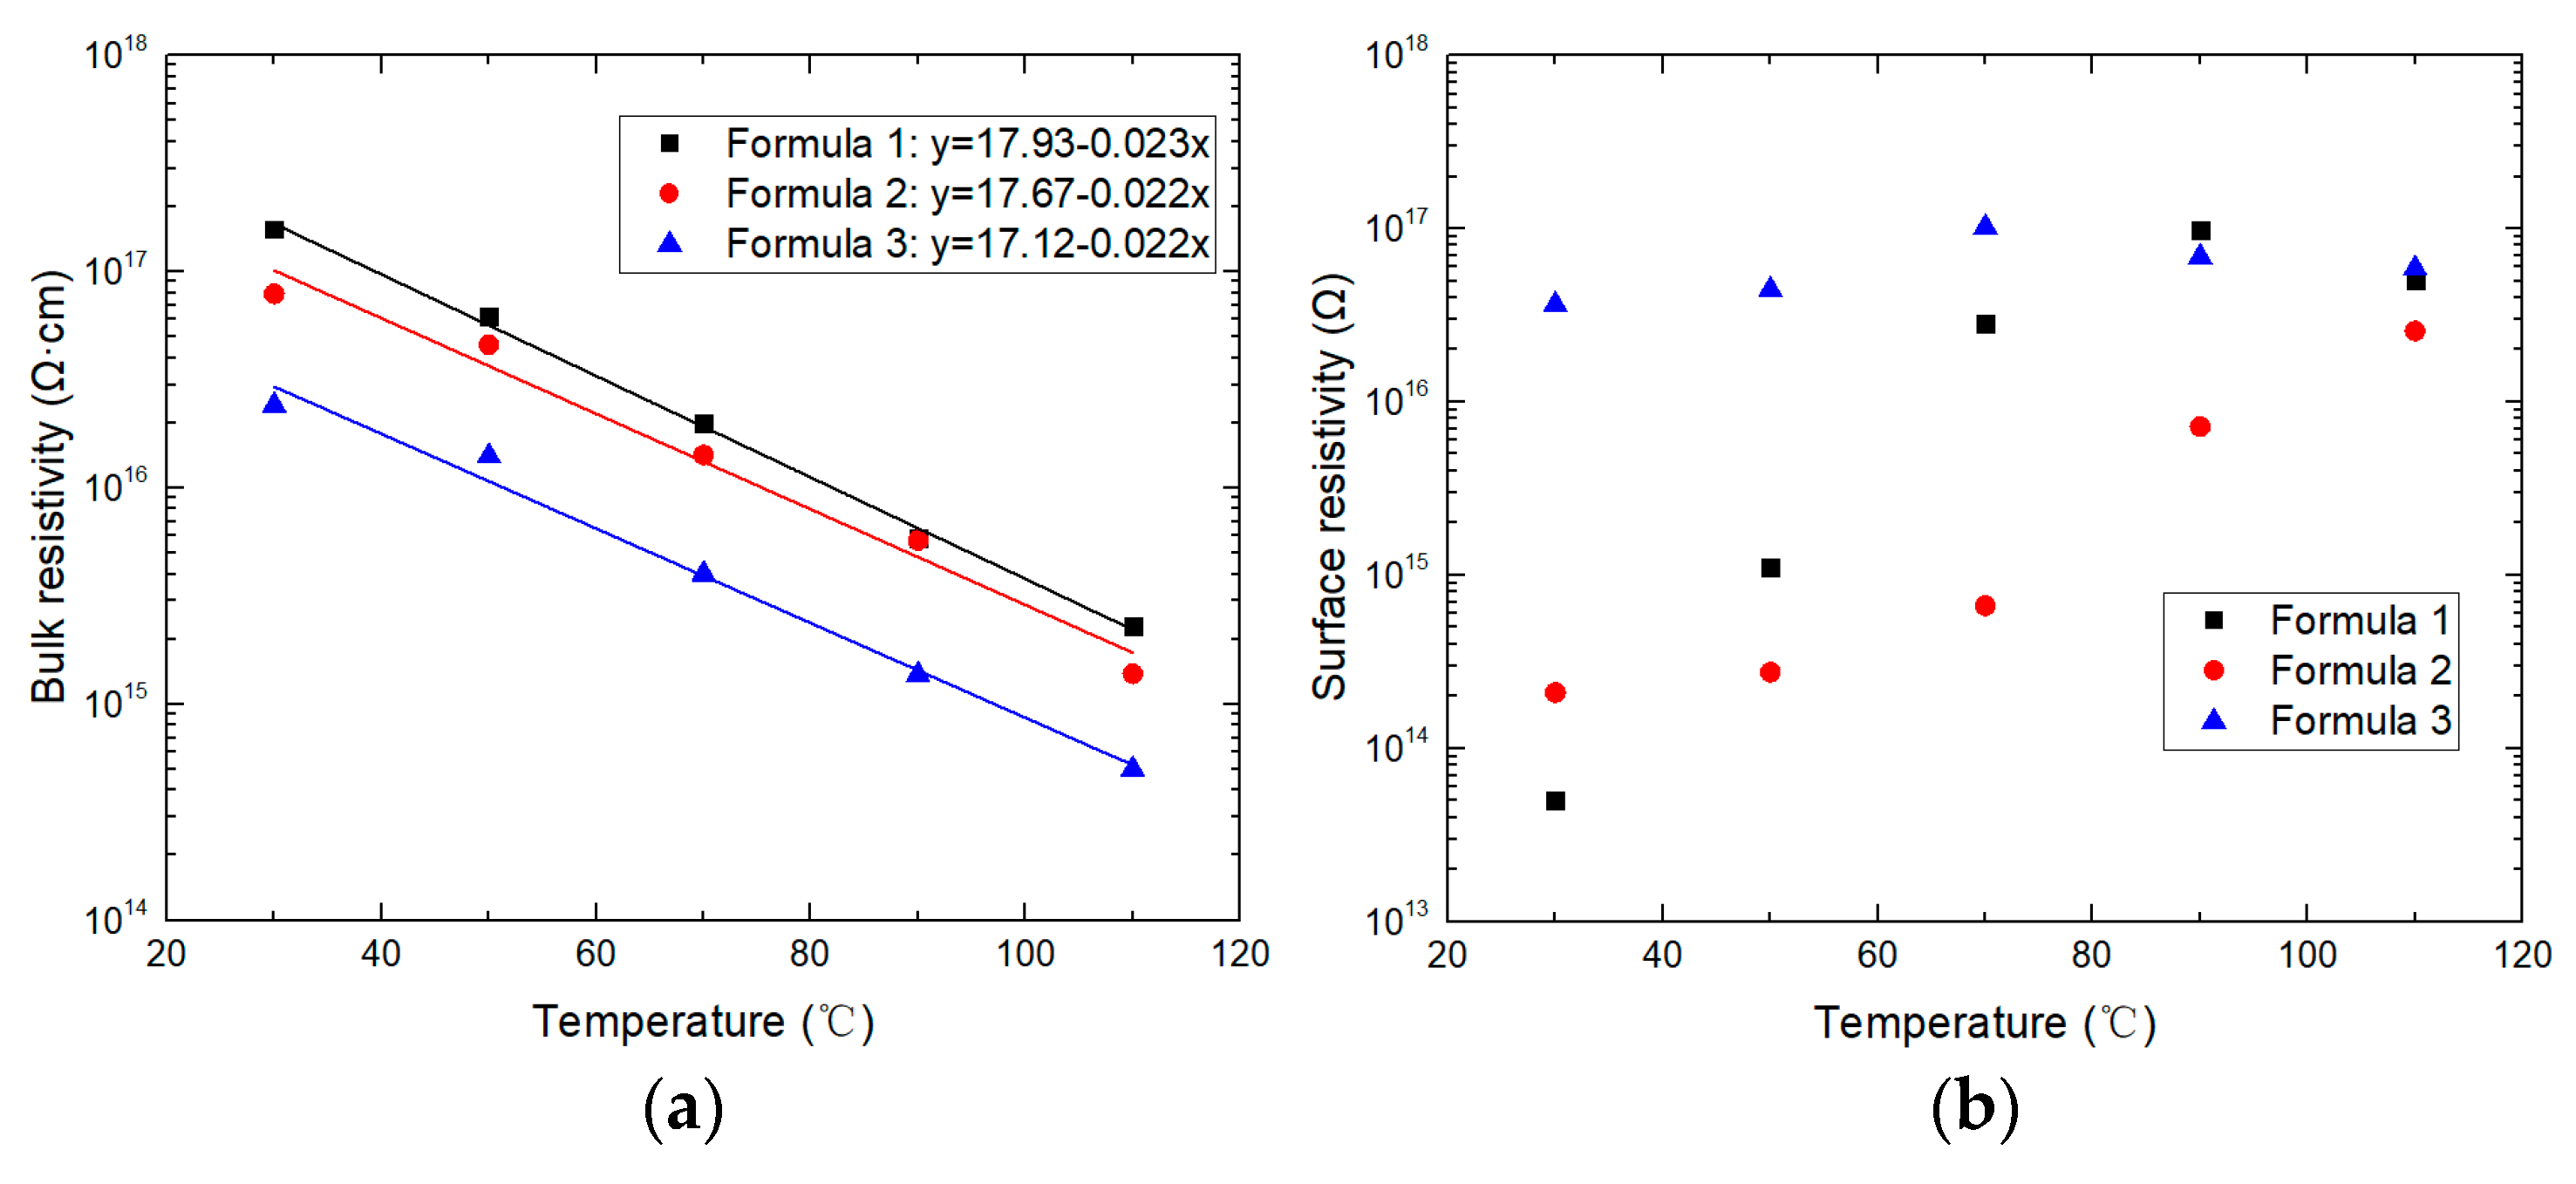
Bulk and surface resistivity as a function of the temperature from 30 to 110 °C were illustrated in Figure 6. The logarithm of bulk resistivity was negatively correlated to the temperature linearly within the investigated temperature range. From room temperature to 110 °C, the bulk resistivity was 20-fold lower. The temperature dependence of the bulk resistivity revealed little difference among the three formulas, as shown by the fitting results in Figure 6a (black for formula 1, red for formula 2 and blue for formula 3). Different from the bulk resistivity, surface resistivity is related not only to the properties of the material but also to the interfacial characteristics. In general, the surface resistivity is high for dry and clean dielectrics. It becomes lower mainly because there is moisture or impurities adsorbed on the surface [2]. Besides, the effect of surface trap distribution is an important factor in surface electron migration [21]. As a result, with the increase of temperature, the variation trend of surface resistivity was complicated. In general, it was larger at higher temperatures.

3.2. Surface Potential Distribution

First, DC voltages with different amplitudes and polarities under 30 °C were applied to generate a normal-dominated electric field for 10 min. The electric field generated by needle-plate electrode was quite asymmetrical, which means corona could easily happen during the test. Therefore, we also measured the leakage current when voltage increased. It was found that under negative voltage, when the voltage applied was less than 2.8 kV, the current waveform showed an average value of no more than 0.1 µA. Next, after the amplitude reached 2.8 kV, a pulse current occurred and the average value rose to 0.14 µA. Thereafter, with the increase in voltage, the number of pulses in the current increased gradually and made the overall value a little higher. Finally, once it got to 4.8 kV, the quantity and amplitude of pulses increased sharply. The average current value went up to 1.22 µA, which was caused by the intense corona discharge. The waveform of discharge under three typical voltages are shown in Figure 7.
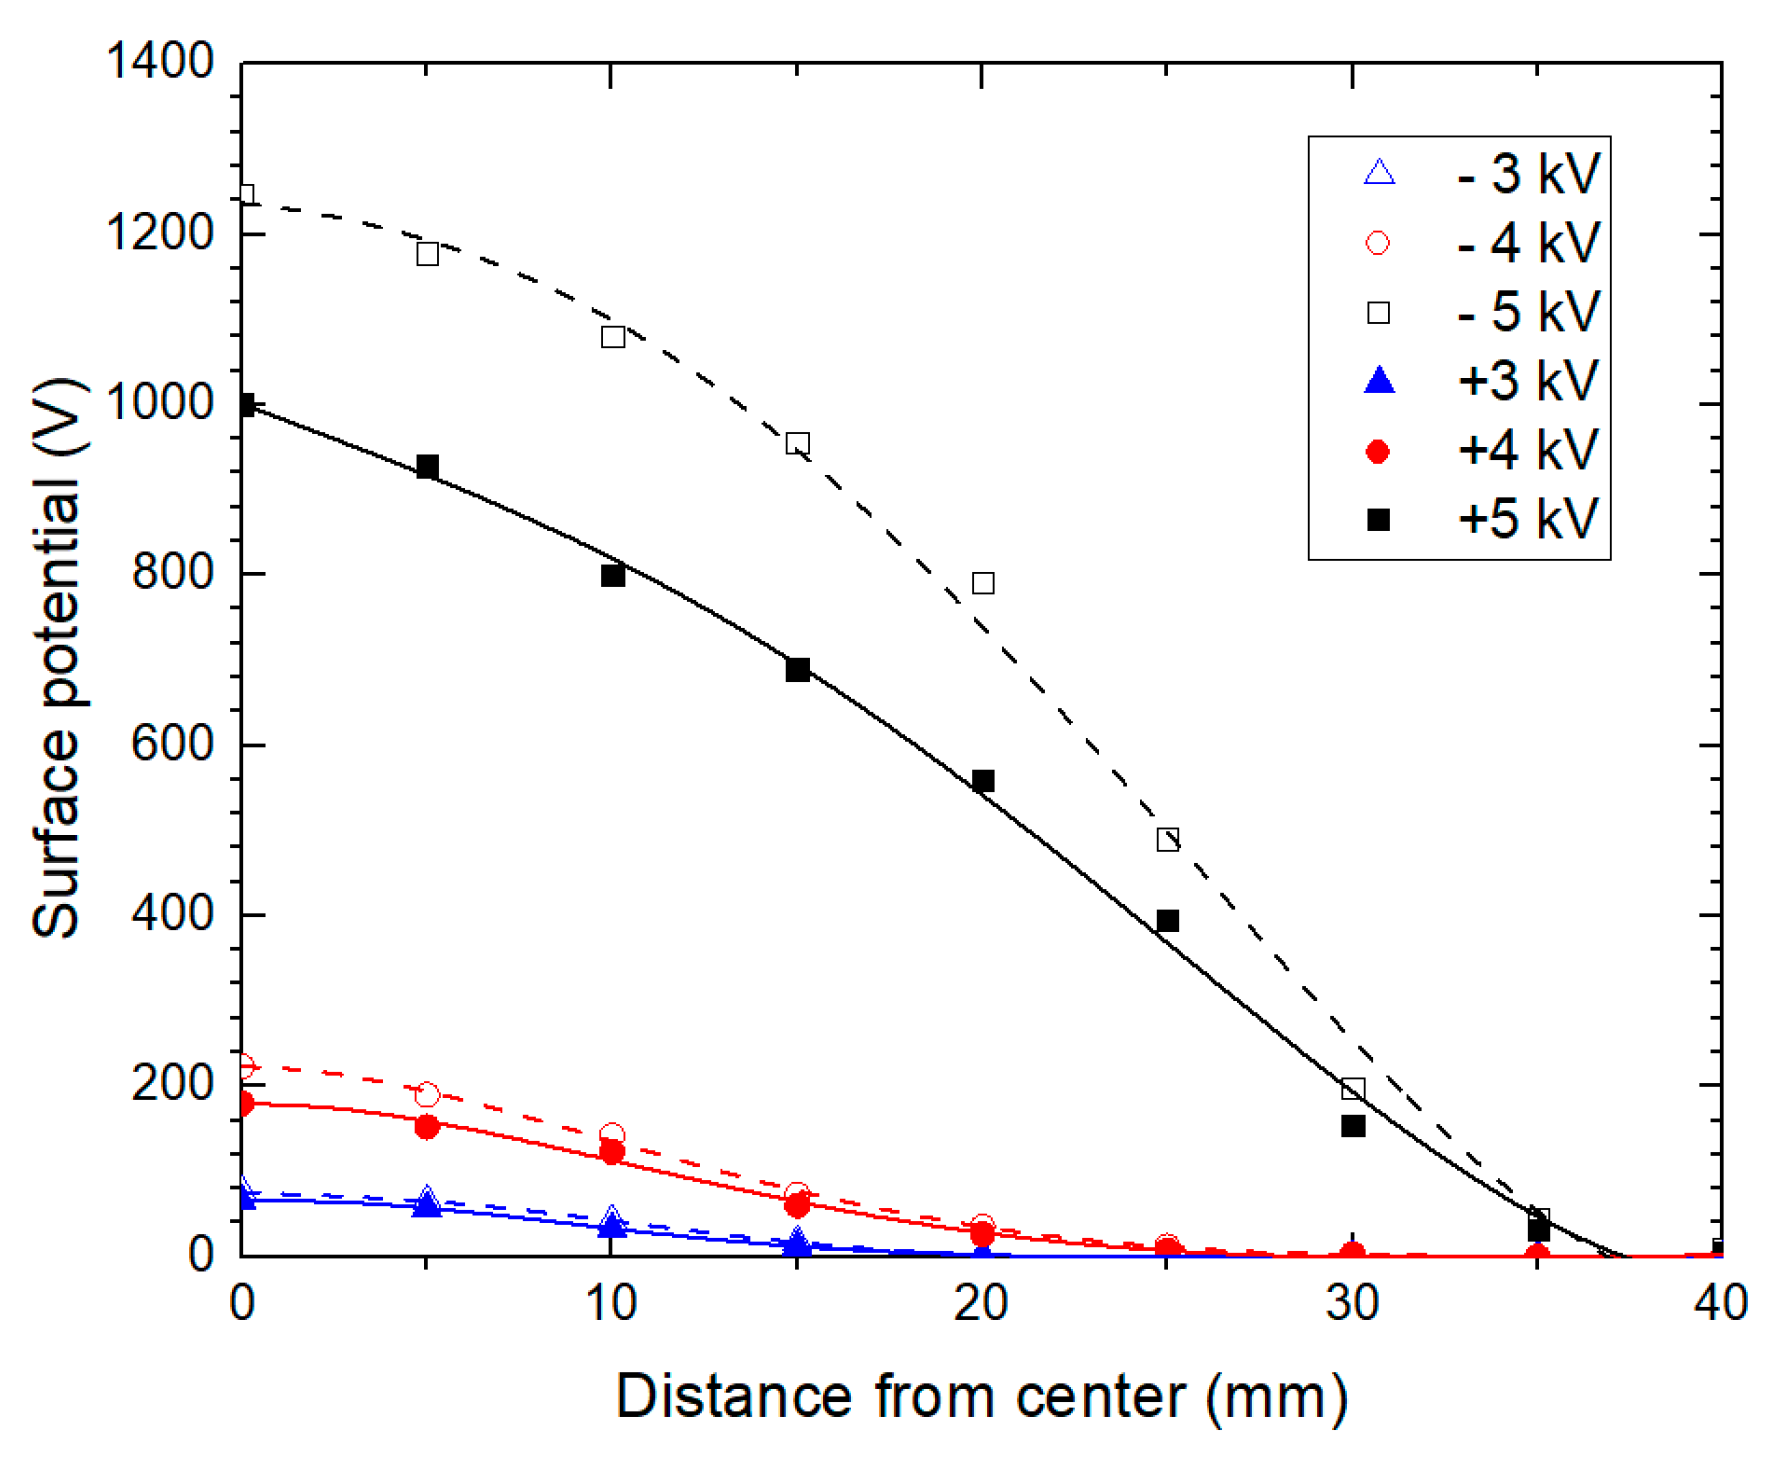
Surface potential distribution was measured and shown in Figure 8. It was found that when positive/negative voltage was applied, there was only positive/negative surface potential. Based on that, the surface potential under negative voltages was transformed into an absolute value for a side-by-side comparison. It has to be noted that surface potential is not proportional to the surface charge density [15]. That is, we could make a qualitative judgement about surface charge accumulation with the surface potential distribution, but it is not sufficient to derive the qualitative charge distribution directly.
When ±2 kV or a lower voltage was applied, the corona current was very weak and was unable to get much charge amassed on the surface to measure. When the voltage amplitude reached 3 kV, the electric field was strong enough to ionize the air. Thereafter, more charges accumulated on the surface, generating a higher potential. Furthermore, the discharge process was dramatically enhanced under voltages above 5 kV.
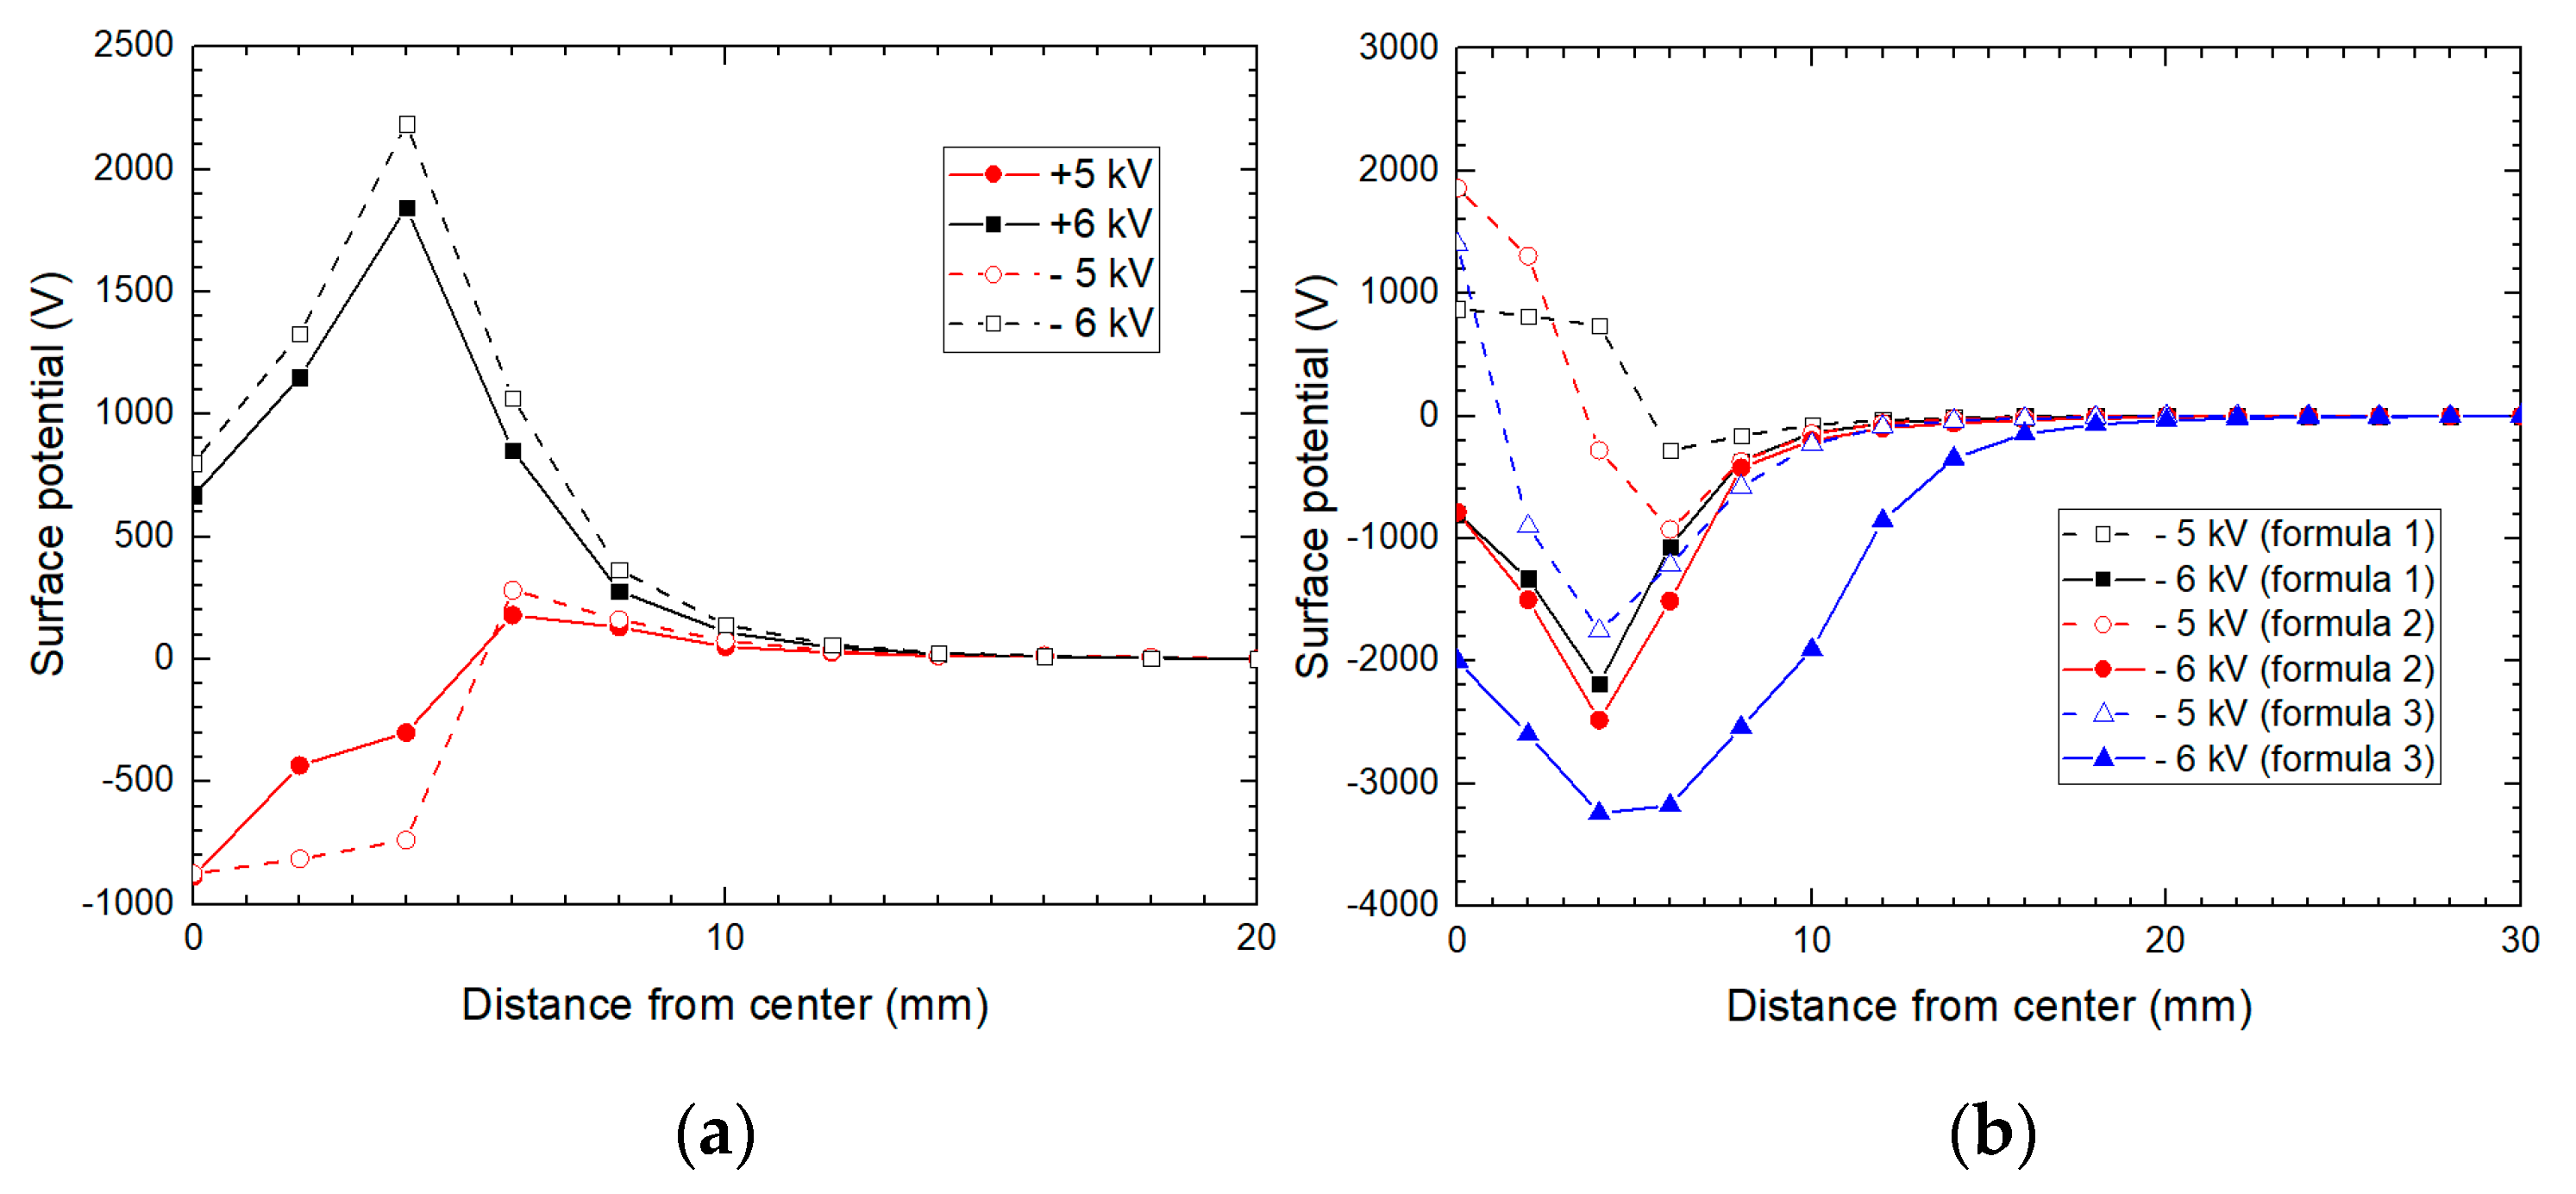
There were more charges accumulated on the sample surface when negative voltage was applied than compared to positive voltage with the same amplitude [25,26]. The reason could be attributed to the difference between negative charge (an electron) and positive charge (an atom that lost an electron). Discharge was more intense under negative voltages because of the polar effect of corona. In addition, the absorption properties of different charges were not the same. As a contrast, when a tangential-dominated electric field was applied, the surface potential distribution along the radial direction was irregular, as shown in Figure 9. The inner electrode was in contact with the sample, which was quite different from the needle electrode mentioned above. There were charges of different polarities existing since both positive and negative surface potential were detected. It could also be found that the potential under negative voltages was a little higher than that under positive voltages, which indicated there were more charges accumulated.
There are two theories that interpret the influence of the electric field distribution on surface charge accumulation. One insists that the normal electric field plays a major role in the accumulation [22,23]. The other proposes that the tangential electric field determines the surface resistivity and, thus, shows a dominated effect on the accumulation [24]. The results in this paper demonstrate that the charge was more likely to accumulate under a normal electric field because a similar potential was measured under much lower field strength. Therefore, the dependence of resistivity on the accumulation and dissipation processes would be investigated under a normal-dominated electric field in the following parts.
There are several possible sources of surface charge. The first is a partial discharge like corona, which happens if the field distribution is not uniform. A charge with the same polarity as the voltage applied is generated in this way. The second is field emission. The field strength for field emission of a cathode is about 109 V/m. However, when there is a micro burr on the electrode surface, the emission field strength could reduce to 107 V/m. Only electrons, i.e., negative charges, can be emitted. The third source is dielectric polarization. Under the force of the electric field, the charges inside the dielectric move directionally, and a layer of bound charge is formed on the material surface. In this paper, the polarity of the charge that accumulated on the upper surface by polarization was opposite from the voltage applied. Furthermore, if there are metal microparticles on the surface of an electrode or a sample, the local field could be distorted, resulting in a partial discharge. Therefore, the sample and electrode were carefully wiped with ethanol before the test to avoid metal particles.
After considering the test conditions in this paper, partial discharge and polarization contributed most to the surface charge. Since the charge polarities from these two sources were opposite, when the normal-dominated electric field was applied, partial discharge was clearly the major way.

3.3. Temperature Dependence of Surface Charge Accumulation

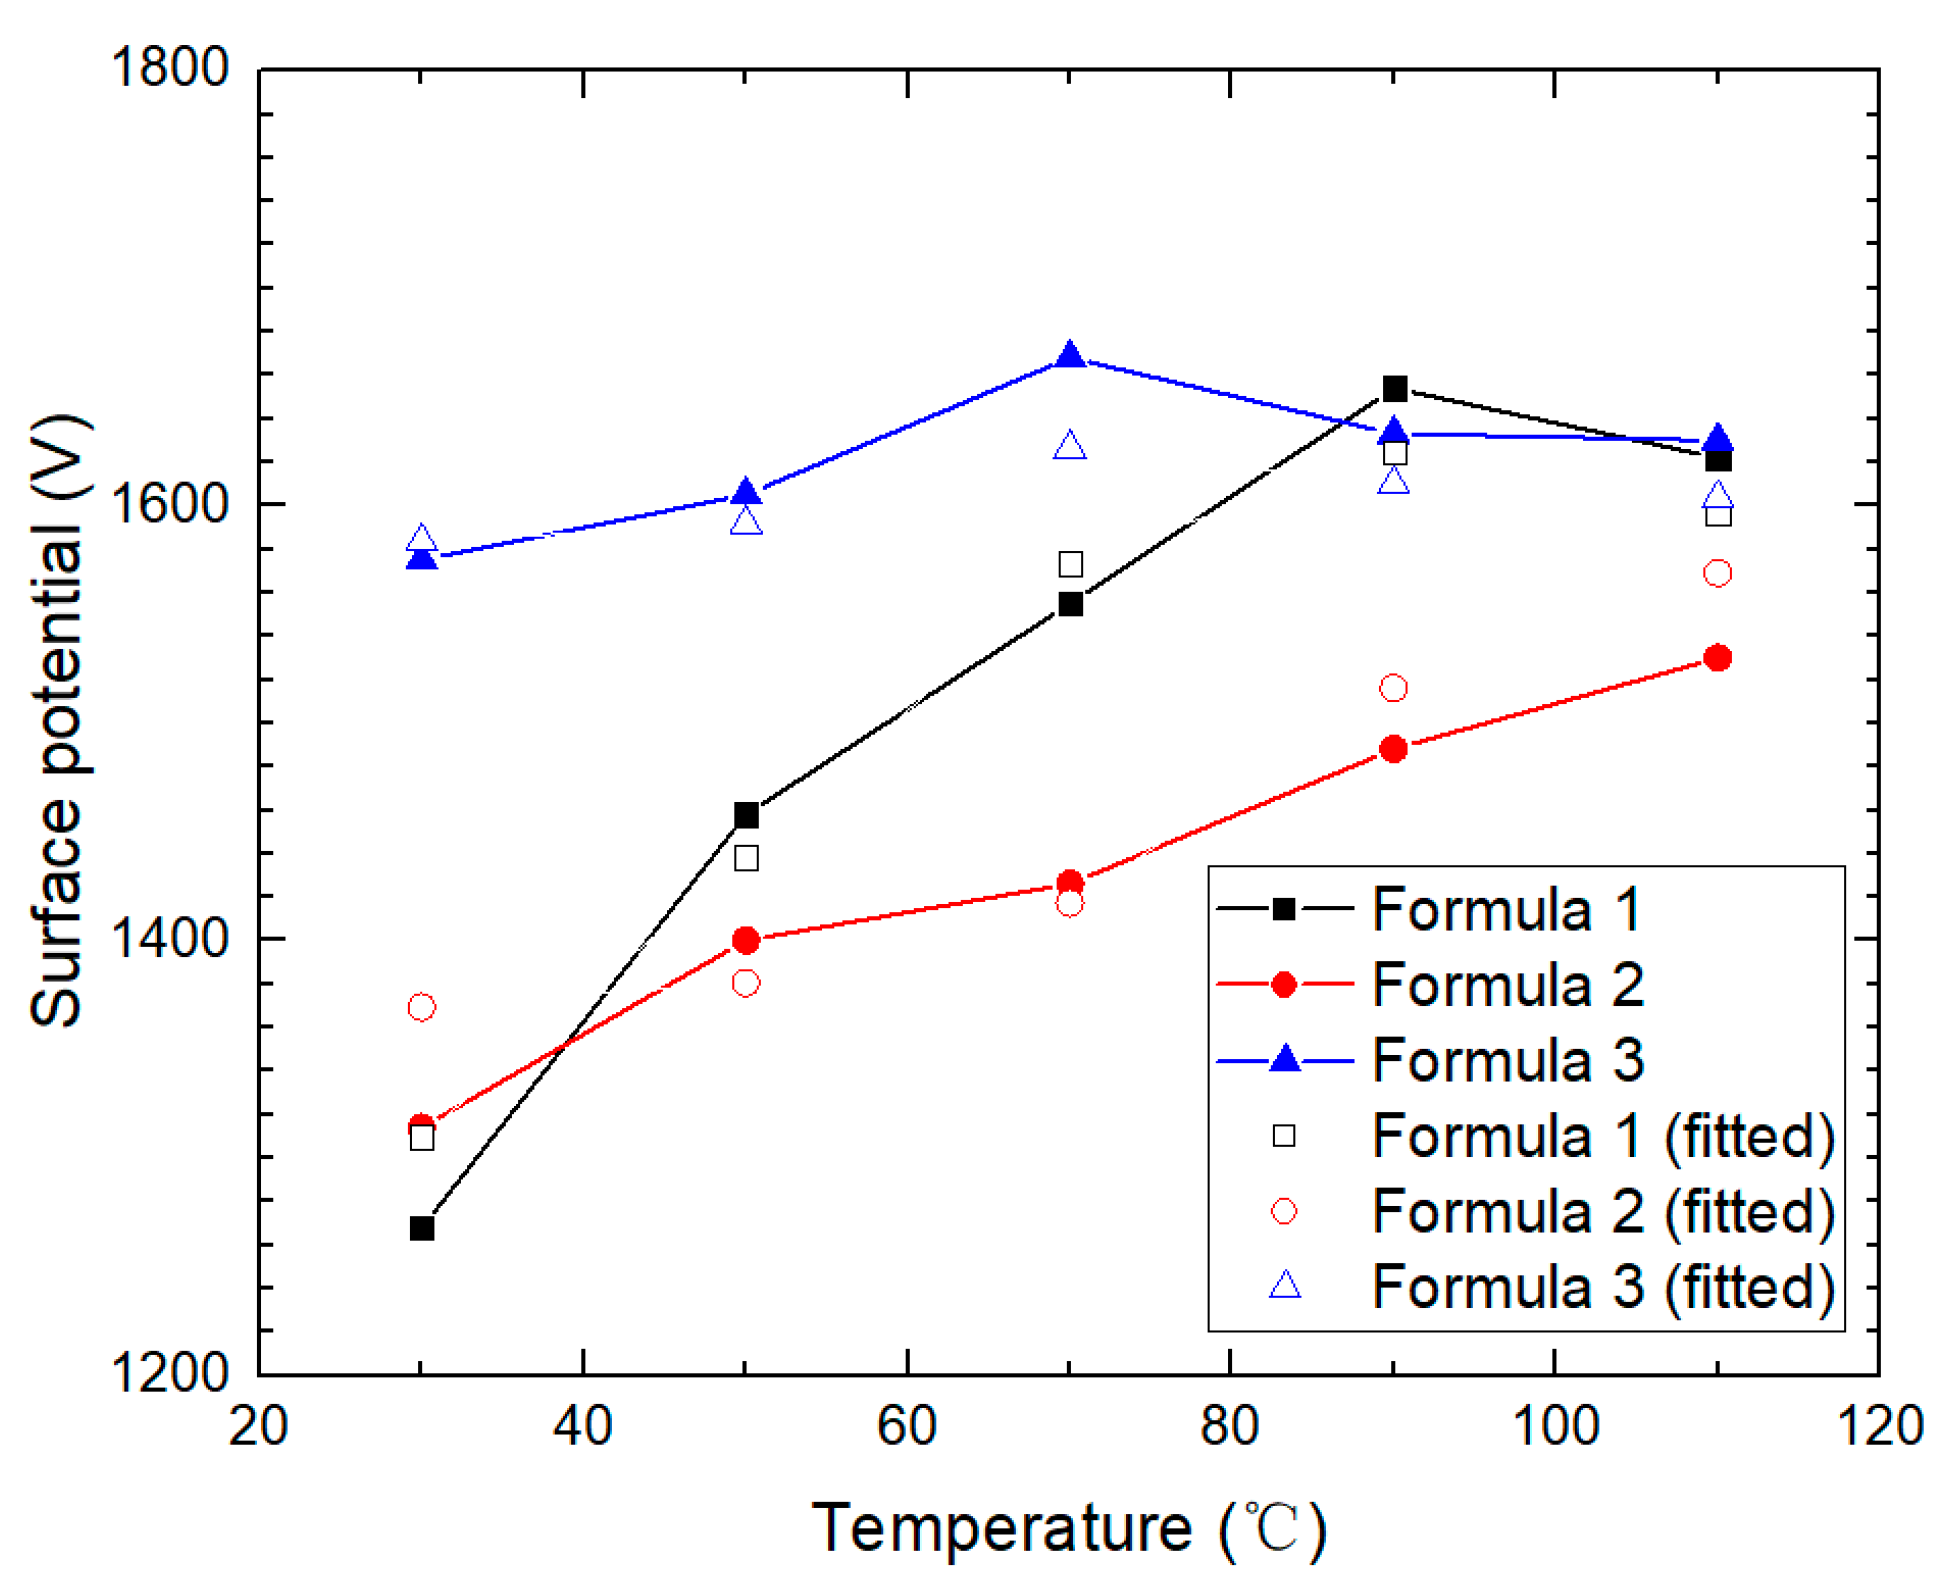
It was confirmed that the shapes of potential distribution curves under a normal-dominated electric field at different voltages for three formulas were the same as shown in Figure 8. Thereafter, if the polarity of the surface charge was identical, the potential at the sample center became proportional to the total charge quantity of the surface. Therefore, the center potentials of three formulas at different temperatures were measured and shown in Figure 10.
The surface potential variation as a function of the temperature was very similar to the variation of surface resistivity. The center surface potential was fitted by Equation (1):
U = K   lg ( ρ S )
where U is potential, ρ S is the surface resistivity, and K is a constant to be determined. According to the fitting results shown in Table 2, the average value of K was 95.61 and the variance was 3.91. The fitting results are also put into Figure 10 for comparison and were found to be basically consistent with the measurement.
It demonstrates that when only one electrode was in contact with the sample and the field was normal-dominated, the charge accumulation process was dominated by the surface resistivity.

3.4. Temperature Dependence of Surface Charge Dissipation

Samples after applied −5 kV in a normal-dominated way until saturation at different temperatures were kept on the grounded base plate for charge dissipation. The center potential variation was measured and shown in Figure 11. The initial potential was related to the surface resistivity as mentioned before.
There are three main ways of charge dissipation [27,28,29,30]. First is dissipating through the bulk of the sample. For homogeneous dielectrics, the dissipation of charge conforms to exponential law, that is
Q = Q 0 e t / τ
where Q is residual charge, Q 0 is initial charge, t is dissipation time and τ is the time constant for dissipation. In addition, τ is related to the properties of dielectrics:
τ = ε r ε 0 ρ V
where ρ V is bulk resistivity, ε 0 and ε r are vacuum and relative permittivity, respectively.
Dissipation can also occur along the sample surface with a relation among the surface current density j S ( t ) , surface resistivity ρ σ and local tangential electric field E t ( t ) :
j S ( t ) = E t ( t ) ρ σ
In addition, the surface charge could be neutralized by a free charge in the air. The density and migration rate of the free charge in the air play the most important role in the neutralization process. Compared to the two ways above, the process was very slow in this study due to the dominating influence of surface resistivity on the dissipation process, as we show below.
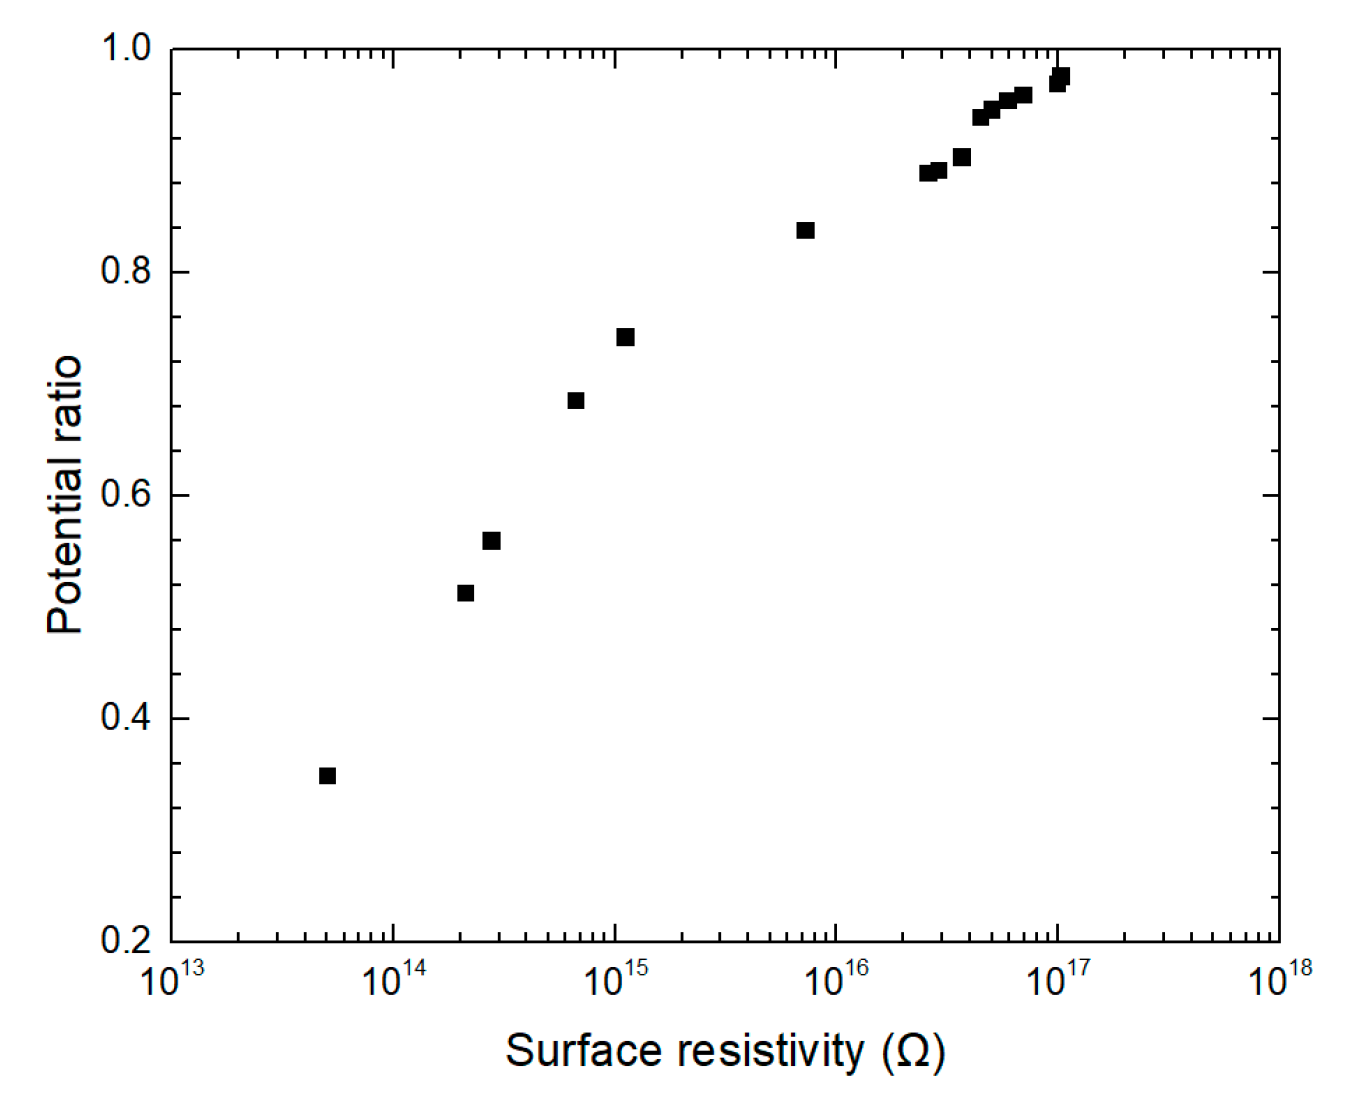
As we mentioned above, the logarithmic bulk resistivity reduced in an approximately linear way as the temperature rose. However, the dissipation progress did not show the same trend. It was found that the dissipation rate was more related to the surface resistivity. At higher temperatures, the surface charge of all three kinds of samples dissipated more slowly due to higher surface resistivity. At lower temperatures, the surface resistivities of Formula 1 and Formula 2 were much lower, and the dissipation process was apparently accelerated. The ratio of potential after 24 h dissipation to the initial potential for all the three formulas was calculated and shown in Figure 12. A clear positive correlation could be derived from the results.

4. Conclusions

The paper investigates the surface charge dynamics of epoxy resin composites affected by surface and bulk resistivity. Several main conclusions could be derived, as follows:
  • The logarithmic bulk resistivity decreased approximately linearly with the increase in temperature because of the molecular thermal motion. Overall, the surface resistivity increased, but the trend was complicated because it was affected by various factors.
  • More charges accumulated on the sample surface under negative voltages. For a tangential-dominated electric field, both positive and negative charges accumulated after voltage was applied. More charge tends to accumulate under a normal-dominated electric field. The inner structure of DC bushing should be optimized accordingly to avoid normal electric fields applying on the dielectric surface.
  • For a normal-dominated electric field, the saturation potential of the sample surface was closely related to the surface resistivity, which indicated that the main source of the surface charge was discharge in the air. The saturation potential was basically proportional to the logarithmic surface resistivity. Among the three model samples investigated, the coefficient between surface potential and the logarithm of the surface resistivity was similar.
  • For the samples under a normal-dominated electric field, the dissipation rate was dominated by the surface resistivity. It indicated that the surface charge mainly dissipated along the sample surface. Based on the results, formula modification could be conducted as well as surface modification in order to suppress the surface charge.

Author Contributions

Q.W.: data curation, formal analysis, writing. X.L.: formal analysis, methodology, manuscript review. K.C.: data curation, investigation, methodology. C.W.: formal analysis, manuscript editing. S.L.: methodology. All authors have read and agreed to the published version of the manuscript.

Funding

This research was funded by Natural Science Foundation of China grant number 51921005.

Institutional Review Board Statement

Not applicable.

Informed Consent Statement

Not applicable.

Data Availability Statement

The data presented in this study are available on request from the corresponding author. The data are not publicly available due to privacy.

Conflicts of Interest

The authors declare no conflict of interest.

References

  1. Liang, X.; Zhou, Y.; Zeng, R. High. Voltage Engineering, 2nd ed.; Tsinghua University Press: Beijing, China, 2015. (In Chinese) [Google Scholar]
  2. Chen, M.; Liu, X.; Liang, C.; Zhao, Y.; Tang, H. Study on surface charge accumulation characteristics of resin impregnated paper wall bushing core under positive AC voltage. Energies 2019, 12, 4420. [Google Scholar] [CrossRef] [Green Version]
  3. Liu, S. Study on Insulation Problems of ±1100kv DC Bushing Support Insulators. Ph.D. Thesis, Tsinghua University, Beijing, China, 2018. [Google Scholar]
  4. Li, C.; Hu, J.; Lin, C.; Zhang, B.; Zhang, G.; He, J. Surface charge migration and dc surface flashover of surface-modified epoxy-based insulators. J. Phys. D Appl. Phys. 2017, 50, 065301. [Google Scholar] [CrossRef]
  5. Zhang, B.; Qi, Z.; Zhang, G. Charge accumulation patterns on spacer surface in HVDC gas-insulated system: Dominant uniform charging and random charge speckles. IEEE Trans. Dielectr. Electr. Insul. 2017, 24, 1229–1238. [Google Scholar] [CrossRef]
  6. Zhou, H.-Y.; Ma, G.-M.; Wang, Y.; Li, C.-R.; Tu, Y.-P.; Ye, S.-P.; Zhang, B.; Guo, X.-F.; Yan, X.-L. Surface charge accumulation on 500kV cone-type GIS spacer under residual DC voltage. IEEE Trans. Dielectr. Electr. Insul. 2018, 25, 1230–1237. [Google Scholar] [CrossRef]
  7. Li, H.; Kim, J. Volume and surface resistivity measurement of insulating materials using guard-ring terminal electrodes. Energies 2020, 13, 2811. [Google Scholar] [CrossRef]
  8. Chen, X.; Guan, H.; Jiang, T.; Du, H.; Paramane, A.; Zhou, H. Surface charge dissipation and DC flashover characteristic of DBD plasma treated epoxy resin/AlN nanocomposites. IEEE Trans. Dielectr. Electr. Insul. 2020, 27, 504–511. [Google Scholar] [CrossRef]
  9. Zhang, S.; Peng, Z.; Liu, P.; Li, N. Design and dielectric characteristics of the ±1100 kV UHV DC wall bushing in China. IEEE Trans. Dielectr. Electr. Insul. 2015, 22, 409–419 101109/TDEI2014004454. [Google Scholar] [CrossRef]
  10. Li, D.; Zhang, G.; Wang, T.; Hou, Y. Charge accumulation characteristic on polymer insulator surface under AC voltage in air and C 4 F 7 N/CO 2 mixtures. High. Volt. 2020, 5, 160–165. [Google Scholar] [CrossRef]
  11. Winter, A.; Kindersberger, J. Transient field distribution in gas-solid insulation systems under DC voltages. IEEE Trans. Dielectr. Electr. Insul. 2014, 21, 116–128. [Google Scholar] [CrossRef]
  12. Du, B.X.; Li, A.; Li, J. Effects of AC and pulse voltage combination on surface charge accumulation and decay of epoxy resin. IEEE Trans. Dielectr. Electr. Insul. 2016, 23, 2368–2376. [Google Scholar] [CrossRef]
  13. Luo, Y.; Tang, J.; Pan, C.; Pan, Z.; Li, Y.; Cui, Z. Dynamics of surface charge and electric field distributions on basin-type insulator in GIS/GIL due to voltage polarity reversal. High. Volt. 2020, 5, 151–159. [Google Scholar] [CrossRef]
  14. Zhang, B.; Gao, W.; Hou, Y.; Zhang, G. Surface charge accumulation and suppression on fullerene-filled epoxy-resin insulator under DC voltage. IEEE Trans. Dielectr. Electr. Insul. 2018, 25, 2011–2019. [Google Scholar] [CrossRef]
  15. Tu, Y.; Zhou, F.; Jiang, H.; Bai, F.; Wang, C.; Lin, J.; Cheng, Y. Effect of nano-TiO2/EP composite coating on dynamic characteristics of surface charge in epoxy resin. IEEE Trans. Dielectr. Electr. Insul. 2018, 25, 1308–1317. [Google Scholar] [CrossRef]
  16. Fujinami, H.; Yashima, M.; Takuma, T. Mechanism of the charge accumulation on gas insulated spacers under DC stress. In Proceedings of the 5th International Symposium on High Voltage Engineering, Braunschweig, Germany, 12–17 July 1987. [Google Scholar]
  17. Fujinami, H.; Takuma, T.; Yashima, M.; Kawamoto, T. Mechanism and effect of DC charge accumulation on SF/sub 6/ gas insulated spacers. IEEE Trans. Power Deliv. 1989, 4, 1765–1772. [Google Scholar] [CrossRef]
  18. Cooke, C.; Wootton, R.; Cookson, A. Influence of particles on AC and DC electrical performance of gas insulated systems at extra-high-voltage. IEEE Trans. Power Appar. Syst. 1977, 96, 768–777. [Google Scholar] [CrossRef]
  19. IEC Standard- International Electrotechnical Commission. Methods of Test for Volume Resistivity and Surface Resistivity of Solid Electrical Insulating Materials; International Electrotechnical Commission: Geneva, Switzerland, 1980. [Google Scholar]
  20. Chen, K. Experimental Study of Accumulation Characteristics of Surface Charges on Epoxy in Air. Master’s Thesis, Tsinghua University, Beijing, China, 2016. [Google Scholar]
  21. Kumada, A.; Okabe, S.; Hidaka, K. Resolution and signal processing technique of surface charge density measurement with electrostatic probe. IEEE Trans. Dielectr. Electr. Insul. 2004, 11, 122–129. [Google Scholar] [CrossRef]
  22. Li, C.; Hu, J.; Lin, C.; He, J. The control mechanism of surface traps on surface charge behavior in alumina-filled epoxy composites. J. Phys. D Appl. Phys. 2016, 49, 445304. [Google Scholar] [CrossRef]
  23. Babu, M.S.; Sarathi, R.; Vasa, N.J.; Imai, T. Investigation on space charge and charge trap characteristics of gamma-irradiated epoxy micro–nano composites. High. Volt. 2020, 5, 191–201. [Google Scholar] [CrossRef]
  24. Li, D.; Zhang, G.; Hou, Y.; Zhang, B. Charge distribution on polymer insulator surface under AC voltage. IEEE Trans. Dielectr. Electr. Insul. 2019, 26, 1709–1715. [Google Scholar] [CrossRef]
  25. Wang, F.; Fang, Z.; Qiu, Y. Study of Charge Accumulation on Insulator Surface in HVDC Gas-Insulated Switchgear. Chin. Soc. Electr. Eng. 2005, 3, 107–111. (In Chinese) [Google Scholar]
  26. Zhang, G.; Zhang, B.; Wang, Q.; Li, J. Study of charge accumulation on insulator aurface in HVDC gas-insulated switchgear. High. Volt. Engir. 2015, 41, 1430–1436. (In Chinese) [Google Scholar] [CrossRef]
  27. Xing, Z.; Li, C.; Zhang, C.; Zhang, Z.; Li, W.; Ru, J.; Xiao, Y.; Zhou, Y.; Chen, X. Influence of epoxy insulating materials parameters on surface charge characteristics and surface flashover under DC. In Proceedings of the 2017 1st International Conference on Electrical Materials and Power Equipment (ICEMPE), Xi’an, China, 14–17 May 2017; pp. 184–187. [Google Scholar]
  28. Schueller, M.; Straumann, U.; Franck, C. Role of ion sources for spacer charging in SF6 gas insulated HVDC systems. IEEE Trans. Dielectr. Electr. Insul. 2014, 21, 352–359. [Google Scholar] [CrossRef]
  29. Iwabuchi, H.; Donen, T.; Matsuoka, S.; Kumada, A.; Hidaka, K.; Hoshina, Y.; Takei, M. Influence of surface-conductivity nonuniformity on charge accumulation of GIS downsized model spacer under DC field application. Electr. Eng. Jpn. 2012, 181, 29–36. [Google Scholar] [CrossRef]
  30. Hama, H.; Hikosaka, T.; Okabe, S.; Okubo, H. Cross-equipment study on charging phenomena of solid insulators in high voltage equipment. IEEE Trans. Dielectr. Electr. Insul. 2007, 14, 508–519. [Google Scholar] [CrossRef]
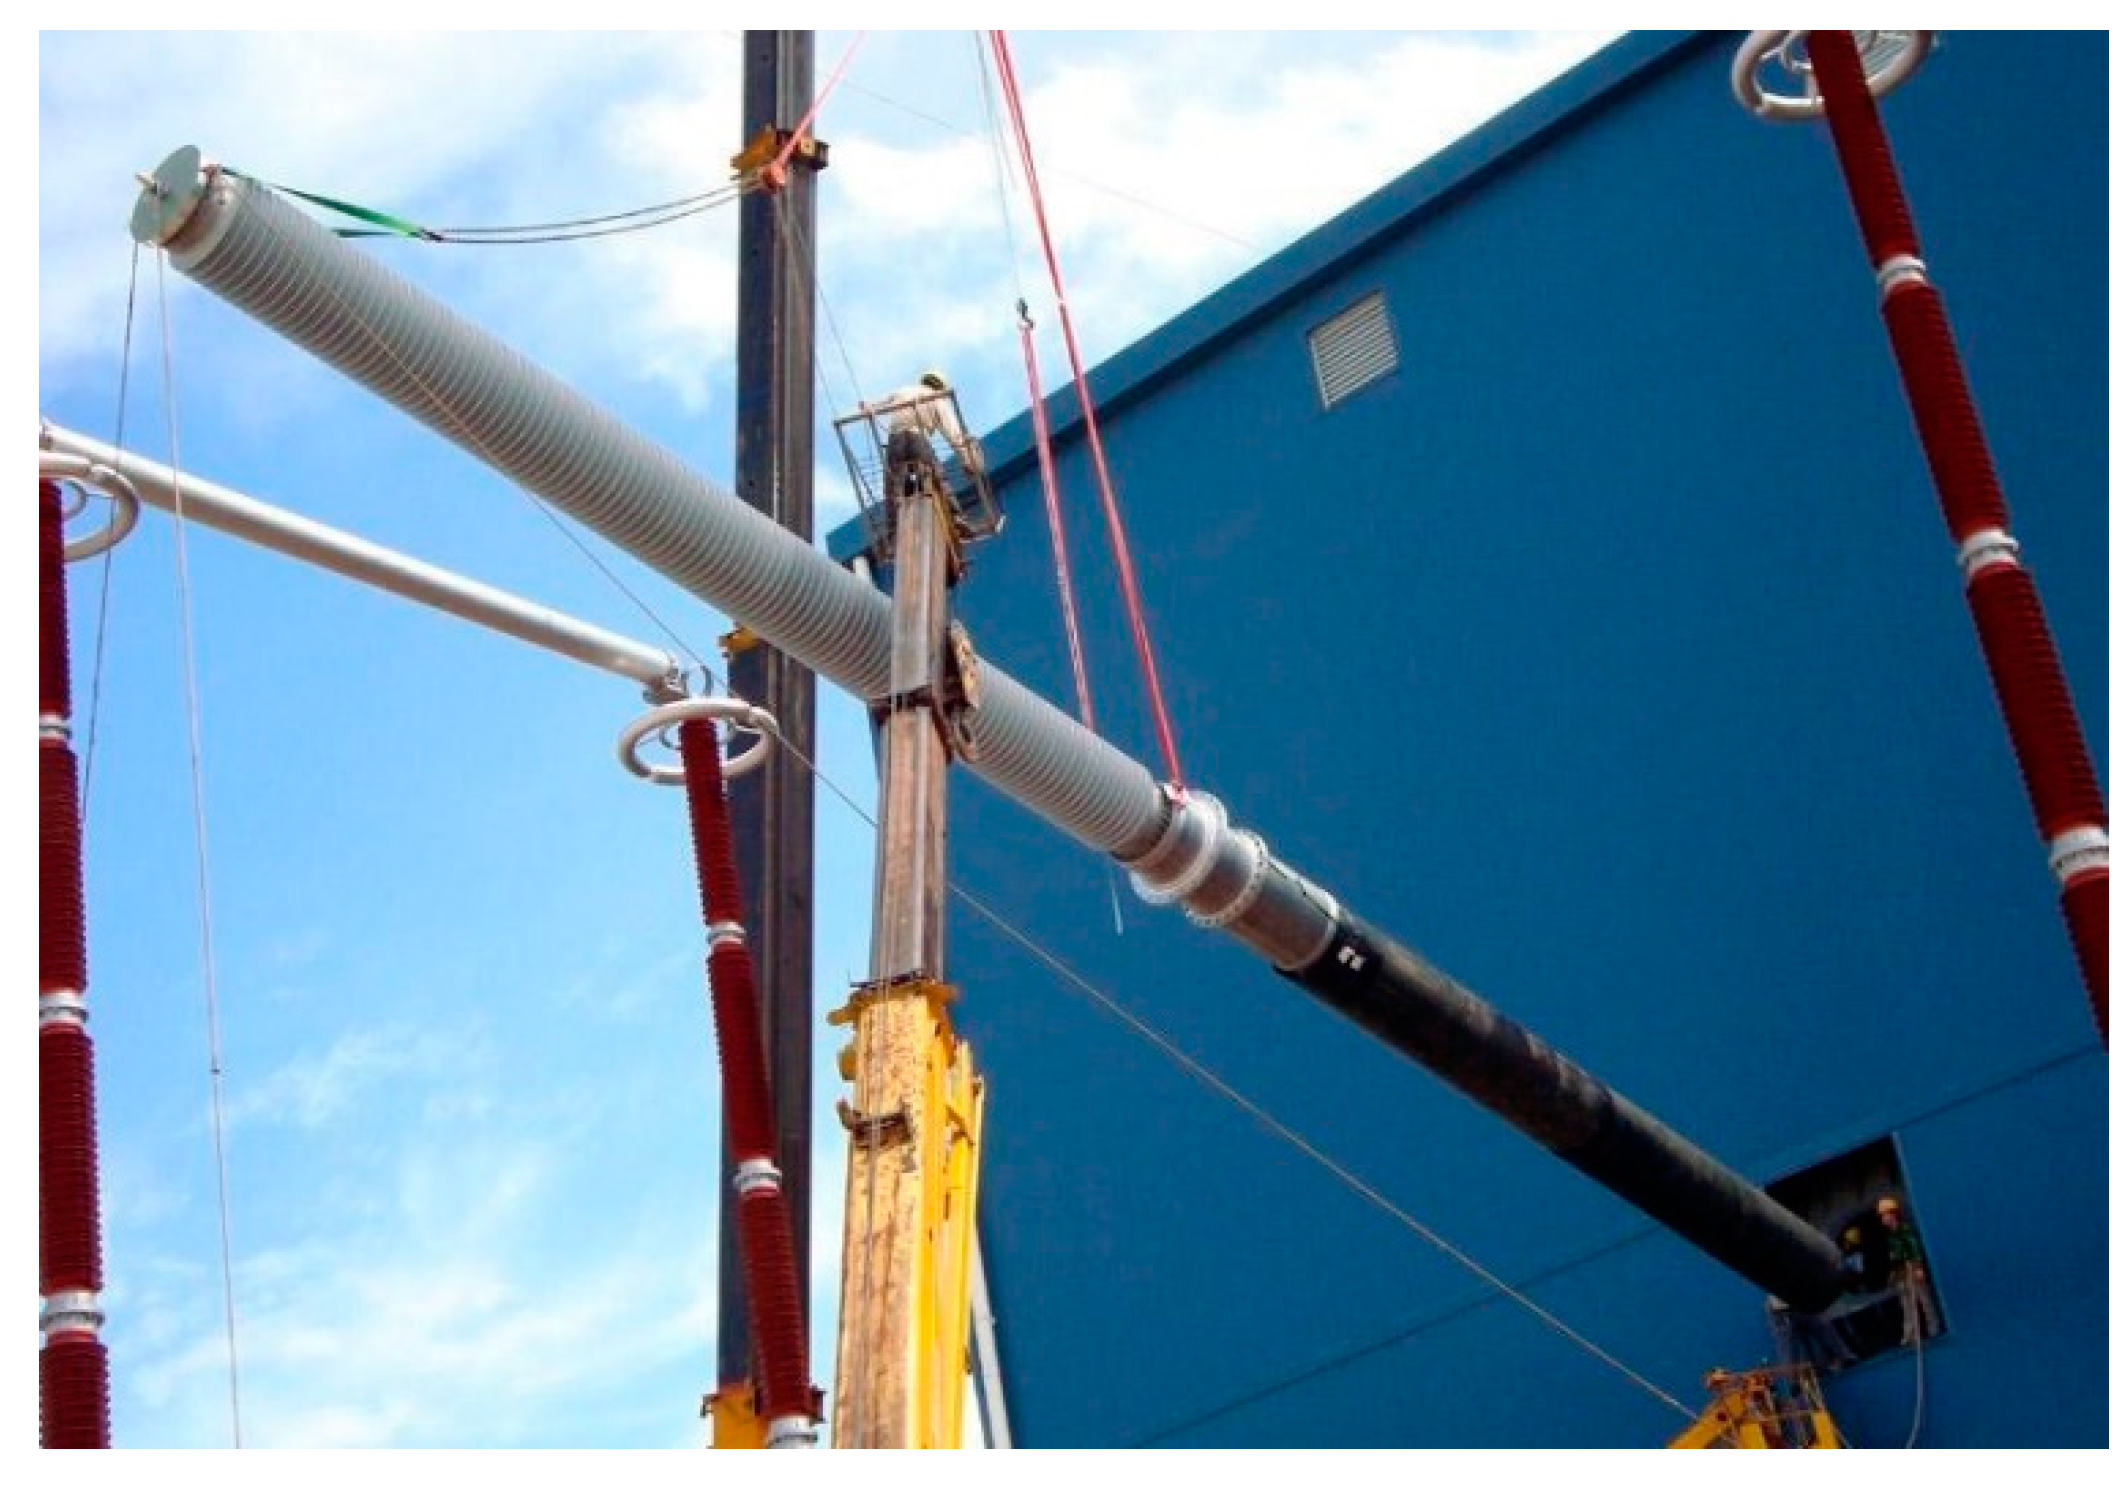
Figure 1. Image of the setup of a ±800 kV DC wall bushing.
Energies 14 00370 g001
Figure 2. Surface potential measurement setup: (a) schematic diagram; (b) photo of the system.
Energies 14 00370 g002
Figure 3. (a) Needle-plate electrode designed for a normal electric field (the length of the needle was 15 mm, the curvature radius of the tip was about 10 μm and the gap distance was kept at 50 mm); (b) cylinder-annulus electrode designed for a tangential electric field (the inner electrode placed at the center was cylindrical with a diameter of 10 mm and height of 10 mm, the outer electrode was annulus with a height of 5 mm, external diameter of 110 mm and inner diameter of 100 mm, which was the same as the size of the sample).
Energies 14 00370 g003
Figure 4. Electric field distribution when −5 kV was applied for (a) normal-dominated field; (b) tangential-dominated field.
Energies 14 00370 g004
Figure 5. Electric field strength variation under −5 kV along the radial direction by simulation.
Energies 14 00370 g005
Figure 6. (a) Sample bulk resistivity variation of three formulas over temperature; (b) sample surface resistivity variation of three formulas over temperature.
Energies 14 00370 g006
Figure 7. Corona current measures under the applied voltages of (a) −1.0 kV, (b) −2.8 kV and (c) −4.8 kV.
Energies 14 00370 g007
Figure 8. Surface potential distribution of Formula 1 under different voltages after being exposed to a normal-dominated DC electric field for 10 min at 30 °C (surface potential under negative voltage was transformed into an absolute value for the convenience of comparison).
Energies 14 00370 g008
Figure 9. Surface potential distribution after exposed to a tangential-dominated DC electric field for 10 min at 30 °C of (a) Formula 1 under different voltages (surface potential under negative voltage was taken the opposite for the convenience of comparison); (b) Formulas 1–3 under different voltages.
Energies 14 00370 g009
Figure 10. Measured and fitted surface potential values at the center of three formulas after being exposed to a tangential-dominated DC electric field for 10 min at different temperatures (the voltage applied was −5 kV, which means the potential had been saturated).
Energies 14 00370 g010
Figure 11. Center surface potential (potential values have been transformed into absolute values) variation applied −5 kV in a normal-dominated way until saturation during the dissipation process at different temperatures for (a) Formula 1; (b) Formula 2; (c) Formula 3.
Energies 14 00370 g011
Figure 12. The ratio variation of potential after 24 h dissipation to the initial potential over surface resistivity.
Energies 14 00370 g012
Table 1. Basic properties of samples with different formulas.
SampleDensity (g/cm3)Tensile Strength (MPa)Bending Strength (MPa)Relative PermittivityDielectric Loss (%)Breakdown Strength (kV/mm)Temperature of Glass Transition (°C)
Formula 12.28801375.20.2533144
Formula 22.19761345.00.2432141
Formula 32.25701325.00.2530118
Table 2. K values under different temperatures.
Temperature (°C)Formula 1Formula 2Formula 3
3092.5691.7595.10
5096.9196.9696.41
7094.5096.2198.07
9097.3393.8496.99
11097.1493.2497.20
Publisher’s Note: MDPI stays neutral with regard to jurisdictional claims in published maps and institutional affiliations.