Abstract
An efficient approach to the geometry optimization problem of a non-axisymmetric flow channel is discussed. The method combines geometrical transformation with a computational fluid dynamics solver, a multi-objective genetic algorithm, and a response surface. This approach, through geometrical modifications and simplifications allows transforming a non-axisymmetric problem into the axisymmetric one in some specific devices i.e., a scroll distributor or a volute. It results in a significant decrease in the problem size, as only the flow in a quasi-2D section of the channel is solved. A significantly broader design space is covered in a much shorter time than in the standard method, and the optimization of large flow problems is feasible with desktop-class computers. One computational point is obtained approximately eight times faster than in full geometry computations. The method was applied to a scroll distributor. For the case under analysis, it was possible to increase flow uniformity, eradicate separation zones, and increase the overall efficiency, which was followed by energy savings of 16% for the scroll. The results indicate that this method can be successfully applied for the optimization of similar problems.
1. Introduction
The design and shape optimization of flow ducts is an important challenge that is frequently faced in the domain of turbomachinery and high-speed flows, where slight shape imperfections can lead to substantial efficiency losses [1]. Each improvement of efficiency in the flow system has a direct influence on energy savings. Modern flow channel optimization techniques are based on computational fluid dynamics (CFD) simulations, which can yield efficiently reliable flow predictions. Computational methods are often more efficient than the experimental approach, as the change of geometry in numerical simulation is quick and easy, unlike for the experimental studies. Numerical studies showed very good results in case of initial aerodynamic design of volutes [2], sensitivity studies [3], and acoustic optimization [4]. The analysis is not limited to aerodynamics, as volutes and impellers for centrifugal pumps are also optimized numerically [5]. Numerical methods can be used in frameworks for the quick design of turbomachinery as a standalone or in conjunction with an experiment [6]. Fast track experimentation in the case of turbomachinery is often difficult due to the operating temperatures and mechanical stresses excluding the possibility of applying common rapid prototyping techniques. Therefore, the development of quick optimization solutions is of even higher importance. For shape optimization, numerical simulations are often coupled with optimization algorithms or methods such as a genetic algorithm (GA) [7,8], meta-model-assisted GA [9], the Taguchi method [10], or the Response Surface Method (RSM) [5,11]. For the RSM, CFD computations provide a population of design points, which are used to build a response surface (RS). The response surface allows the sensitivity of the investigated parameters to geometrical changes to be captured in a specific range without a need to compute the value of the parameter in every point [12]. The RS can serve as an input to an optimization algorithm, for example, a genetic algorithm, which seeks the global optimum for multiple variables. This approach is well established and proven to provide good results [13,14]. Nevertheless, each CFD-based design point computation requires substantial resources and time. It is especially restricting for complex problems or broad design space exploration when numerous CFD predictions are required.
Thus, the research is focused on increasing the efficiency of optimization processes to obtain results of comparable accuracy, but faster. The problem of how to decrease the optimization time is approached differently. One of the solutions is to generate a surrogate model for the computed problem, for example by applying a neural network (NN) [15,16]. Verstraete [17] has shown that it is possible to limit the number of computations by applying an NN-based surrogate model to such a complicated element as a centrifugal compressor impeller. However, to obtain reliable results within this approach, the NN has to be appropriately trained, which still requires costly CFD computations.
The surrogate model can also be based on the modeling of geometrical effects without the actual presence of the geometry in the domain. An example of such cases are met in the field of propellers [18], wind turbines [19], and compressors [20]. The solid geometry is replaced with source terms that are dependent on the geometry and flow parameters, which are to reproduce exactly the same effect as the mimicked geometry. This method tries to alleviate demanding computational requirements by removing the need for a highly refined mesh, which often arises in the proximity of walls due to the necessity to refine the boundary layer. However, the described methods introduce uncertainties resulting from approximations assumed in modeling. Hence, they are a good choice for finding general trends and building understanding of the case sensitivity quickly, but they are not able to replace standard, high-fidelity CFD methods when high-precision optimization is needed.
Precise numerical simulations of complex flows require refined, high-quality meshes for a high-grade solution of the flow structure. It is especially important in the case of optimization to capture and quantify reliably slight changes between the cases under investigation, which involves substantial computational resources and increases the solution time. A way to shorten the optimization time is to take advantage of the domain geometry, looking for periodicity or symmetry and simulating a fraction of the whole machine or the element of interest. It has become a standard industrial practice to simulate one pitch of an impeller or vanned diffuser [21,22]. However, such a procedure has not been applied to other elements of flow systems, which are not fully axisymmetric.
This article presents an approach in which it is possible to decrease the computation time for the solution by simplifying a non-axisymmetric problem to the axisymmetric one and solving it as the two-dimensional (2D) one. The case is transformed in such a way that an axisymmetric part is extracted from the domain, and this change is compensated for with appropriate boundary conditions. With a significant reduction in the solution time possible within this method, a much broader and more precise analysis of the design space is performed with given computational resources. Such a transformation can be applied in case of a scroll distributor or a volute, where both have a non-axisymmetric shape, but one can find a part of them where the axisymmetric part of the channel can be distinguished. The applicability of this method is evidenced through the geometric optimization of a scroll distributor.
2. Materials and Methods
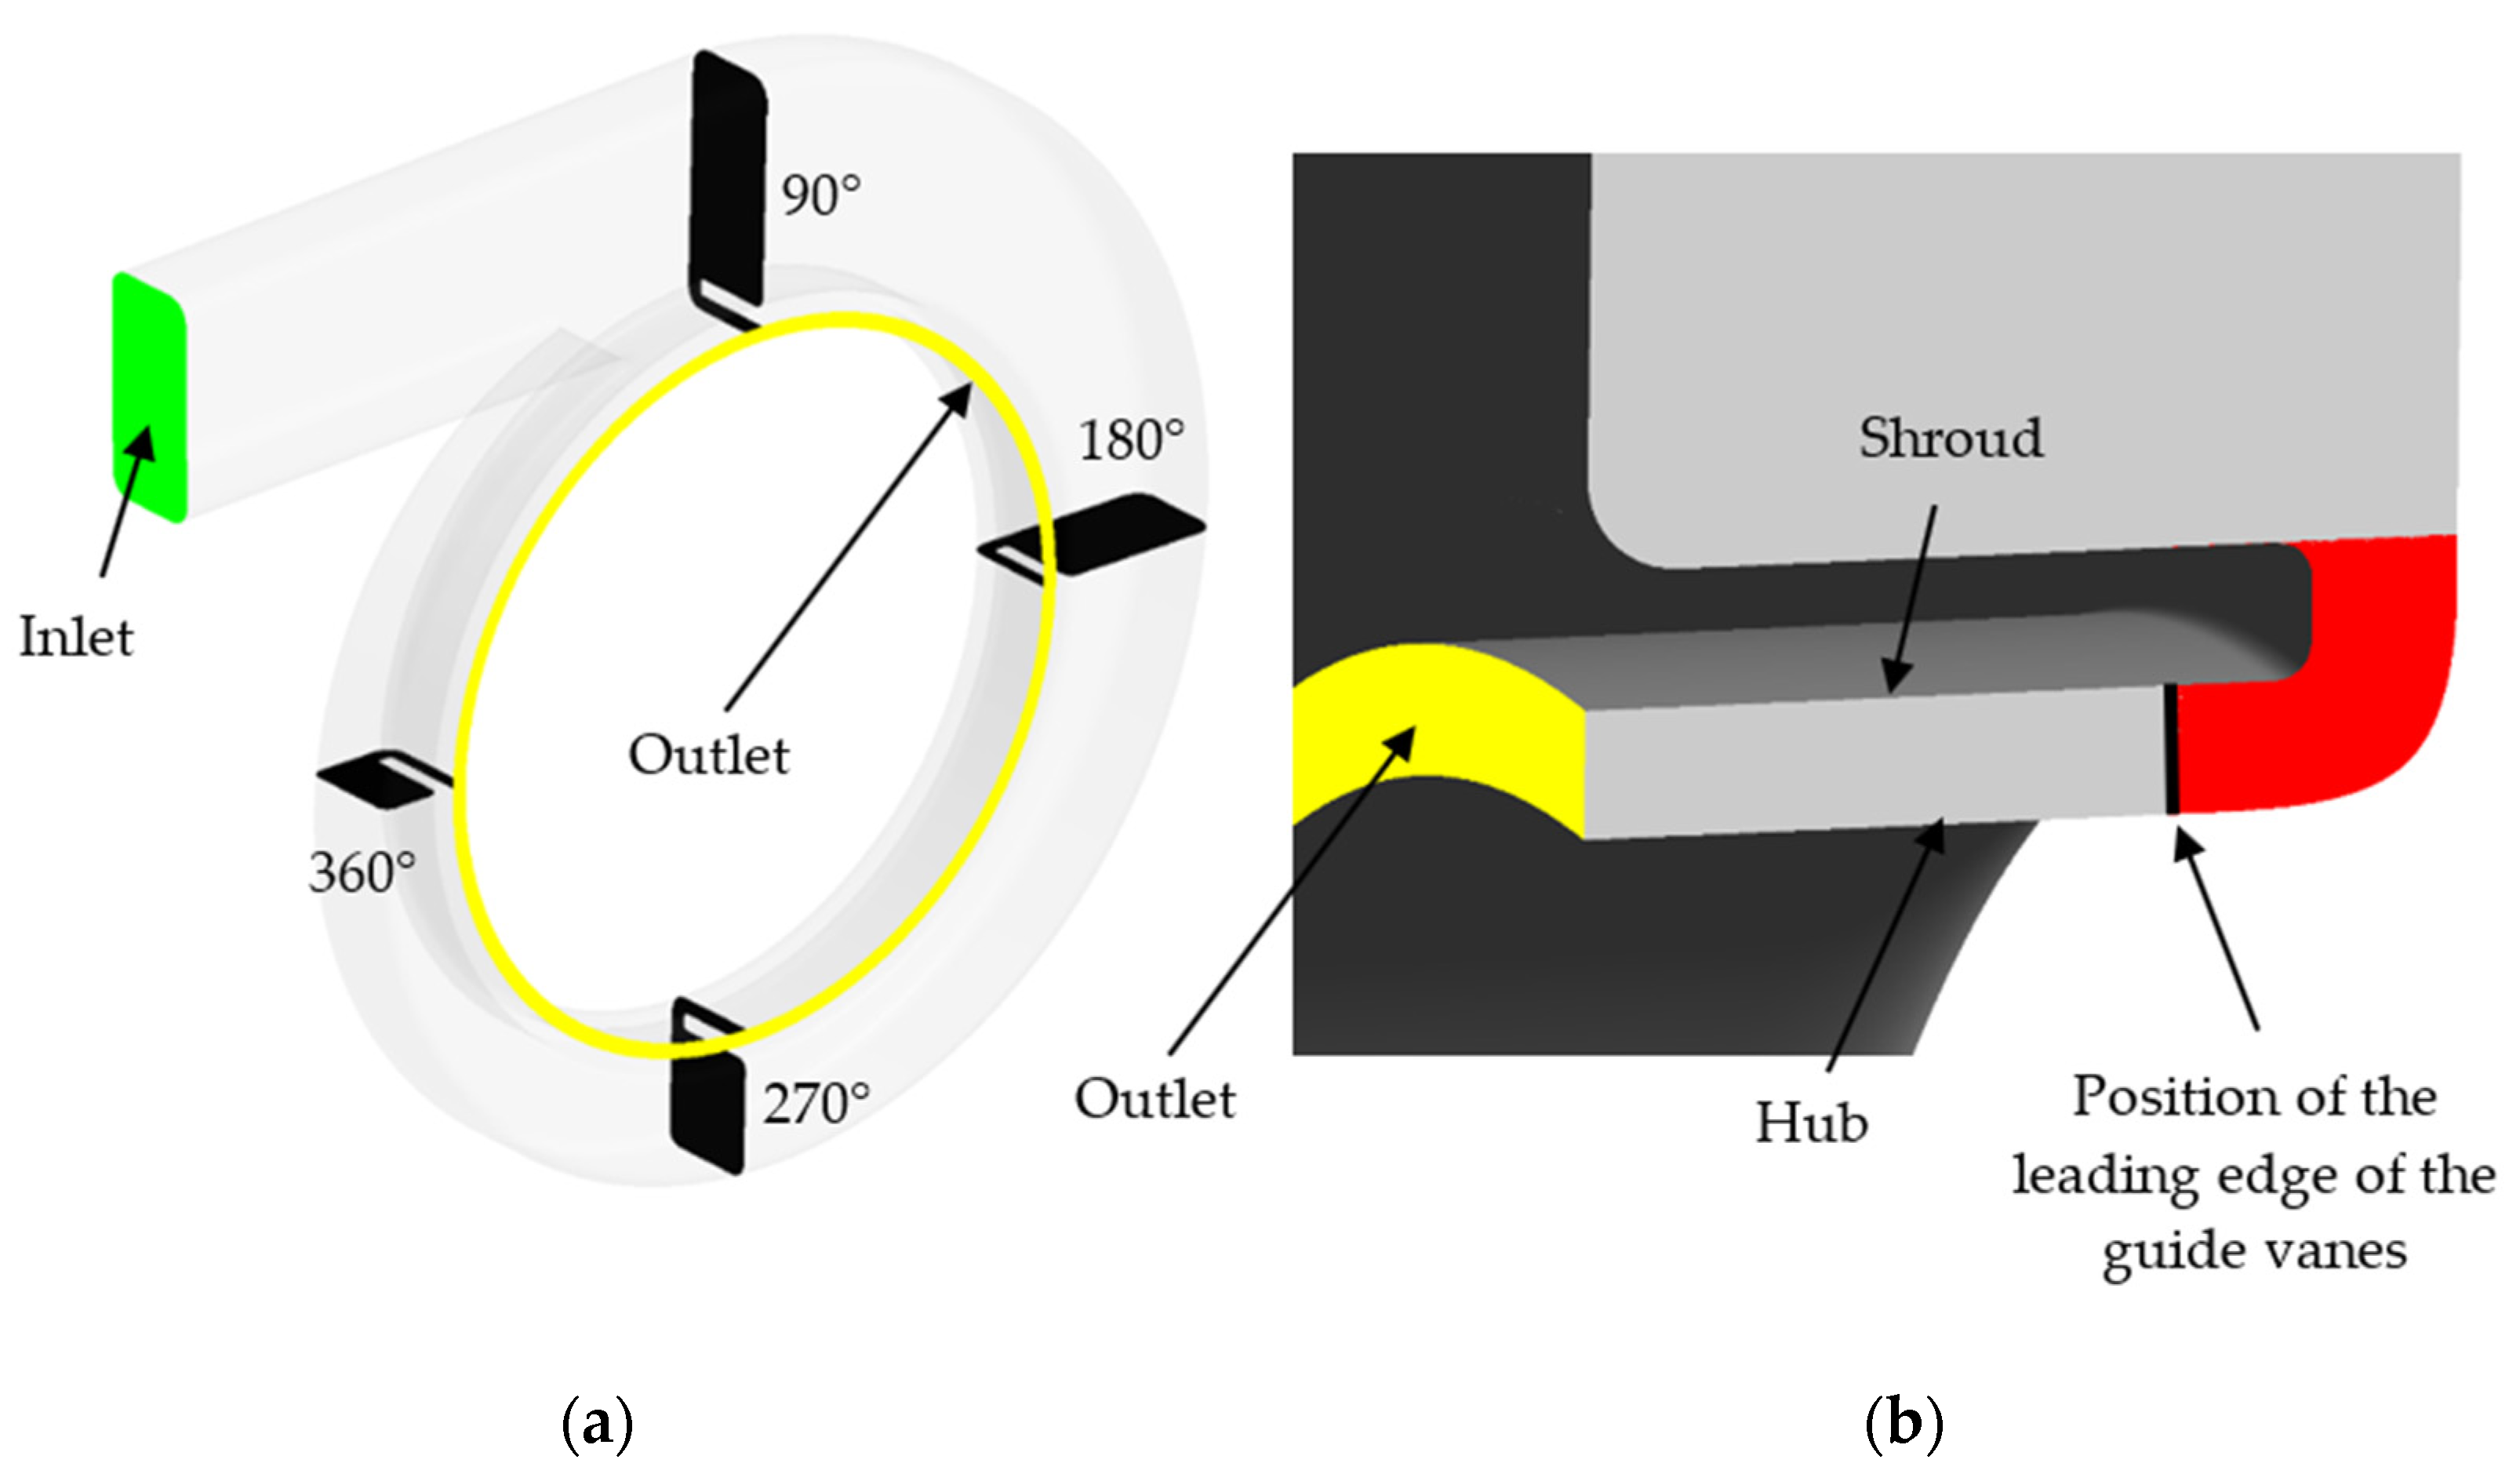
The method presented in this article was applied to an optimization problem for the outlet section of the scroll distributor. The function of this scroll is to distribute uniformly the fluid delivered through the pipe and then change the circumferential fluid motion into the axial one in the annular channel. The change in the fluid flow direction can be achieved through a 90° bend equipped with guide vanes to straighten the flow. The scroll geometry and channel cross-section are presented in Figure 1.
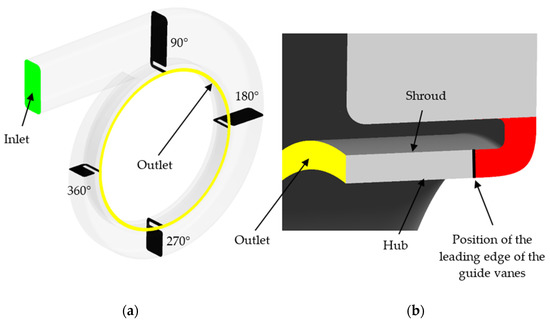
Figure 1.
Scroll distributor geometry: (a) general view with control sections; (b) cross-section of the channel for the 90° section.
The design requirement was to use two-dimensional (2D) guide vanes instead of three-dimensionally (3D) shaped radial–axial guide vanes due to the cost. The 2D guide vanes would be located in the axial channel section downstream of the bend between the hub and shroud surfaces (leading-edge position indicated in Figure 1b). As a result of the design compactness reasons, it was necessary to locate the inlet to the 90° bend (red region) as far upstream as possible to keep the guide vanes within the width of the distributor. Due to a significant change in the flow direction, development of the efficient bend design can be challenging and time-consuming. An inappropriate design of this bend may result in flow separation, which throttles the flow, negatively influences the whole installation performance, and generates energy losses.
An optimization goal was to maximize the flow uniformity downstream of the bend at the position of the guide vane leading edge to ensure that 2D guide vanes will operate properly over the whole span. The optimization goal holds for both the velocity magnitude and its angle along the span of the gap. An additional aim was to minimize any increase in static entropy related to flow losses in the scroll [8] and eliminate flow separations.
The scroll geometry was based on literature guidelines [23]. The geometry was developed with use of the assumption to keep a constant average velocity in the casing, as it is the most favorable for a uniform pressure distribution at the scroll distributor outlet. The averaged velocity is the velocity obtained by dividing the flowrate by the total area normal to the flow. In the case under consideration, the scroll cross-sections decrease linearly from the throat to the tongue. The initial shape of the bend was a crude design, resulting from the manufacturing technology, which proved to be sub-optimal in terms of performance. The numerical investigation of the initial geometry proposal was the first step in the optimization process. This was necessary to confirm design assumptions and locate the major source of losses in the distributor. It was also used as a source of boundary conditions for the next steps in the procedure.
2.1. Numerical Model
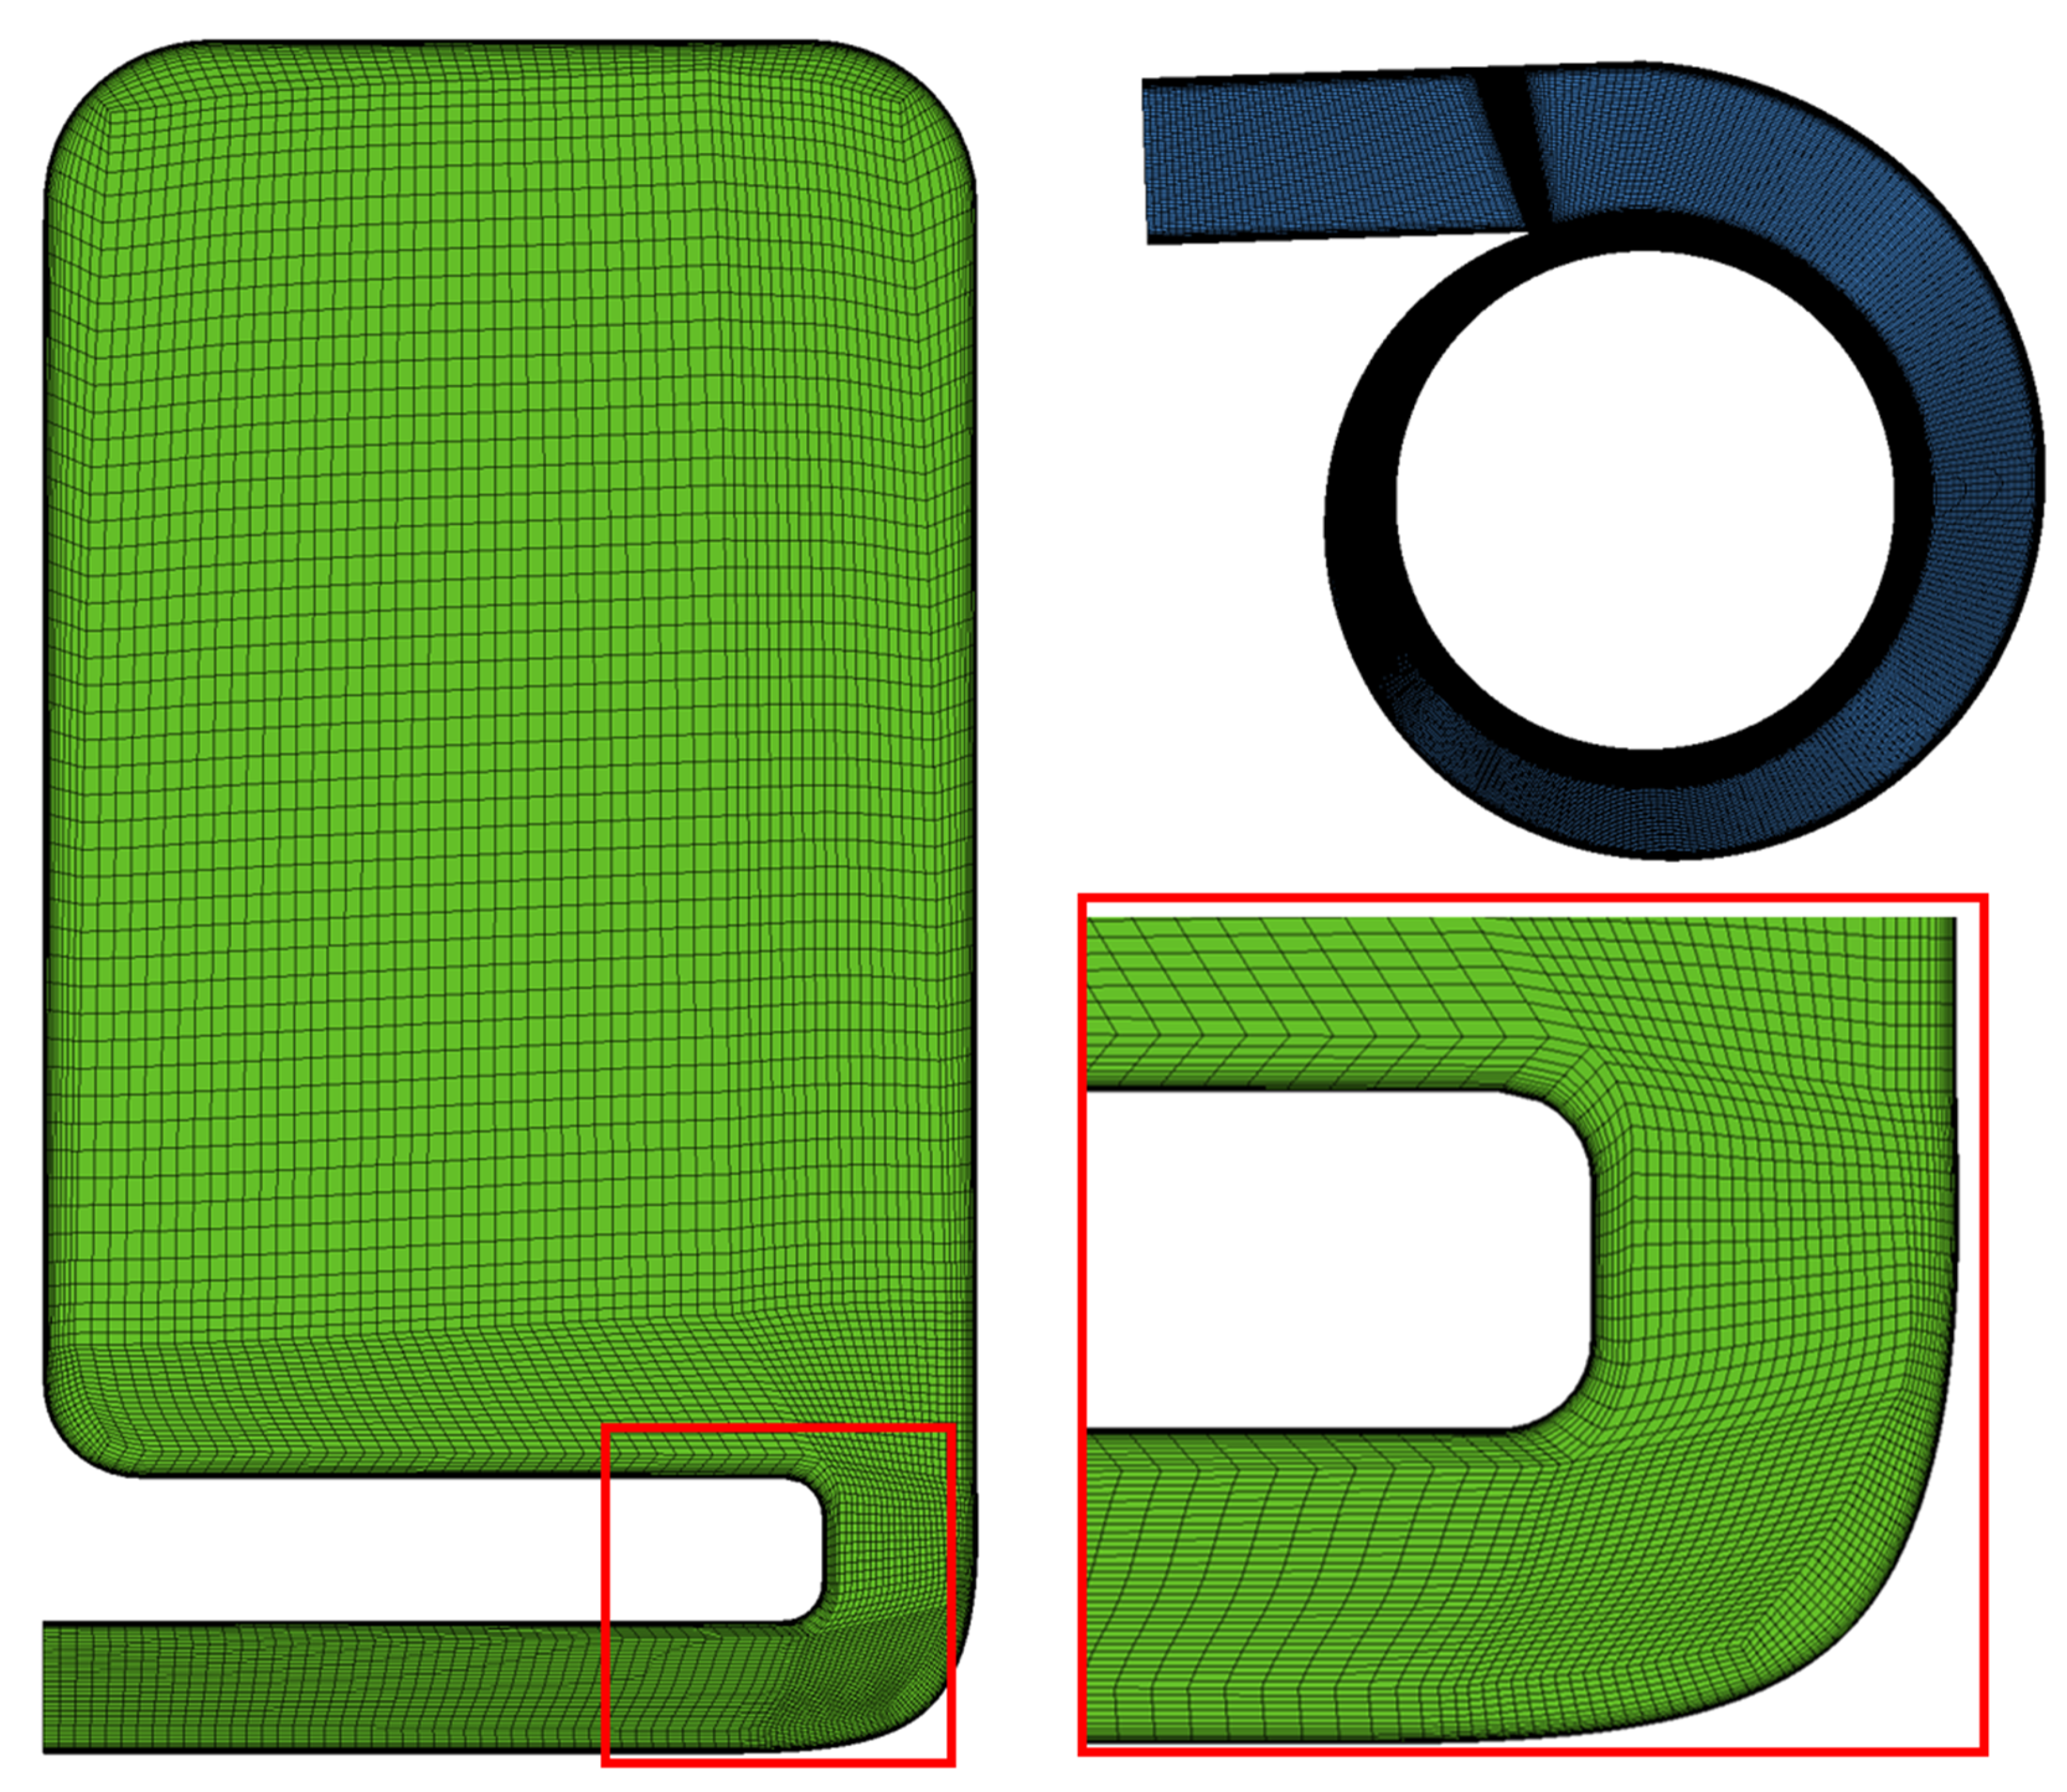
The initial investigations consisted of a steady-state 3D numerical simulation of the flow in the scroll with the commercial CFD software Ansys CFX. A mesh of the 3D scroll model was prepared with the Ansys ICEM CFD v 2019 R3 tool. A high-quality, fully structural mesh with nearly 4.8 million hexahedral elements and 4.9 million nodes was developed. The mesh in the whole model and a selected scan plane are illustrated in Figure 2. The general quality of the mesh was above 0.397 for the whole scroll. The lowest angle in the whole mesh was 23.4°, and only 3.2% of all elements had a minimal angle parameter lower than 45°. More than 82% of mesh elements had an aspect ratio parameter lower than 100, and 99.5% displayed a volume change parameter lower than 3. The element growth rate was set to 1 in all structural blocks adjacent to the wall. The listed mesh parameters fulfill Ansys CFX solver requirements [24].
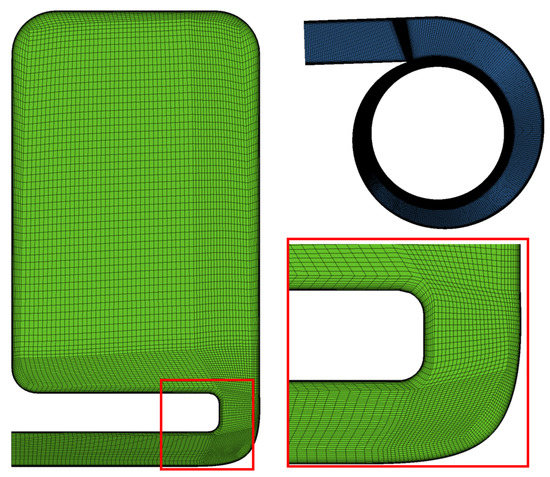
Figure 2.
Computational mesh for the 3D case.
A Reynolds Averaged Navier–Stokes solver was used with the Shear Stress Transport (SST) turbulence model, which is well suited for simulations with boundary layer separations that could take place for some designs during optimization [25]. The SST turbulence model proved to produce correct results in many various applications of external and internal flows [26,27,28]. A compressible air formulation of the solver was used in the flow simulation. The inlet boundary condition with an imposed mass flow rate (2 kg/s), a medium turbulence level (turbulence intensity equal to 5%, a turbulent to the molecular viscosity ratio equal to 10), and static temperature (500 K) were assumed. The outlet condition was introduced with an average static pressure of 7.5 bar. The setup parameters are listed in Table 1.

Table 1.
Numerical model settings for the 3D simulation.
The simulated model did not include guide vanes, as their upstream influence was proven to be negligible in the preliminary model studies. The walls of the distributor were considered smooth and adiabatic. Second-order discretization schemes were applied for mass, momentum, and energy conservation equations as well as for turbulence model equations. A high-quality solution, with low residuals and a full balance of conservative parameters, was obtained. The computations, excluding the time required for meshing and setup, lasted eight hours with the use of a desktop workstation with four processor cores.
2.2. Investigation of the Initial Distributor Configuration
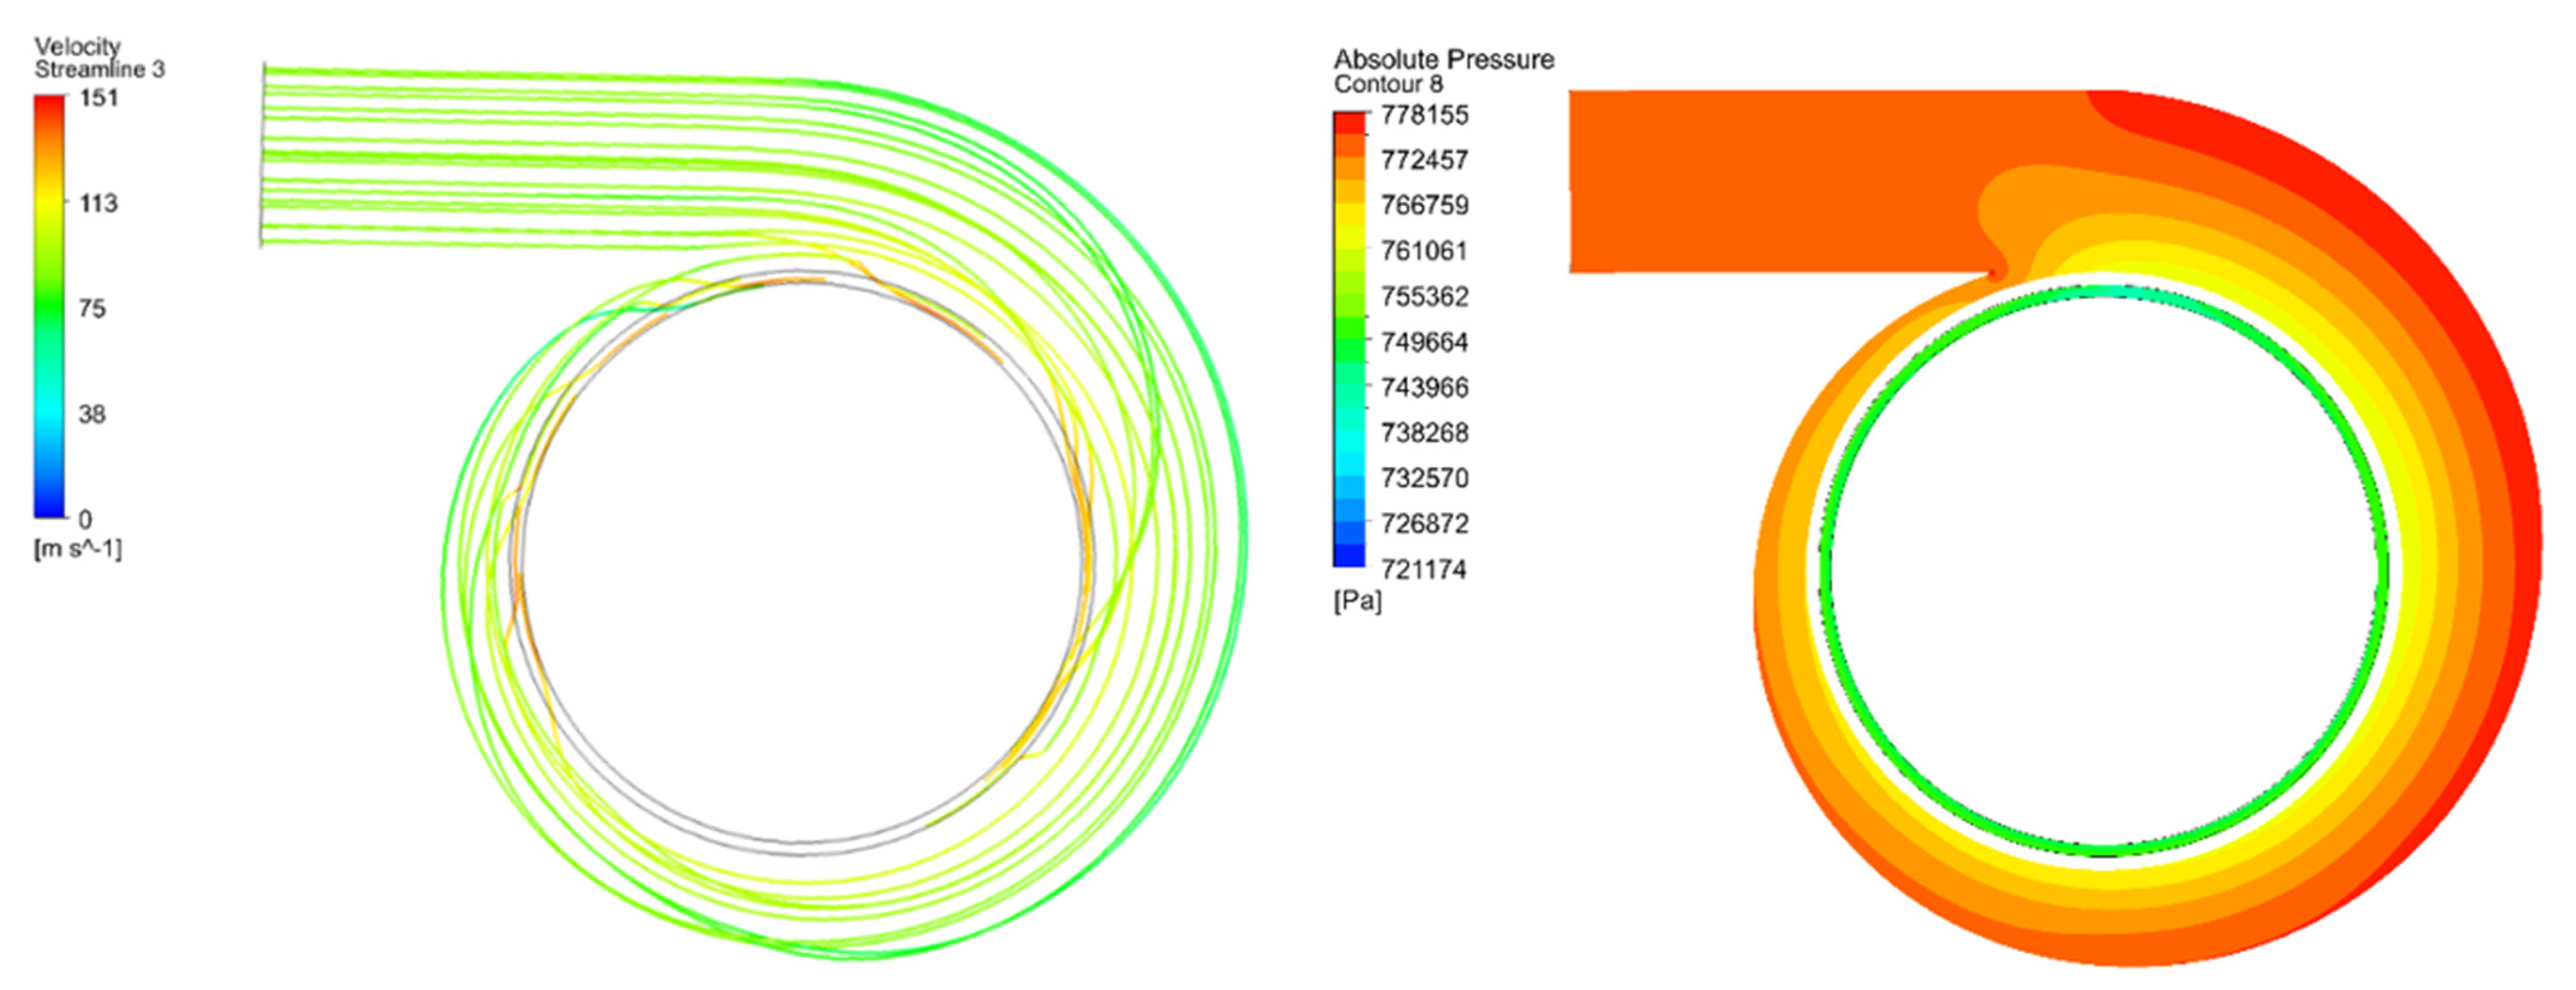
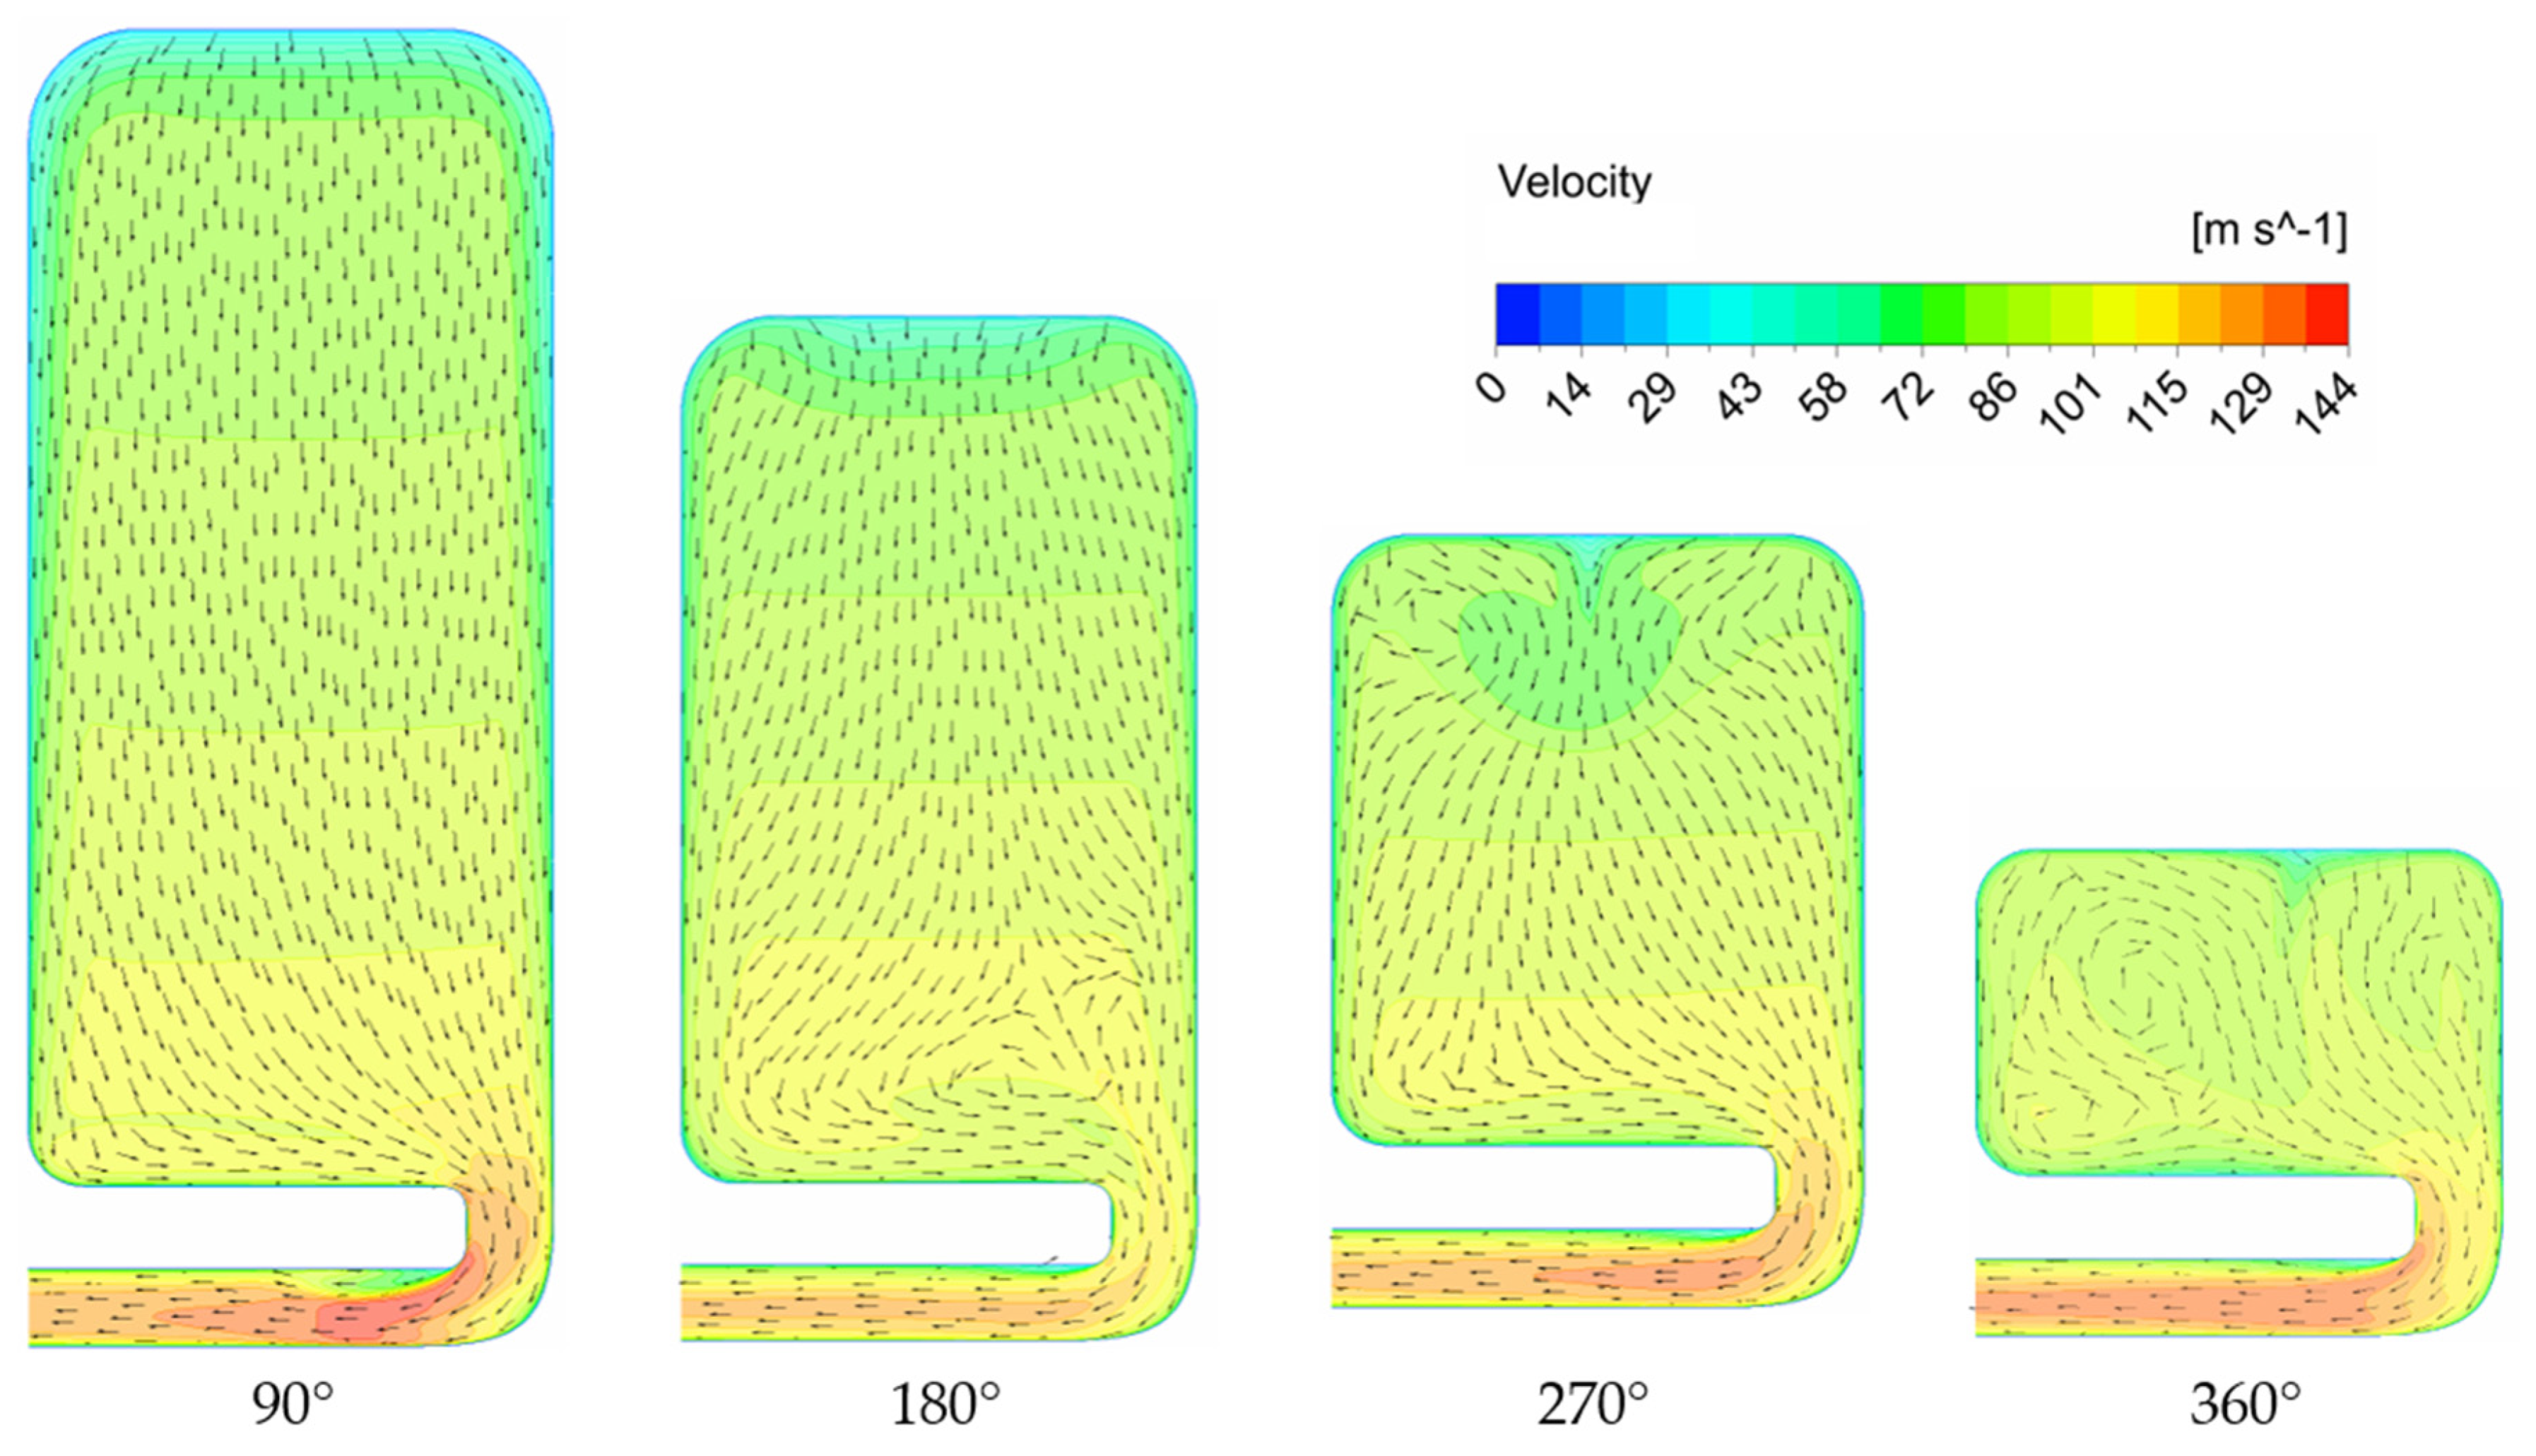
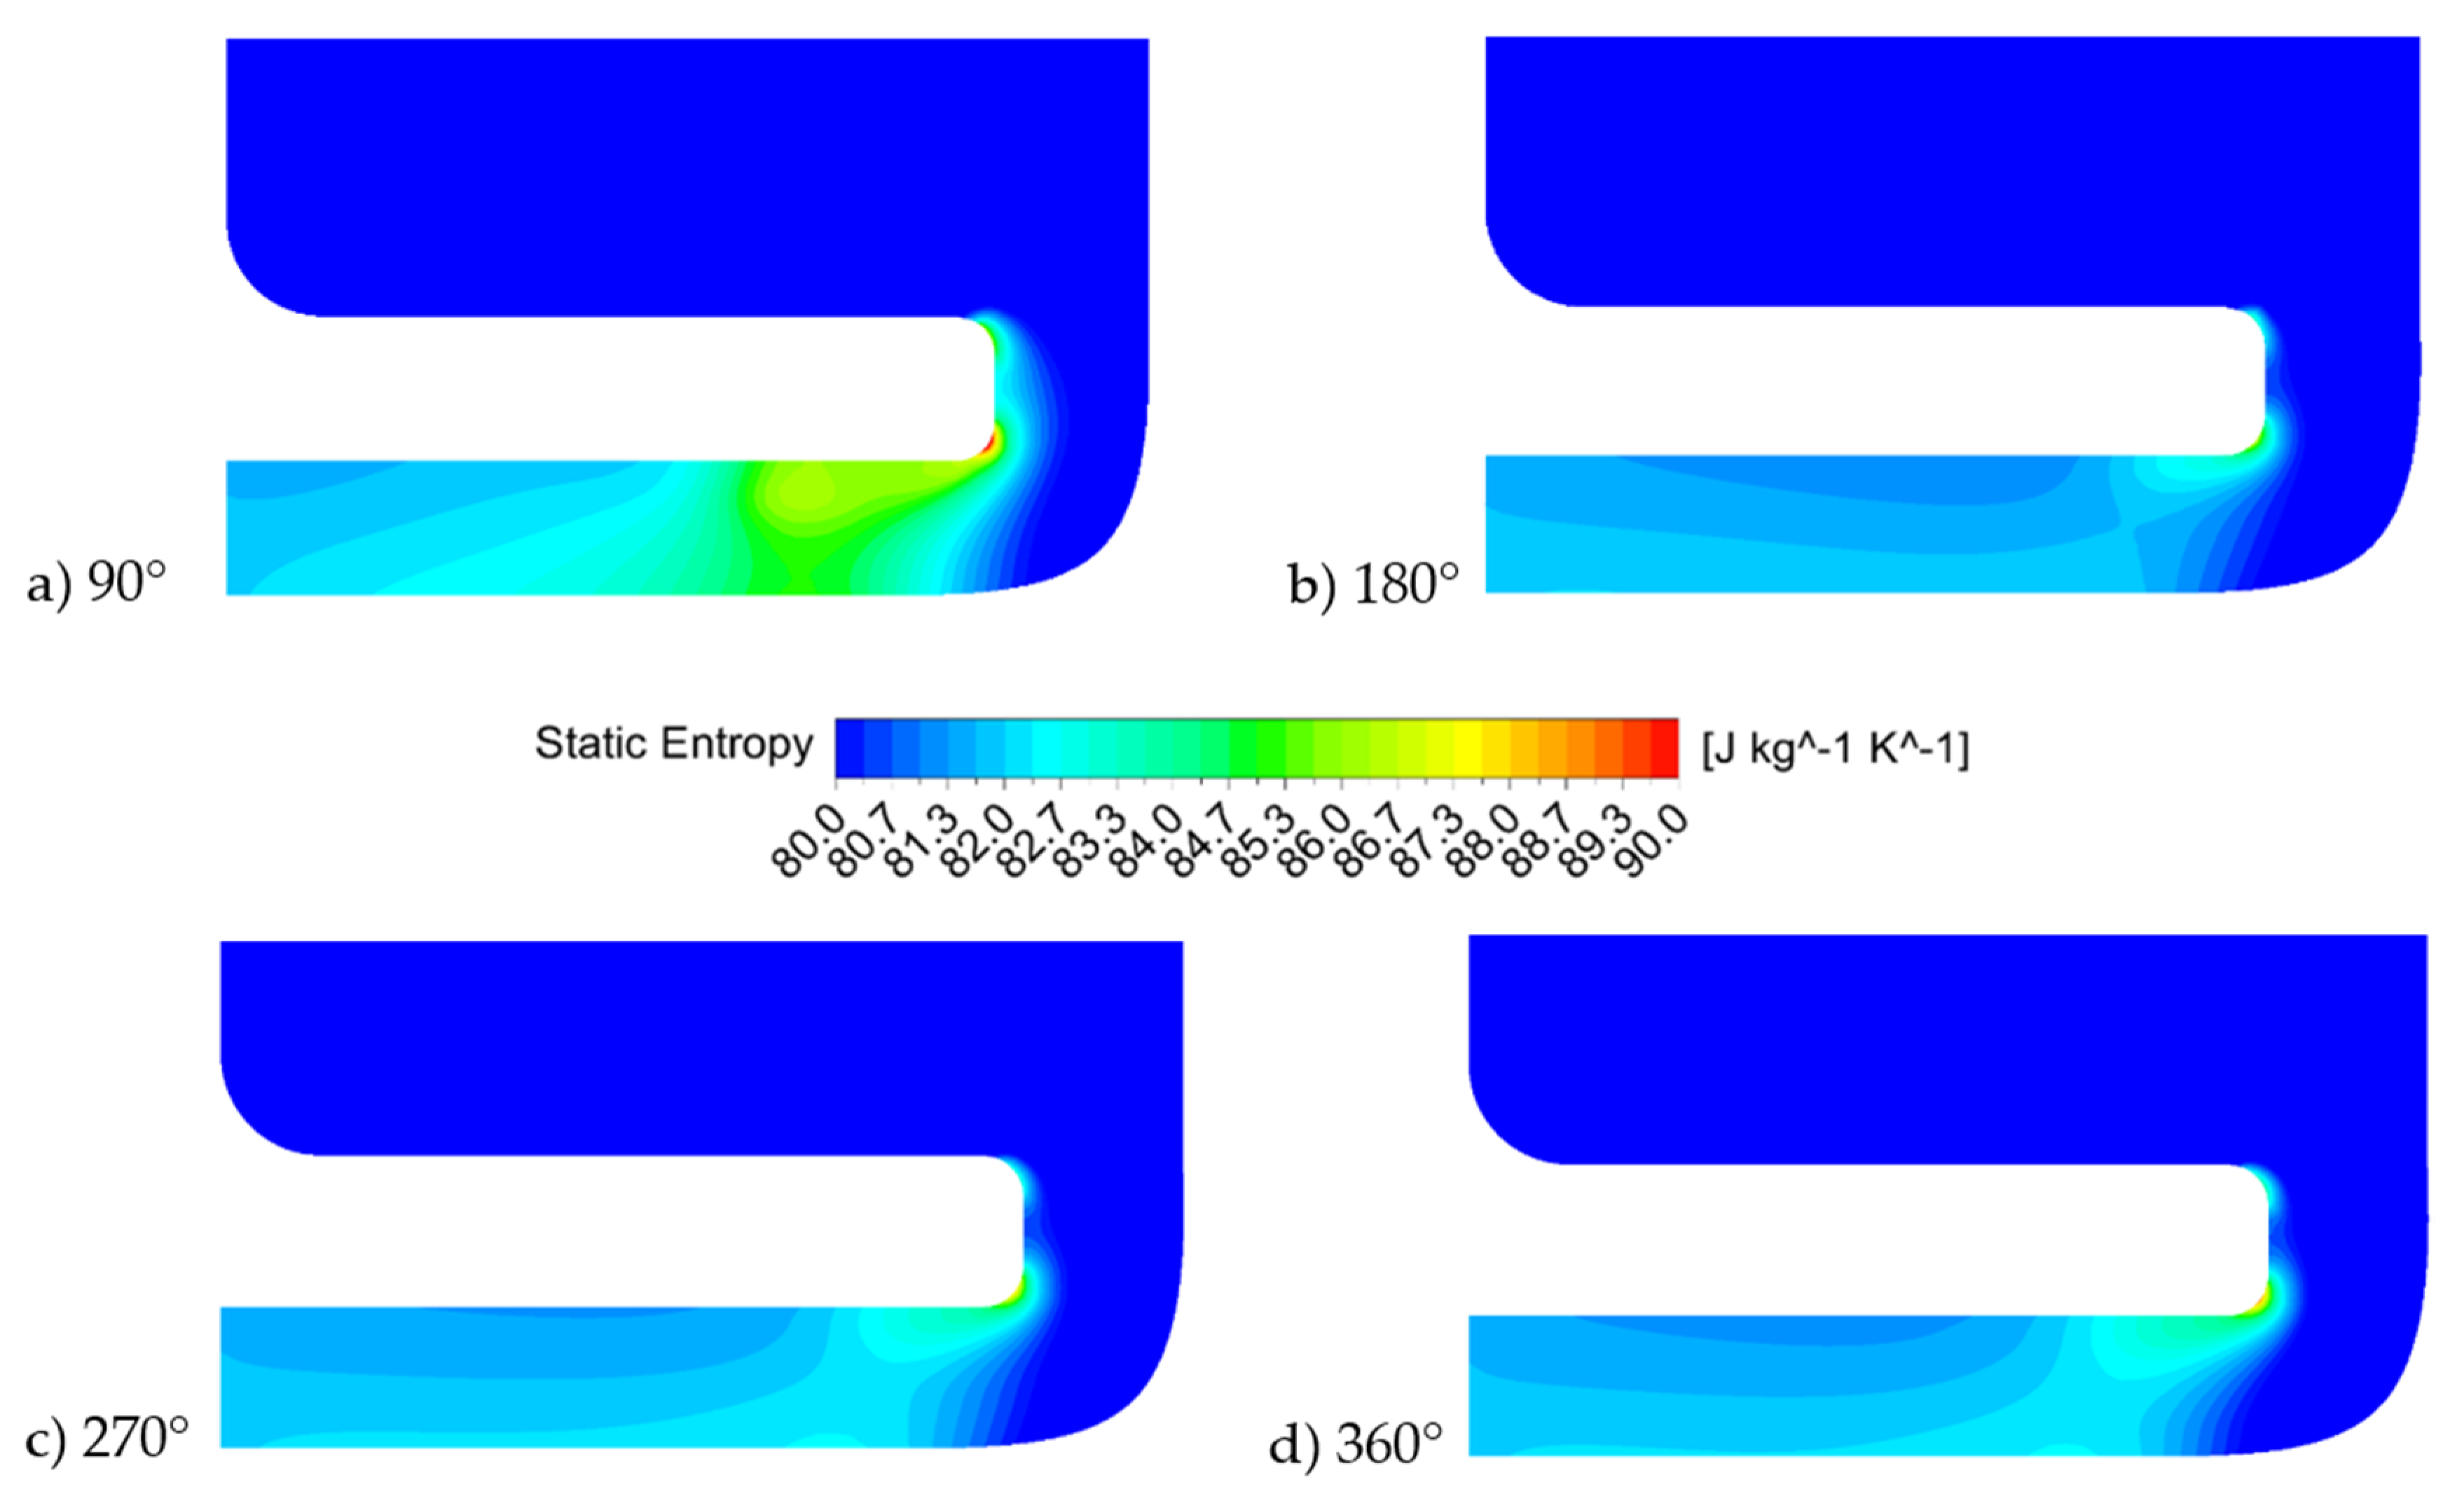
Simulation results for the initial distributor geometry are shown in Figure 3. Both velocity and pressure fields are circumferentially uniform, excluding an inconsiderable region near the tongue. The velocity and entropy distributions in selected cross-sections of the scroll (indicated in Figure 1) are shown in Figure 4 and Figure 5. The flow in the scroll was uniform, and no significant dissipation was revealed in the main part. However, important losses, which could be visualized by high entropy production, were observed in its outlet section due to the flow acceleration and high shear stress caused by a change in the flow direction and the bend geometry (Figure 5).
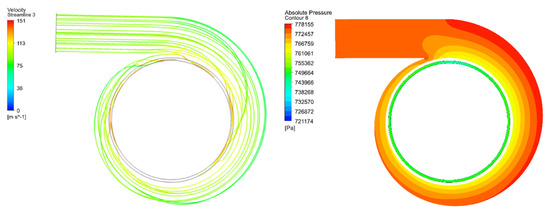
Figure 3.
Streamlines and pressure field in the scroll.
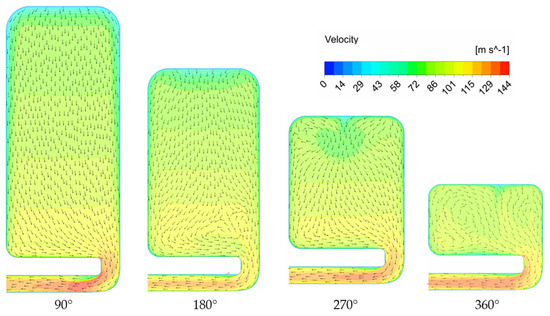
Figure 4.
Velocity contours and vectors in selected cross-sections of the scroll distributor.
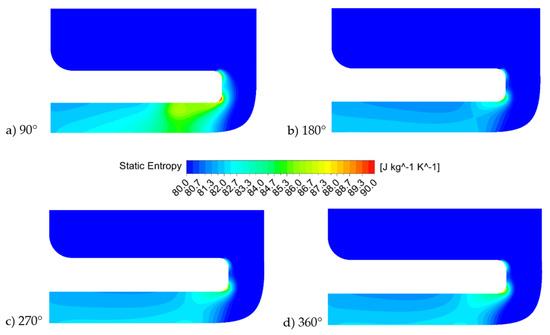
Figure 5.
Contours of static entropy for different cross-sections of the scroll distributor in specific locations: (a) 90°; (b) 180°; (c) 270° and (d) 360°.
The initial geometry of the inner bend wall resulted in a flow separation at the entrance to the axial channel due to a small radius of the inner wall. The flow at the outer wall of the bend is undisturbed, and no important loss was noticed there. Therefore, only the inner wall of the bend was subjected to optimization. Similarly, as for the whole scroll, the flow in the outlet axial channel was circumferentially uniform apart from the region close to the scroll tongue (see 90° plots in Figure 4 and Figure 5). The simulation of the initial distributor configuration allowed one to establish the baseline performance of the scroll, confirm the optimization region selection, and obtain boundary conditions for the downsized optimization problem.
2.3. Problem Downsizing Method
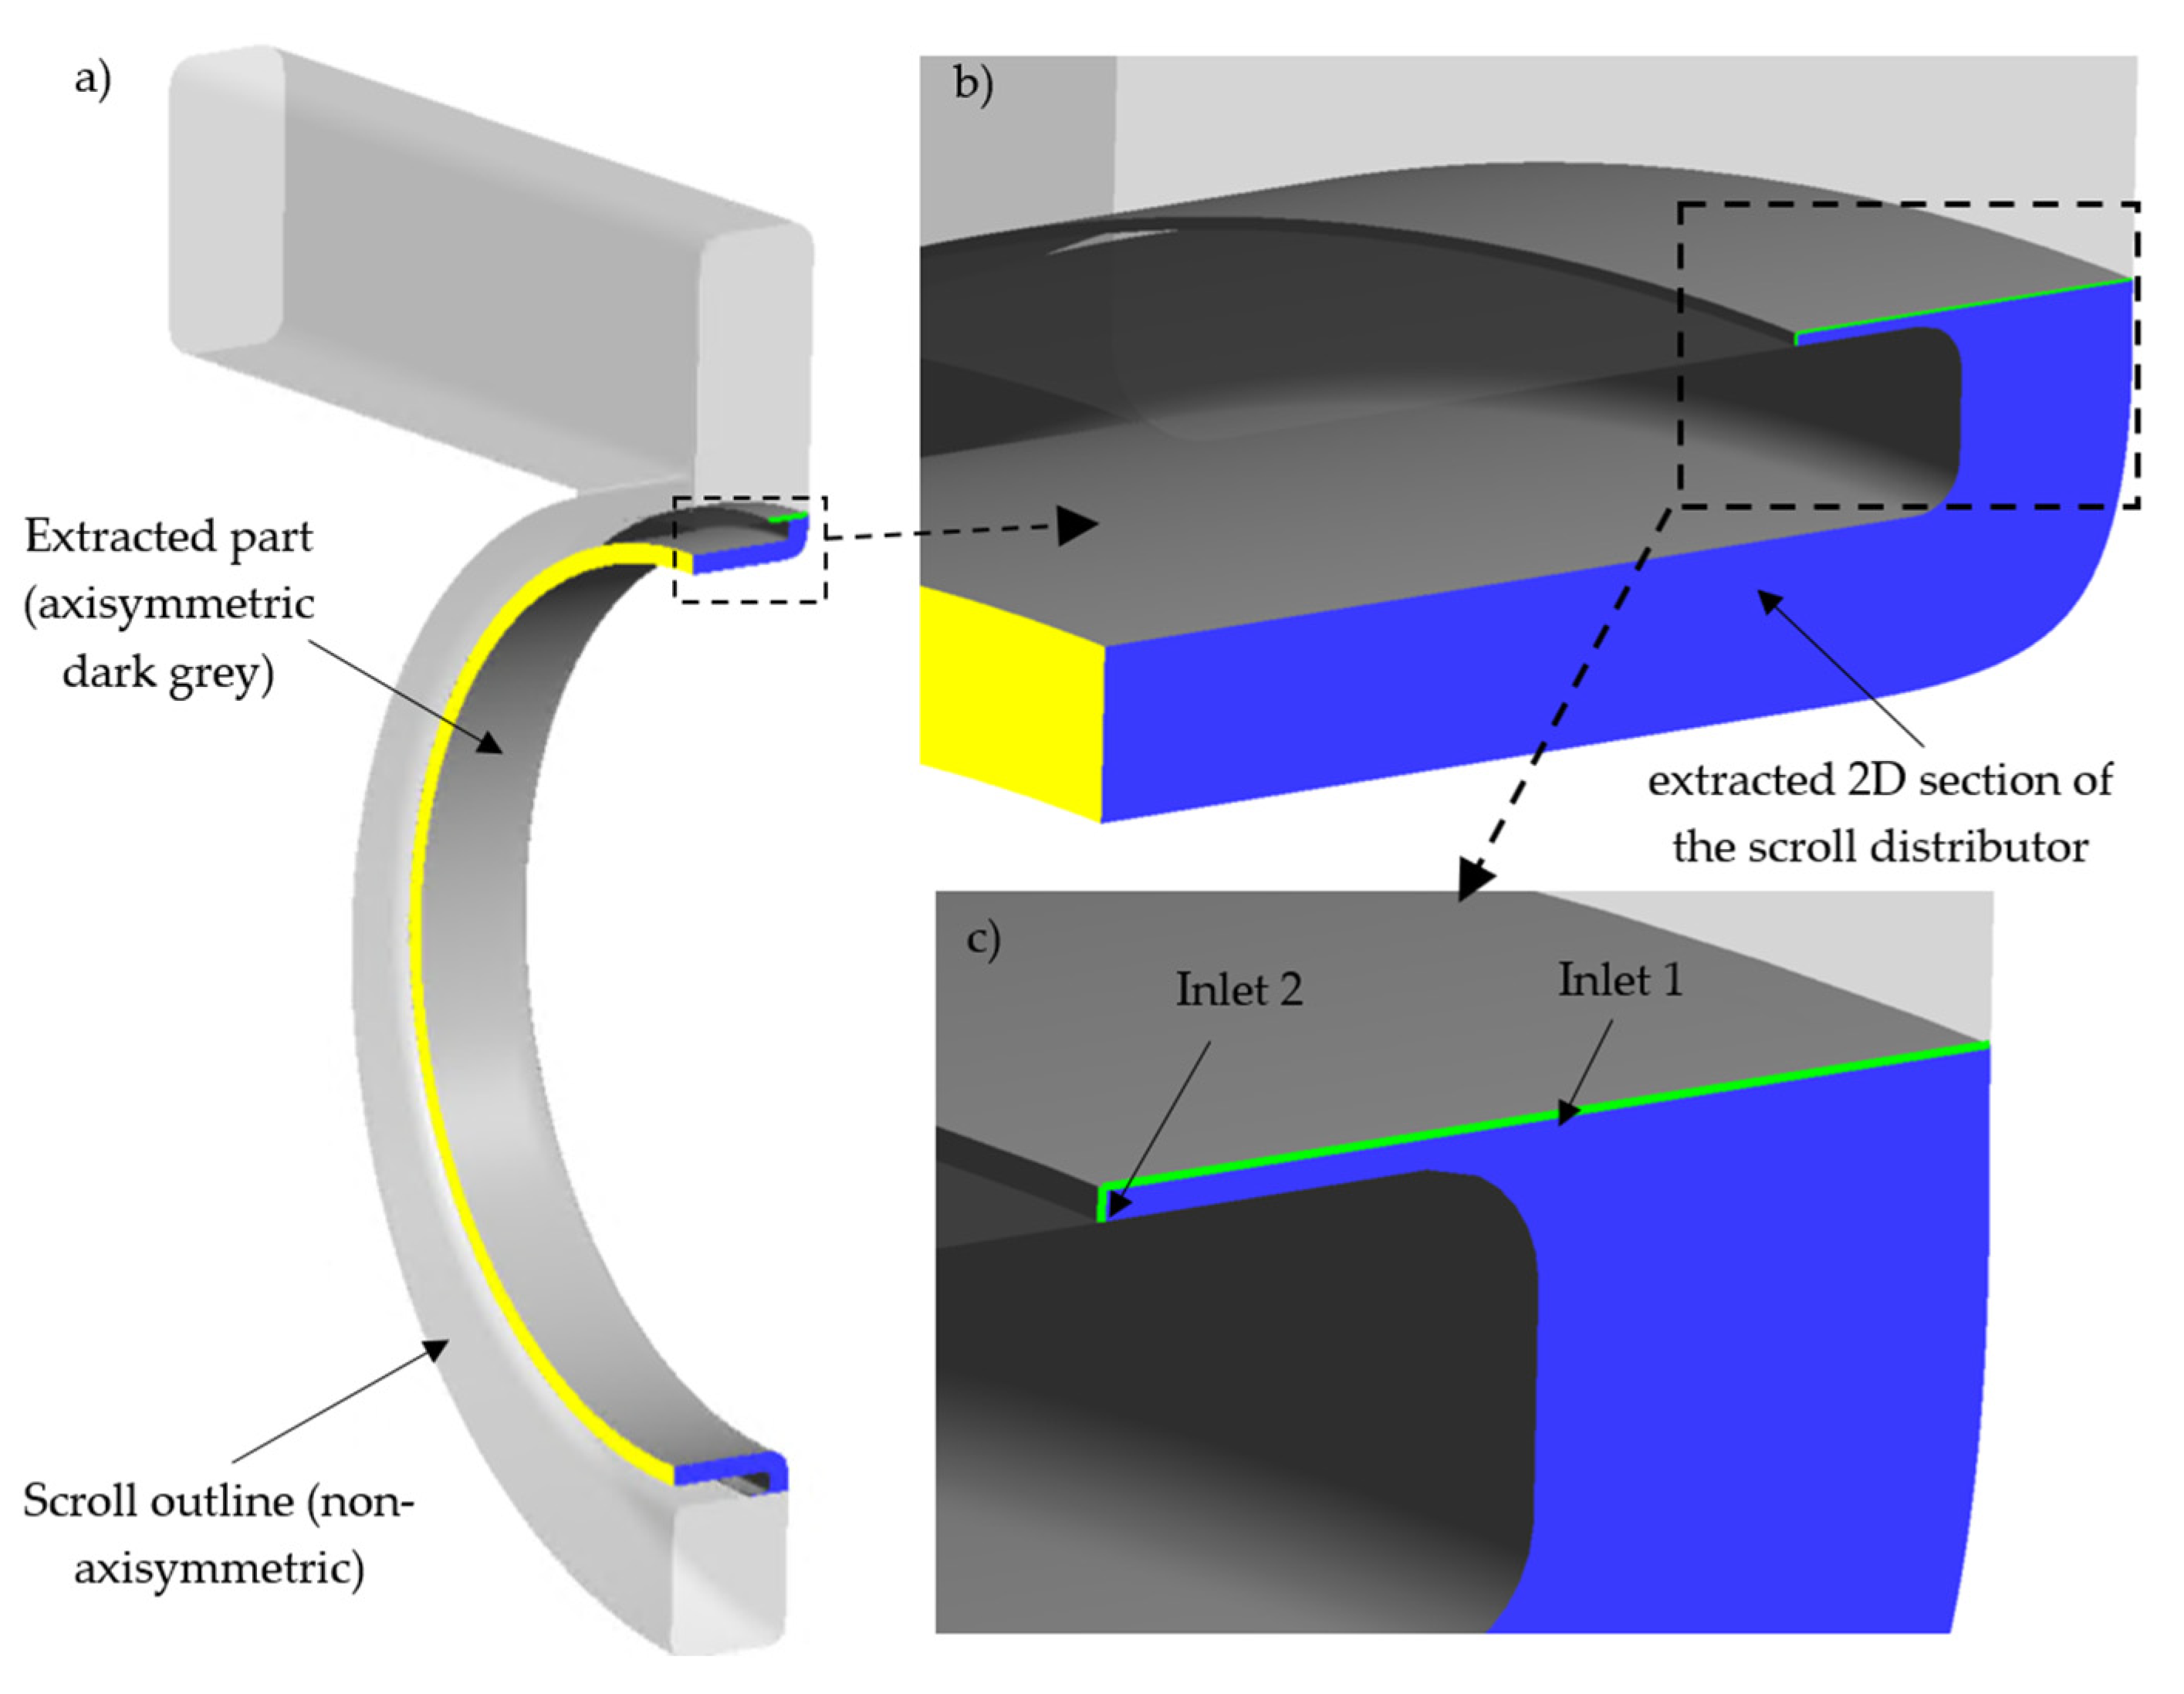
It was possible to downsize the problem in order to optimize efficiently the channel bend, as we took advantage of the circumferential flow uniformity in the scroll. Within this approach, the axisymmetric part could be extracted from the non-axisymmetric geometry of the whole distributor. A computational domain was decreased to a quasi-2D piece with 1° section. It was a software requirement, as ANSYS CFX does not have a separate 2D solver. A choice of the inlet location of the reduced model was based on the scroll geometry, optimization possibilities, and authors’ experience. The setup used two inlets for more extensive inner wall shaping flexibility, as shown in Figure 6c. Inlet 1, in the radial direction, was located downstream as far as possible for the increased flow uniformity. Inlet 2, in the axial direction, was moved from the bend to allow the geometry shaping flexibility. A comparison of the overall geometry and the extracted, axisymmetric part is shown in Figure 6.
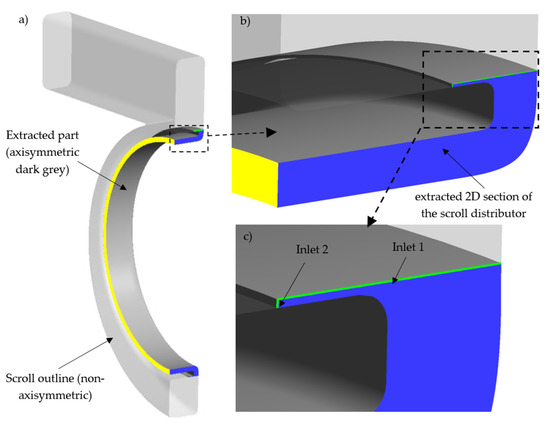
Figure 6.
Scroll problem downsizing: (a) general view of the scroll—non-axisymmetric part (light gray) and the part extracted for downsizing (dark gray); (b) cross-section used in optimization procedure; (c) Inlet positions in the extracted part of scroll.
2.4. Two-Dimensional Simulation
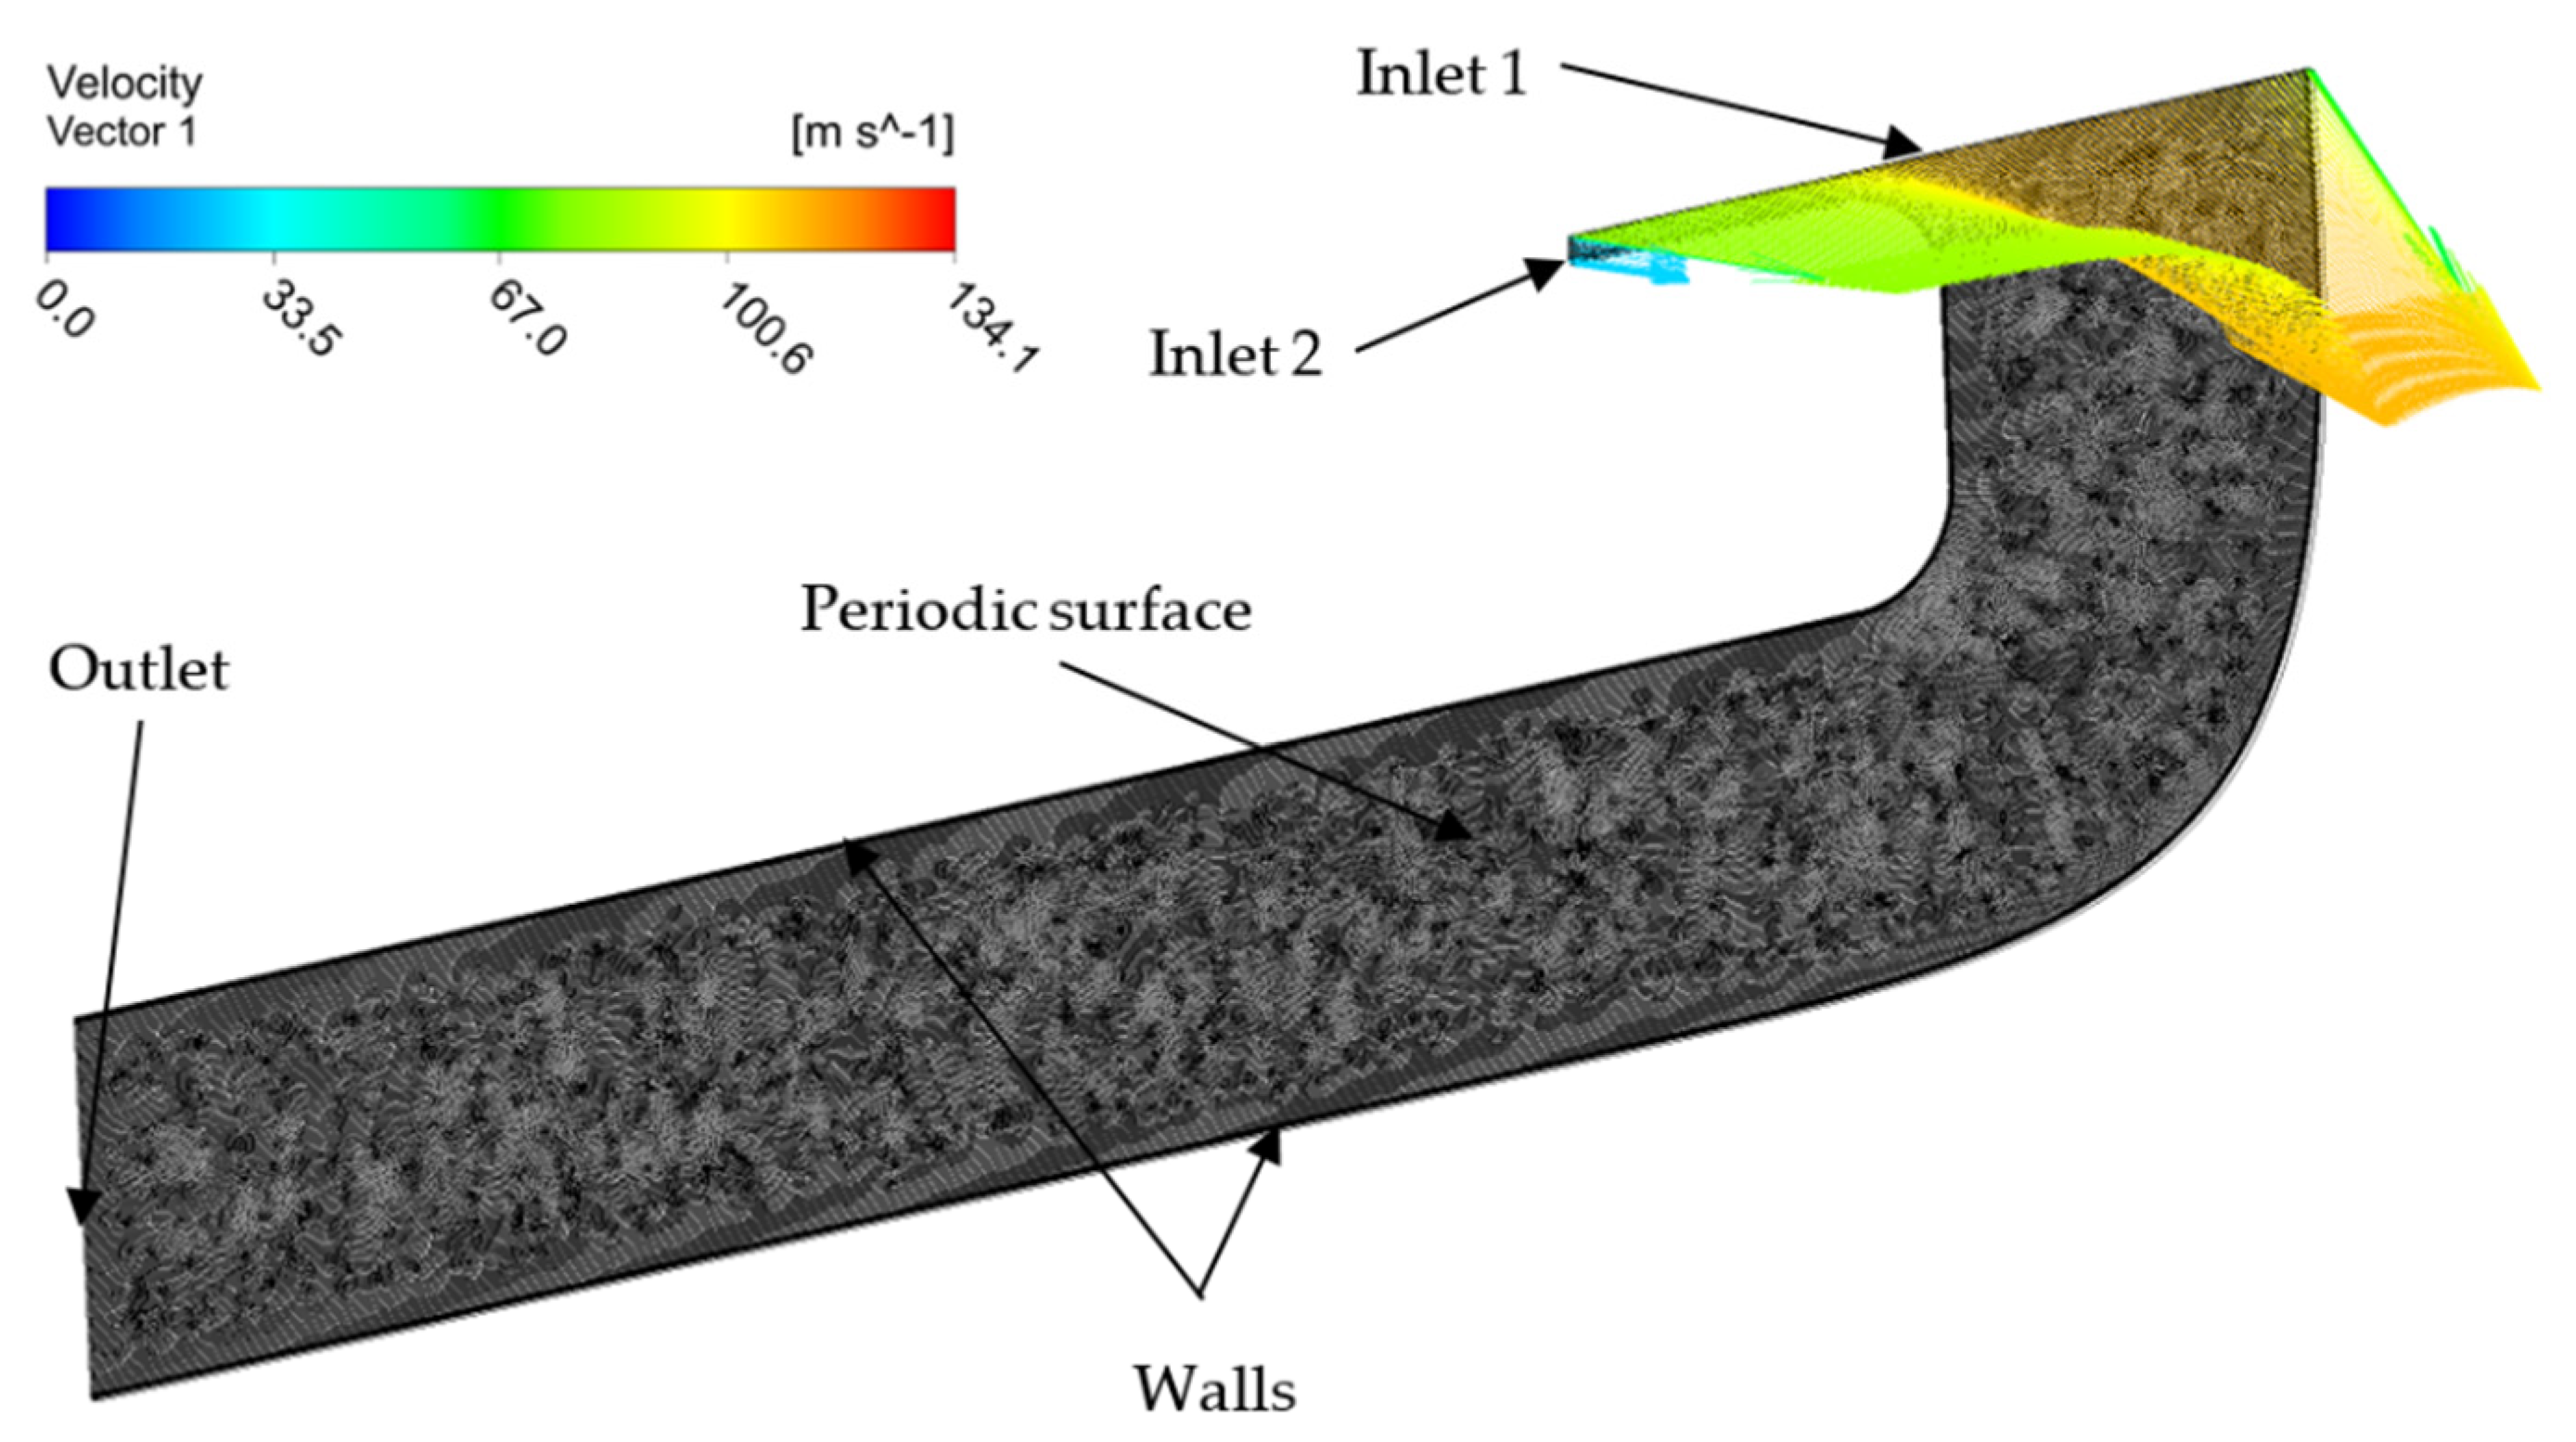
A setup for 2D computations is shown in Figure 7. Profiles of circumferentially averaged parameters (velocity vector components, static temperature, turbulence kinetic energy, and dissipation of turbulence kinetic energy) were applied. The velocity profiles are shown as vectors, indicating the existence of two velocity zones. The computational domain outlet is in the same location as it was for the full distributor, and the same boundary condition settings were applied there. Channel walls were defined as smooth and adiabatic. At the sides of the channel section, the periodic data exchange was specified, which was required in the quasi-2D simulations due to the inlet swirl. Similarly, as in the case of the simulation of the initial scroll configuration, steady-state simulations of the air flow (compressible–ideal gas) were performed for all cases under analysis. The flow was turbulent; therefore, once again, RANS simulations were conducted with the Shear Stress Transport (SST) turbulence model. The setup parameters are listed in Table 2.
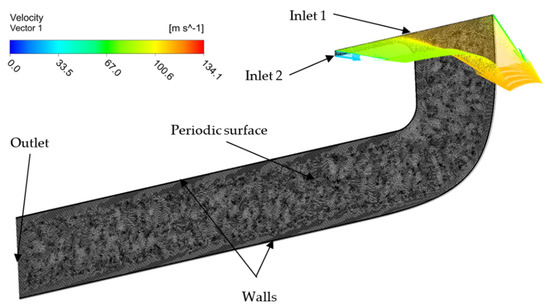
Figure 7.
Computational domain with mesh elements and boundary condition regions.

Table 2.
Numerical model settings for the 2D simulations.
A high-quality unstructured hexahedral mesh was generated for the channel geometry in Ansys Meshing (see Figure 7). Due to the ANSYS CFX requirements for quasi-2D simulations with an inlet swirl, two elements were applied in the circumferential direction with the one-to-one periodicity of the node positions. The y + parameter of the first mesh element at the wall was kept below 1, which is necessary for the proper solution of the boundary layer when using SST turbulence model. During the optimization procedure, as the geometry was altered, the mesh was automatically regenerated with the use of identical parameters. Taking advantage of the problem downsizing, for all channel geometries analyzed during the process, the size of the mesh was below 150,000 nodes, compared to 4.9 million elements for the 3D case. High-quality solutions with low residuals, full balance of conservative parameters, and stable values of the optimization criteria were obtained for the majority of geometrical configurations. In the cases where the channel shape led to separations, some oscillations of the solution parameters were observed. The solution time for this problem was around one hour with the use of a desktop workstation with a quad core processor. The mesh independence study was performed based on a procedure described by Celik et al. [29]. The procedure allows for an assessment of the uncertainty due to discretization by means of Richardson’s extrapolation. In our case, three parameters crucial for further results evaluation were considered. The first one was total pressure change between the inlet and outlet, which was representative of losses in the flow. The second one was the averaged flow angle, as defined in Equation (3), and the third one was a value of averaged velocity over the line located at the leading edge of the guide vain. Three different meshed were prepared, having 65,000, 150,000, and 350,000 nodes. The results from the mesh independence study are shown in Table 3. The uncertainty due to discretization determined for all parameters on the basis of the Richardson’s extrapolation procedure for intermediate mesh was low, i.e., 1.73%, 0.17%, and 1.39% respectively. Thus, it was decided to use it in the further numerical investigations.

Table 3.
Mesh size independence study.
2.5. Model Geometry Parameterization
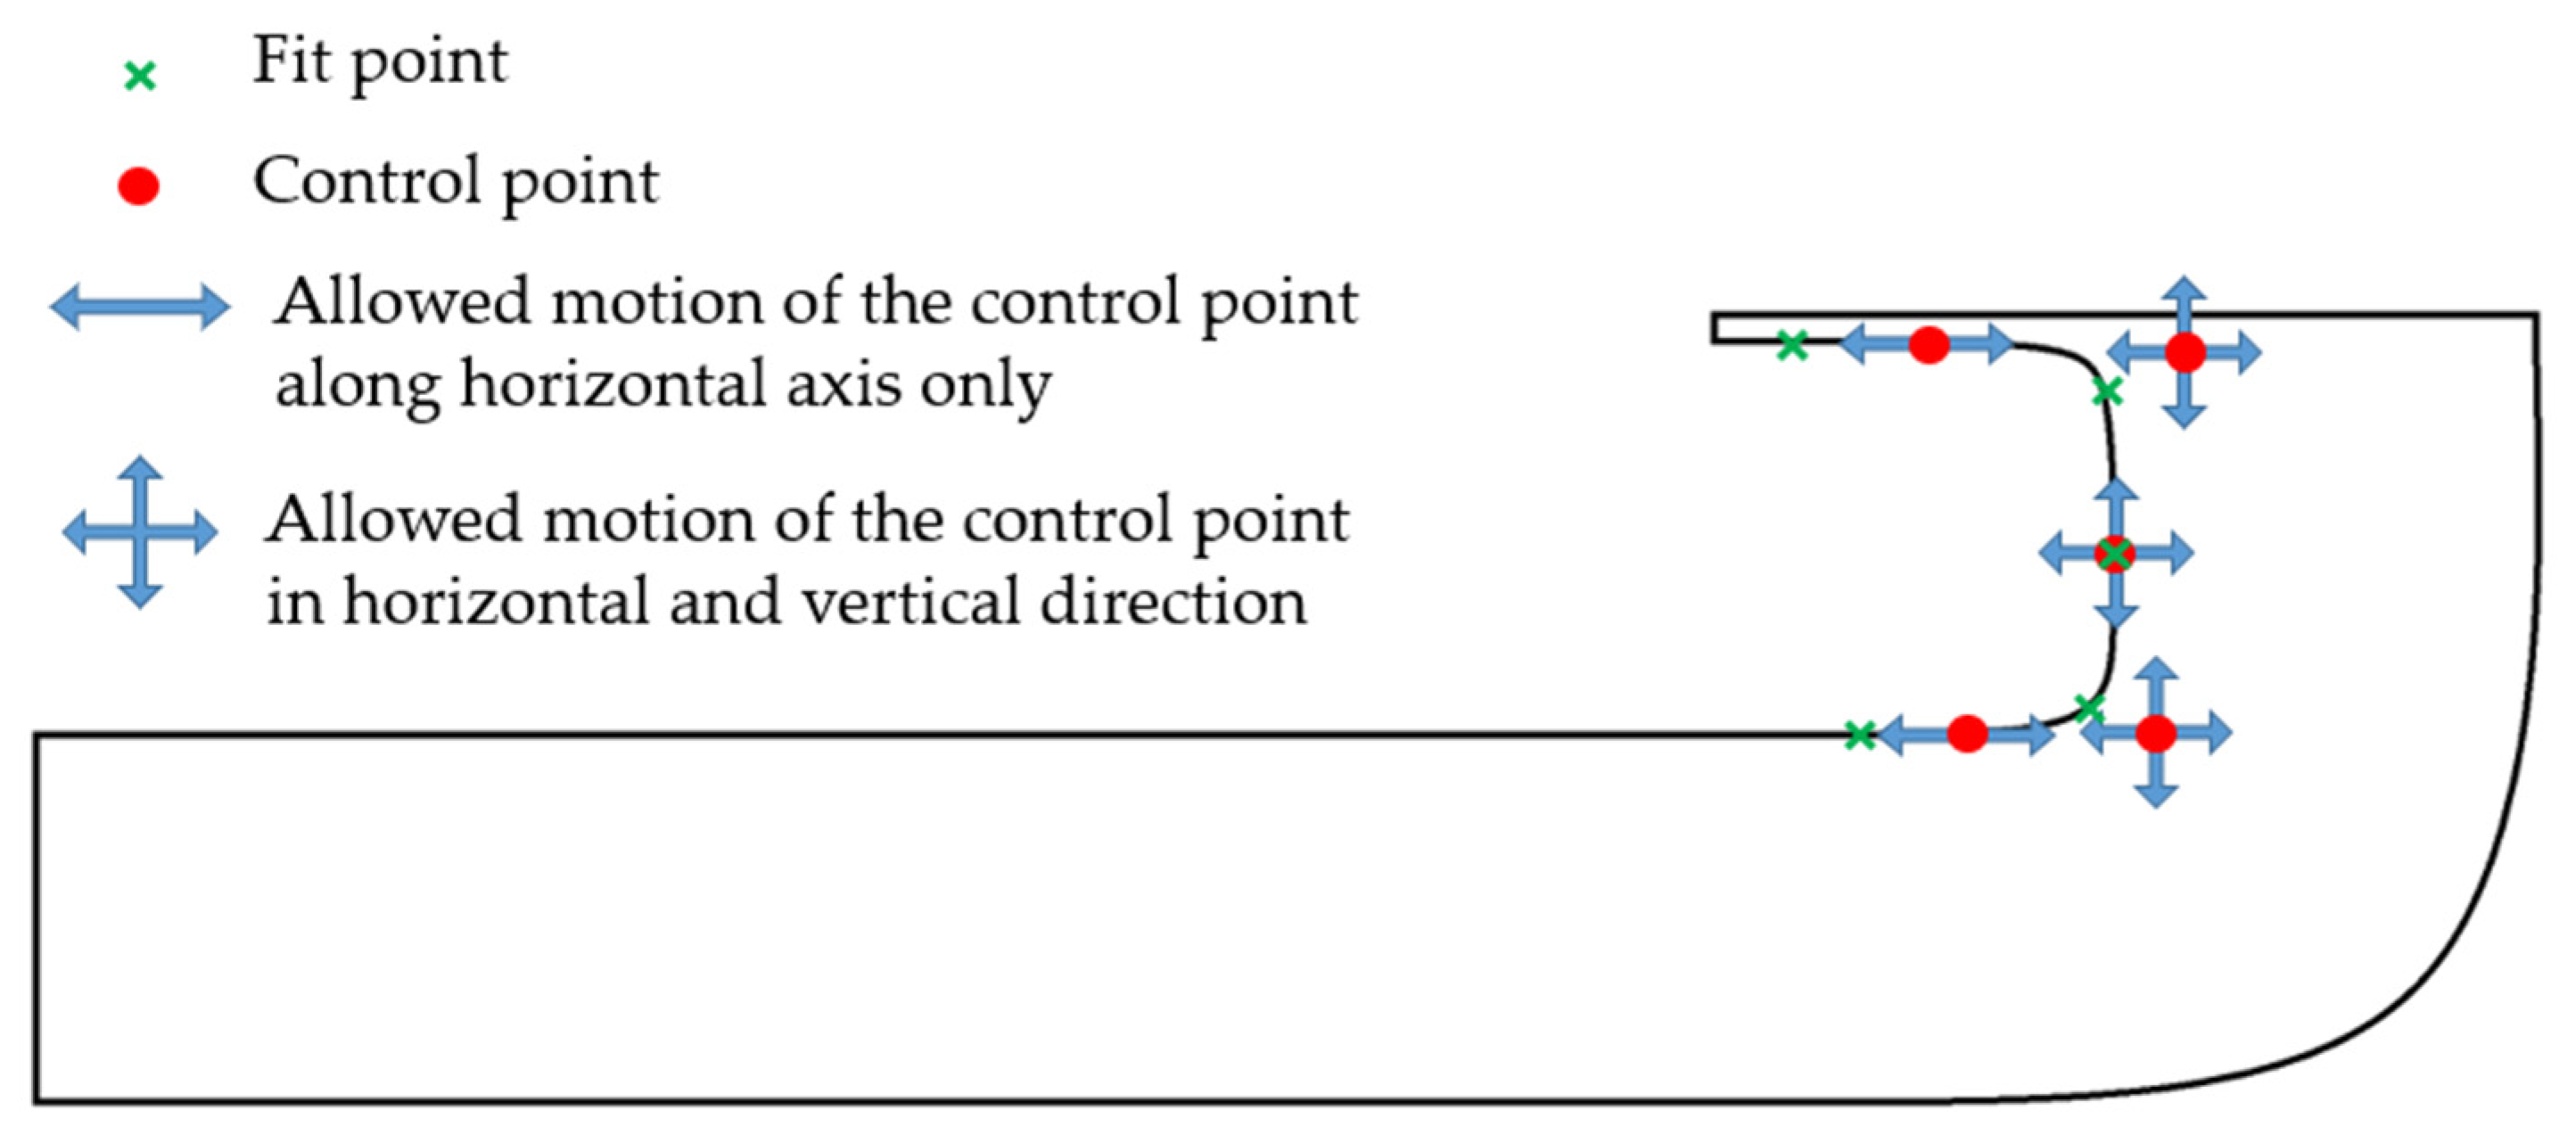
The channel geometry was prepared in the DesignModeler—a CAD module of the ANSYS 2019R3 software, which made the connection with other elements of the optimization loop easier. However, it could be done in any CAD software. The shape optimization procedure was carried out within the geometrical constraints of the distributor and the guide vanes channel. Only the internal wall shape was subjected to optimization, as a preliminary investigation showed its dominating influence. For a broader scan of design space, a high flexibility of bend shaping was allowed. The bent geometry was defined with a Bezier spline curve, which was based on five fit points, as illustrated in Figure 8. The curvature of the spline was controlled by five Bezier curve control points. Two of them were constrained as a tangent to the horizontal lines defining the channel walls; thus, its position could be changed along the horizontal axis only. The other three control points were changing positions along the vertical and horizontal direction. In total, eight variables were used to control the spline curvature. The dimensions allowing for point position control were selected as input parameters to the optimization module, which could change them in every iteration of the procedure. Limit values of geometrical parameters were chosen in a way that ensured feasible channel geometries. The geometry had to remain streamline—a continuous, non-crossing line to be considered as a possible solution to this problem.
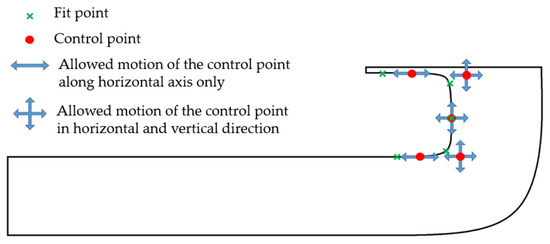
Figure 8.
Geometry controls for the 2D optimization case.
2.6. Optimization Procedure
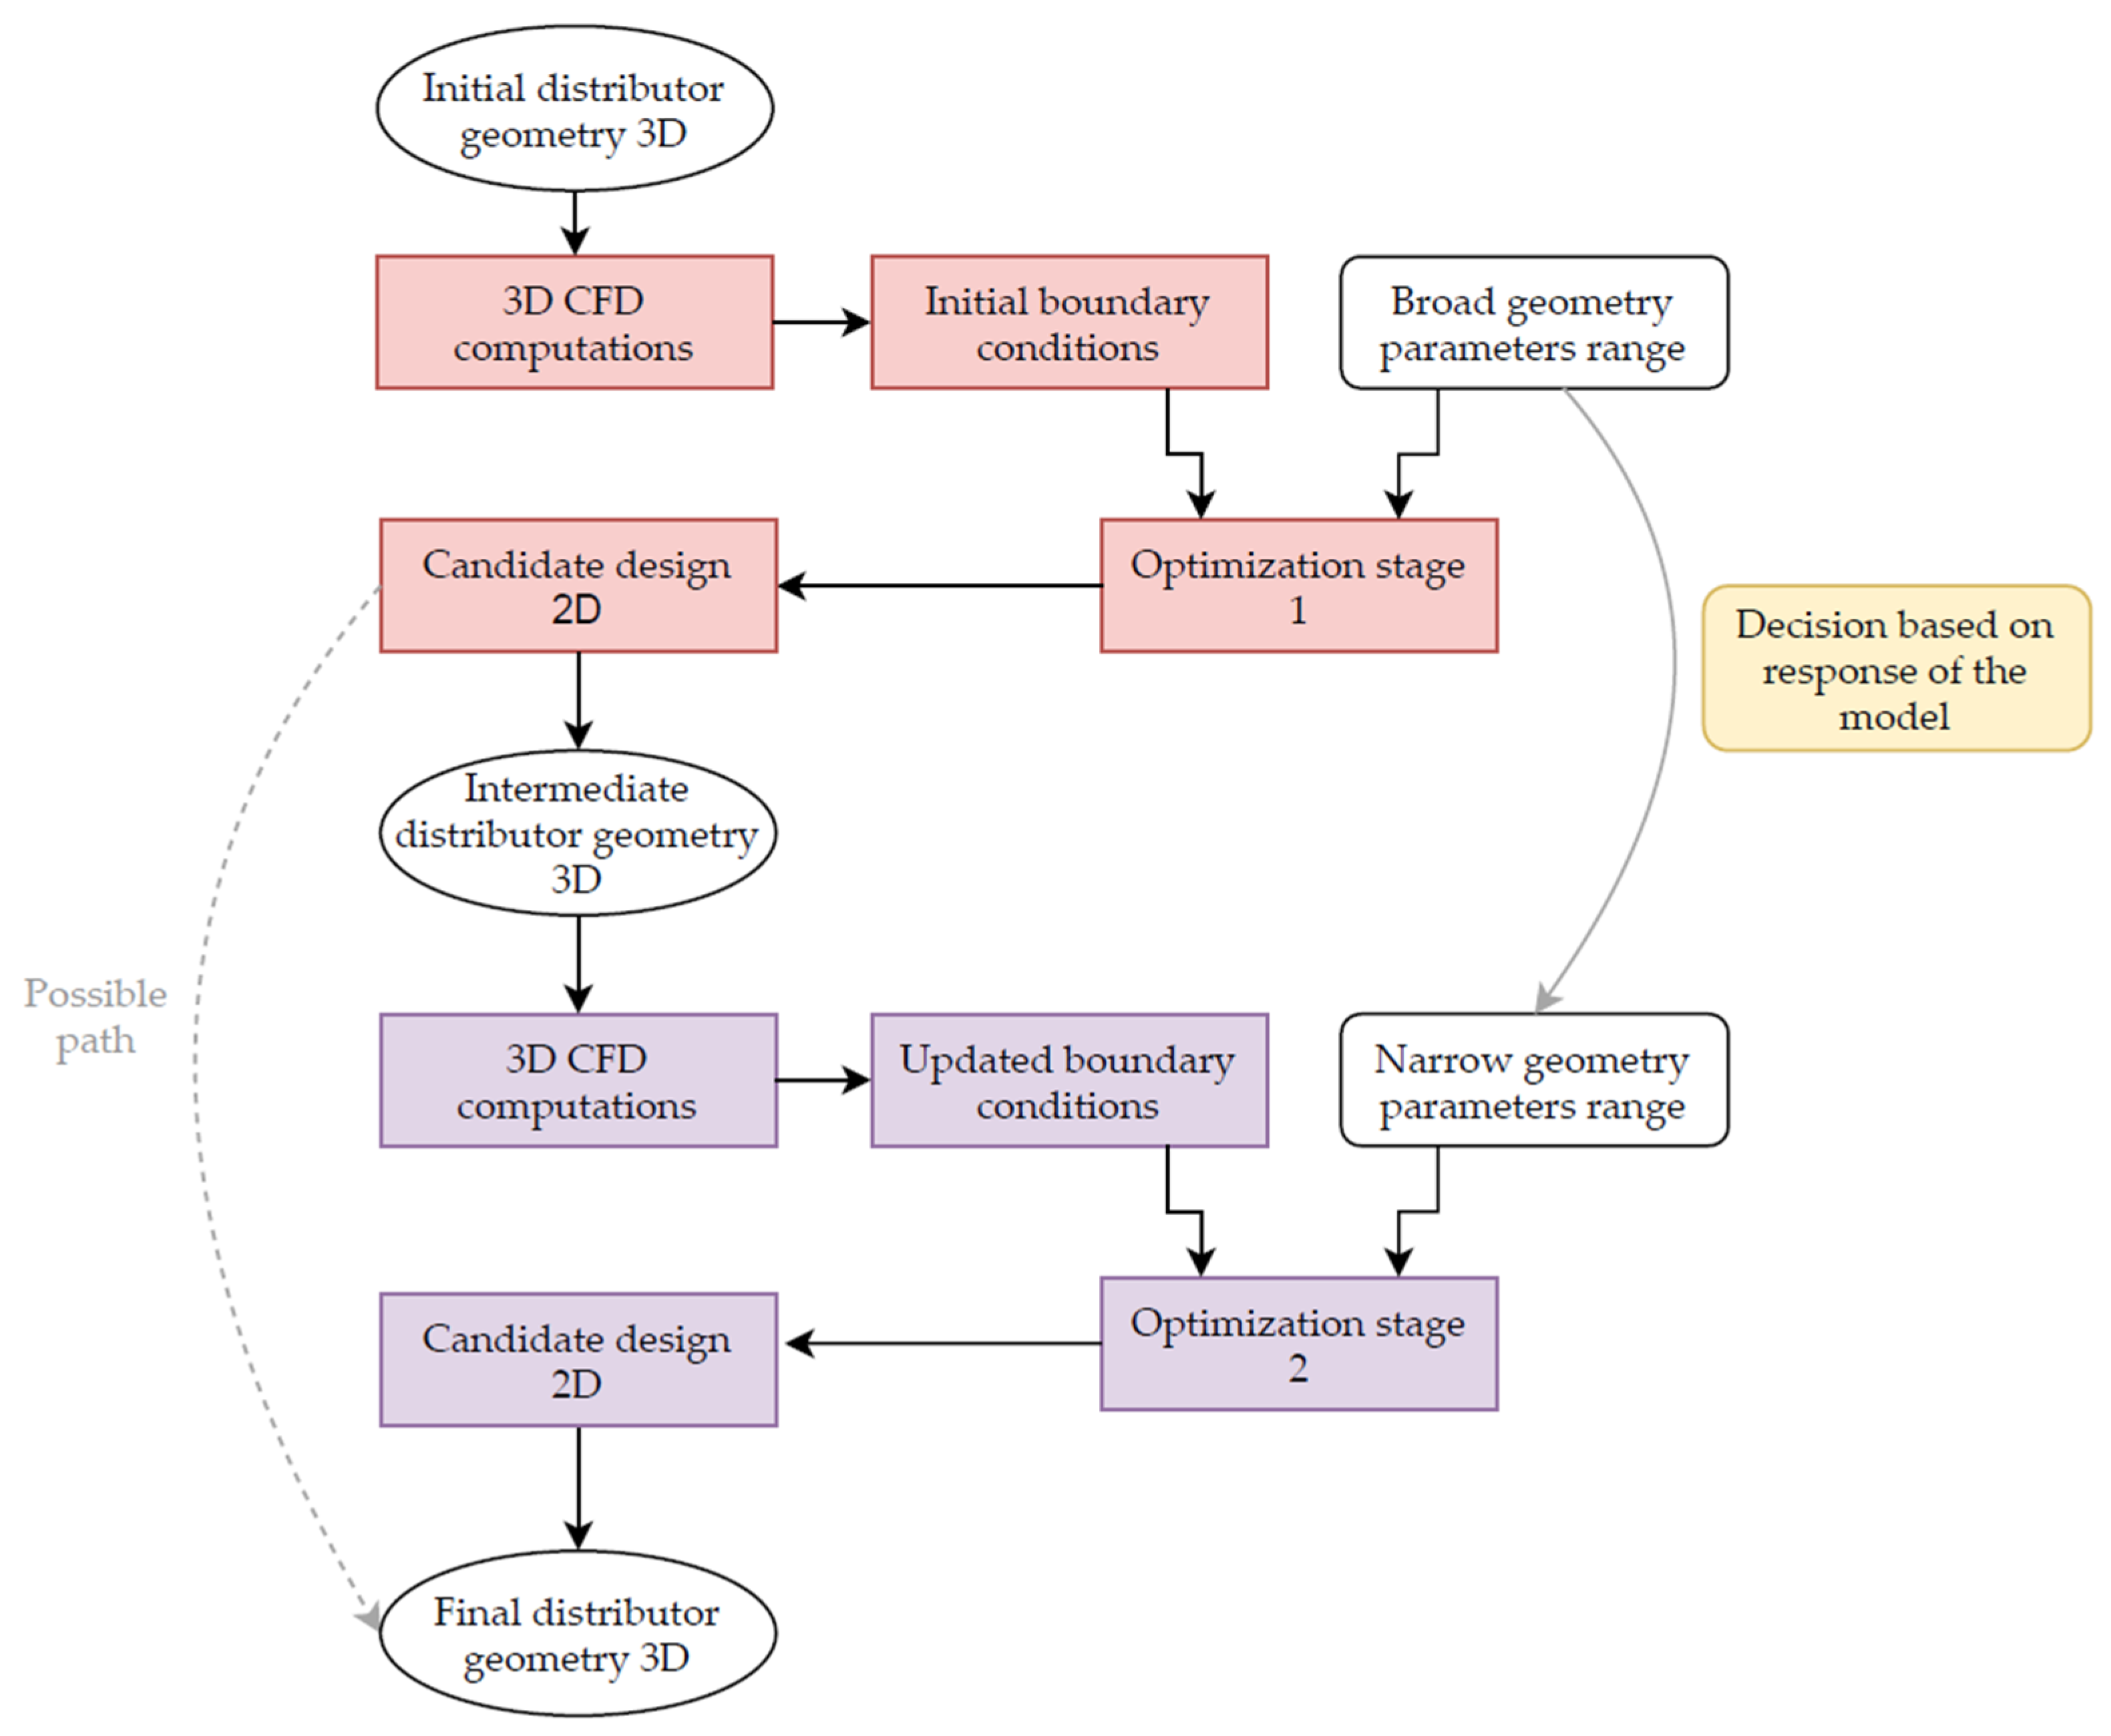
The optimization procedure for the scroll was divided into two stages. In the first stage, the 3D simulation of the initial design was carried out, and its results were used to obtain a set of boundary conditions. Then, the optimization of the 2D case was performed with those boundary conditions. In total, 160 channel geometries were examined in that step, using a wide range of geometrical parameter values, which allowed for the quick mapping of a wide design space. Next, the best bend geometry from the first optimization stage was extracted. A full geometry with a new inner wall shape was developed, and its 3D simulation was carried out to obtain updated boundary conditions. It was considered necessary, as the inner wall shape and the resulting flow field in the distributor changed considerably from the initial one. After the assessment of the design response, the new limits for geometric parameters variation were set.
In the second stage, the updated boundary conditions were used for the further optimization procedure. The range of geometrical parameters variation was limited, compared to the first stage, as it was possible to identify optimal ranges based on the first-stage results. In total, 80 design points were created and computed in the second stage of the optimization. The outcome of the optimization process was a candidate design, which was used for the creation of a 3D geometry being a final distributor geometry for this study. A schematic description of the procedure is depicted in Figure 9.
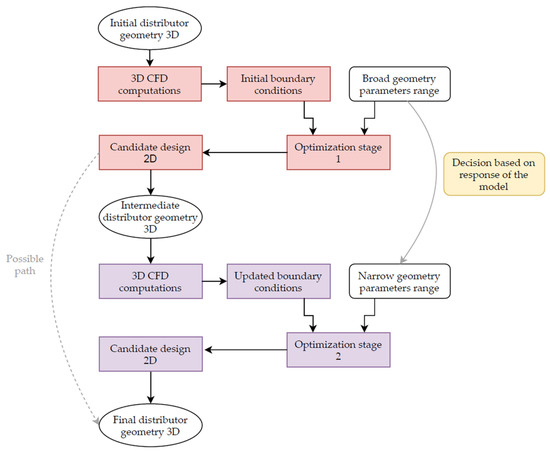
Figure 9.
Optimization process overview; the first stage is marked in red; the second stage is marked in purple.
The need for a second stage comes from a specificity of this application, but it might be considered for every case where the change of initial shape is substantial and can importantly influence the flow structure, thus, the boundary conditions of the downsized case. Obtaining a very good approximation of the final solution from the first stage allows the second stage to be more detailed, leading to obtaining an optimized solution. In this study, the application of two stages also allowed narrowing down the variation of geometrical input parameters to optimized variables. If the change of a distributor shape was less significant, it might have been possible to apply only a single stage of optimization (indicated as a possible path in Figure 9) and take the first candidate design as a base for the final 3D distributor geometry.
The optimization procedure used the Design of Experiment (DOE) method to obtain coordinates of design points properly distributed in the design space. The Central Composite Design method was applied for defining values of geometrical parameters. Results of the computations were used to construct a response surface using second-order polynomials. The regression model was supported with a Yeo-Johnson transformation for obtaining a better fit of the surface to the data. The process of optimization was performed with a Multi-Objective Genetic Algorithm (MOGA) being a Non-dominated Sorting Genetic Algorithm II (NSGA-II) algorithm [30] validated for numerous cases and commonly used in turbomachinery optimization [7,9]. It was chosen due to its robustness and the possibility of finding the global extremum, avoiding landing in the local ones, as it might happen for gradient-based methods [1]. For every optimization cycle, the algorithm performs cross-over and mutation of the design points. The cross-over probability was set to 0.98 and mutation was set to 0.01. For the convergence criteria, the maximum Pareto percentage was defined as 70%. The number of iterations was limited to 20. The initial number of samples was equal to 100. The geometry obtained from the algorithm was validated in 2D simulations, showing a good compliance with the response surface model, and it was used to build a full scroll geometry. The same procedure was applied for two steps of optimization.
A total of eight variables was used for controlling the geometry of the scroll, and their values were input to the optimization algorithm. The output of each optimization step was a specific geometry whose performance was validated based on the optimization criteria.
3. Optimization Criteria
Numerous criteria can define the flow quality in the channel under analysis. They should be chosen in a way that reflects the flow structure and losses. In this investigation, it was especially important to determine a velocity magnitude and flow angle uniformity at the location of the guide vanes leading edge. The automated procedure and the optimization algorithm required the optimization criteria to be expressed quantitatively, preferably as a single value for each criterion. Therefore, the uniformity of the flow structure at the guide vanes leading-edge location was evaluated through coefficients, which describe a span variation of velocity. The velocity value coefficient (VVC) and the velocity angle coefficient (VAC), computed from (1) and (2) respectively, were determined for 15 points (n = 15) distributed along with the channel height, with a denser distribution near the walls. Averaged values of the velocity and angle were computed as an algebraic average from all points. The angle for the VAC was obtained according to (3). Additionally, the Kinetic Energy Correction Factor (4) was computed for each geometry in the location of guide vanes leading edge.
where is the average velocity at a line, is a velocity at a given point, is the average angle for all points along the line, is an angle at a given point at the line; is the axial velocity component, directed along the Z-axis direction (Figure 1); is the circumferential velocity component.
The goals for the criteria were formulated in line with the aim of the optimization. The kinetic energy correction factor, accounting for the flow uniformity, reaches the value of 1 for the fully uniform velocity field. VVC and VAC values were to be minimized, as the smallest value of this criterion would indicate that the velocity and angle differ the least from the average values. A static entropy difference between the channel inlet and outlet was monitored and had to be minimized, as its increase implies entropy generation in the channel, which is associated with losses in the flow. Additionally, the area occupied by a reversed flow was computed for each case, which allowed one to monitor the presence and size of the separation zone. This value also had to be minimized for the optimal solution. The optimization criteria and their targets are listed in Table 4.

Table 4.
Optimization criteria and their targets.
4. Results and Discussion
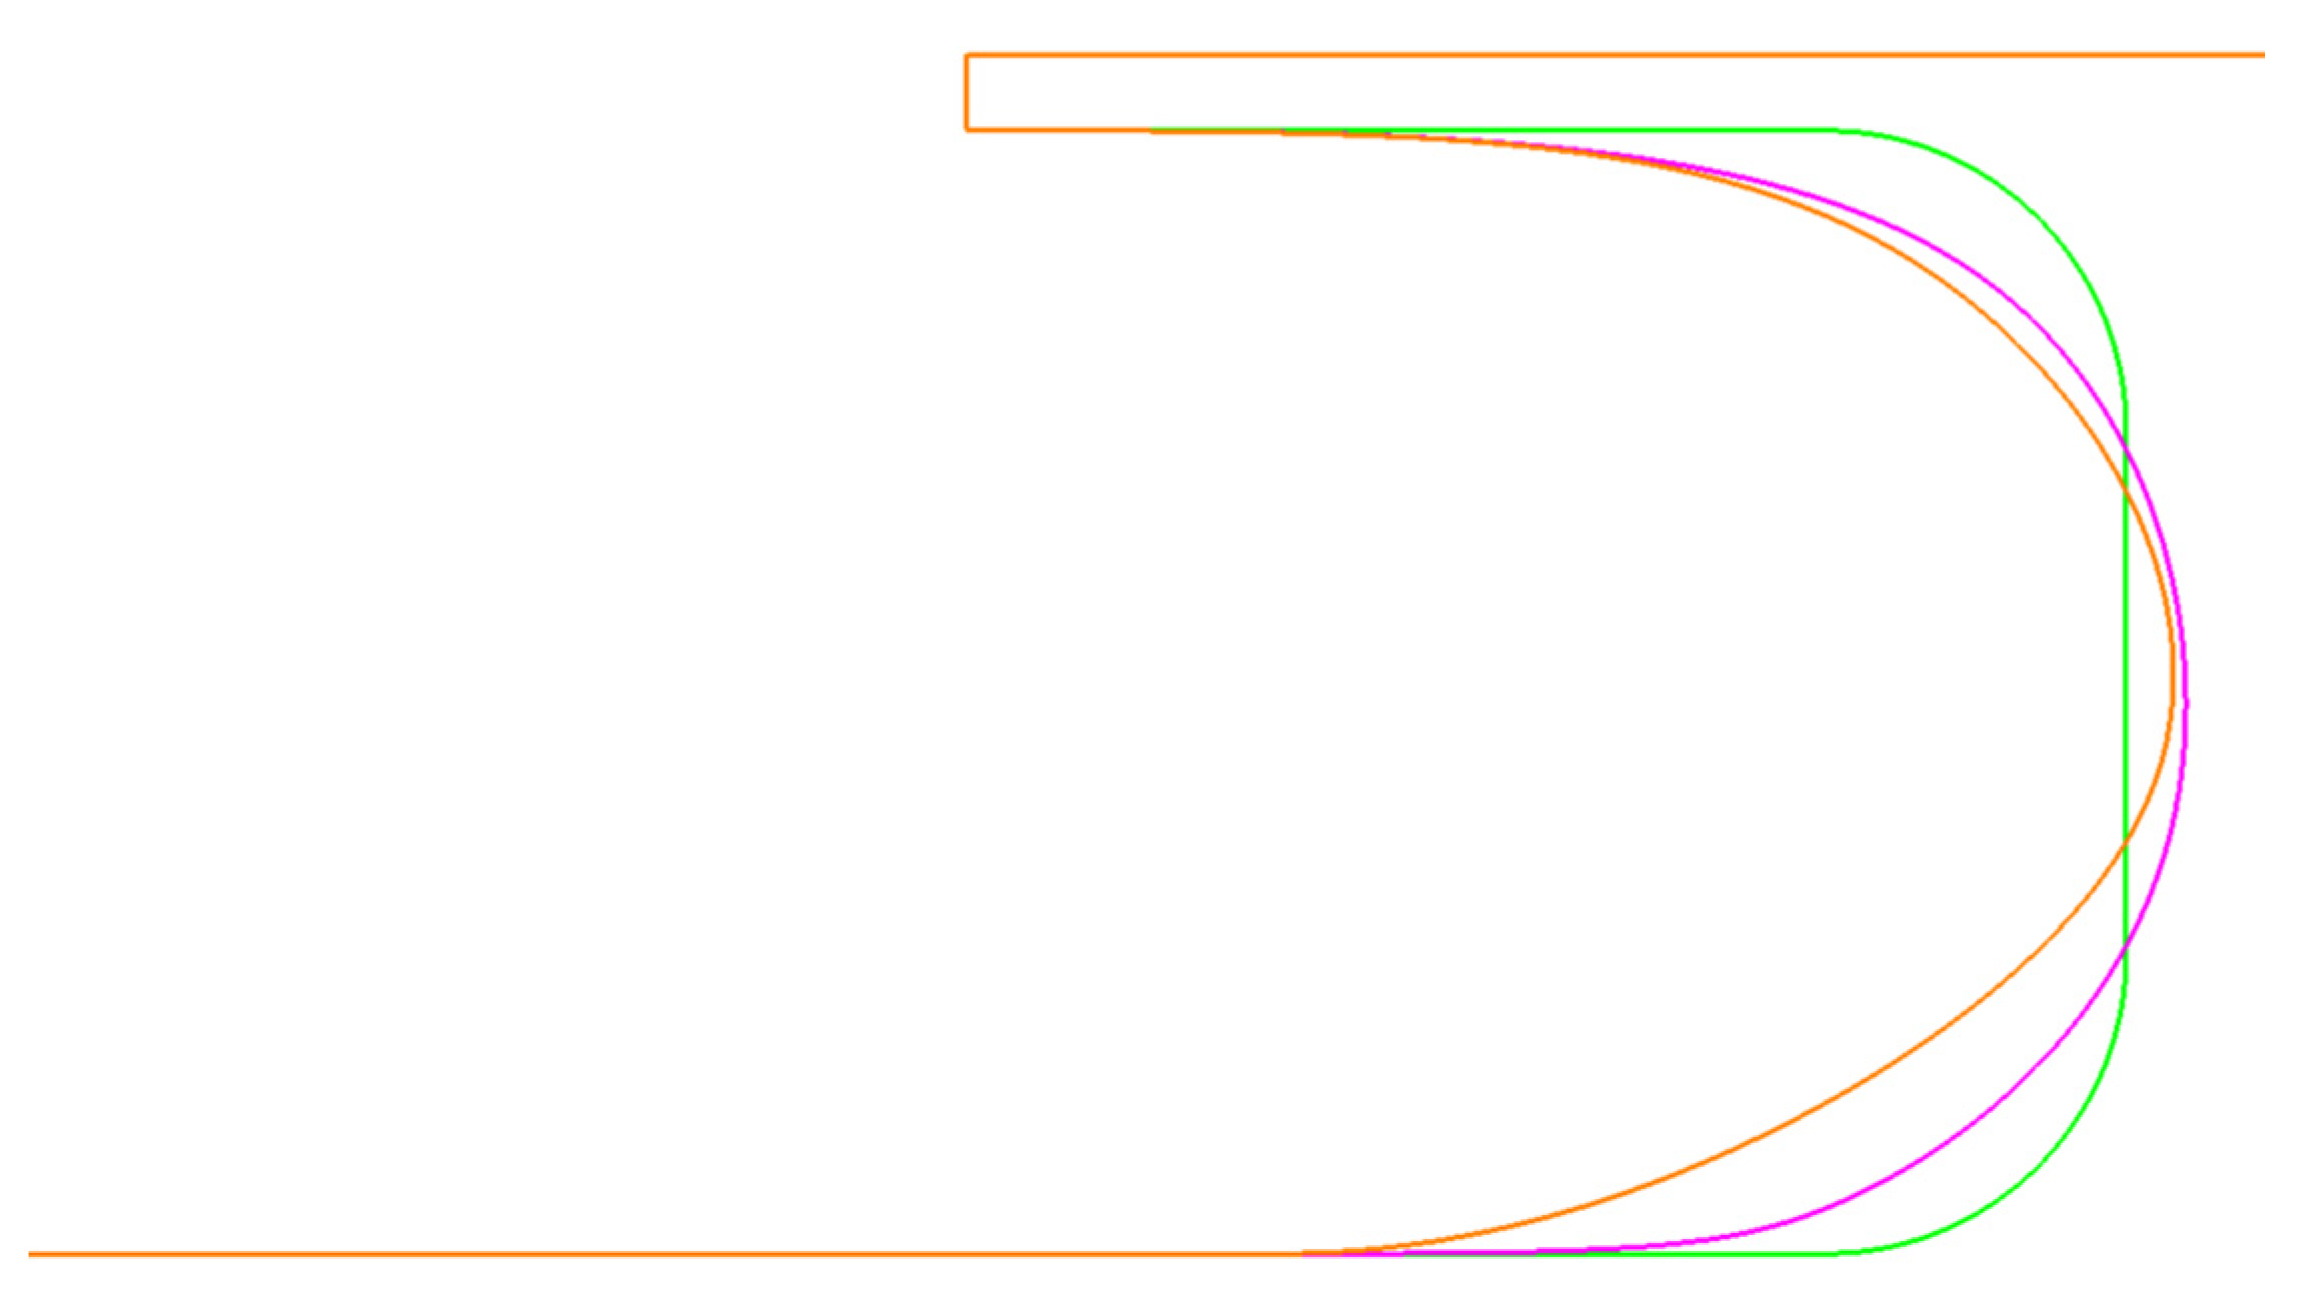
The results section is divided into two parts, both of which show an improvement in the flow structure between the initial and optimized case. An intermediate solution is also presented, as it proves to be an important improvement compared to the initial geometry. The first part of this section delivers a comparison of 2D solutions through contour plots of the velocity and entropy. It allows for good visualization of the effect of geometrical changes on the flow field. The second part shows a comparison of 3D solutions to capture a global efficiency increase and a flow change in the scroll. It is done through the analysis of velocity profiles and flow angles distributions in selected sections of the scroll. A global efficiency increase is computed between the initial and optimized geometries to confirm the potential of the method. A set of initial, intermediate, and optimal geometries are depicted in Figure 10.
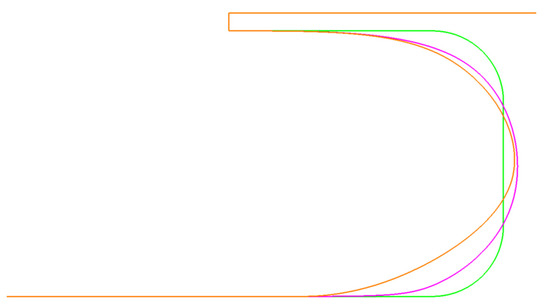
Figure 10.
Comparison of geometries—initial (green), intermediate (purple), optimized (orange).
4.1. Downsized Solution Analysis
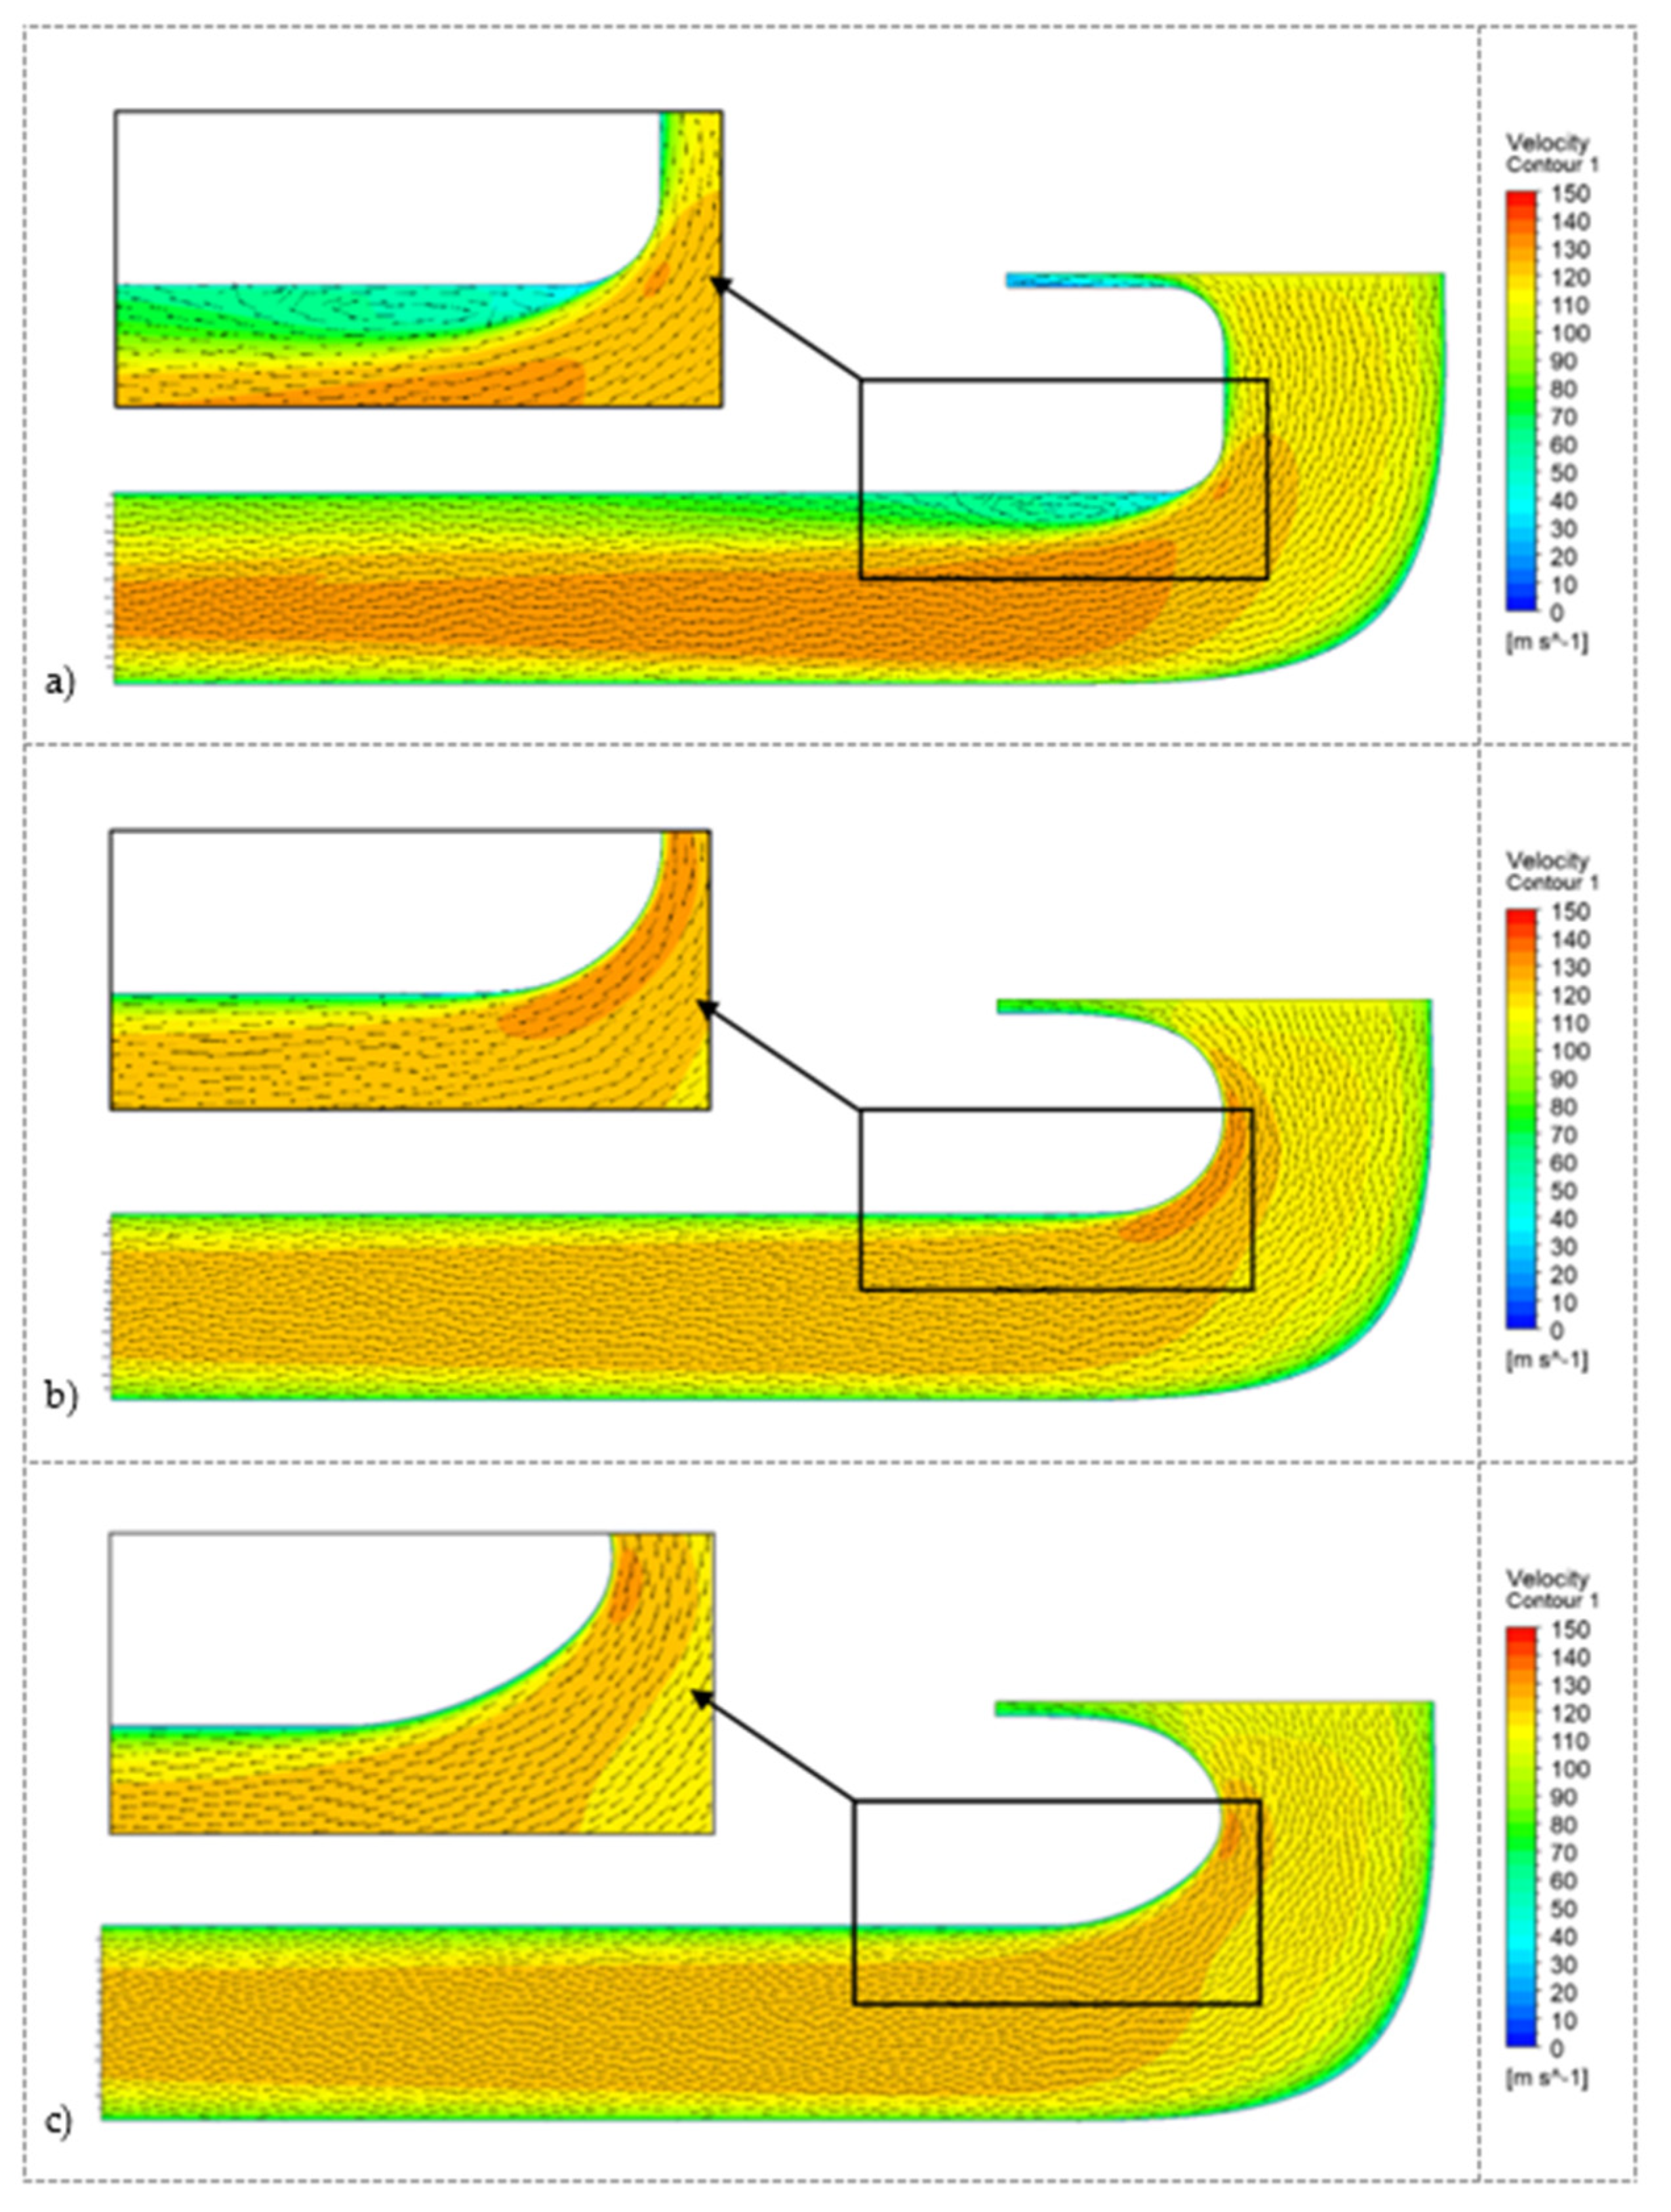
The first aspect of the comparison between the solutions is an analysis of the velocity field. Figure 11 shows velocity contours and vectors for the initial, intermediate, and optimized geometries with a magnified region near the scroll bend. Differences in the velocity distribution are very well visible near the inner part of the scroll bend. The flow solution for the initial geometry demonstrates a separation bubble, which was visualized with a vector plot. Due to the boundary layer separation, the active section of the flow is reduced. The resulting increased shear stress and dissipation decrease the overall scroll efficiency. Additionally, the velocity non-uniformity causes a considerable part of the guide vanes to work inefficiently. The intermediate and optimized geometries performed much better in that location, providing a more uniform velocity field and showing no traces of separation, which positively influenced the overall efficiency and guide vanes operation.
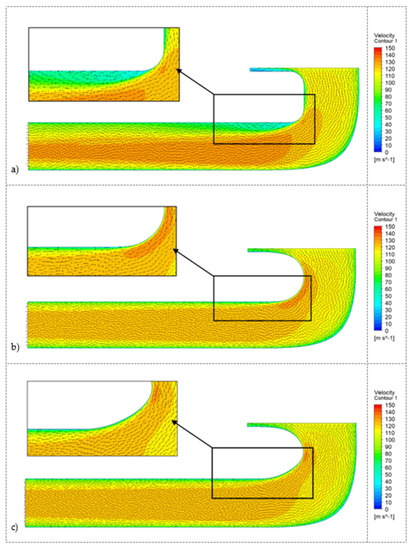
Figure 11.
Velocity contours for initial (a), intermediate (b), and optimized (c) geometries.
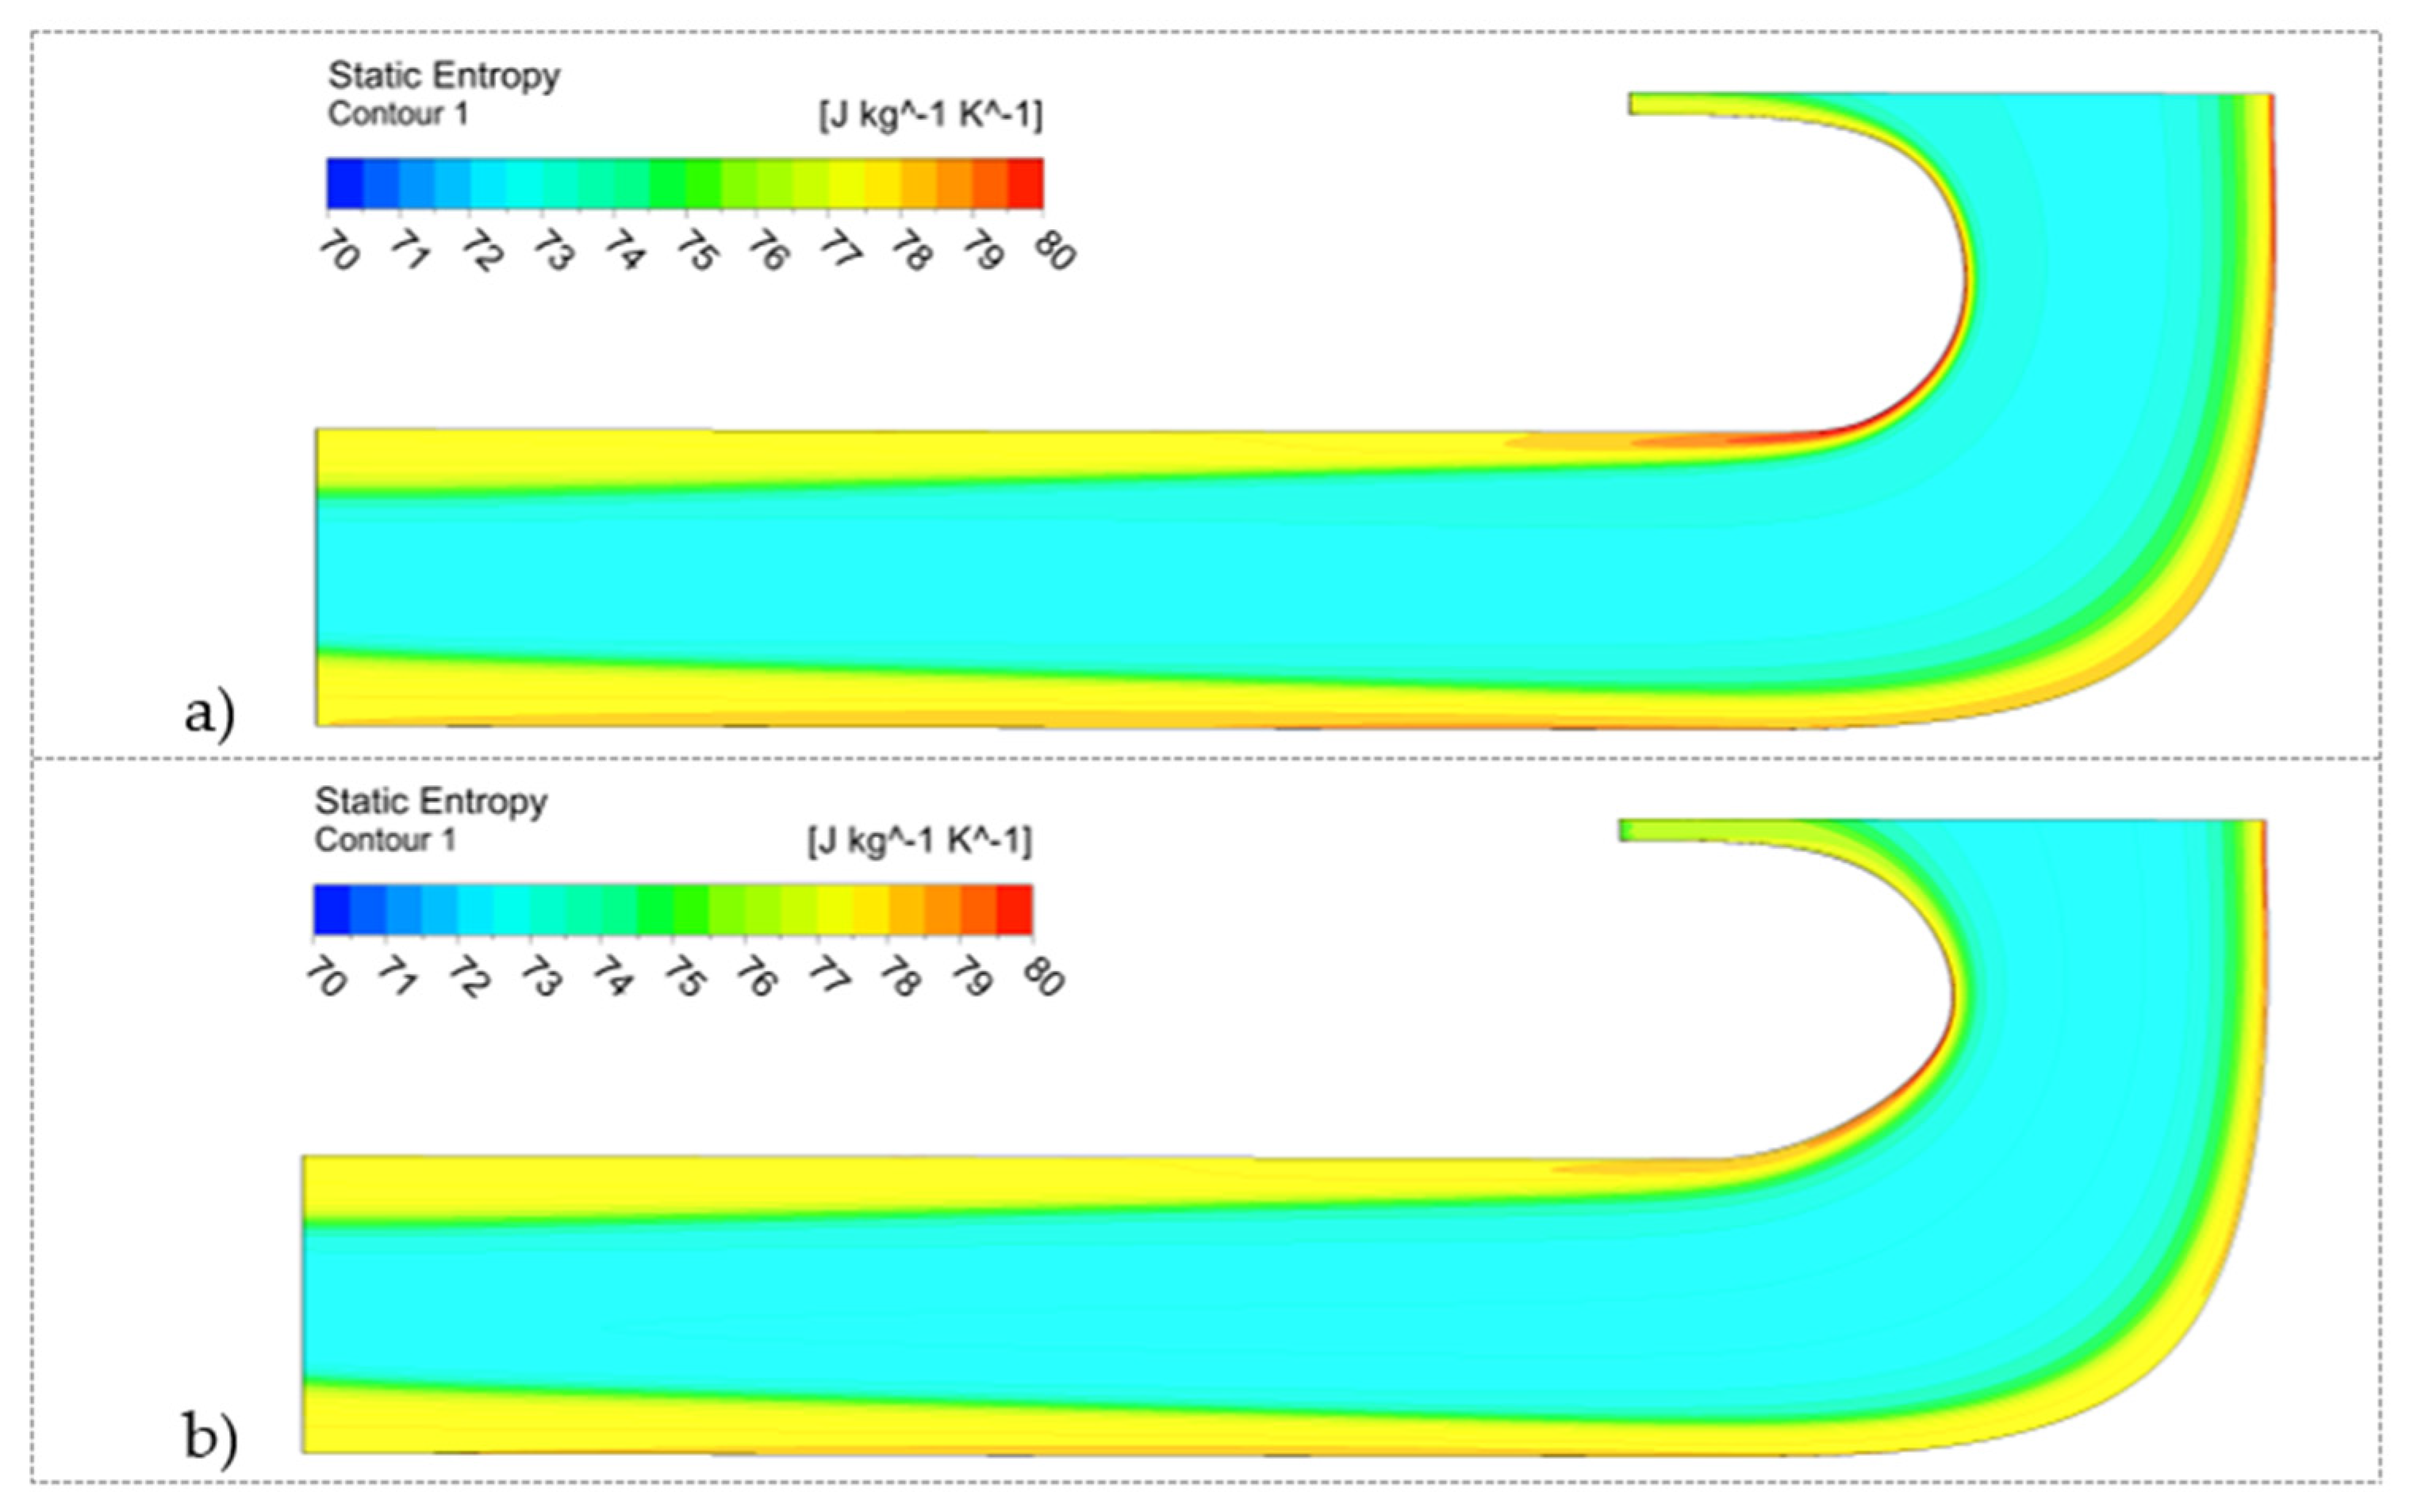
The static entropy contours for the intermediate and optimal curvature of the inner bend wall are presented in Figure 12. Both contours show a similar overall structure. The low entropy core of the flow is visible and surrounded by higher values for the regions of the inner and outer walls. The reduced entropy core is broader in the bend and narrows downstream of the channel. One can notice that the distribution of the static entropy at the outlet cross-section between the hub and shroud lacks extreme values; thus, it becomes more uniform. The difference between the intermediate and optimized cases is slight, with a higher entropy generation visible only at the bend for the intermediate case. The improved bend shape was followed by a decrease in entropy generation and hence flow losses.
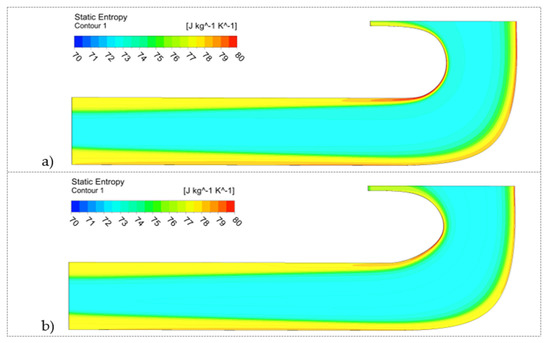
Figure 12.
Static entropy contour for (a) intermediate and (b) optimized geometry.
4.2. Verification of the Optimized Solution
After two loops of optimization, full 3D scroll geometry incorporating the optimized bend was generated. Identical boundary conditions and setup as in the previous simulations were used for this case. The results were compared for initial and optimized geometries at the selected locations of the scroll. The flow parameters were analyzed at the location of the blade leading edge (Figure 1b), since the flow uniformity is the most important there to appropriate the operation of the guide vanes. The velocity distribution in the radial (spanwise) direction was analyzed at four different lines located on the control planes, as shown in Figure 1a. The circumferential distribution was assessed at circumferential curves located at 10%, 50%, and 90% of the span. The 10% curve was located close to the hub, whereas the 90% one was located close to the shroud.
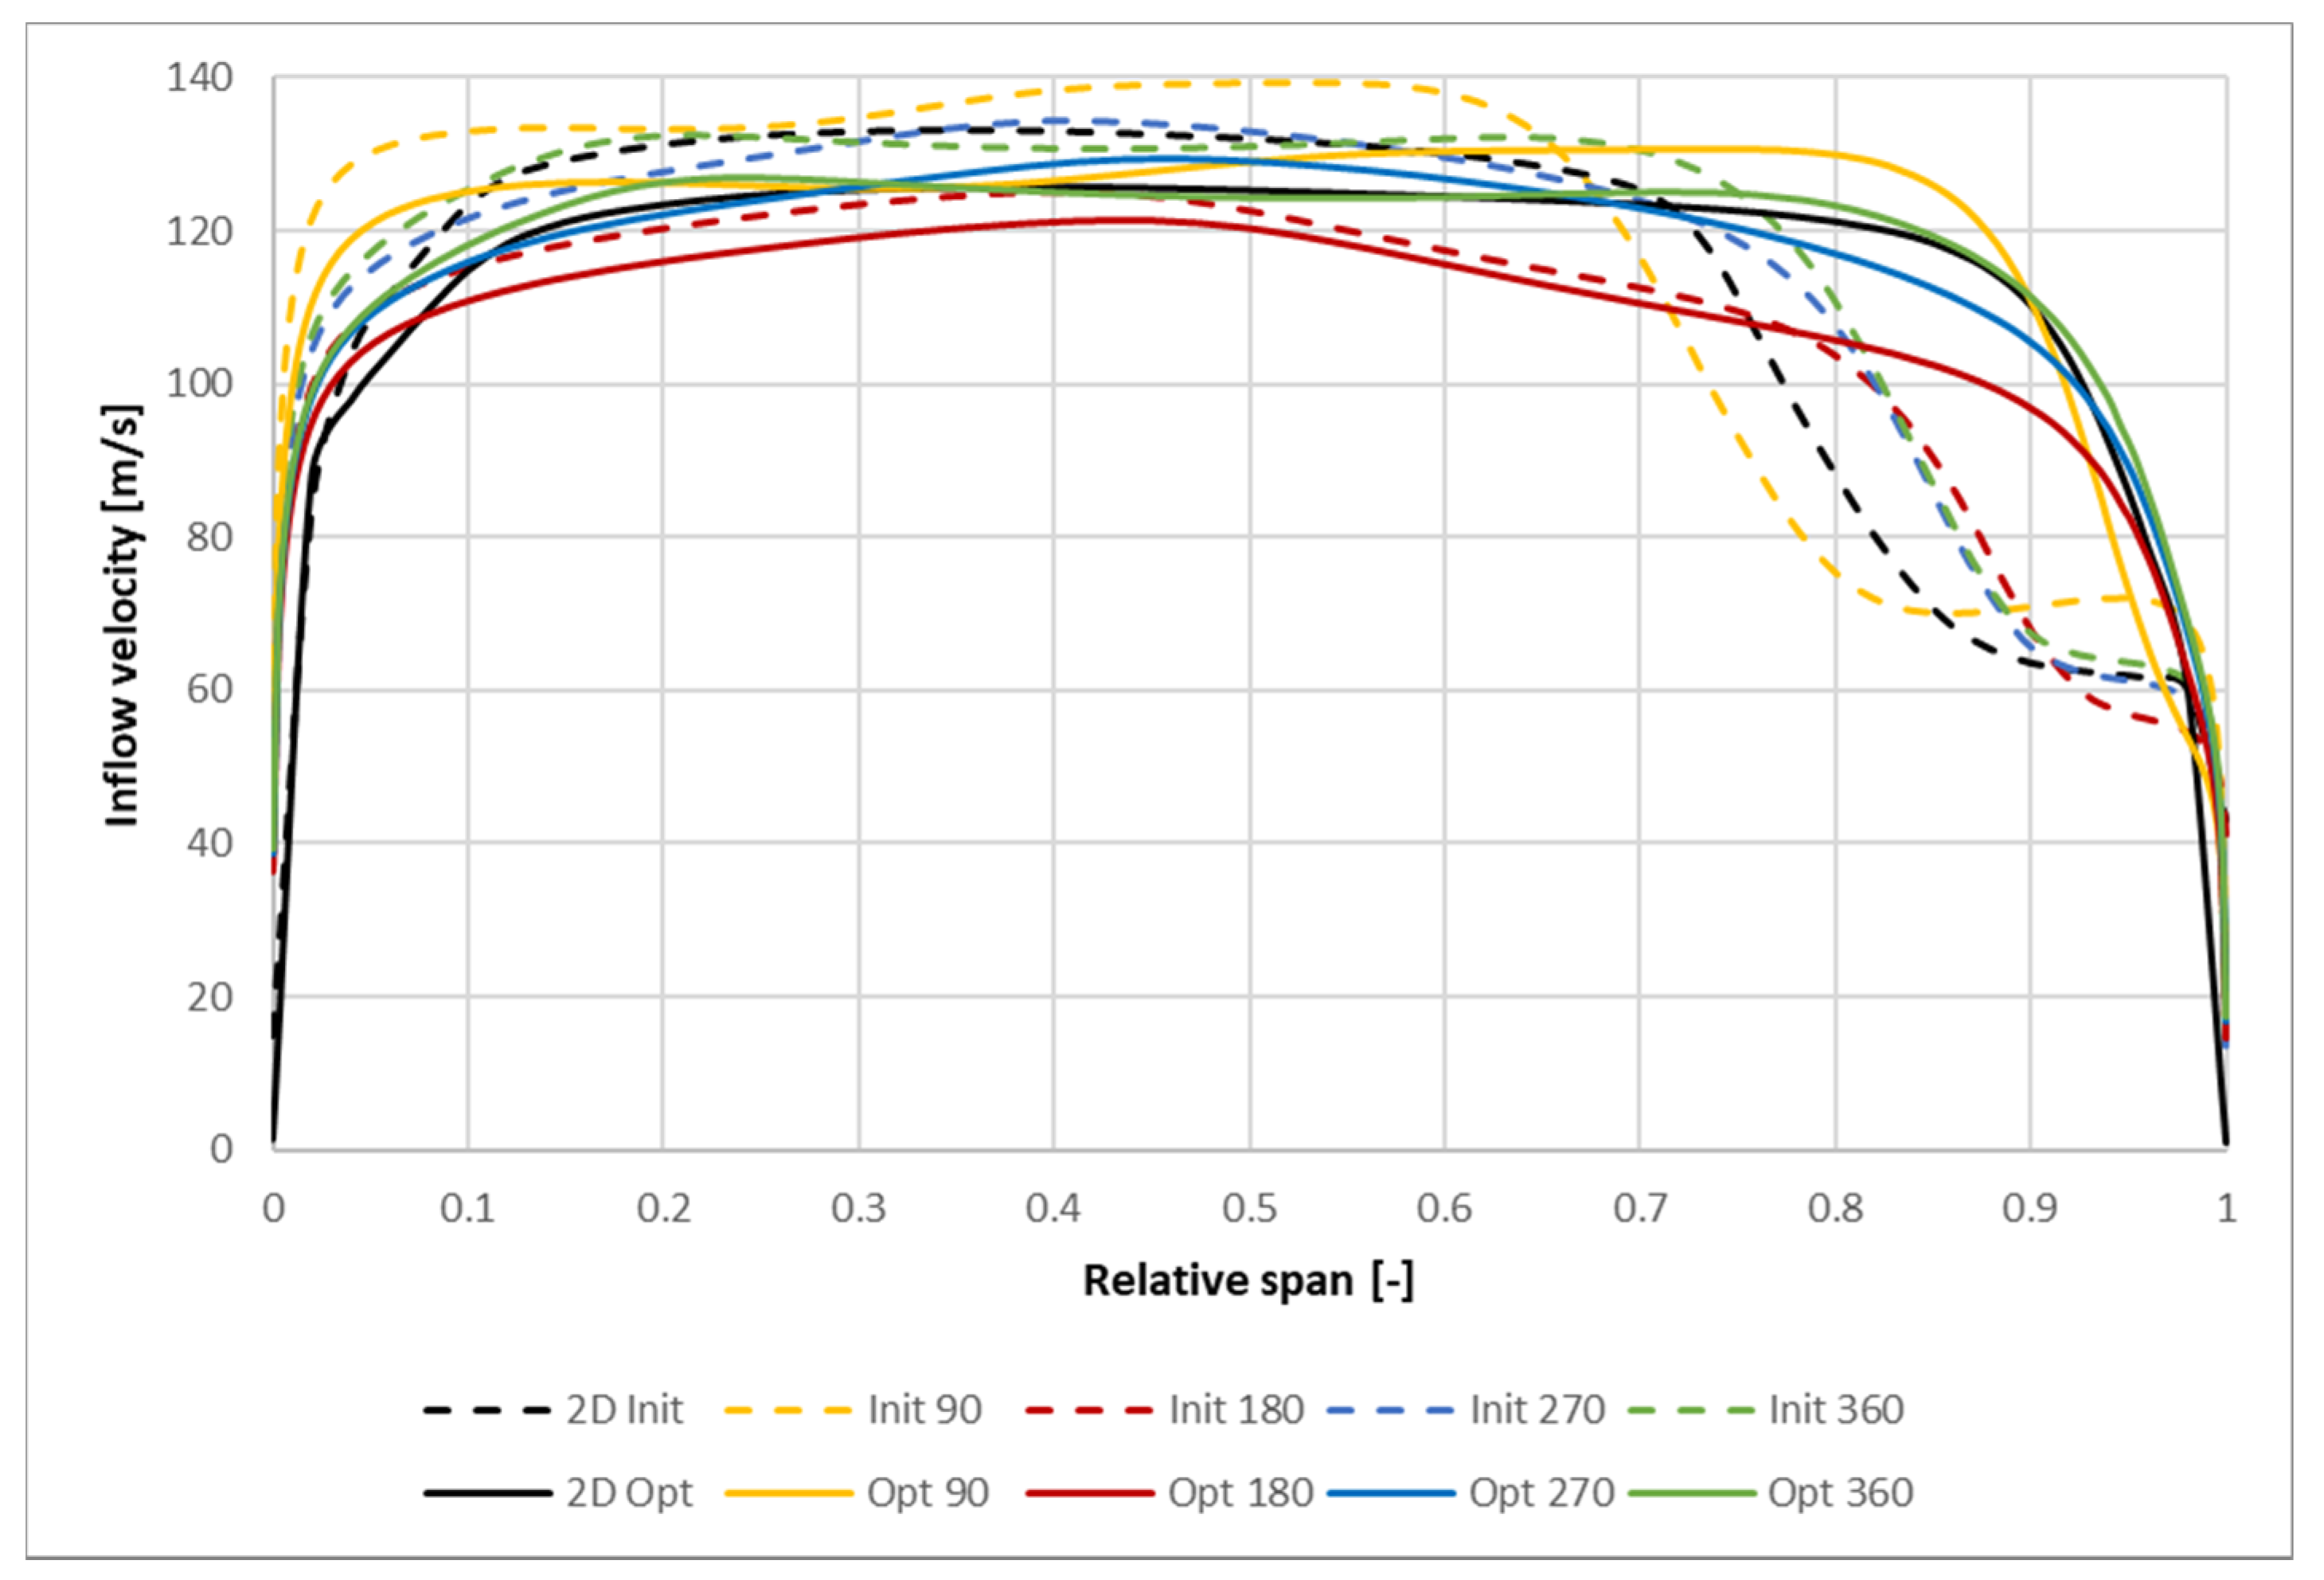
The inflow velocity profiles in the radial direction (across the scroll distributor span) are presented in Figure 13. The optimized geometry (solid lines) ensures a much more uniform velocity distribution than the initial one (dashed lines). A velocity deficit for an initial case is visible near the inner wall of the bend, starting at around 0.75 of the span. It is a result of the separation forming at the bend (Figure 11). The strongest effect of the separation for the initial case is observable at the 90° section, near the scroll tongue. The velocity profile at that section has a different shape from the other profiles and the lowest uniformity across the span. The shape of the velocity profiles for the rest of the locations is similar; however, the velocity magnitude differs slightly between the locations for almost the whole span. The velocity profile for the optimized geometry is much more uniform due to a lack of the flow separation. The section near the tongue again differs from the others, but the difference is not as significant as for the initial design. Other velocity profiles for the optimized case are very similar in the overall shape, and again, differences in the magnitude can be observed, but they are smaller than for the initial case. Thus, the optimization procedure allowed one to increase the spanwise velocity uniformity in the scroll compared to the initial case.
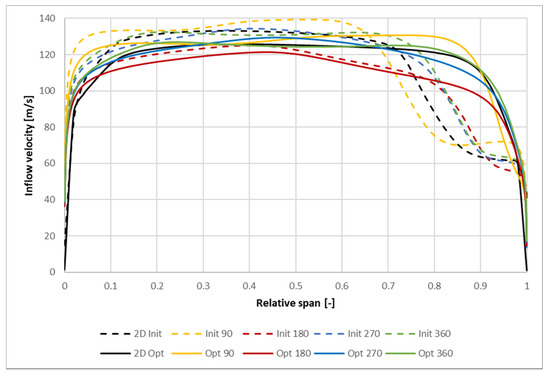
Figure 13.
Spanwise distribution of the inflow velocity for different positions in initial (dashed line) and optimized (solid line) geometries.
Black lines on the chart represent the velocity obtained from 2D simulations. It can be seen that the velocity for the initial case (dashed line) is the most representative of the section near the tongue. One may conclude that the effect of that region on average is strong. The solid line representing the 2D results for the optimized geometry shows a good agreement with the 360° curve for most of the span. The velocity is lower than those from 3D solutions for the lowest values of the span, up to 0.1. This is a hub region, where the optimization did not take place. Therefore, it can be concluded that the method presented in this study allows for obtaining representative solutions with a simplified, two-dimensional geometry.
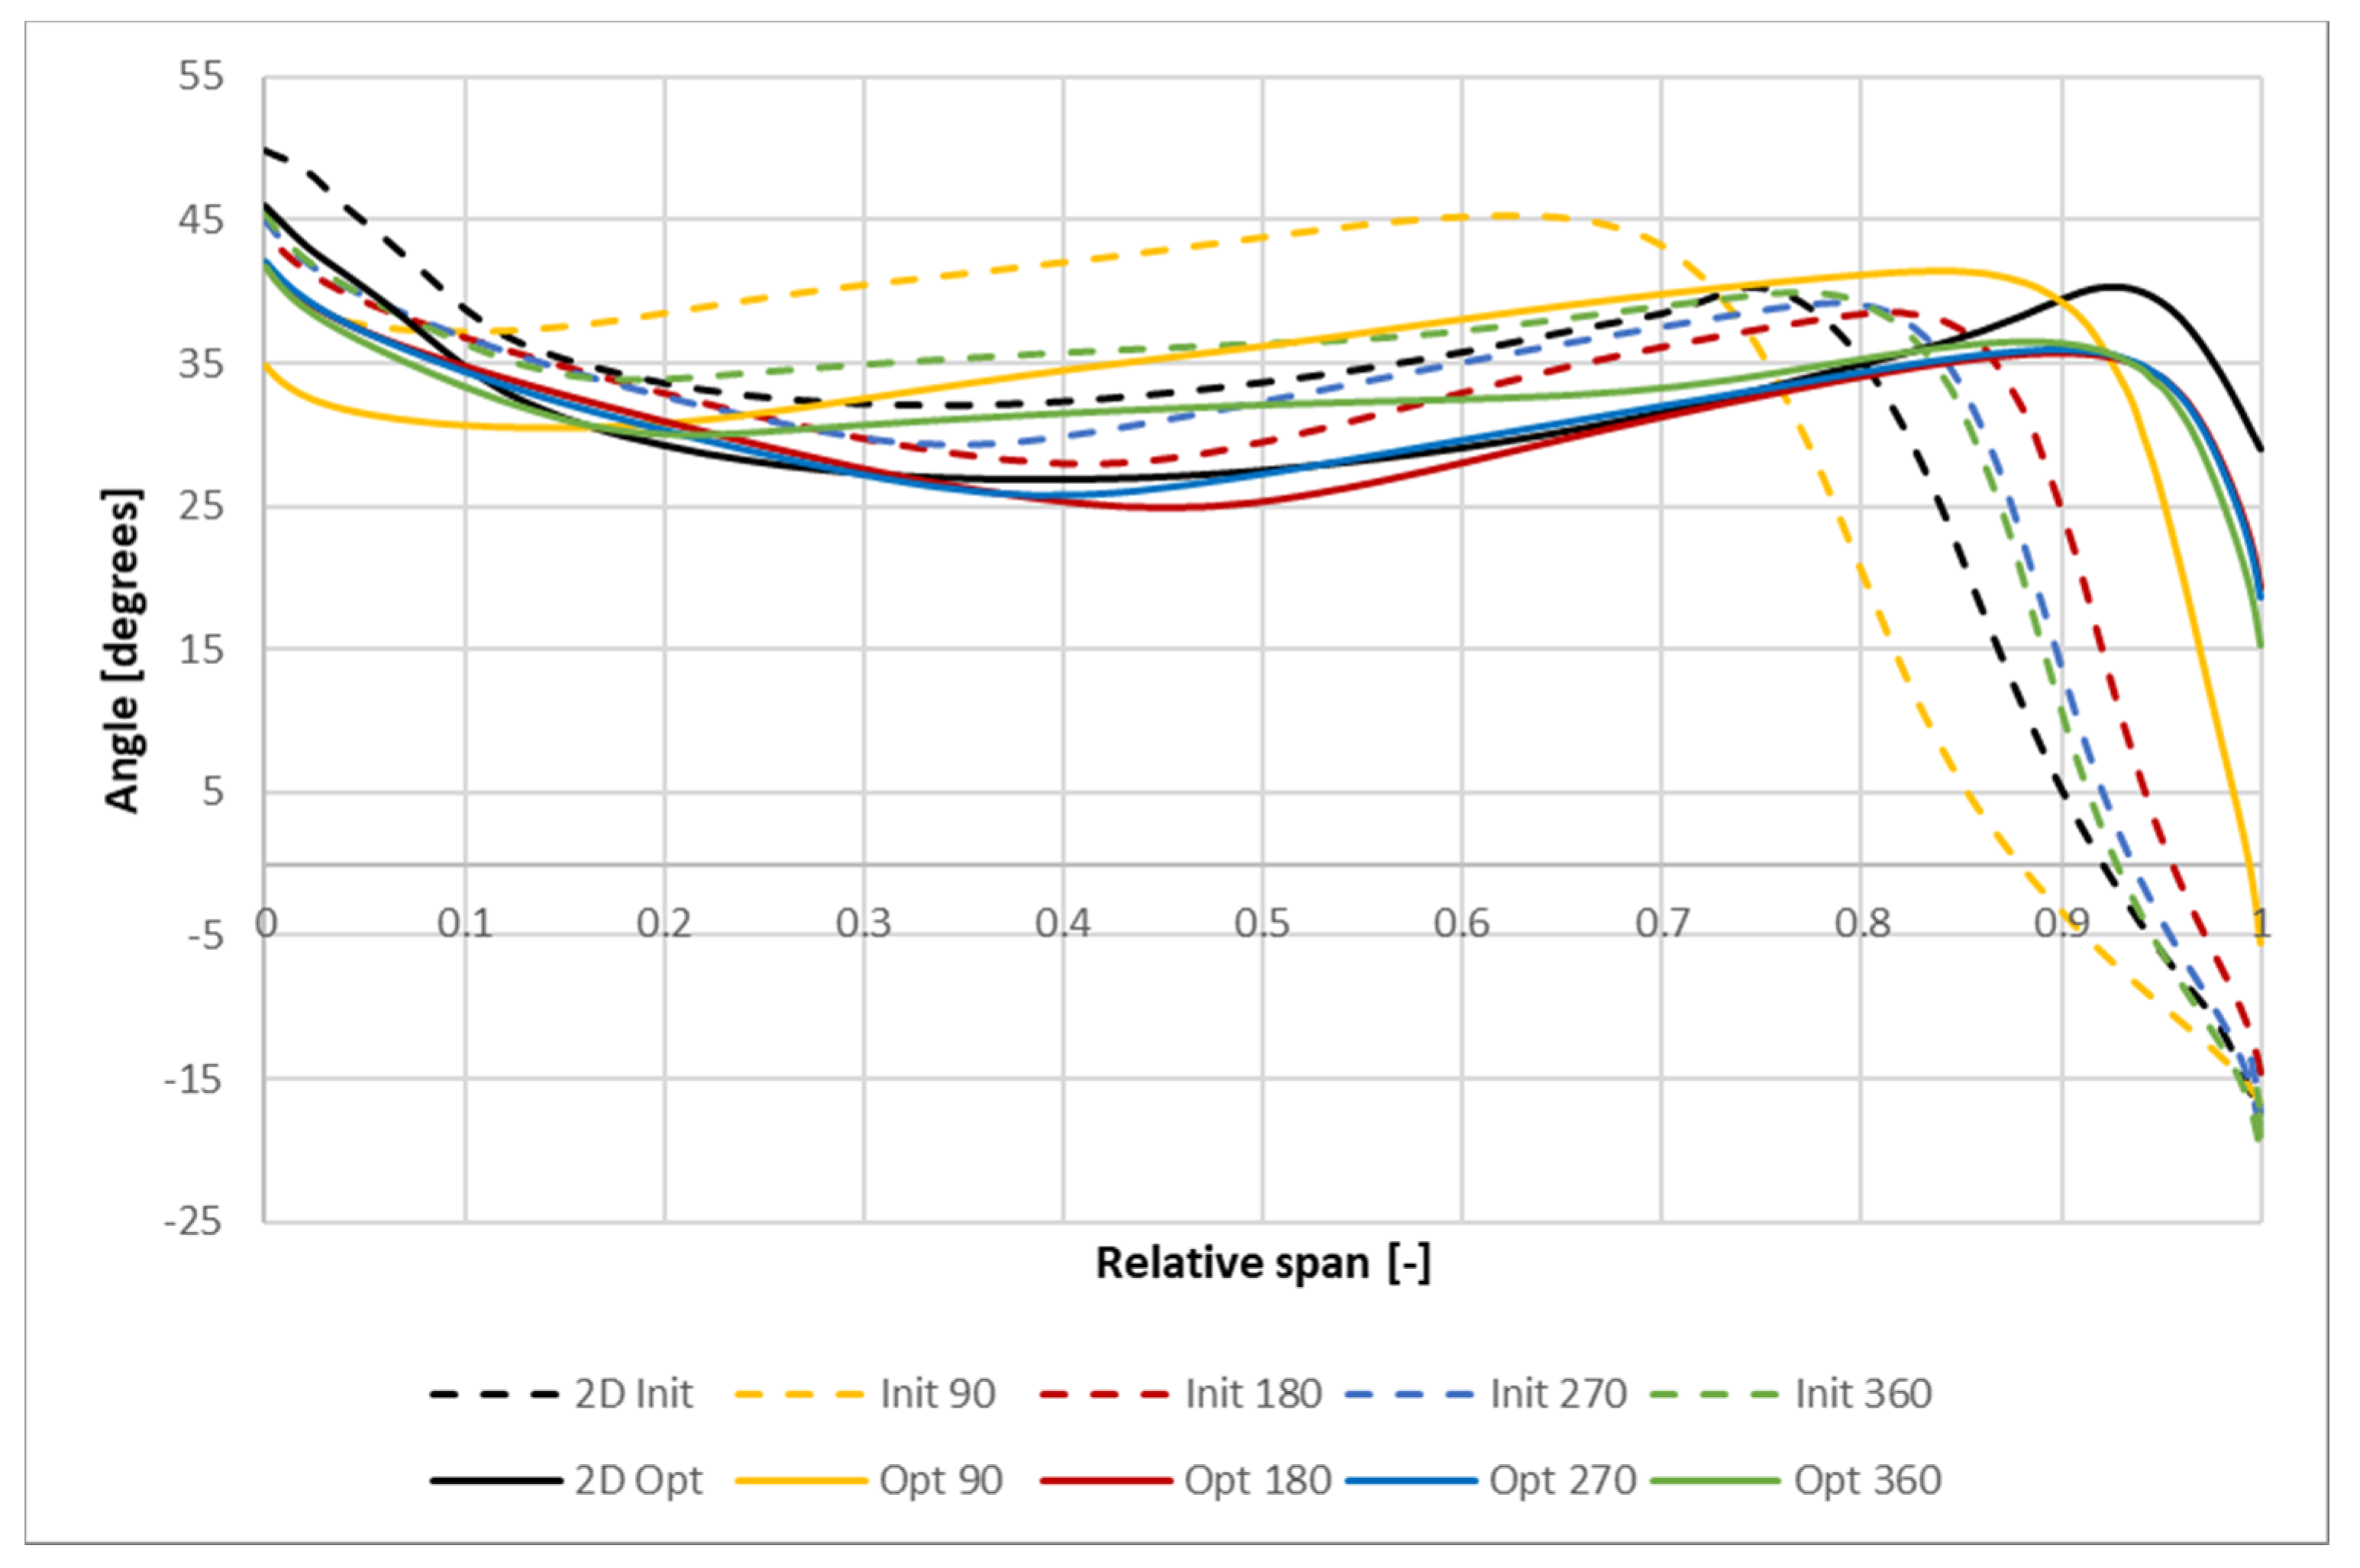
The angle distribution (Figure 14) shows a variation in the inflow angle. Similarly as in the case of the velocity, the most significant differences between initial and optimized cases are visible for the highest span values, where the influence of the bend geometry is the strongest. In the region of flow detachment, the angle values drop, making the upper part of the guide vanes work beyond the design conditions. The strongest effect, as in the case of the inflow velocity, is observed for the 90° section near the scroll tongue. The distributions for the optimized case are much more uniform, with an angle decrease observed for the region closest to the wall, at 0.95 of the span. A difference in the overall curves shape can be seen for different scroll sections, with the one at 90° standing out the most. The signs of separation are visible for the section at 90°, as the inflow angle drops below zero degrees. However, this zone is insignificant compared to the initial case. The shape of the angle distributions for 180°, 270°, and 360° in the optimized case is very similar, with a small discrepancy in the center of the span.
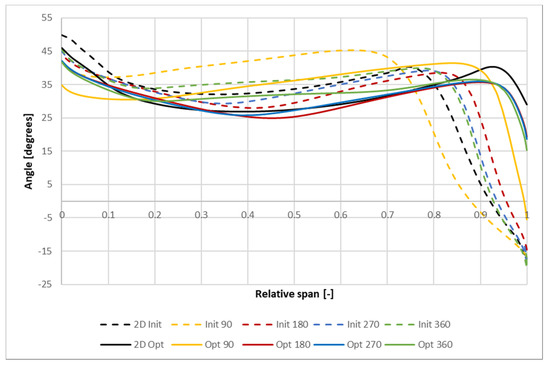
Figure 14.
Spanwise distribution of the flow angle for different positions in initial (dashed line) and optimized (solid line) geometries.
A comparison of the angle distribution to the values obtained from 2D simulations shows high similarities for most of the span. Small differences can be observed for the near-wall regions, from 0 to 0.1 and 0.9 to 1 of the span. The angle distribution for the initial case is less influenced by the section near the tongue (90°) and falls closer to the other curves. The angle distribution follows the one for 270° and is similar to that of 180° for the optimized geometries, as it was the case for the inflow velocity. It can be concluded that the angle distribution from the 2D solution is also representative of the 3D case. Such representativeness for the inflow velocity and inflow angle validated the approach proposed by the authors.
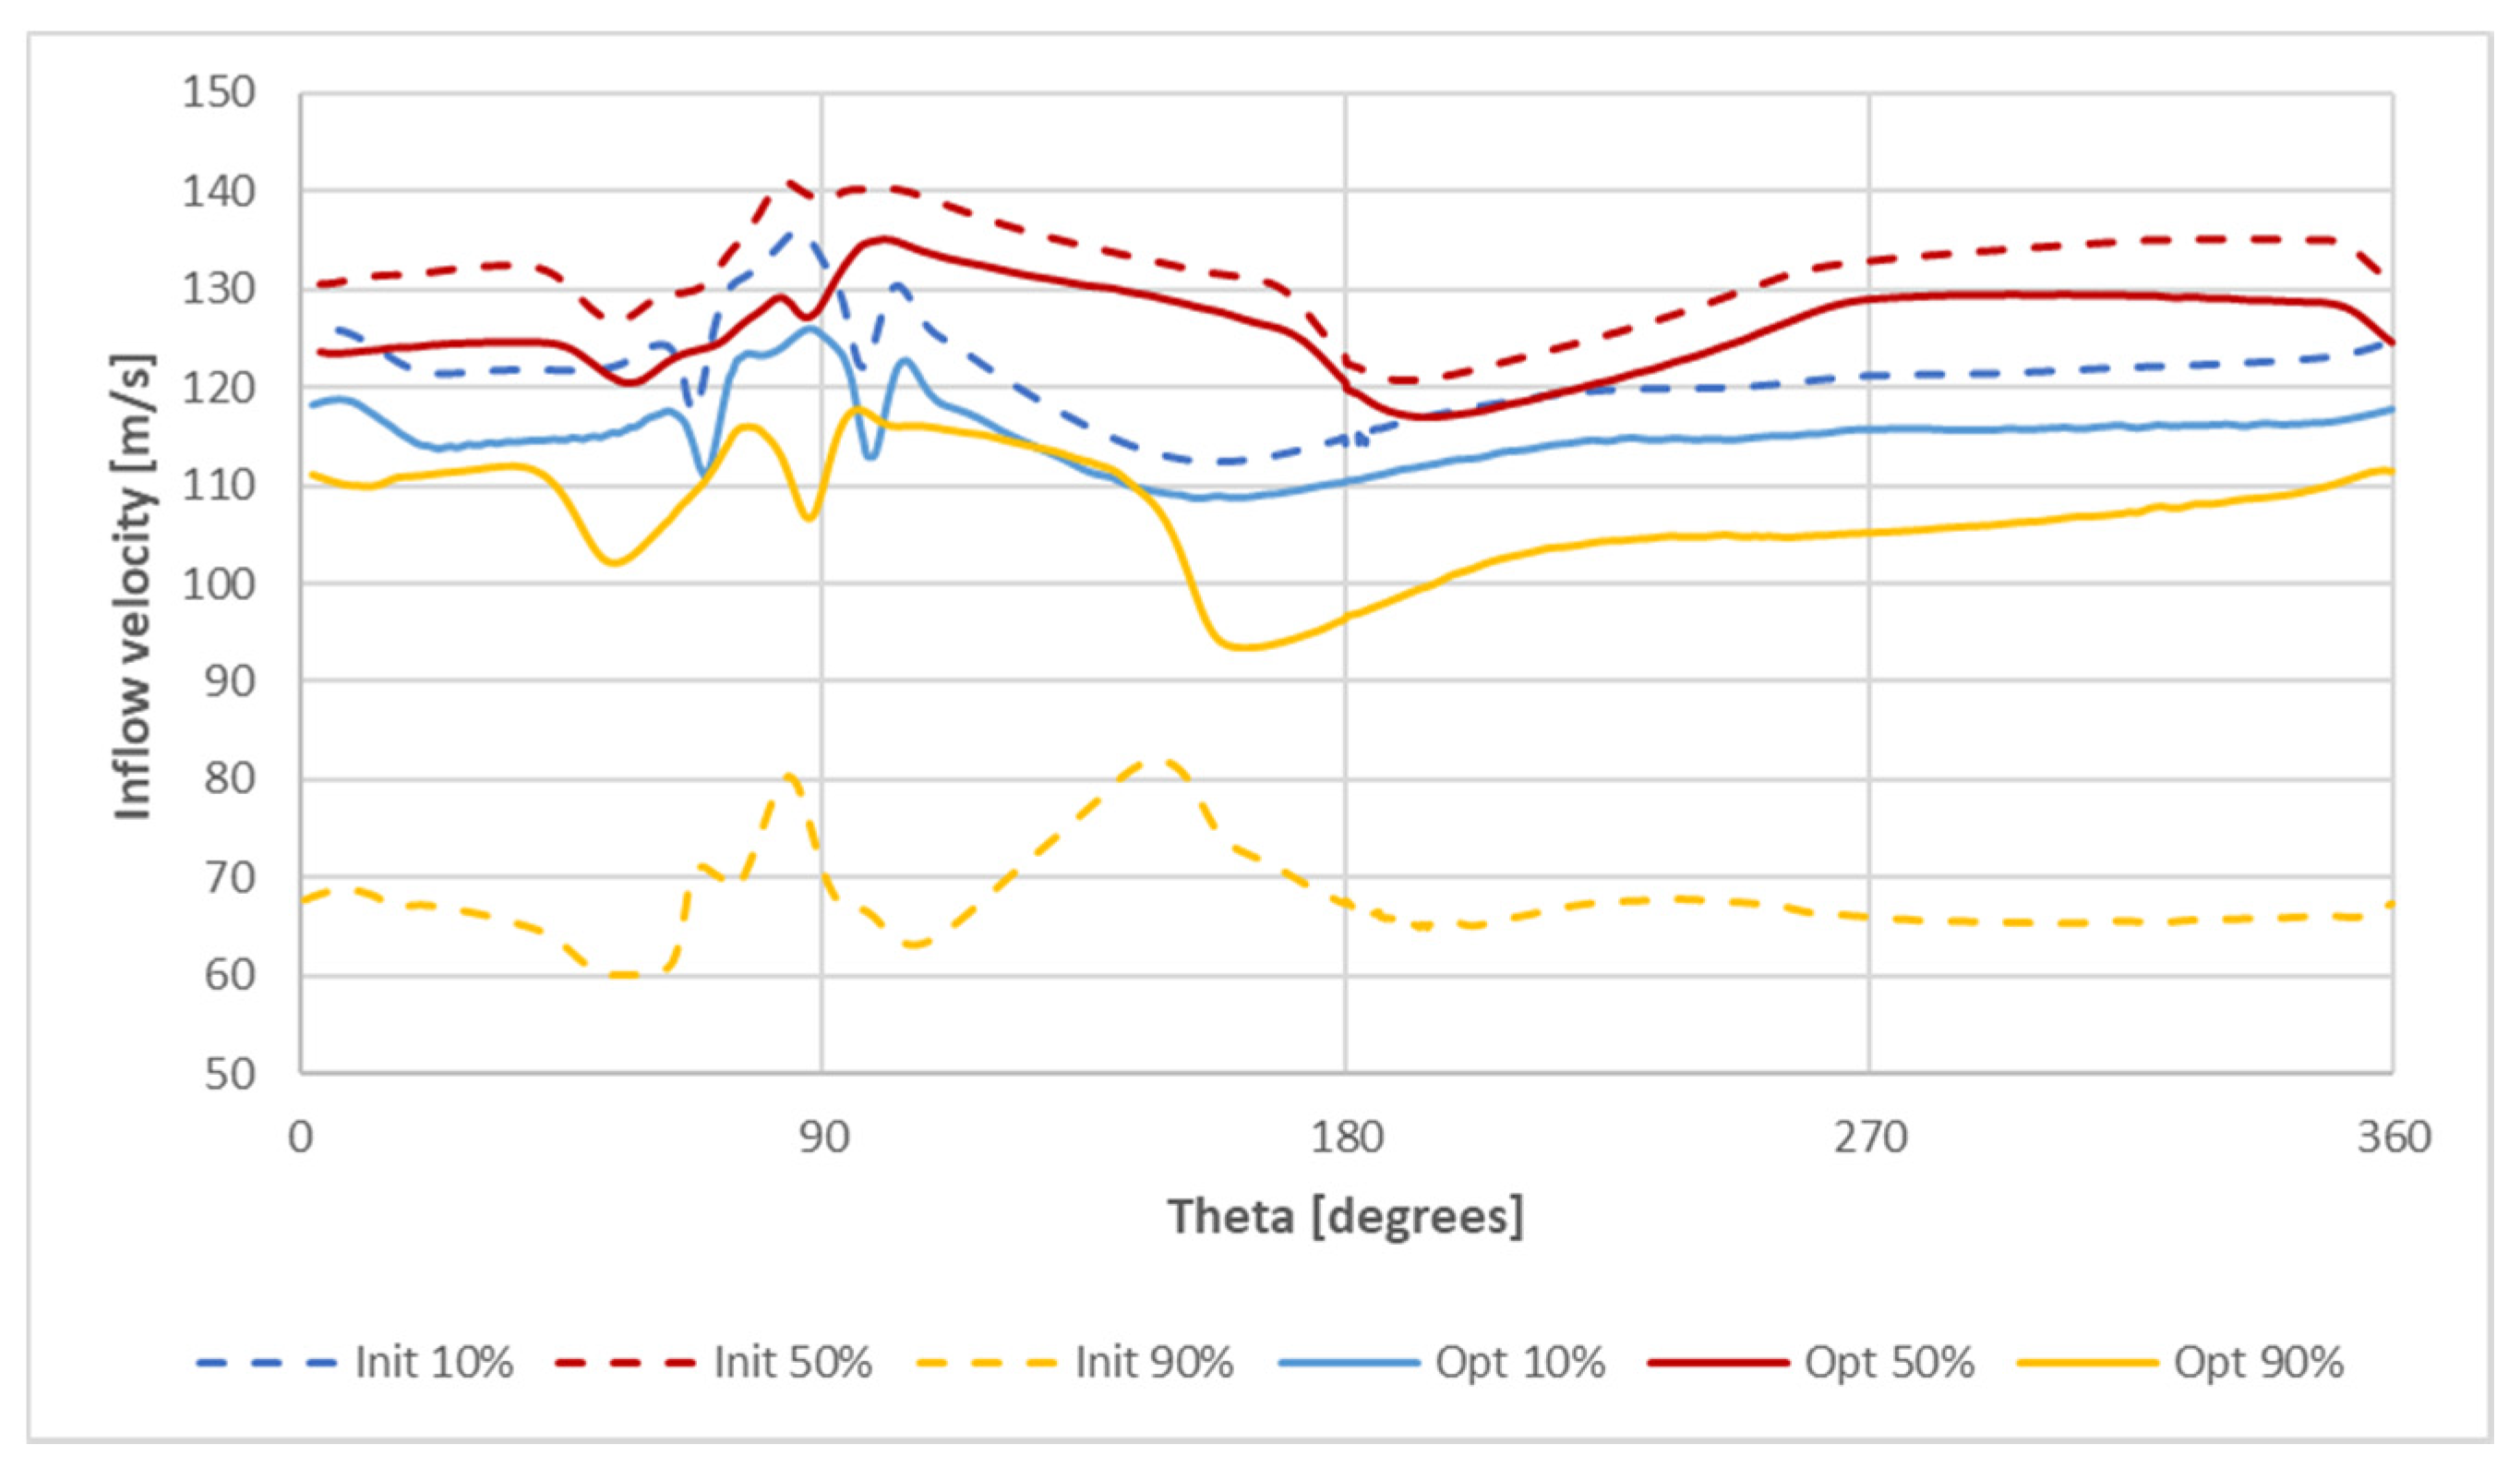
A circumferential distribution of the axial velocity component for initial and optimized geometries is shown in Figure 15 for three spans of 10%, 50%, and 90%. The uniformity of the flow (understood as a peak-to-peak difference of the velocity for the same span) is higher for the optimized geometry. The circumferential variation is also much smaller for the optimized geometry.
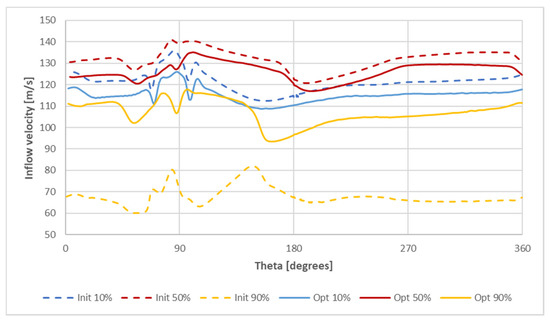
Figure 15.
Circumferential distribution of the axial velocity component for different positions in initial (dashed line) and optimized (solid line) geometries.
A separation zone influence can be seen for the initial case between the location at the inner wall of the bend (0.9 of the span) and the other two locations. Judging by the velocity magnitude, the separation is strongest near the scroll tongue (70°) and weakest around the 180° position. The separation is not observed for the optimized geometry. The most important fluctuations in velocity are visible in the region between 70° and 110° for both the initial and optimized case. This is the region where the flow from the inlet meets the flow coming through the smallest section of the scroll at the tongue. These fluctuations are less significant for the optimized geometry. Overall, the optimization increased the axial velocity component uniformity in the channel; however, it was not possible to obtain a perfect uniformity due to the proximity of the tongue.
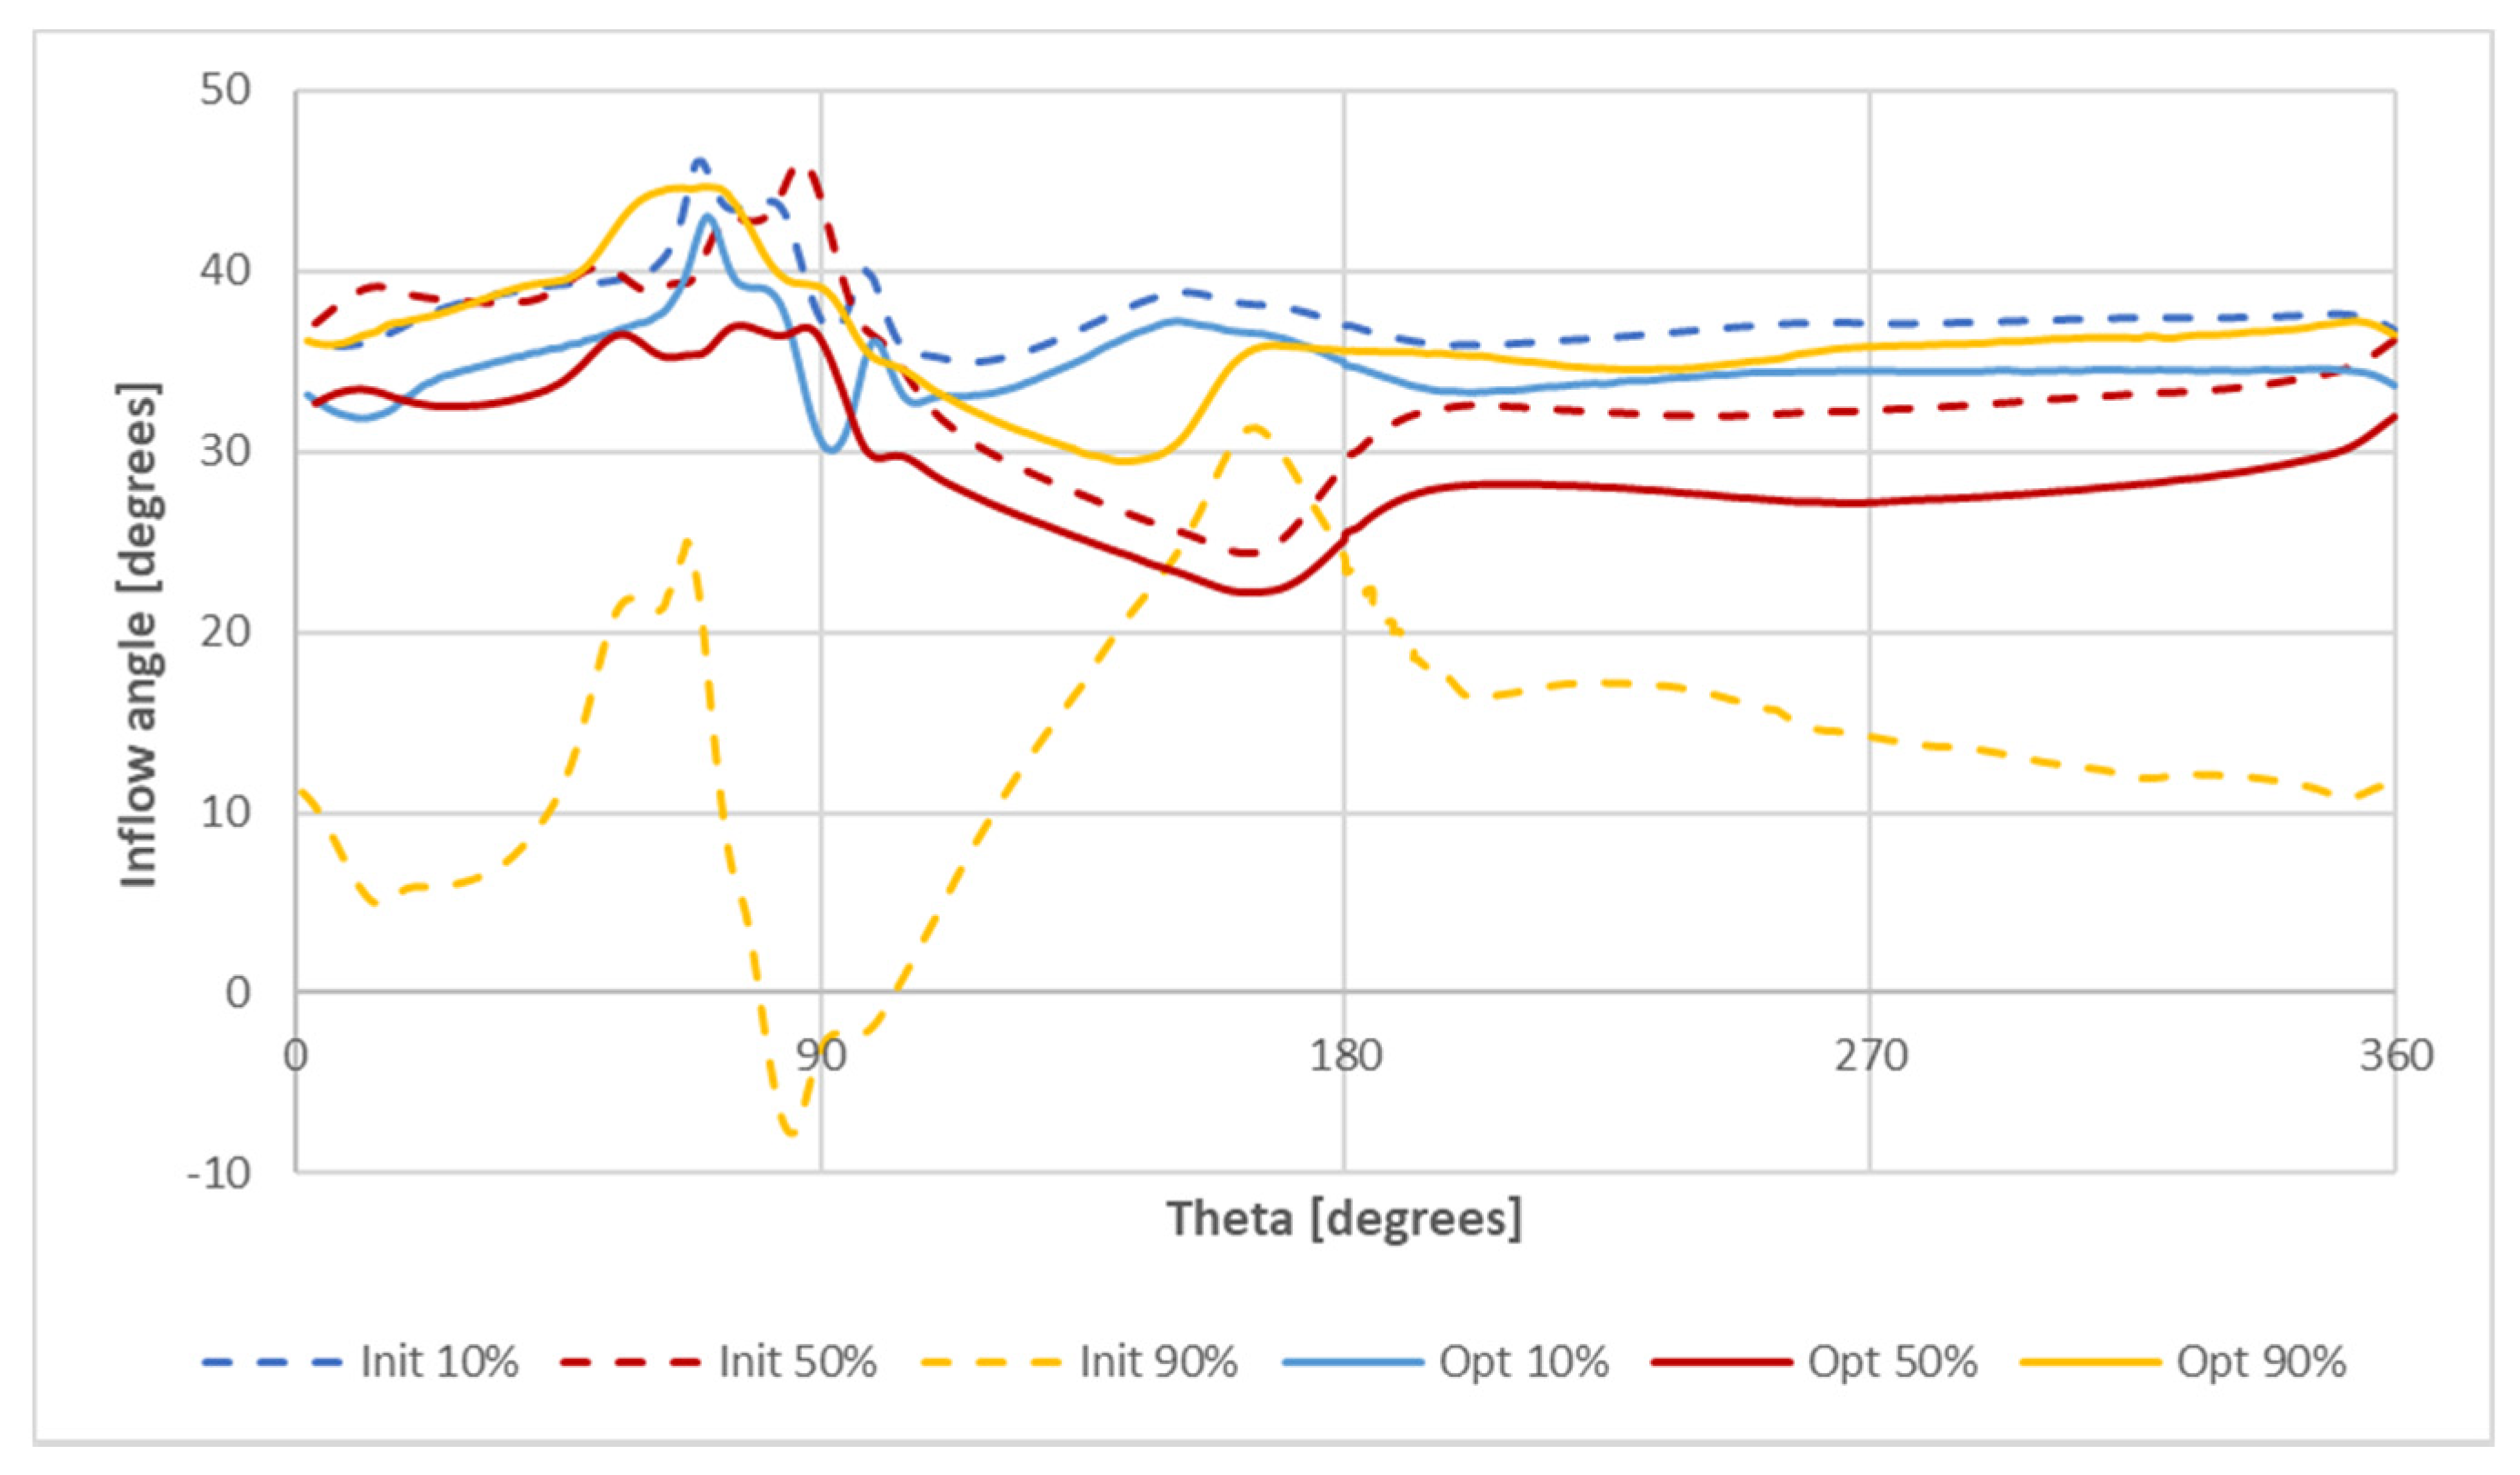
A distribution of the flow angle along the circumference of the scroll for three span positions is shown in Figure 16. The fluctuations in values are similar in character to those in velocity. For the unoptimized case, the location of 90% of the span shows the highest fluctuations of values, ranging from −8° to over 30°. The variability of the angle for the middle section of the channel (50% curve) is slightly more pronounced for the unoptimized case than for the optimized one, which is mainly due to a peak at 90° of theta. The fluctuations of the angle for the 10% location are comparable for both the cases. In all cases, more significant variations are observed near the tongue region. The optimization procedure allowed one to increase the angle uniformity, especially for the region near the shroud (90% of the span) and the center of the channel.
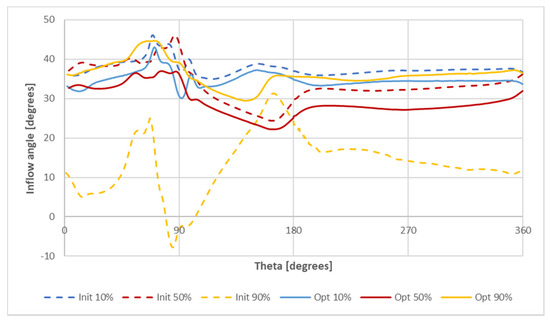
Figure 16.
Circumferential distribution of the flow angle for different positions in initial (dashed line) and optimized (solid line) geometries.
For the purpose of quantitative analysis, scroll efficiency was computed for initial, intermediate, and optimized designs. A local loss coefficient was obtained from Equation (5). Mass flow averaged values of pressures were used. The total pressure difference was divided by a dynamic pressure at the inlet. The values obtained for the cases are shown in Table 5. The relative difference with respect to the initial geometry was computed according to (6).

Table 5.
Flow loss coefficients.
The flow loss coefficient has been improved by around 16% of the initial design. The amelioration obtained due to the second optimization stage (from the intermediate to optimized geometry) is much smaller, slightly over 0.5%. This is mostly due to the fact that the intermediate design obtained through the first stage of the procedure produced already good results. The second stage of the procedure was also important, as the improvement was still possible and the value of 0.5% in some applications may still translate into significant savings in terms of economy. Despite small gains in the second stage of optimization, the authors suggest applying a two-level procedure for the cases where a significant change in the geometry is present, as it can be followed by an increase in the reliability and representativeness of the procedure, without extensive costs.
5. Conclusions
This study presents an efficient optimization strategy for non-axisymmetric flow devices e.g., a scroll distributor or a volute, which can be locally simplified to an axisymmetric problem. The method, based on extracting the axisymmetric part from the case and compensating for the geometrical change with appropriate boundary conditions, can be applied to many devices, such as scrolls or volutes. Taking advantage of the symmetry developed with this method, the computational problem can be downsized to a two-dimensional case. Thus, the time and resources required for a solution can be significantly decreased.
The applicability of the proposed method is evidenced through performing optimization of a scroll distributor. For the procedure, the Response Surface Method coupled with a Genetic Algorithm was used. Downsizing of the computational case resulted in an eight-fold decrease in the computational time for one case and full automation of the meshing and solution procedure, allowing for further time savings. Thanks to this approach, a broad search of the design space is possible in a relatively short time. The optimization procedure allowed us to increase the span-wise flow uniformity. The influence of the optimization on the flow uniformity along the scroll circumference was smaller. It is a drawback of this method, as due to the assumption of axial symmetry, it does not account for circumferential variations. Overall, the application of the procedure allowed us to decrease the flow losses by over 16% compared to the initial design. The proposed approach of downsizing can be coupled with different optimization algorithms but the use of the Response Surface Method with a Genetic Algorithm is recommended, as it provides good results, and the process of obtaining the optimum geometry can be well-controlled.
The proposed method is a valuable tool for the optimization of flow structures, as unlike very popular neural network-based solutions, it ensures transparency of the process. A simplified but bound to physics solution is obtained for every design point, and the quality of the solution can be assessed in every step. This might be an advantage over neural network-based methods, where especially for complicated networks used for multi-dimensional flow problems, the steps between the input and the solution are hidden.
Author Contributions
Conceptualization, D.O. and K.S.; methodology, D.O., K.S., M.S.; investigation, K.S., D.O., M.S.; writing—original draft preparation, D.O., M.S. and K.S. All authors have read and agreed to the published version of the manuscript.
Funding
This research was funded by POWR.03.02.00-00-I042/16-00 of the Polish National Centre for Research and Development.
Institutional Review Board Statement
Not applicable.
Informed Consent Statement
Not applicable.
Data Availability Statement
Not applicable.
Acknowledgments
We would like to thank Malgorzata Jóźwik for her significant linguistic help during the preparation of the manuscript.
Conflicts of Interest
The authors declare no conflict of interest.
References
- Thevenin, D.; Janiga, G. Optimizaion and Computational Fluid Dynamics; Springer Science & Business Media: Berlin/Heidelberg, Germany, 2008; ISBN 9783540721529. [Google Scholar]
- Xu, C.; Müller, M. Development and Design of a Centrifugal Compressor Volute. Int. J. Rotating Mach. 2005, 190–196. [Google Scholar] [CrossRef]
- Pan, D.; Whitfield, A.; Wilson, M. Design considerations for the volutes of centrifugal fans and compressors measured. Proc. Inst. Mech. Eng. 2015, 213, 401–410. [Google Scholar]
- Lu, F.A.; Qi, D.T.; Wang, X.J.; Zhou, Z.; Zhou, H.H. A numerical optimization on the vibroacoustics of a centrifugal fan volute. J. Sound Vib. 2012, 331, 2365–2385. [Google Scholar] [CrossRef]
- Kim, J.H.; Oh, K.T.; Pyun, K.B.; Kim, C.K.; Choi, Y.S.; Yoon, J.Y. Design optimization of a centrifugal pump impeller and volute using computational fluid dynamics. IOP Conf. Ser. Earth Environ. Sci. 2012, 15, 032025. [Google Scholar] [CrossRef]
- Lipian, M.; Kulak, M.; Stepien, M. Fast track integration of computational methods with experiments in smallwind turbine development. Energies 2019, 12, 1625. [Google Scholar] [CrossRef]
- Oka, N.; Furukawa, M.; Yamada, K.; Itou, S.; Ibaraki, S.; Iwakiri, K.; Hayashi, Y. Optimum aerodynamic design of centrifugal compressor impeller using an inverse method based on meridional viscous flow analysis. Proc. ASME Turbo Expo 2017, 2017, 1–10. [Google Scholar]
- Tüchler, S.; Chen, Z.; Copeland, C.D. Multipoint shape optimisation of an automotive radial compressor using a coupled computational fluid dynamics and genetic algorithm approach. Energy 2018, 165, 543–561. [Google Scholar] [CrossRef]
- Olivero, M.; Pasquale, D.; Ghidoni, A.; Rebay, S. Three-dimensional turbulent optimization of vaned diffusers for centrifugal compressors based on metamodel-assisted genetic algorithms. Optim. Eng. 2014, 15, 973–992. [Google Scholar] [CrossRef]
- Baloni, B.D.; Pathak, Y.; Channiwala, S.A. Centrifugal blower volute optimization based on Taguchi method. Comput. Fluids 2015, 112, 72–78. [Google Scholar] [CrossRef]
- Kim, S.; Choi, Y.-S.; Lee, K.-Y.; Yoon, J.-Y. Design Optimization of Centrifugal Pump Impellers in a Fixed Meridional Geometry using DOE. Int. J. Fluid Mach. Syst. 2009, 2, 172–178. [Google Scholar] [CrossRef][Green Version]
- Sun, L.; Zhang, C.L. Evaluation of elliptical finned-tube heat exchanger performance using CFD and response surface methodology. Int. J. Therm. Sci. 2014, 75, 45–53. [Google Scholar] [CrossRef]
- Lian, Y.; Liou, M.S. Multiobjective optimization using coupled response surface model and evolutionary algorithm. AIAA J. 2005, 43, 1316–1325. [Google Scholar] [CrossRef]
- Samad, A.; Kim, K.Y. Shape optimization of an axial compressor blade by multi-objective genetic algorithm. Proc. Inst. Mech. Eng. Part A J. Power Energy 2008, 222, 599–611. [Google Scholar] [CrossRef]
- Hartwig, L.; Bestle, D. Compressor blade design for stationary gas turbines using dimension reduced surrogate modeling. In Proceedings of the 2017 IEEE Congress on Evolutionary Computation (CEC), San Sebastian, Spain, 5–8 June 2017; pp. 1595–1602. [Google Scholar] [CrossRef]
- Meng, D.; Yang, S.; Zhang, Y.; Zhu, S.P. Structural reliability analysis and uncertainties-based collaborative design and optimization of turbine blades using surrogate model. Fatigue Fract. Eng. Mater. Struct. 2019, 42, 1219–1227. [Google Scholar] [CrossRef]
- Verstraete, T.; Alsalihi, Z.; Van den Braembussche, R.A. Multidisciplinary Optimization of a Radial Compressor for Microgas Turbine Applications. J. Turbomach. 2010, 132, 031004. [Google Scholar] [CrossRef]
- Stajuda, M.; Obidowski, D.; Karczewski, M.; Józwik, K. Modified virtual blade method for propeller modelling. Mech. Mech. Eng. 2018, 22, 603–617. [Google Scholar] [CrossRef]
- Lipian, M.; Karczewski, M.; Jozwik, K. Analysis and comparison of numerical methods for design and development of small Diffuser-Augmented Wind Turbine (DAWT). In Proceedings of the IECON 2016—42nd Annual Conference of the IEEE Industrial Electronics Society, Florence, Italy, 23–26 October 2016; pp. 5525–5531. [Google Scholar] [CrossRef]
- Liu, Z.; Zhao, Q.; Xiang, X.; Zhao, W.; Zhou, X. A hybrid viscous body force model for low-speed centrifugal compressors. Proc. Inst. Mech. Eng. Part A J. Power Energy 2020, 1–16. [Google Scholar] [CrossRef]
- Neverov, V.V.; Kozhukhov, Y.V.; Yablokov, A.M.; Lebedev, A.A. Optimization of a centrifugal compressor impeller using CFD: The choice of simulation model parameters. In Proceedings of the IOP Conference Series: Materials Science and Engineering, London, UK, 11–13 September 2017; Volume 232. [Google Scholar] [CrossRef]
- Jóźwik, K.; Papierski, A.; Sobczak, K.; Obidowski, D.; Kryłłowicz, W.; Marciniak, E.; Wróbel, G.; Marciniak, A.; Wróblewski, P.; Kobierska, A.; et al. Radial fan controlled with impeller movable blades—CFD investigations. Trans. Inst. Fluid-Flow Mach. 2016, 131, 17–40. [Google Scholar]
- Japikse, D. Centrifugal Compressor Design and Performance; Concepts ETI: White River Junction, VT, USA, 1996; ISBN 9780933283039. [Google Scholar]
- Ansys Inc. ANSYS CFX-Solver Theory Guide 19.2; Ansys Inc.: Canonsburg, PA, USA, 2009. [Google Scholar]
- Menter, F.R.; Kuntz, M.; Langtry, R. Ten Years of Industrial Experience with the SST Turbulence Model. Turbul. Heat Mass Transf. 2003, 1, 625–632. [Google Scholar] [CrossRef]
- Sobczak, K.; Obidowski, D.; Reorowicz, P.; Marchewka, E. Numerical investigations of the savonius turbine with deformable blades. Energies 2020, 13, 3717. [Google Scholar] [CrossRef]
- Obidowski, D.; Reorowicz, P.; Witkowski, D.; Sobczak, K.; Jóźwik, K. Methods for determination of stagnation in pneumatic ventricular assist devices. Int. J. Artif. Organs 2018, 41, 653–663. [Google Scholar] [CrossRef] [PubMed]
- Stajuda, M.; Karczewski, M.; Obidowski, D.; Jóźwik, K. Development of a CFD model for propeller simulation. Mech. Mech. Eng. 2016, 20, 579–593. [Google Scholar]
- Celik, I.B.; Ghia, U.; Roache, P.J.; Freitas, C.J.; Coleman, H.; Raad, P.E. Procedure for estimation and reporting of uncertainty due to discretization in CFD applications. J. Fluids Eng. Trans. ASME 2008, 130, 0780011–0780014. [Google Scholar] [CrossRef]
- Deb, K.; Pratap, A.; Agarwal, S.; Meyarivan, T. A fast and elitist multiobjective genetic algorithm: NSGA-II. IEEE Trans. Evol. Comput. 2002, 6, 182–197. [Google Scholar] [CrossRef]
Publisher’s Note: MDPI stays neutral with regard to jurisdictional claims in published maps and institutional affiliations. |
© 2021 by the authors. Licensee MDPI, Basel, Switzerland. This article is an open access article distributed under the terms and conditions of the Creative Commons Attribution (CC BY) license (http://creativecommons.org/licenses/by/4.0/).

